Article

Study on the Influence of Fresh Air System of Range Hood on Kitchen Air Quality

1
Faculty of Maritime and Transportation, Ningbo University, Ningbo 315000, China
2
Fotile Group Ningbo Fotile Kitchenware Co., Ltd., Ningbo 315336, China
*
Author to whom correspondence should be addressed.
Atmosphere 2022, 13(6), 920; https://doi.org/10.3390/atmos13060920
Submission received: 23 April 2022 / Revised: 1 June 2022 / Accepted: 2 June 2022 / Published: 6 June 2022

Abstract

:
In this paper, a combination of simulation and testing is used to quantitatively analyze the influence of a fresh air system of indoor range hood on kitchen air quality. The evaluation criteria of kitchen air quality are established based on the air age and air exchange efficiency. The results show that, when the fresh air system is switched to on from off, the indoor mean air age is reduced to 94.7 s from 468.6 s, and the air exchange efficiency is improved to 82.4% from 16.7%. The air quality is upgraded to fresh from moderate pollution. The presented simulation analysis process can provide a guideline for in-depth study of the kitchen air quality and quantitatively assess the kitchen fresh air system.

1. Introduction

1.1. Research Background

According to recent studies, people nowadays spend most of their lifetime indoors. Undoubtedly, the indoor air quality is one of the key factors that influence the quality of the indoor environment, as well as human health [1]. Fresh kitchen air quality is an important part of a healthy and comfortable indoor environment. With the improvement of living standard, more and more families have begun to use range hoods. The range hood can absorb most of the pollutants from the source. However, the study showed that the practical capture efficiency of a wall-mounted range hood was generally less than 75% [2], which means that the range hood cannot discharge all the particulate matter effectively, resulting in a limited pollution discharge capacity. Some on-site studies demonstrated that even with the range hood turned on during the cooking process, the PM2.5 concentration in a kitchen can be increased to over 500 μg/m3 if the ventilation system is poorly designed [2]. Some range hoods of the specific model will only recirculate the pollutant particles indoors but would not be able to exhaust the particles outside [3]. Furthermore, the indicated nominal air flows of the exhaust devices often fail to be reached [4]. Chinese kitchen environment is usually hot and humid in summer and cold in winter, where people spend considerable time there. Related research confirms that the fresh air system can effectively improve the kitchen air quality [3,5,6,7]. In order to improve people’s quality of life, it is necessary to develop and analyze the kitchen fresh air system. How to determine the influence of the fresh air system on the kitchen environment has become one of the key problems to evaluate the kitchen air quality.
Many studies have been carried out on the air quality in kitchens. For instance, Zhang et al. used an experimental method to study the propagation law of soot particles in residential kitchens with the increase of outdoor air intake speed and its influence on indoor air environment [8]. Suriano et al. used a low-cost air monitor to evaluate the kitchen air quality, but the analysis process is rather complicated, and is interfered by the number of samples and the sampling time, making it not possible to effectively judge the kitchen air quality [9]. Zhou et al. used the air curtain to enhance the smoke control effect of the range hood and reduce the concentration of pollutants to improve the air quality in the kitchen [10]. Nina et al. used exhaust fans to reduce the concentration of pollutants for the improvement of the kitchen air quality [11]. In both Zhou et al. and Nina et al.’s works, however, it is difficult to evaluate the exact impact of the equipment on the air quality. Peng et al. proposed a comprehensive index method and corresponding evaluation formulation to evaluate indoor air quality. However, the method was developed based on some assumptions and thus has some limitations [12].
The use of air age to assess the quality of indoor air is a relatively new method. Díaz-Calderón et al. used air age to evaluate the indoor air quality of natural cross-ventilation buildings [13]. Their results showed that it was reasonable to use air age theory to evaluate the indoor air quality. Debnath et al. obtained lower indoor air age by improving kitchen building parameters in rural area of India [14], but their work lacked specific quantitative analysis of indoor air quality. Zhang et al. used CFD method to simulate three different ventilation conditions, and numerically studied the air flow field and air age distribution of public toilets under three different conditions, but the calculation results were not verified by specific experiments [15].
The above studies mainly focus on the indoor oil fume concentration or air age distribution. There are few studies on the specific environment of kitchen, and there is also a lack of effective means for quantitative evaluation of indoor air quality in kitchen.
Based on the analysis results of the CFD flow field, Wang et al. [16] proposed the air age transport equation and ventilation efficiency, analyzed the kitchen air quality under the action of fresh air system of range hood, and examined the impact of air curtain range hoods on the kitchen environment.

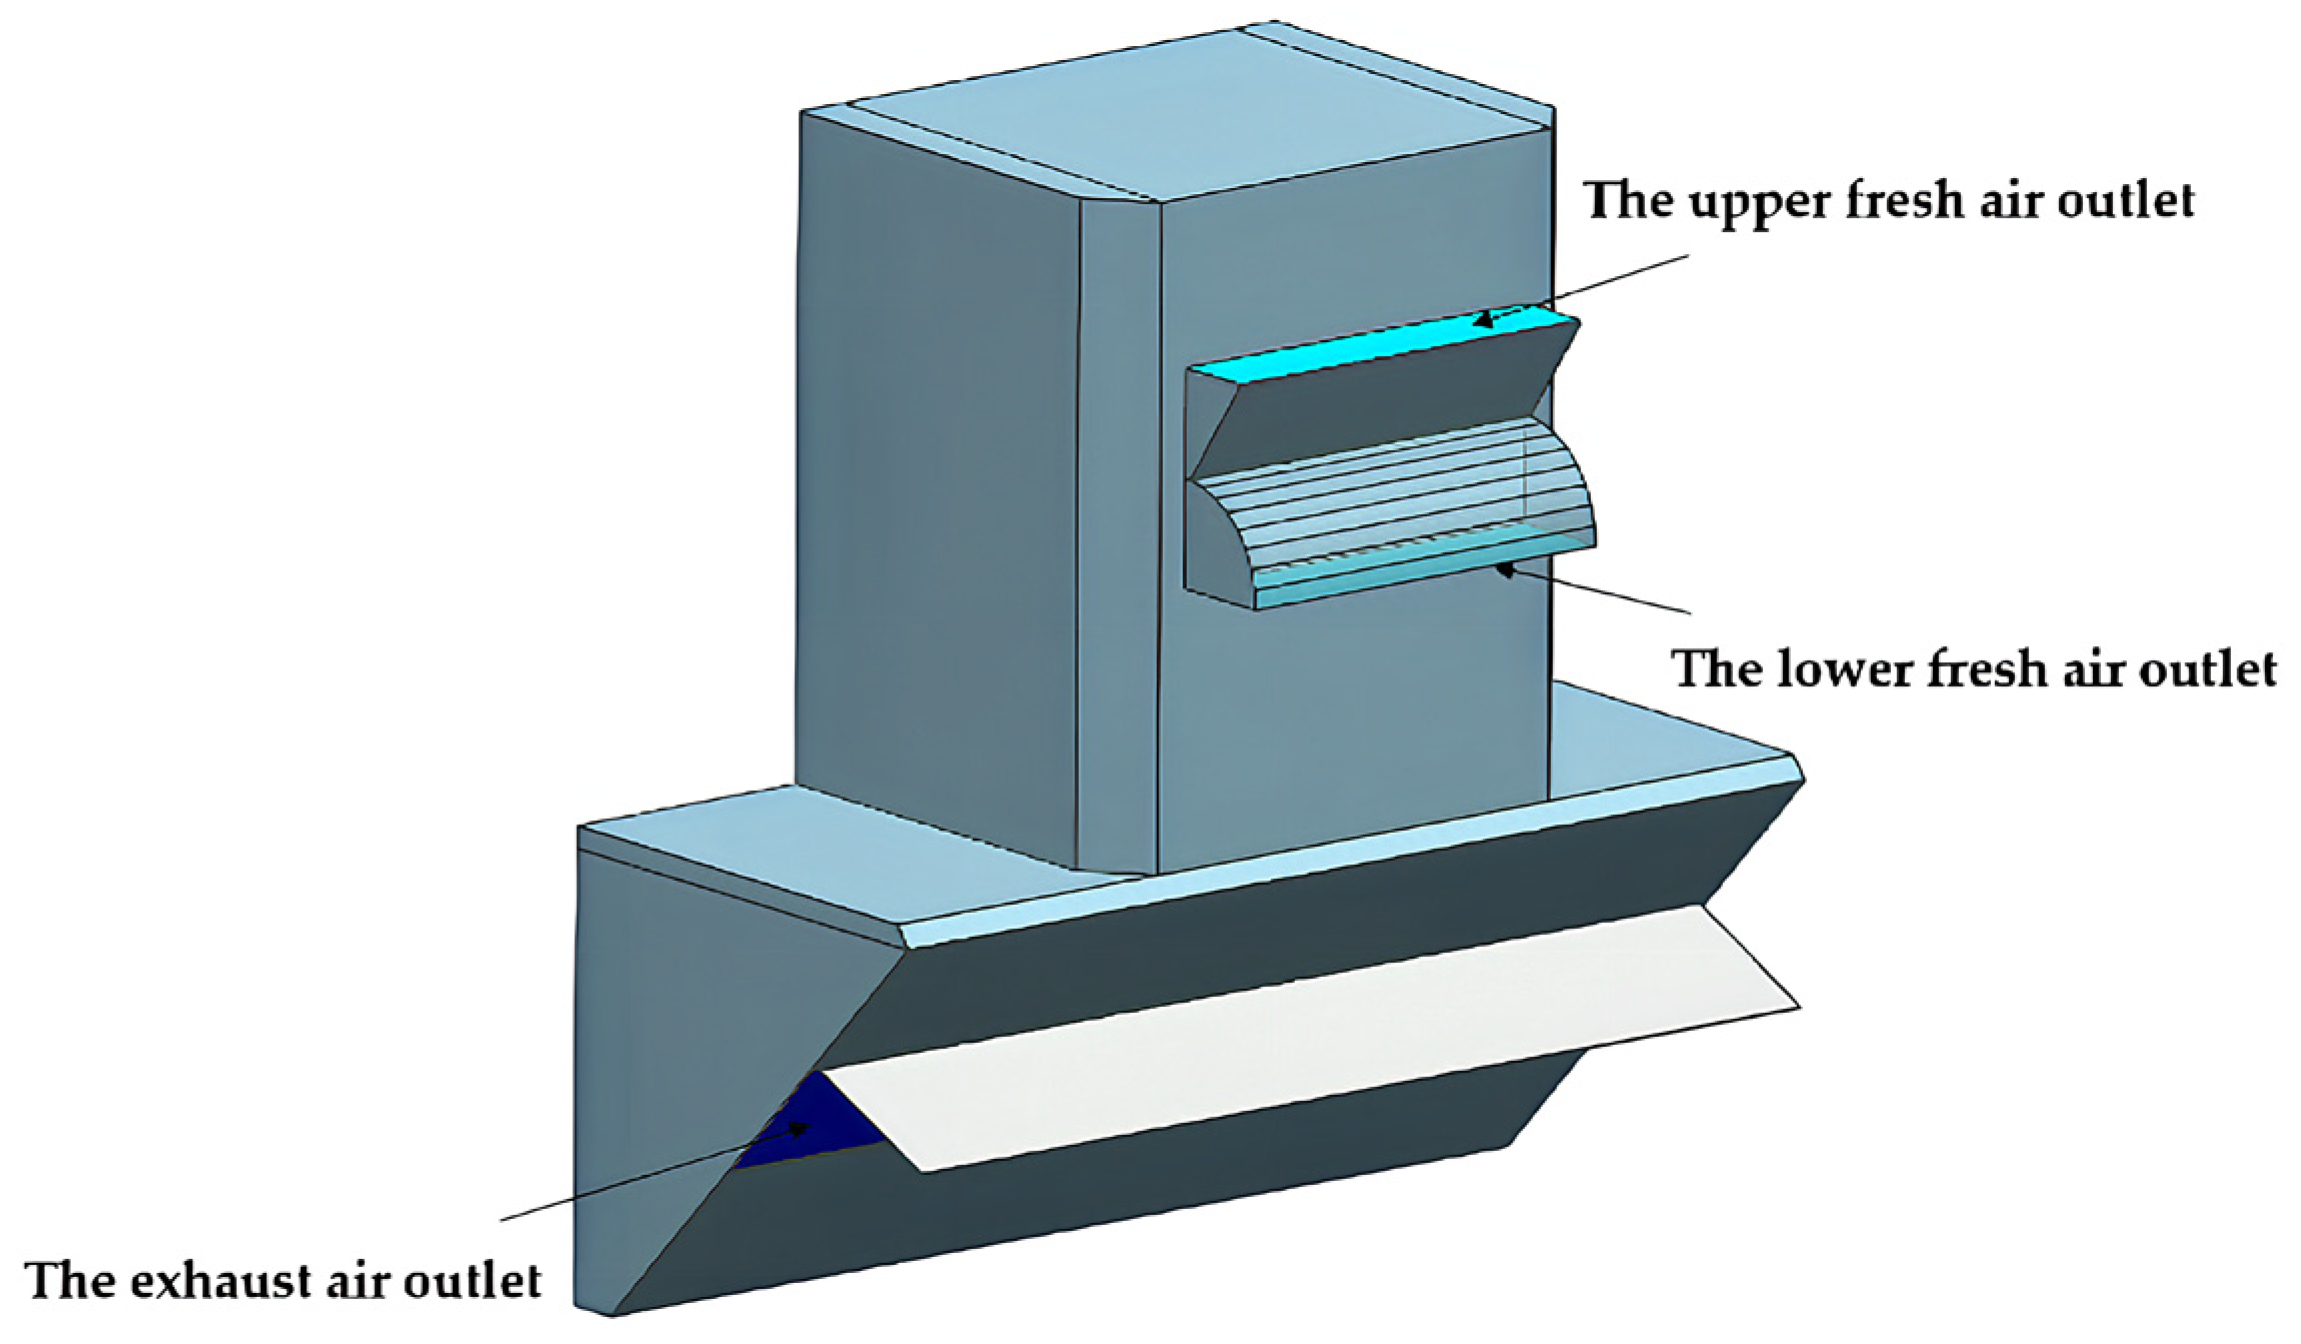
1.2. Fresh Air System for Cooker Hoods

Up to now, the task of the range hood is not limited to removing indoor oil smoke, but is developing towards a higher level of creating an indoor comfortable environment, improving indoor air quality and saving energy.
The fresh air system for range hoods presented in this paper refers to a pair of upper and lower fresh air outlets located above the smoke baffle, as shown in Figure 1. A pipe is laid on the flue system of the range hood to draw fresh air from outside. Because the fresh air of the upper and lower fresh air outlets comes from the same pipeline, the upper and lower fresh air outlets are opened or closed simultaneously. The main purpose of the two fresh air outlets is to replace the ventilation and cool the upper indoor environment [17]. The low-speed air supply at the lower fresh air outlet is mainly used for displacement ventilation. The fresh air is directly sent into the working area, thus effectively improving the air quality in the working area. It also plays a role in supplementing air to the exhaust air outlet, preventing the oil smoke from overflowing at the exhaust air outlet. The upper fresh air outlet can not only cool the upper indoor environment, but also avoid the phenomenon of temperature stratification with large gradient in the kitchen space [17]. If only the lower fresh air outlet is used for air supply, mixed air flow area will be formed in the upper part of the kitchen, resulting in poor air flow [18,19], making the kitchen staff feel uncomfortable because of the sudden changes in surrounding temperature and fume concentration.

2. Calculation Model for the Internal Environment of the Kitchen

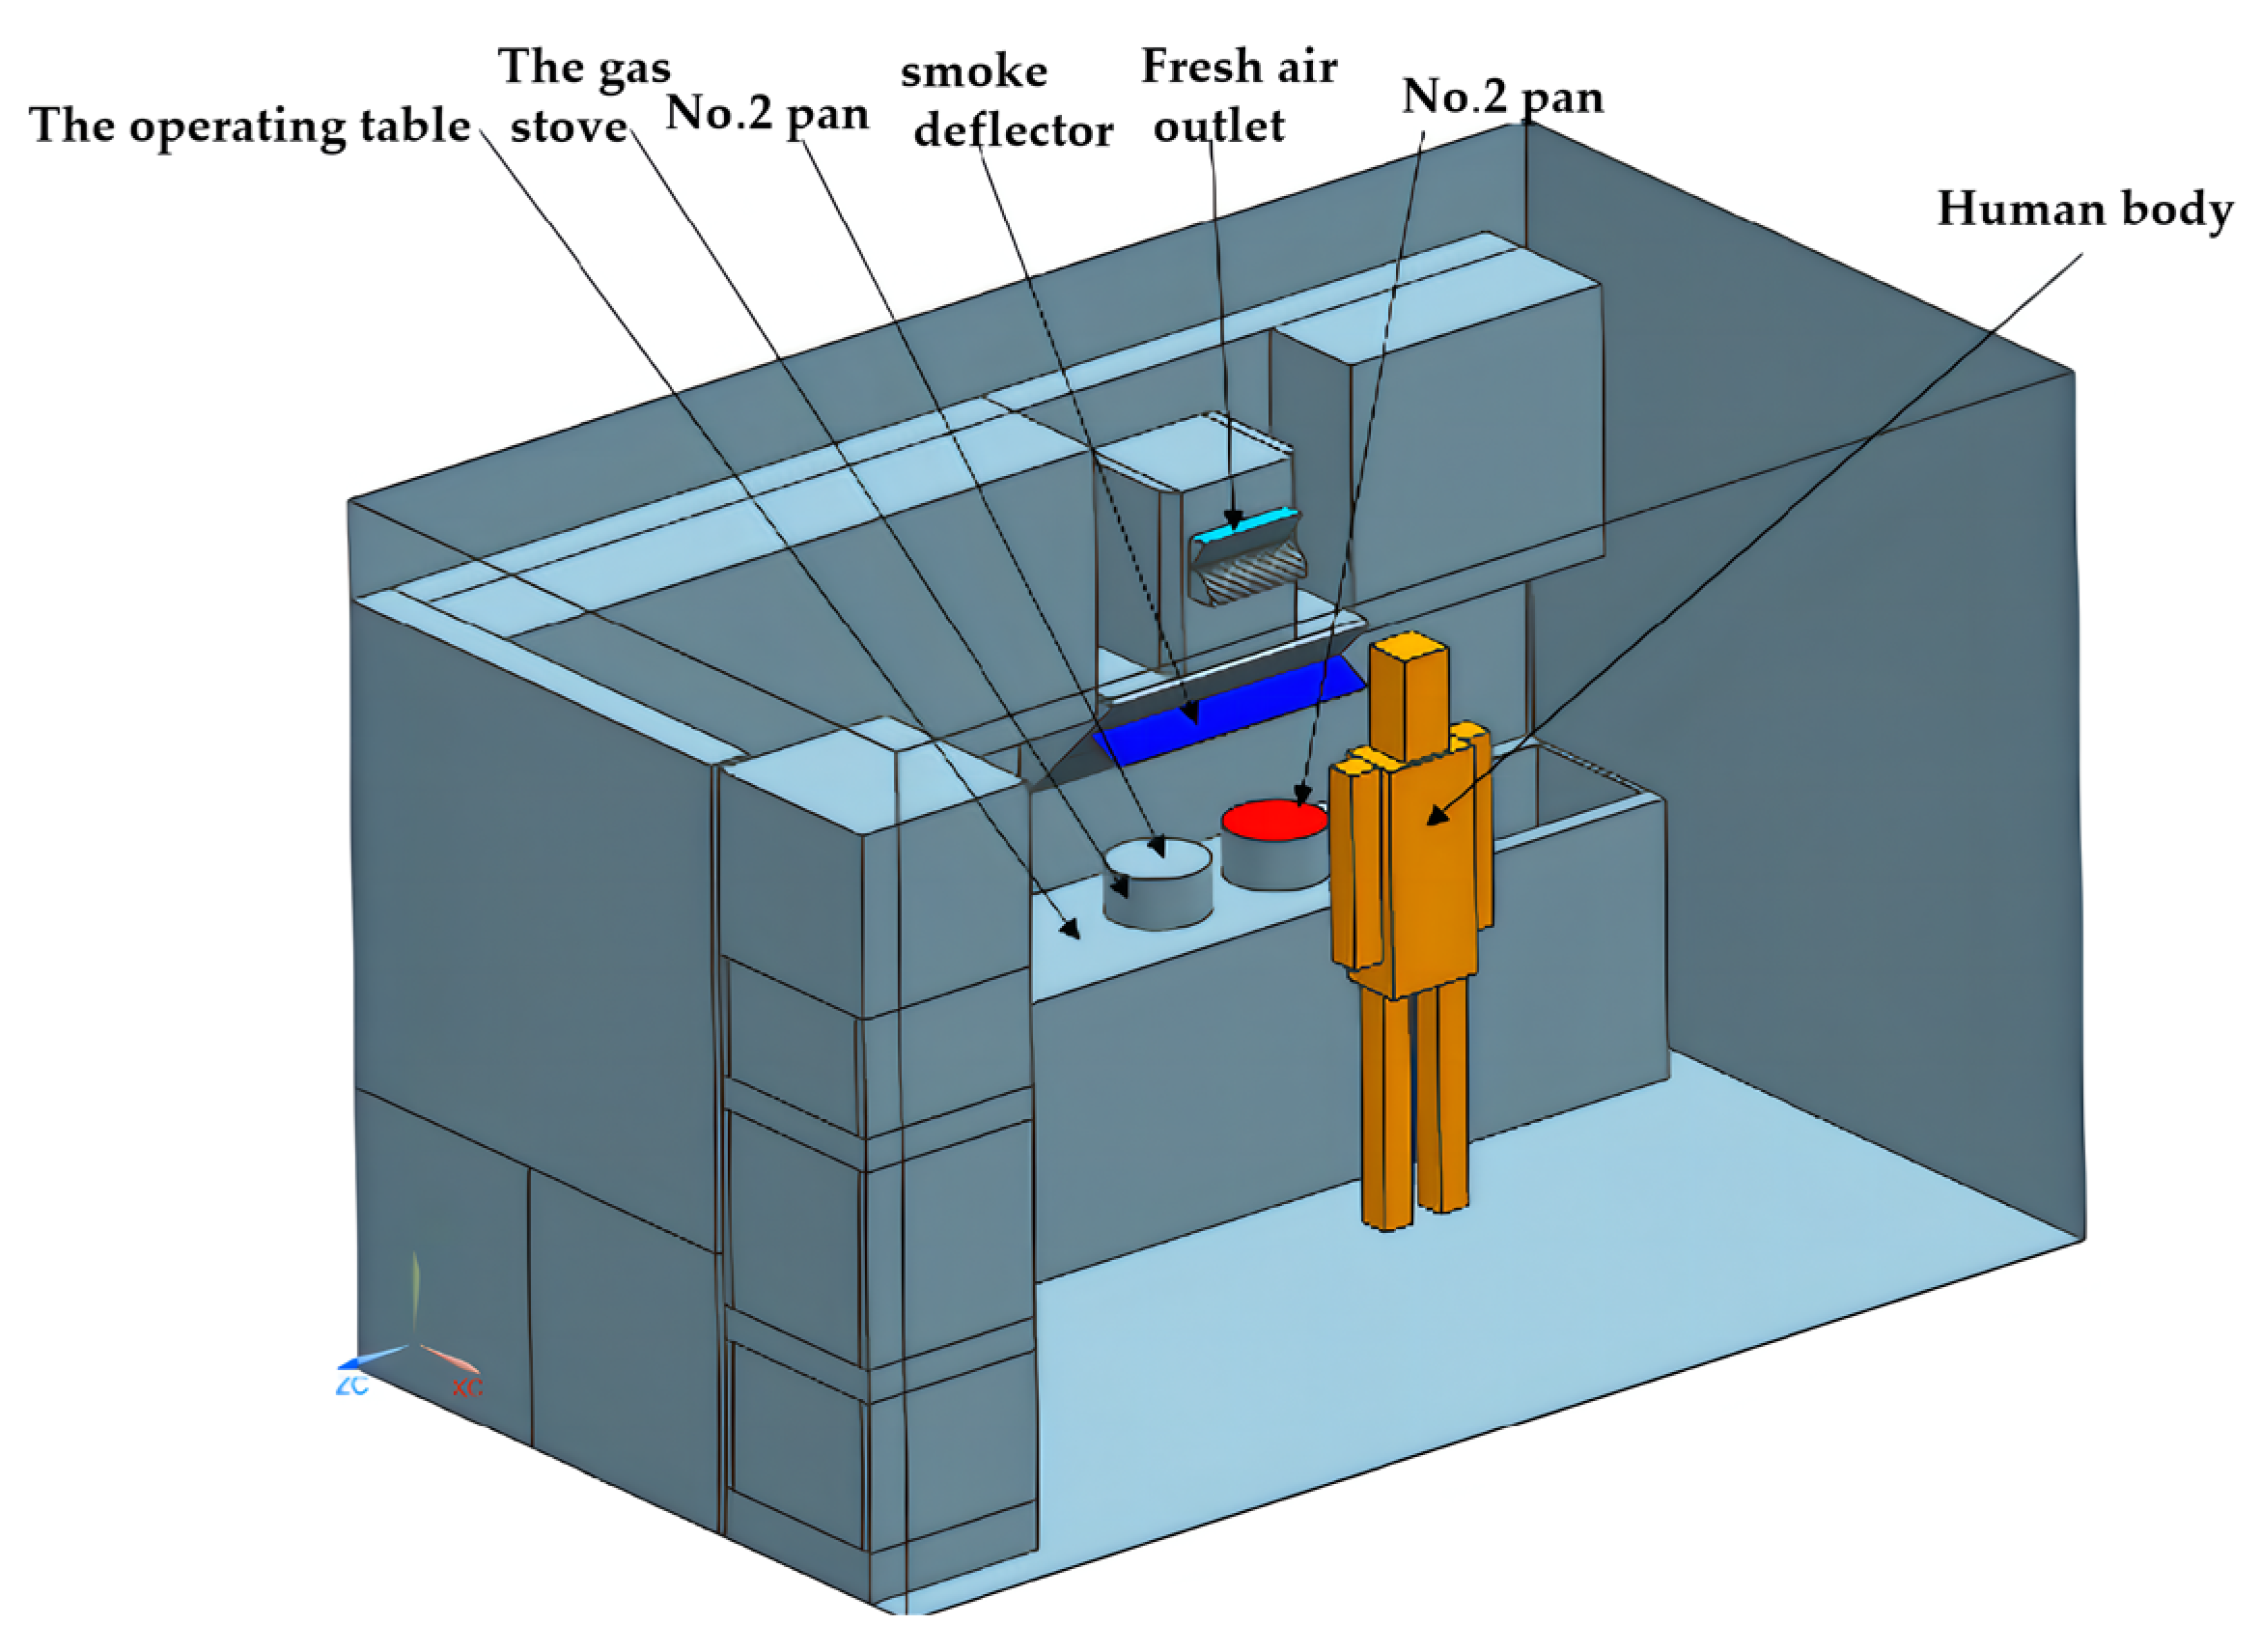
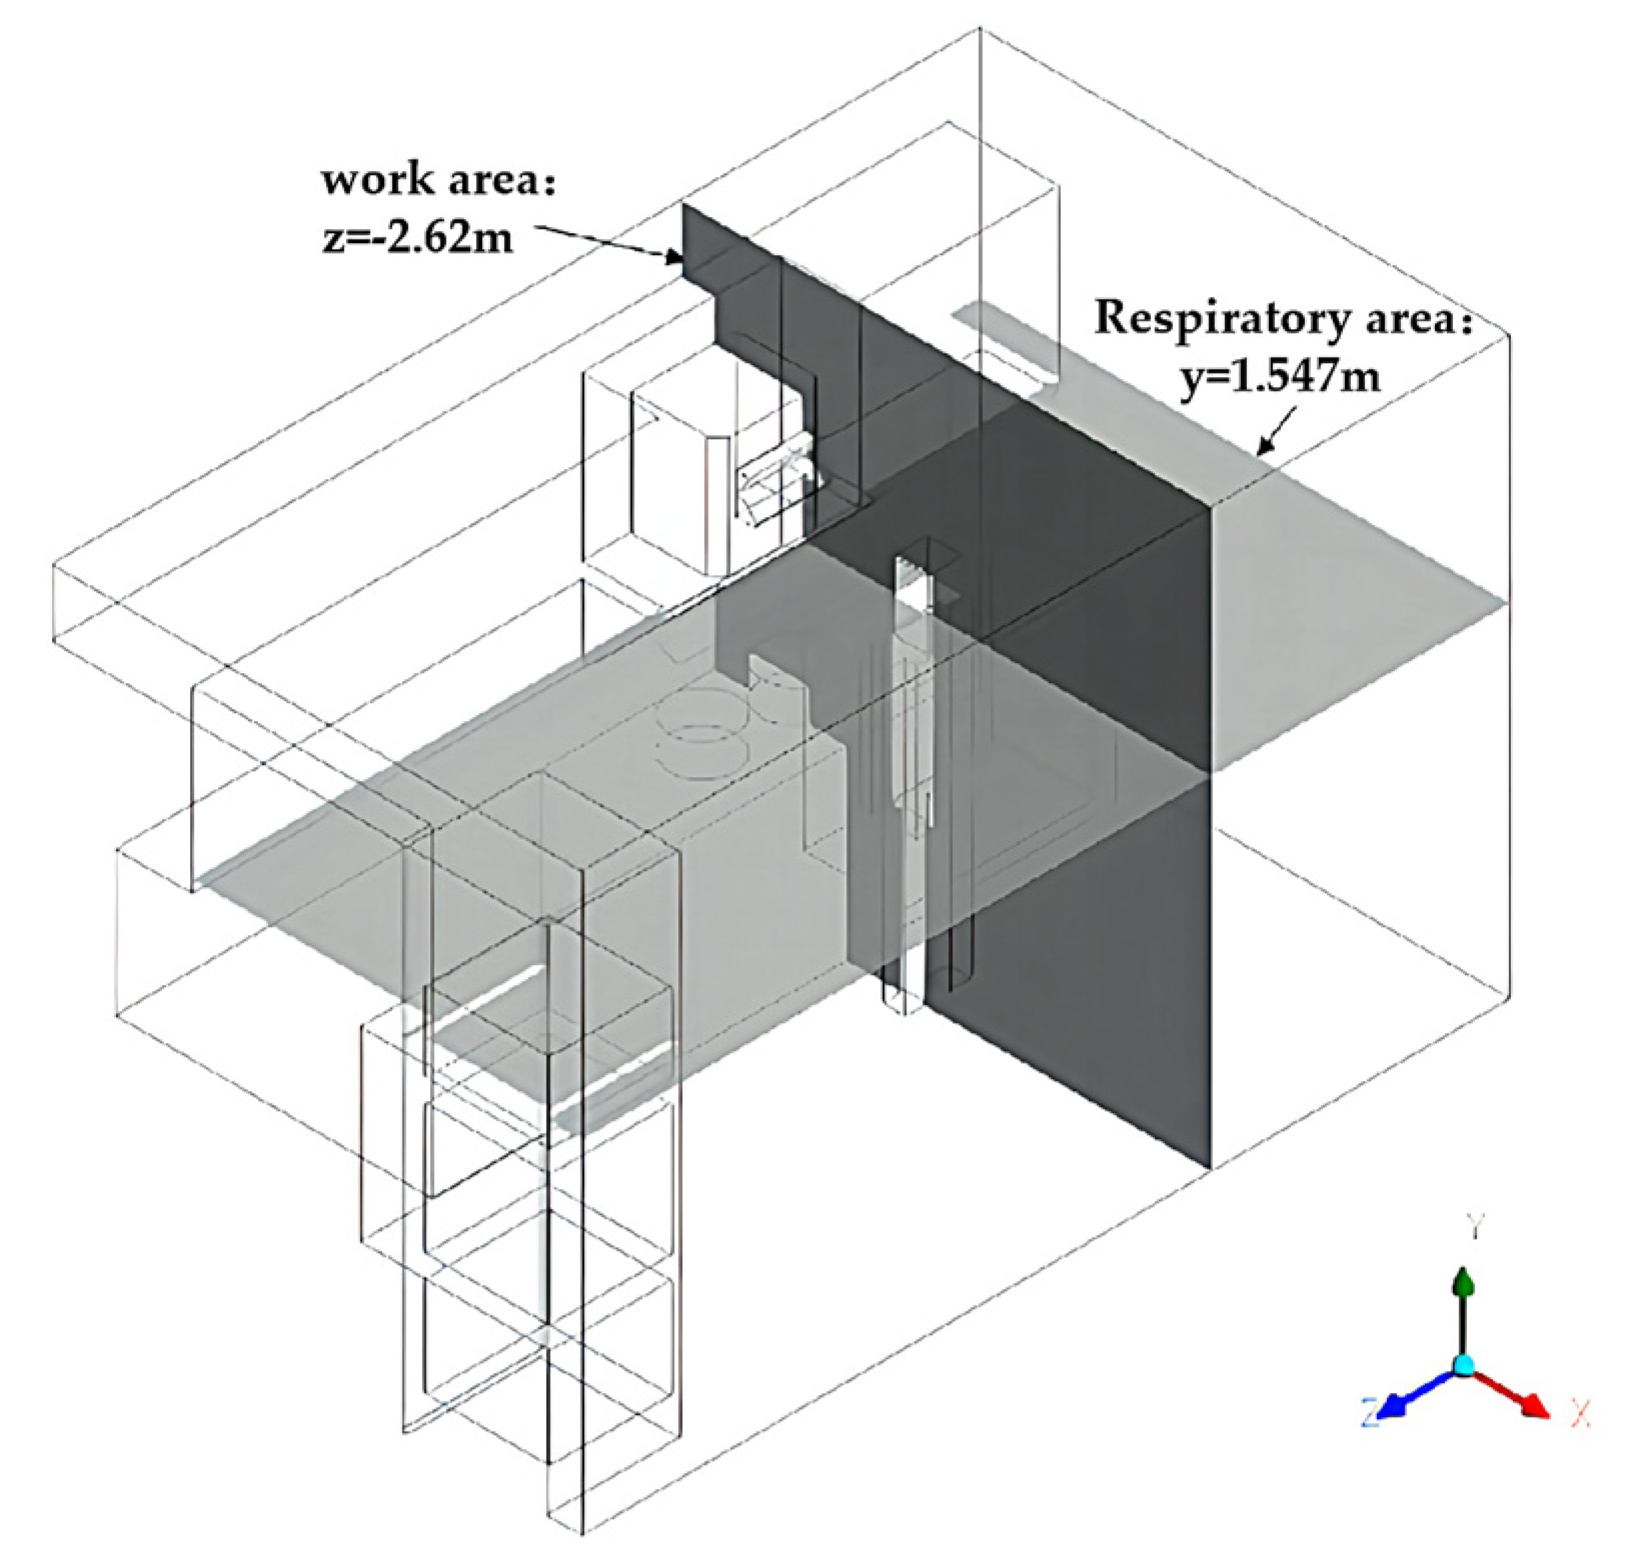
2.1. Geometric Model of a Kitchen Containing a Fresh Air System

According to the actual building dimensions of a residential kitchen and the distribution of indoor kitchen equipment, the geometric model shown in Figure 2 was established in UG10.0. The main research object of this paper is to study the impact of the side suction range hood [20]. Figure 2 shows the spatial structure model employed in the present study. The geometry of this kitchen is 4.2 × 2.4 × 2.6 (m), with an internal air volume of 20.761 m3. The operating table is 0.6 m wide and 0.84 m high in an L-shaped arrangement. The gas stove is a built-in binocular furnace with a single stove diameter 0.3 m. The pan is simplified as a cylinder with bottom diameter 0.3 m and height 0.15 m.

2.2. Grid Model

In this paper, tetrahedral mesh is used for all indoor spaces of the kitchen. In order to make the numerical simulation more efficient, the maximum size of the mesh is 85 mm and the minimum size is 3 mm. The mesh is locally refined and encrypted in air supply vents and heat sources where there could be large local temperature gradient and velocity gradient. The total elements created in the mesh is 693,000. The grid model of the experimental kitchen is shown in Figure 3.

2.3. Mathematical Models

2.3.1. Flow Control Equations

Continuous equation:
ρ t + · ( ρ u ) = 0 ,
Momentum equation:
( ρ u i ) t + ( ρ u i u j ) x j = p x i + μ 2 u i + x j ( ρ u i u j ¯ ) ,
Equations (1) and (2) form the basic equation for fluid flow, where ρ is the density of the fluid, and u is the velocity of the flow, p is the flow pressure, μ   is the fluid viscosity, and ρ u i u j ¯ is called the Reynolds stress.
Component transport equation:
t ( ρ Y i ) + ( ρ u Y i ) = J i + S i
where Y i is the component mass fraction, and S i is the other component production method or a custom mass source term, and J i is defined as
J i = ( ρ D i + μ t Sc t ) Y i   ,
where   Sc t = μ t / ρ D t is the turbulent Schmidt number, D t is the turbulent diffusion term, which is taken as 0.7 in this paper, and D i is the mass diffusion coefficient of the component i .

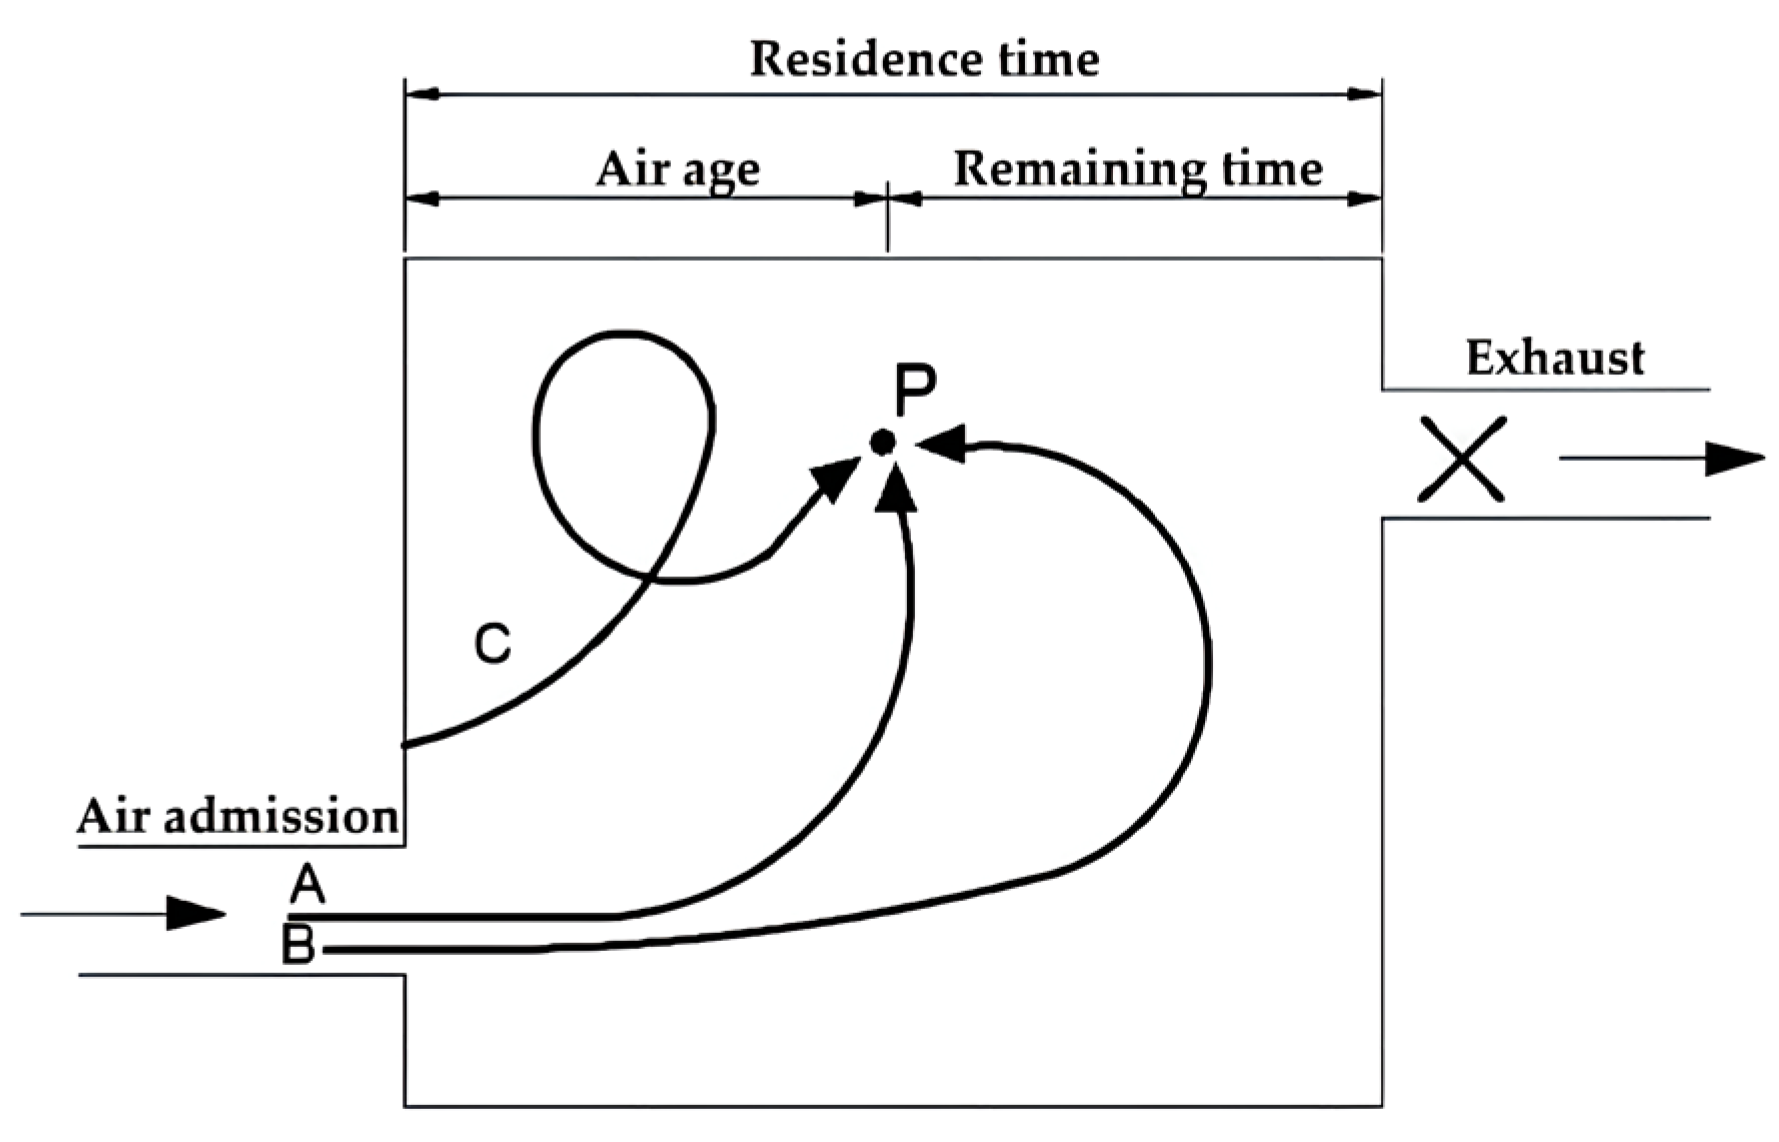
2.3.2. Air Age Transport Equation

In order to quantitatively assess the air quality in a kitchen, the concept of air age is used here. The air age refers to the average of the air age of all air particles from entering the room to reaching a tiny target in the room, as shown in Figure 4.
In this study, air age is used as an important indicator to evaluate the air quality of the kitchen. Generally speaking, the smaller the air age value is, the better the air quality will be. The air age transport equation is expressed as follows,
t ( ρ τ ) + ( ρ u τ ) = ( Γ · τ ) + S 0   ,
where τ is the air age average (s) of all the micro-masses at that point, Γ is the diffusion coefficient, and S0 is the source term [21].

2.3.3. Turbulence Model

This study uses a standard k ε turbulence model for transient calculations in the kitchen environment, where k is the turbulent kinetic energy and ε is the dissipation rate of turbulence kinetic energy per unit mass [22]. The standard k ε turbulence two-equation model is expressed as follows,
( ρ k ) t + ( ρ ku ) = [ ( μ + μ t σ k ) k ] + 2 μ t S ij · S ij     ρ ε ,
( ρ ε ) t + ( ρ ε u ) = [ ( μ + μ t σ ε ) ε ] + C 1 ε ε k 2 μ t S ij · S ij     C 2 ε ρ ε 2 k
where μ t is the turbulent viscosity coefficient and S ij is the strain rate, which is the derivative of the velocity with respect to the coordinates. Table 1 shows the values employed for the other four coefficients, σ k , σ ε , C 1 ε , and C 2 ε , commonly used in the present study.

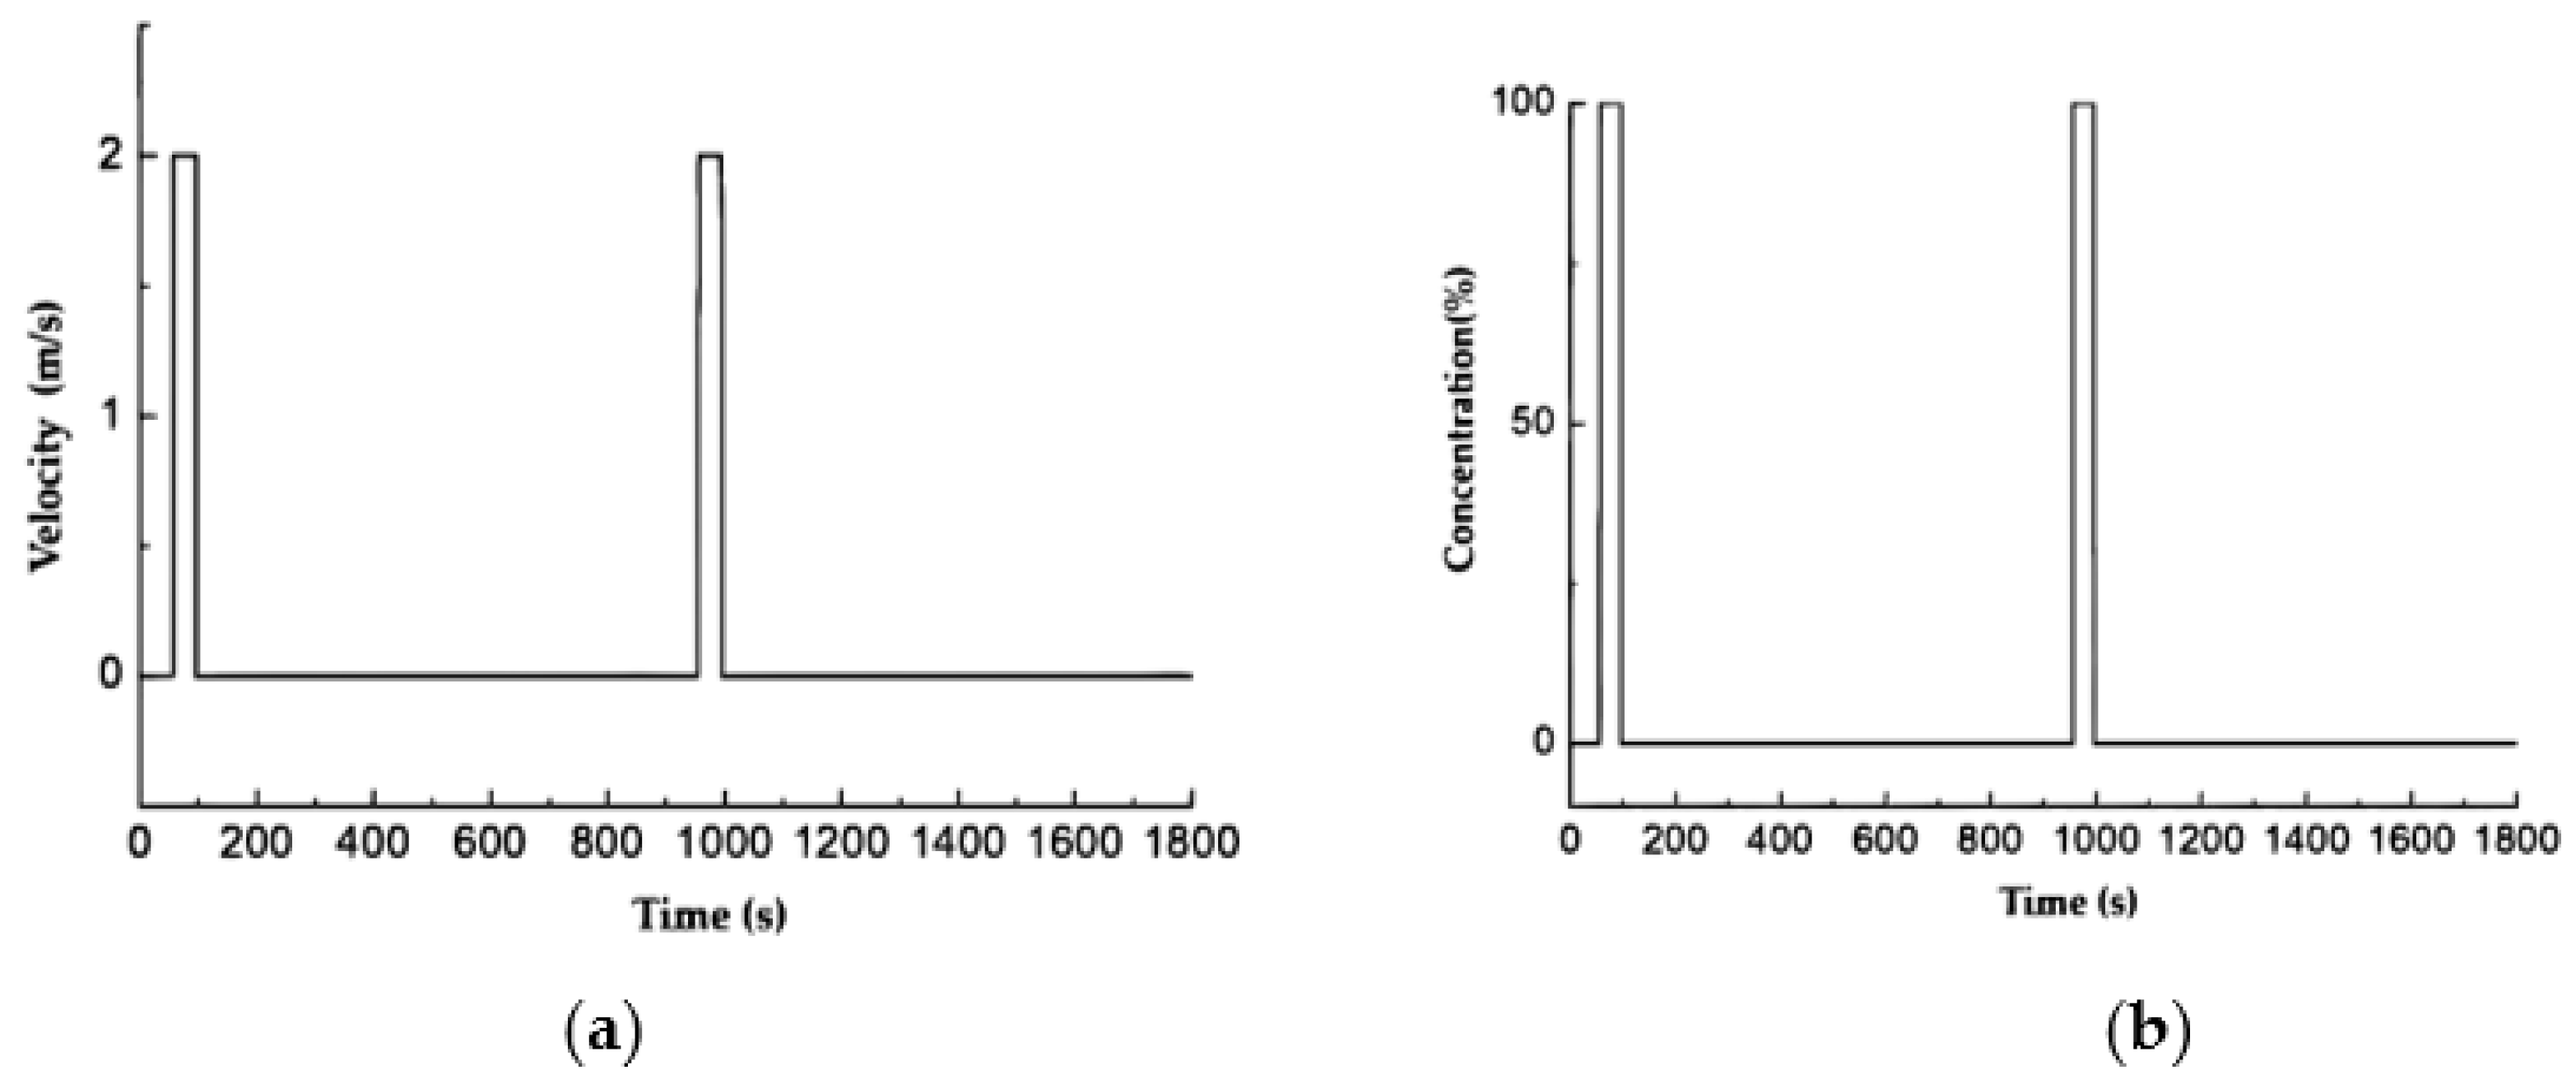
2.4. Measurement of the Oil Smoke Concentration

The particulate matter sampler is used to measure the concentration of oil smoke at two measuring points A and B. The particulate matter sampler is shown in Figure 5. The positions of the measurement points A and B are shown in Figure 6. Measure point A is 188 cm away from the ground, 107 cm away from the rear wall of the cupboard, and 40 cm away from the left side of the range hood. Measure point B is 166 cm away from the ground, 77 cm away from the real wall of the cupboard, and 28 cm away from the left side of the range hood. The testing time is 1800 s and the monitoring data are collected each 5 s. The experiment is strictly conducted according to the testing procedure, and it is repeated 20 times. Outlier points below 5% and above 95% were removed and then averaged.

2.5. Boundary Condition Setting

In order to reflect the actual situation to the greatest extent and to simplify the calculations, this study uses water vapor instead of oil smoke in the simulation [23].
The initial kitchen ambient temperature is 27 °C. Oil fume inlet adopts velocity inlet boundary condition. When the pan is turned on, the release rate of oil fume is 2 m/s, the generated gas contains 100% water vapor, and its temperature is 70 °C. The velocity and temperature boundary of the upper and lower fresh air inlets are set as 2.415 m/s and 20 °C, respectively. The total inlet air volume of the fresh air system is 8 m3/min. The fresh air direction of the upper fresh air outlet is upward along the normal direction of the cross section. The fresh air direction of the lower fresh air outlet is downward along the normal direction of the cross section, as shown in Figure 7. To reduce the interference of human factors to the test, only the chef performed the overall operation of the test. The boundary conditions for the chef were a height of 170 cm and metabolic rate of 1 met (58.15 w/m2).
During the 1800-s test, the oil fume pan was opened twice for 40 s and was off for the rest of the time. According to the specific steps of the test, the regularity of the oil fume release rate and concentration of No. 1 oil fume pan with time is shown in Figure 8. During the two time periods of 56~95 s and 956~995 s, the No. 1 oil fume pan was turned on. To evaluate the effect of the fresh air system on kitchen air quality, the upper and lower fresh air outlets were opened at 0~900 s and closed at 901~1800 s in the test.
No. 2 boiler was closed and had no oil smoke. It is treated as adiabatic condition. The exhaust air outlet of range hood adopts pressure outlet. Considering the performance of motor, the wind pressure was set at −360 Pa. By default, the other walls in the model are assumed to have non-slip boundary conditions.
The set of control equations for the gas flow is solved discretely using the pressure-based method and the second order windward format is applied in convective terms. SIMPLE algorithm is used to calculate the coupling of velocity and pressure.

3. Methods for Evaluating the Internal Air Quality of Kitchens

In order to create a good indoor kitchen environment, not only safety but also comfort must be considered in the planning and design of residential kitchens, because indoor air quality has a large impact on human comfort.
Let the volume of the kitchen space be V and the inlet air volume of the fresh air system be Q. The time required for air exchange once in the kitchen is V/Q [24]. Considering that the actual working area of kitchen staff is about half of the kitchen space, the average ideal indoor air age is defined as:
τ i = 1 V 2 Q ,
Assume that the air age in the kitchen is τ at some point, the ventilation rate is
E a = τ i τ · 100 % ,
When the kitchen ventilation rate is 100%, the ideal air age for this experimental kitchen is 78 s, which is obtained by substituting the previously V and Q into Equation (8).
In order to obtain the air ages corresponding to the different “air freshness levels” in Table 2, let us confirm the corresponding air exchange efficiency first. When the maximum air exchange efficiency of displacement ventilation is 67% [18], the air freshness is fresh. It is generally considered that when the indoor air exchange efficiency reaches 50% [25,26], the ventilation effect of the kitchen is better, and the air freshness is moderate. According to the ventilation times of living kitchens in the practical heating and air conditioning design manual [27], the air exchange efficiency of moderate pollution is 13.04%. The minimum standard of air exchange efficiency of 4.35% is the minimum value of ventilation frequency of residential buildings according to JGJ134-2001 [28]. Table 2 shows the air age values in each stage of this experimental kitchen by converting the corresponding air exchange efficiency and ideal air age value of 78 s (100% air exchange efficiency).

4. Discussion

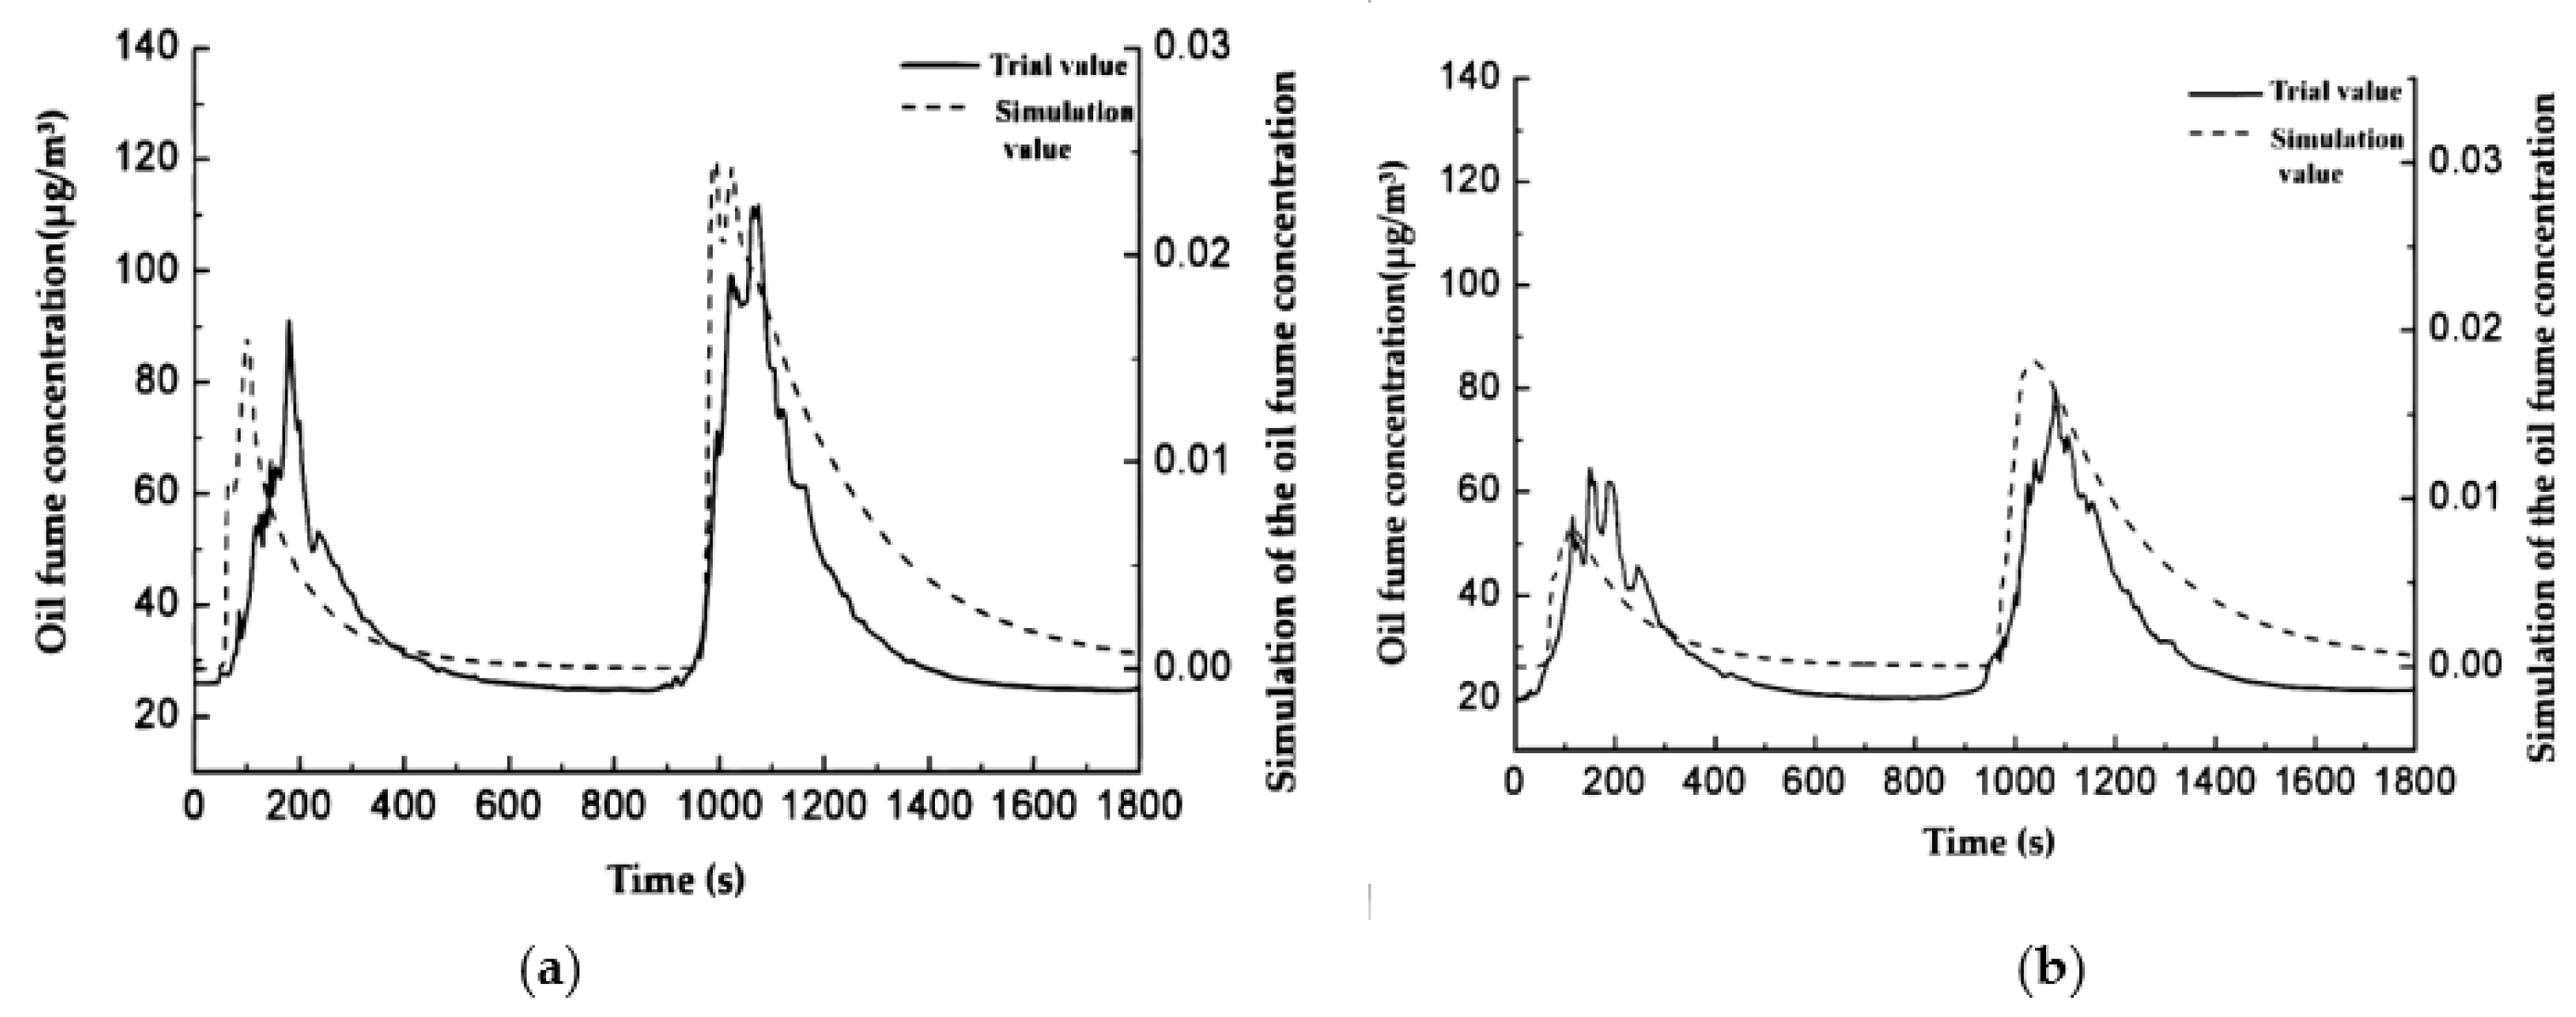
4.1. Calibration Analysis of the Kitchen Environment Computational Model

In order to analyze the air quality of this experimental kitchen, we need to complete a CFD flow field analysis of oil fume concentration of the kitchen environment and its calibration with the experimental data [23]. Figure 6 shows the comparison of the oil fume concentration between the simulation result and the experimental data. It can be seen from the figure that the trends of the simulation and test curves of the two measuring points A and B, as shown in Figure 9, are roughly the same, both showing peaks in the 100~200 s and 1100~1200 s time periods. The second peak of the oil smoke concentration is higher than the first one, which basically reflects the change pattern of the actual kitchen indoor environment.

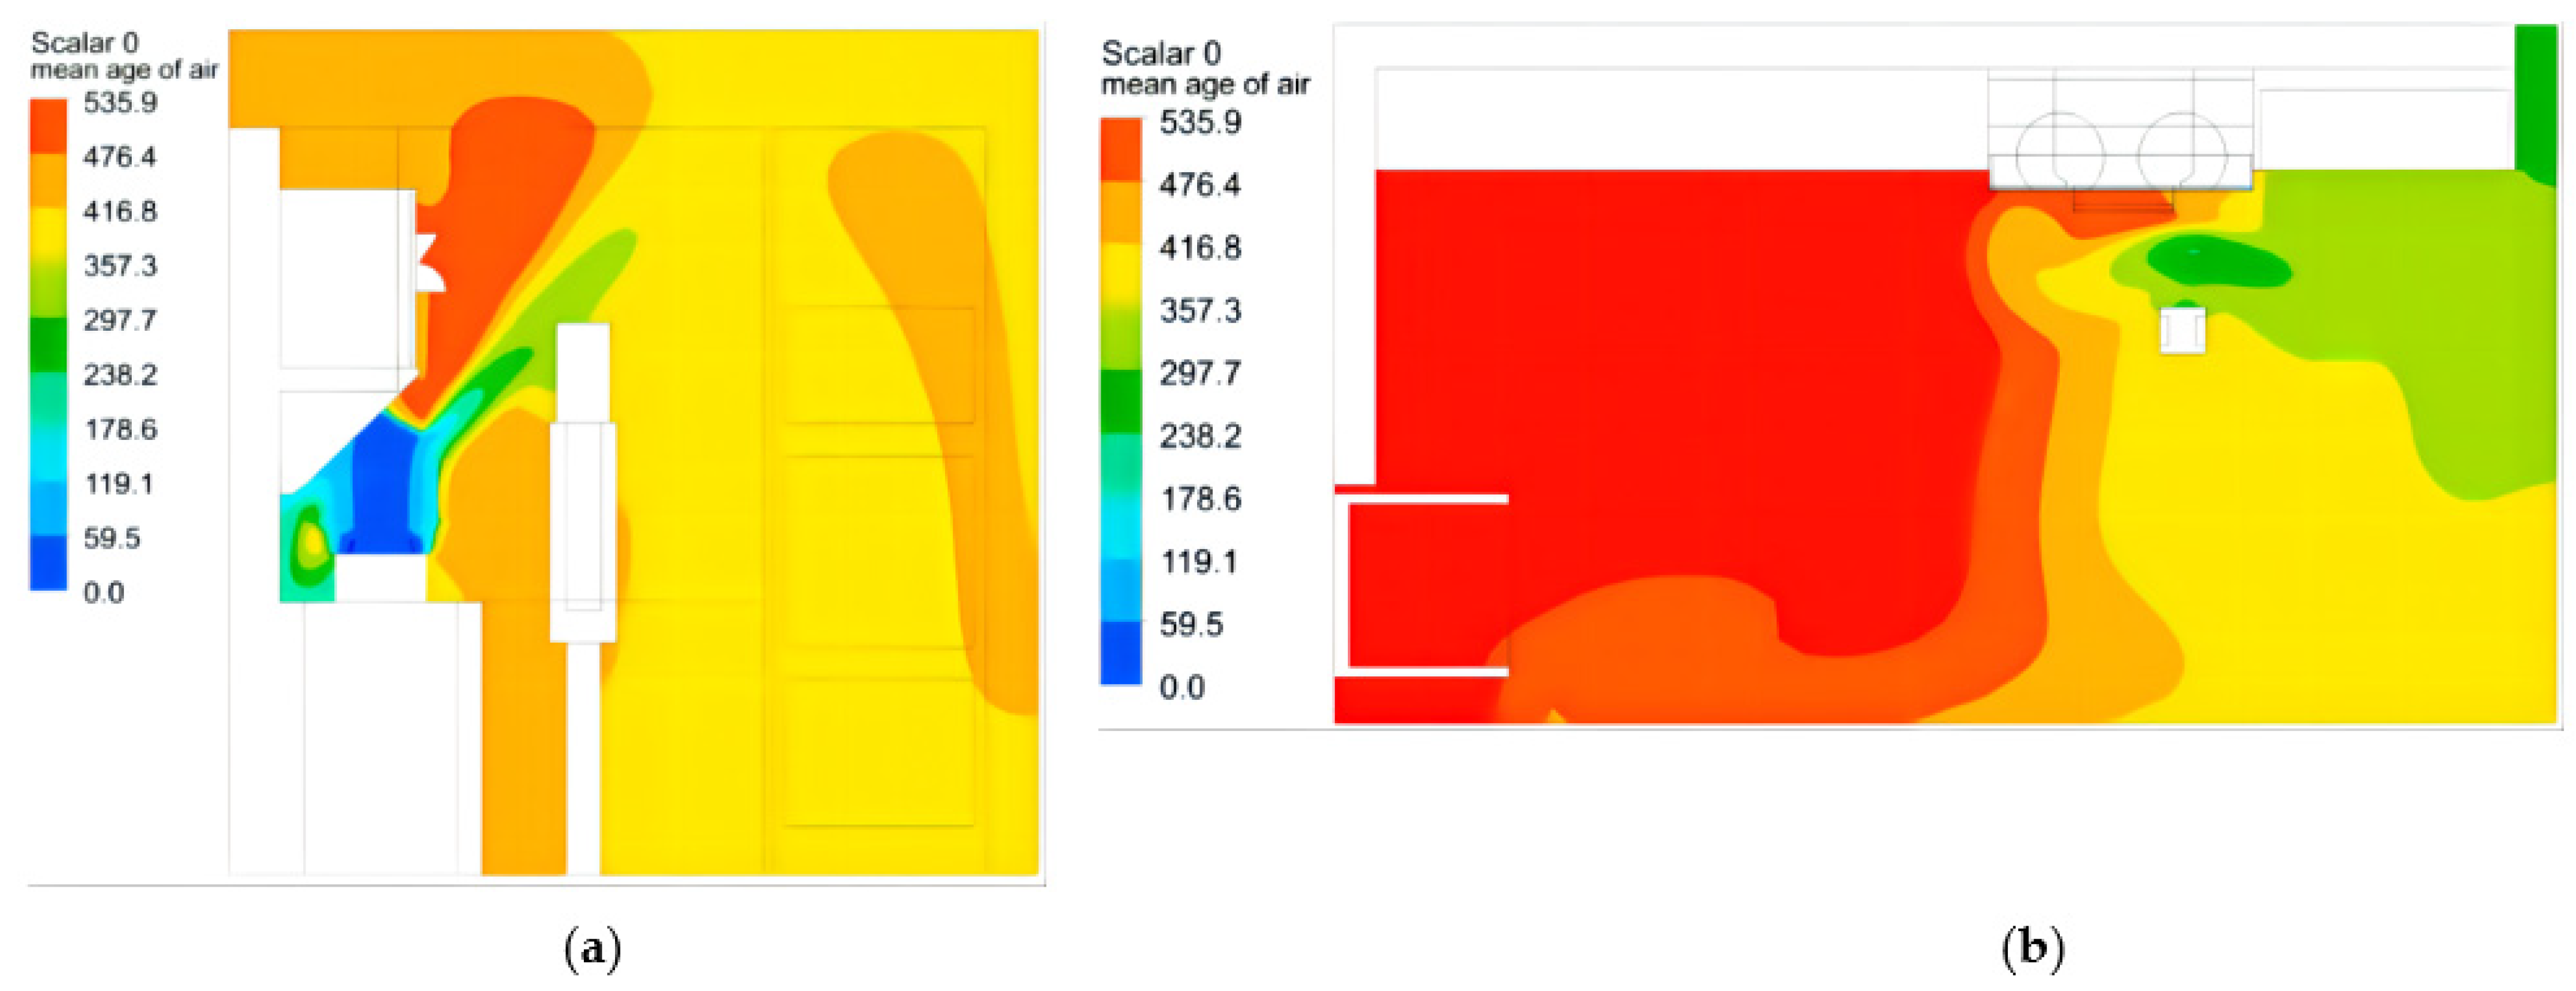
4.2. Quantitative Analysis of Fresh Air System on Kitchen Air Quality

After the CFD flow field and oil fume concentration was calibrated in the open and closed working conditions of kitchen fresh air system, the following quantitative analysis of the corresponding air quality was carried out. For comparison purposes, two typical cross sections were selected in the model for the working zone z = −2.62 m and the human breathing area y = 1.547 m. The cross sections in the kitchen space are shown in Figure 10.
As can be seen from Figure 11, when the fresh air system is turned on, the mobility of kitchen air is strong and indoor air replacement is faster. Therefore, the air age in front of the human body is lower than that in the rear. Notably, the air age of the human face is about 80.5~92 s. The highest indoor air age is 103.5 s in the left closet, which is far away from the fresh air system. In this case, the distribution of indoor air age field is relatively uniform.
As can be seen from Figure 12, when the fresh air is turned off, the air mobility in the kitchen is weak, the indoor air replacement is quite slow, and the gas is very turbid. Therefore, the air age near the air outlet is lower than those at the other locations. Notably, the air age of a human face is about 297.7~416.8 s. The highest indoor air age is also in the left closet, which is far away from the fresh air system, with a value of 535.9 s. In this case the distribution of indoor air age field is uneven and the air age gradient in front of the human body changes greatly.
In addition, Table 3 lists the air quality data at human face area and indoor area under two working conditions. The calculation results show that the opening of the fresh air system reduces the average air age of human face by 73.5%, increases the air exchange efficiency by 2.8 times, reduces the average indoor air age by 79.8%, and increases the average indoor air exchange efficiency by 3.9 times. The air quality is upgraded to fresh from moderate pollution, which quantitatively reflects the effect of the fresh air system.

5. Conclusions

Based on the test data and CFD simulation of the residential kitchen environment, the present paper quantitatively analyzes the impact of the fresh air system for test kitchen hoods on indoor air quality. From the study carried out, the following conclusions can be drawn.
  • The air age and air exchange efficiency are the reasonable indexes for the use of evaluation criteria for kitchen air quality control.
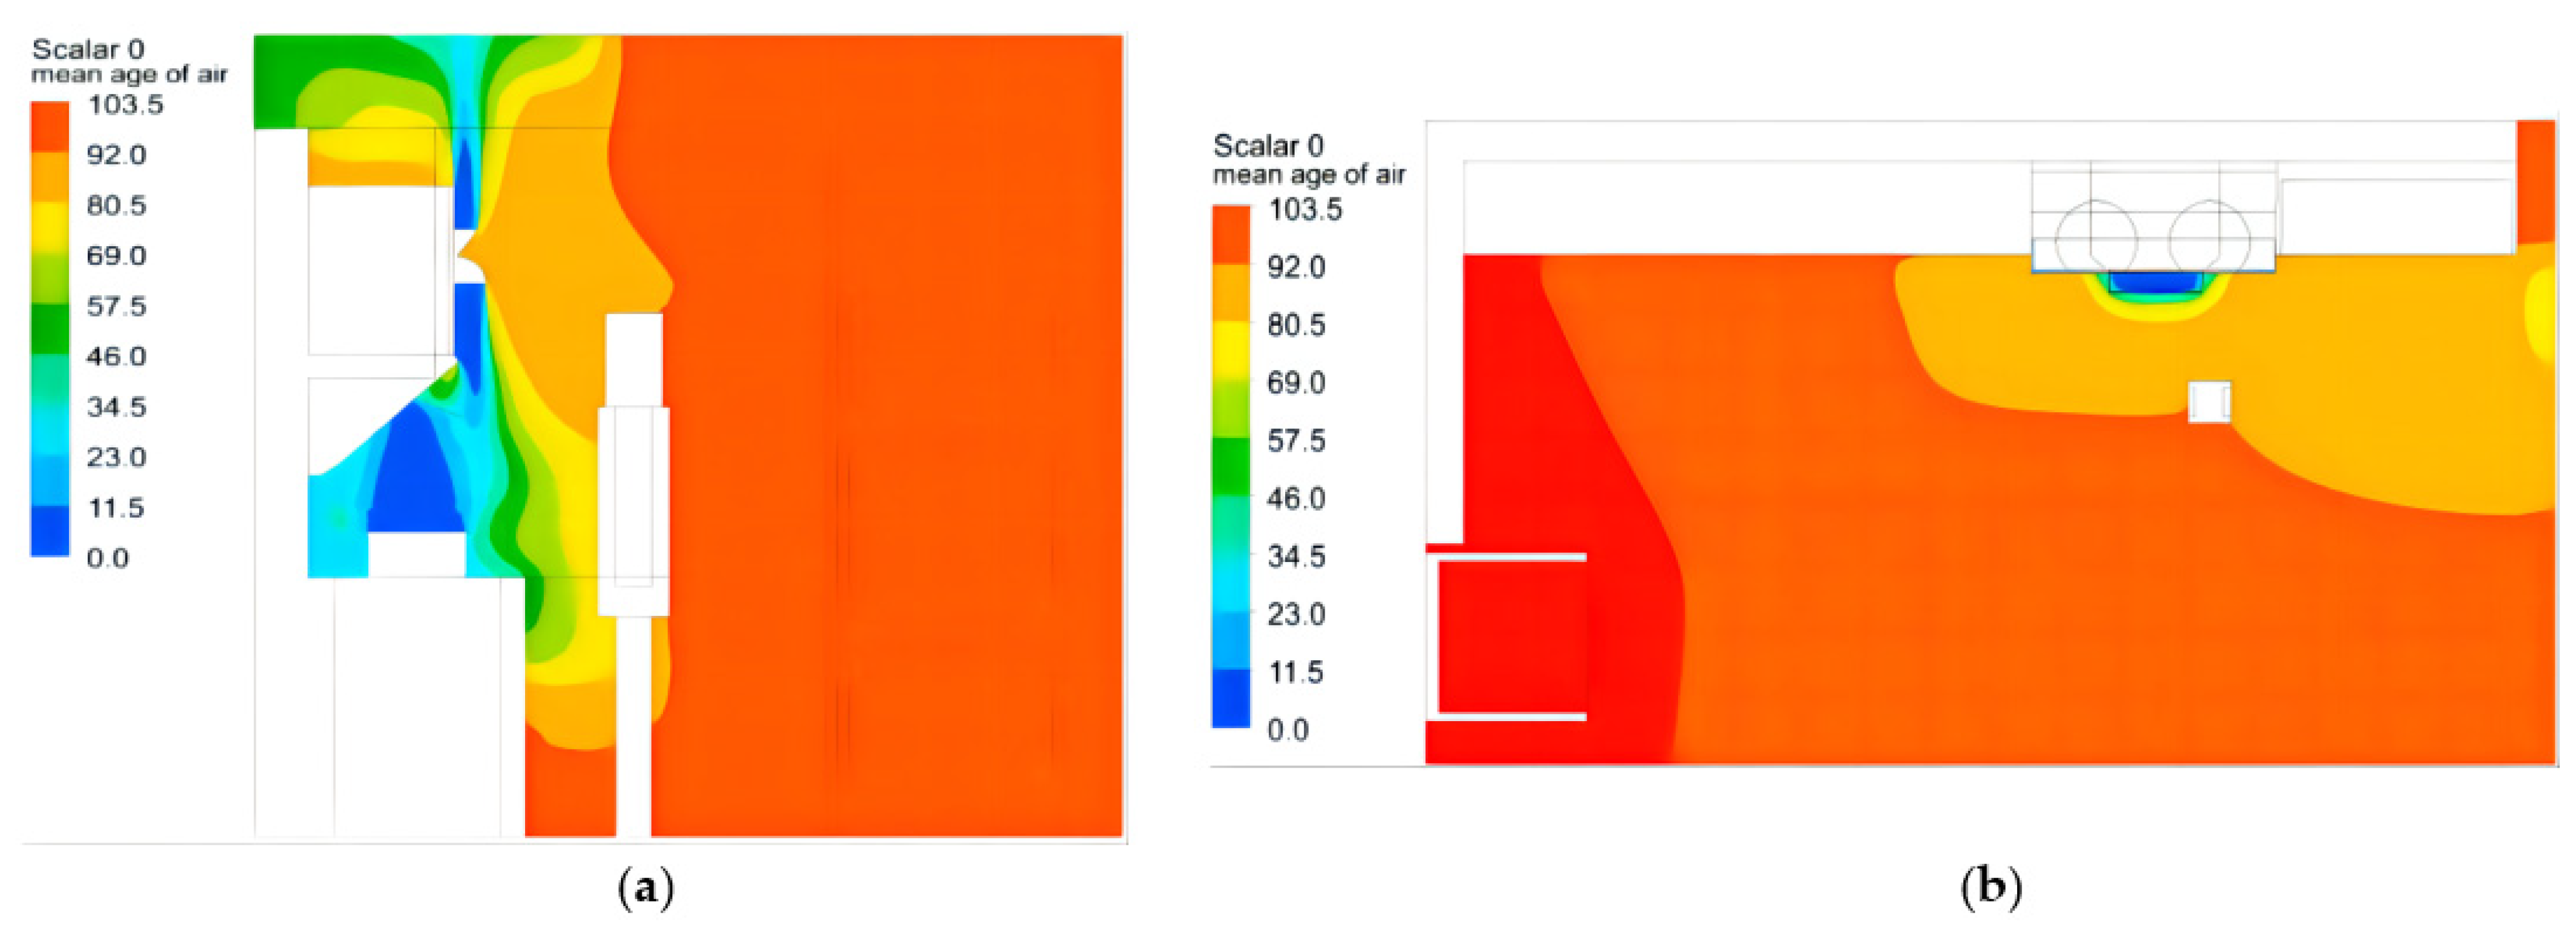
  • The effect of this test kitchen fresh air system on indoor air quality is quantitatively analyzed. The average air age at the human face is improved to 88.4 s from 333.9 s and the air exchange efficiency is improved to 82.4% from 16.7% after the fresh air system is switched on. It shows that the fresh air system can effectively improve the air quality of the human face area.
  • The presented approach can accurately assess the ambient air quality of kitchens and provide directions for the optimization of different kitchen designs to improve the indoor air quality.

Author Contributions

Conceptualization, X.X. and Z.C.; methodology, F.S.; software, X.X. and L.P.; validation, X.X., B.Y. and F.S.; formal analysis, X.X., L.P. and B.Y.; investigation, H.H.; resources, B.Y.; data curation, X.X. and Z.C.; writing—original draft preparation, X.X. and L.P.; writing—review and editing, X.X., L.P., B.Y. and Z.C.; supervision, Z.C., B.Y. and F.S.; funding acquisition, Z.C. and B.Y.; All authors have read and agreed to the published version of the manuscript.

Funding

This research was funded by the Zhejiang Province Public Welfare Technology Application Research Project (LGG22E080020), Healthy & Intelligent Kitchen Engineering Research Center of Zhejiang Province and 2025 Major Programs on Science Technology Innovation of Ningbo (2020Z06).

Institutional Review Board Statement

Not applicable.

Informed Consent Statement

Not applicable.

Data Availability Statement

Information and data used in the study will be provided upon reasonable request.

Acknowledgments

We would like to thank the Zhejiang Province Public Welfare Technology Application Research Project (LGG22E080020), Healthy & Intelligent Kitchen Engineering Research Center of Zhejiang Province and 2025 Major Programs on Science Technology Innovation of Ningbo (2020Z06) for their support for this research.

Conflicts of Interest

The authors declare no conflict of interest.

References

  1. LKakoulli, C.; Kyriacou, A.; Michaelides, M.P. A Review of Field Measurement Studies on Thermal Comfort, Indoor Air Quality and Virus Risk. Atmosphere 2022, 13, 191. [Google Scholar] [CrossRef]
  2. Chen, C.; Zhao, Y.; Zhao, B. Emission rates of multiple air pollutants generated from Chinese residential cooking. Environ. Sci. Technol. 2018, 52, 1081–1087. [Google Scholar] [CrossRef]
  3. Parrott, K.; Emmel, J.; Beamish, J. Use of kitchen ventilation: Impact on indoor air quality. Forum Fam. Consum. Issues 2003, 8, 1. [Google Scholar]
  4. Singeri, B.C.; Delp, W.W.; Apte, M.G. Experimental Evaluation of Installed Cooking Exhaust Fan Performance; LBNL-4183E; Lawrence Berkeley National Laborobotory: Berkeley, CA, USA, 2011. [Google Scholar] [CrossRef] [Green Version]
  5. Liu, S.; Cao, Q.; Zhao, X.; Lu, Z.; Deng, Z.; Dong, J.; Lin, X.; Qing, K.; Zhang, W.; Chen, Q. Improving indoor air quality and thermal comfort in residential kitchens with a new ventilation system. Build. Environ. 2020, 180, 107016. [Google Scholar] [CrossRef]
  6. Liu, S.; Dong, J.; Ca, Q.; Zhou, X.; Li, J.; Lin, X.; Qing, K.; Zhang, W.; Chen, Q. Indoor thermal environment and air quality in Chinese-style residential kitchens. Indoor Air 2020, 30, 198–212. [Google Scholar] [CrossRef] [PubMed]
  7. Cao, C.; Gao, J.; Wu, L.; Ding, X.; Zhang, X. Ventilation improvement for reducing individual exposure to cooking-generated particles in Chinese residential kitchen. Indoor Built Environ. 2017, 26, 226–237. [Google Scholar] [CrossRef]
  8. Zhang, H.; Cheng, X.; Pan, W.; Liu, S.; Zhang, M.; Long, Z.; Zhang, T.; Chen, Q. Experimental study of relative exposure to particles transmitted from kitchen in an apartment. Procedia Eng. 2017, 205, 3830–3837. [Google Scholar] [CrossRef]
  9. Suriano, D.; Penza, M. Assessment of the Performance of a Low-Cost Air Quality Monitor in an Indoor Environment through Different Calibration Models. Atmosphere 2022, 13, 567. [Google Scholar] [CrossRef]
  10. Zhou, B.; Chen, F.; Dong, Z.; Nielsen, P.V. Study on pollution control in residential kitchen based on the push-pull ventilation system. Build. Environ. 2016, 107, 99–112. [Google Scholar] [CrossRef]
  11. Dobbin, N.A.; Liu, S.; Wallace, L.; Kulka, R.; You, H.; Shin, T.; Aubin, D.; St-Jean, M.; Singer, B.C. The benefit of kitchen exhaust fan use after cooking-An experimental assessment. Build. Environ. 2018, 135, 286–296. [Google Scholar] [CrossRef]
  12. Peng, M.; Ji, N.; Shama, W.; Huang, D.; Zhong, L. Comprehensive evaluation of indoor air quality classification. Green Tech. 2021, 23, 91–93. [Google Scholar] [CrossRef]
  13. Díaz-Calderón, S.F.; Castillo, J.A.; Huelsz, G. Indoor air quality evaluation in naturally cross-ventilated buildings for education using age of air. J. Phys. Conf. Ser. 2021, 2069, 012182. [Google Scholar] [CrossRef]
  14. Debnath, R.; Bardhan, R.; Banerjee, R. Investigating the age of air in rural Indian kitchens for sustainable built-environment design. J. Build. Eng. 2016, 7, 320–333. [Google Scholar] [CrossRef]
  15. Mao, N.; Song, M.; Chan, M.; Pan, D.; Deng, S. Computational fluid dynamics (CFD) modelling of air flow field, mean age of air and CO2 distributions inside a bedroom with different heights of conditioned air supply outlet. Appl. Energy 2016, 164, 906–915, ISSN 0306-2619. [Google Scholar] [CrossRef]
  16. Wang, F.; Chen, Z.L.; Shi, F. Kitchen environment analysis of range hood with air curtain based on CFD technology. J. Ningbo Univ. 2019, 32, 42–47. [Google Scholar]
  17. Liu, J. Research and application status of replacement ventilation. Constr. Eng. Technol. Des. 2018, 12, 365. [Google Scholar]
  18. Li, A.; Risto, K.; Kim, H. Chapter 3-In decay of turbulent kinetic energy in shear flow. In Industrial Ventilation Design Guidebook, 2nd ed.; Goodfellow, H.D., Kosonen, R., Eds.; Journal of Huazhong University of Science and Technology (Naturndustrial Ventilation Design Method); Academic Press: Cambridge, MA, USA, 2020; pp. 19–37. [Google Scholar] [CrossRef]
  19. Liu, X.F.; Yuan, S.Q.; He, Z.X.; He, H.Q. Application of Ventilation to Improve Catering Kitchen Environment. Environ. Sci. Technol. 2009, 32, 152–155. [Google Scholar]
  20. Chen, F.; Li, C.; Lu, Y.; Dong, Z.; Zhao, X. The influence of the smoke collection cover on the smoke exhaust efficiency of the side suction lampblack hood. Energy-Sav. Technol. 2019, 37, 275–279. [Google Scholar]
  21. Liu, Z.; Han, J.; Zhou, J.; Zhang, C.; Zhang, G. Research on residential wind environment evaluation based on wind speed ratio and air age. Build. Technol. 2015, 46, 996–1001. [Google Scholar] [CrossRef]
  22. Li, D.; Ma, G.; Guo, T.; Li, M. Research on decay of turbulent kinetic energy in shear flow. J. Huazhong Univ. of Sci. Tech. (Nat. Sci. Ed.) 2021, 49, 83–87. [Google Scholar] [CrossRef]
  23. Wang, G. Numerical simulation and experiment research on indoor air distribution of the energy-saving. In Environment Protective and Comfortable Domestic Kitchen; Hunan University of Technology: Zhuzhou, China, 2009. [Google Scholar]
  24. Ma, R.M. Ventilation effectiveness and IAQ. HVAC 2000, 30, 20–23. [Google Scholar]
  25. Tang, Z.; Zhan, J. Numerical simulation of indoor air environment and evaluation of ventilation modes. Hydrodyn. Res. Prog. (Ser. A) 2004, 19, 904–911. [Google Scholar]
  26. Wang, H.; Fan, C. Evaluation index of indoor ventilation and sewage discharge effect. HVAC 1997, 27, 29–34. [Google Scholar]
  27. Lu, Y.Q. Practical Heating and Air Conditioning Design Manual; China Construction Industry Press: Beijing, China, 2008. [Google Scholar]
  28. Ministry of Construction of the People’s Republic of China. Energy-Saving Design Standard for Residential Buildings in Hot Summer and Cold Winter Areas JGJ 134-2010; China Construction Industry Press: Beijing, China, 2010. [Google Scholar]
Figure 1. Fresh air system for extractor hoods.
Atmosphere 13 00920 g001
Figure 2. 3D geometric model of the experimental kitchen.
Atmosphere 13 00920 g002
Figure 3. The grid model of the experimental kitchen: (a) Partial surface grid in the kitchen; (b) Body grid of the air domain in the kitchen.
Atmosphere 13 00920 g003
Figure 4. Schematic diagram of air age.
Atmosphere 13 00920 g004
Figure 5. The particulate matter sampler.
Atmosphere 13 00920 g005
Figure 6. Location of measurement points A and B.
Atmosphere 13 00920 g006
Figure 7. The fresh air direction of the upper and lower fresh air outlet.
Atmosphere 13 00920 g007
Figure 8. Schematic diagram of boundary condition change of No. 1 oil fume pan: (a) Regularity of the release rate of oil smoke with time; (b) Variation law of oil smoke concentration with time.
Atmosphere 13 00920 g008
Figure 9. The comparison of the oil fume concentration between the simulation result and the experimental data: (a) Test point result of No. A; (b) Test point result of No. B.
Atmosphere 13 00920 g009
Figure 10. Cross section at y = 1.547 m with z = −2.62 m.
Atmosphere 13 00920 g010
Figure 11. Fresh air on (90 s): (a) Air age distribution in the working area at z = −2.62 m; (b) Air age distribution in the human breathing zone at y = 1.547 m.
Atmosphere 13 00920 g011
Figure 12. Fresh air off (990 s): (a) Air age distribution in the working area at z = −2.62 m; (b) Air age distribution in the human breathing zone at y = 1.547 m.
Atmosphere 13 00920 g012
Table 1. Turbulence model coefficients.
  σ k σ ε   C 1 ε C 2 ε
1.001.301.441.92
Table 2. Evaluation indicators for kitchen air quality.
Air Age (s)Air FreshnessAir Exchange Efficiency
78 (ideal state)Pure (non-polluting)100%
116.42Freshness67%
156.00Moderate50%
598.16Moderate pollution13.04%
1793.1foul4.35%
Table 3. Comparison of air quality indicators for the human face and indoor areas.
Working
Conditions
Average Air Age of the Human FaceAir Exchange
Efficiency of the Human Face
Average Indoor Air AgeIndoor Air
Exchange Efficiency
Indoor Air
Exchange Efficiency
Air Freshness
New breeze on88.4 s88.2%94.7 s82.4%82.4%Freshness
Fresh air off333.9 s23.4%468.6 s16.7%16.7%Moderate pollution
Publisher’s Note: MDPI stays neutral with regard to jurisdictional claims in published maps and institutional affiliations.

