Abstract
The Qaidam Basin is a sensitive climate transition zone revealing a wide spectrum of local climates and their variability. In order to obtain an objective and quantitative expression of local climate regions as well as avoid the challenge to pre-define the number of heterogeneous local climates, the ISODATA cluster method is employed to achieve the fine-grained climate divisions of the Qaidam Basin, which can heuristically alter the number of clusters based on the input of monthly temperature and precipitation data. The fine-grained climate classification extends the traditional Köppen climate classification and represents the complex climate transformation processes in terms of fine-grained climate clusters. The following results are observed: (i) The Qaidam Basin is divided into an arid desert basin area and the surrounding alpine mountainous areas. The climate distribution is affected by both the altitude and the dryness ratio, which, employing the Budyko framework, largely characterizes the local energy–water fluxes at the surface and the related vegetation regimes (biomes). The fine-grained climate classification successfully captures their causal relationships and represents them well by the local climates: the climatic spatial differentiation in the mountainous areas is highly consistent with the topography and reveals an elevation-dependent circular distribution from the edges to the center of the basin; the climate heterogeneity within the basin presents a west-to-east meridional distribution due to the combined effect of the mid-latitude westerlies and the Indian monsoon. (ii) The climate gradients are spatially different over the Qaidam Basin. The surrounding mountainous areas have a large climate gradient compared to the inner basin; the southern mountain edge is governed by a more severe climate change than the north-eastern one; and the climate gradient is larger in the eastern than in the western basin. (iii) The lake regions within the basin show an obvious lake effect and reveal a local lake climate. Spatially, a common structure emerges with a dryer-climate zone or watershed embedding a wetter lake-affected area, which appears to migrate eastward becoming stepwise wetter from the very dry center to the wet eastern boundary of the Qaidam basin. This provides a topographically induced insight of the wet climate expansion of initially arid climates and is crucial to improve the Qaidam Basin’s ecological environment. Finally, although this work mainly focuses on the local-scale climates and their variability in the Qaidam Basin, the data-driven cluster methodology for climate refinement is transferable to regional- even global-scale climate studies, which offers broad application prospects.
1. Introduction
The global climate system has undergone unprecedented warming since the 1950s [1], causing a series of ecological changes [2]. Particularly, the Tibetan Plateau, characterized as ‘the amplifier’ of global climate change [3], has experienced an overall rapid warming in recent decades under the global climate change [4]. The warming trend on the Tibetan Plateau occurred much earlier and more intensely compared with other regions within the same latitudinal band [5]. The Tibetan Plateau’s surface temperature has been increasing by 0.3 °C per decade from mid-1950s, which is approximately three times the global warming rate [6,7,8]. Therefore, the Tibetan Plateau has become a hotspot of global climate change research. The Qaidam Basin is one of the most susceptible regions on the Tibetan Plateau characterized by significant warming [9,10]. The average warming rates on Qaidam Basin are over 0.06 °C per year (p > 0.001) exceeding the other regions of the Tibetan Plateau since the 1960s [11]. The trend of increasing precipitation in Qaidam Basin has also been predominantly stronger than that in the hinterland of the Tibetan Plateau in the last fifty years [12]. Therefore, the Qaidam Basin is under severe climate change and receiving more attention in climate research.
Located in the transition zone of the Tibetan Plateau and the (semi-)arid inland regions, the Qaidam Basin is characterized by both alpine and arid climates, which can be divided into an arid desert area within the basin and an alpine area surrounding the basin. Both areas are extremely fragile and ecologically sensitive. Desertification is one of the biggest ecological challenges to the Qaidam Basin, which severely affects the protection of local ecological environment and social-economic development. Due to the low population density, the impacts by human activities are limited. Thus, the climatic variations (especially, of wind, precipitation and temperature) are playing a major role in desertification [13]. Therefore, a comprehensive understanding of climate dynamics is essential to analyze desertification to protect the local ecological environment.
To carry out the climate classification, there are many widely used and recognized standard empirical frameworks, including the Köppen climate classification [14] and its modifications, such as the Köppen–Geiger classification [15], the Köppen–Trewartha classification [16], the Thornthwaite climate classification [17,18], etc. The climatologists have also conducted a lot of location-specific modifications to adapt these climate classifications locally [19,20]. All these climate classification schemes are based on the classification rules, which identify the climate types in terms of a preset index system and threshold values. However, the formulated classification rules are subjective, so the classification rules easily become controversial [21,22]. Another problem is that for a highly heterogeneous climate region, the knowledge of local climates is insufficient, so it is difficult to make the climate classification rules by expert experiences or knowledge. Specific to the Qaidam Basin, studies have shown that there are significant regional climate differentiations within the Qaidam Basin, both in terms of spatial patterns and as temporal tendencies of temperature and precipitation [23]. However, only two main climate types are identified under the Köppen climate classification, the dessert (Bsk) and the tundra (ET) climate, which means the Köppen climate classification fails to further express the highly heterogeneous local climates within the Qaidam Basin and thereby tends to ignore the analysis of inner spatial structures [9,24]. Thus, cluster analysis becomes an alternative approach for redefining climate classification, which can give an objective and quantitative expression of spatially homogeneous climate regions. The cluster results are not constrained by the spatial scale of index system, but they can capture the climate heterogeneity even at the fine spatial scale; thus, cluster analysis has been popular in recently climate studies [22,25].
Therefore, we use the cluster approach to refine the climate classification and visualize the spatial distribution of climate in the Qaidam Basin. By fine-grained climate classification, we identify different local climate types in the Qaidam Basin and, mapping their geographical extent separately, provide a better understanding the complex climate evolution in the Qaidam Basin and contribute to future ecological protection and regional development.
2. Materials and Methods
2.1. Study Area
The Qaidam Basin (88° E–99° E, 35° N–39° N) is the largest intermontane basin located in the northeastern Tibetan Plateau (Figure 1). It is an approximately triangular, closed inland basin enclosed by high mountains. The northeastern, northwestern and southern edges of the basin are surrounded by the Qilian Mountains, the Altun Mountains and the Kunlun Mountains, respectively. The basin is the highest basin on Earth, whose interior has an average elevation of about 2700 m above sea level and whose surrounding mountains rise to over 5000 m. The whole area covering about is dominated by the plateau continental climate, which is dry and rainless throughout the year. The basin is characterized by a relatively dense but uneven distribution of lakes, which occupy about 1% of the basin area [26].
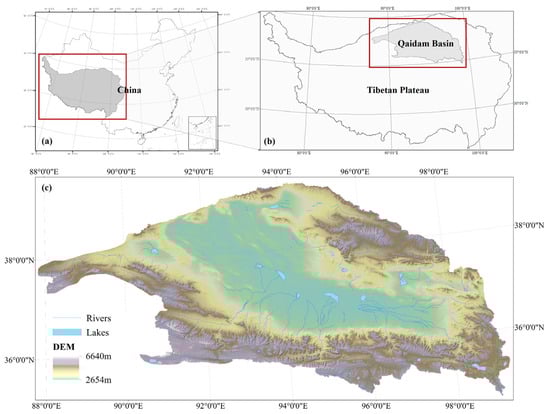
Figure 1.
The geographical environment of the study area: (a) The Tibetan Plateau (in the red box) is located on the western China and (b) the study area, the Qaidam Basin (in the red box), is located on the northeastern Tibetan Plateau. (c) The elevation in the Qaidam Basin varies from 2654 m to 6640 m. The rivers rise from the surrounding mountainous area, and the lakes are mainly distributed in the inner basin.
2.2. Data
As a data-driven objective quantitative method, choosing the appropriate data to cluster is crucial to obtain a good presentation of cluster results. For climate analysis, temperature and precipitation data are most readily available variables [27], which show great climatological significance for the Qaidam Basin [23]. Thus, this study uses monthly average temperature and monthly total precipitation, covering from 1979 to 2018, from the China Meteorological Forcing Dataset (CMFD) [28], which is a gridded near-surface meteorological dataset with a temporal resolution of three hours and a spatial resolution of 0.1°.
The meteorological station data are limited by the quantity and distribution of meteorological stations, especially in the mountainous regions. Most of the stations in the Qaidam Basin are located at lower altitudes [24]. This sparse and uneven net of meteorological stations cannot provide representative information on climate variations in the whole basin, nor allow more detailed spatial analyses. Therefore, we adopt a gridded meteorological dataset to build a full-coverage characterization of climate conditions in the Qaidam Basin. CMFD is made through the fusion of remote sensing products, reanalysis datasets and in situ observations at meteorological stations. The performance of CMFD has been verified by good correlations with the observed station data [26]. The validation results also show that CMFD is of superior quality compared with the GLDAS (Global Land Data Assimilation System, a widely-used grid dataset), which indicates the high reliability of CMFD [26].
However, temperature and precipitation are two climatic variables whose magnitudes span are different. In order to contribute equally in the analysis, they need to be scaled to a similar range by a normalization transformation; otherwise, the variable with a larger range would over-influence the results of fine-grained climate division. Here, standard normalization is used:
Here, denotes the climate variables. We also note that precipitation has a highly skewed distribution that a great part of normalized precipitation values will be very small. That is, the influence of precipitation on the climate differentiation is—to a large extent—artificially diminished. Thus, the precipitation values need to be modified before normalization to remove the influence of extreme values. That is, the top 5% of precipitation values are all transformed to the value of 1, while the remaining 95% of precipitation values would be transformed by the standard normalization to values ranging from 0 to 1. This modification achieves both a proper contribution of precipitation to the overall climate differentiation and the preservation of most precipitation information [25]. Finally, to eliminate possible jagged edges of the subsequent fine-grained climate division, we perform the cubic convolution interpolation on the gridded data to downscale from 0.1° to 500 m.
2.3. Climatological Setting of the Qaidam Basin
The annual average temperature (T) across the Qaidam Basin varies from −15 °C (surrounding high mountains) to 7 °C (lowland inside the basin), forming a ring of increasing trends dependent on elevation (Figure 2a). Figure 2c shows the intra-annual and interannual variation in temperature from 1979 to 2018. The annual average temperature of the whole basin has a significantly increasing trend of 0.06 °C/year (p < 0.05). There is strong seasonality in temperature from −17.7 °C in winter to 14.9 °C in summer, but the climate in winter has been gradually warming in recent decades. Spatially, the area with significant warming (p < 0.05) accounts for 93.4%. The warming rate decreased from west to east, with an obvious spatial differentiation (Figure 2e). The temporal-spatial variations in temperature are highly consistent with the elevation characteristics ranging from the central basin to the high mountains surrounding the basin, as well as from the small mountainous basin or valley to the ridge and mountain peak, showing the great influence of topography on temperature.
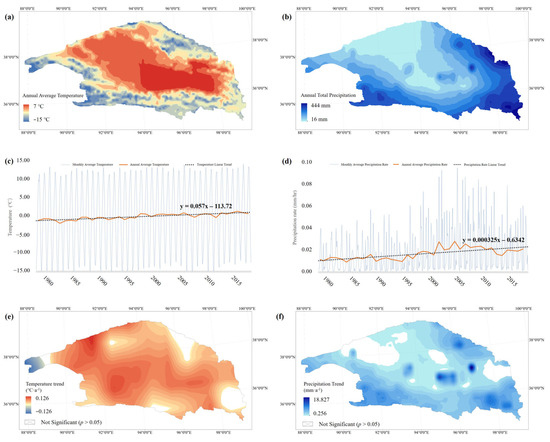
Figure 2.
Temperature and precipitation in the Qaidam Basin during 1979 to 2018: (a,b) spatial distribution of time averages; (c,d) time series of spatial averages, and (e,f) spatial distribution of per-grid annual change.
Due to the arid climate, the annual total precipitation (P) is rather low and mostly occurs from June to September, ranging spatially from 16 mm to 444 mm, with higher values in the southeastern part compared to the lower amounts in the inner plain areas. The spatial distribution of annual total precipitation in the Qaidam Basin forms a semi-circle whose magnitude decreases from the southeast to the northwest, which is from the basin edges to its center (Figure 2b). Even through the total precipitation is relatively low, it has continued to increase in recent years (Figure 2d), exceeding a 0.05 significance on 85.7% of the basin’s area (Figure 2f). Especially, the increasing precipitation trend in the east of the basin, which is closer to the monsoon region, is higher than over the western part of the basin controlled by the westerly circulation.
Given the above, we find large spatial differences in the local climates and in their variations in the hydro-thermal conditions in the Qaidam Basin, influenced by both local topography and large-scale atmospheric circulation. It confirms the necessity of fine-grained climate clustering in the Qaidam Basin and forms a solid climatic cognitive basis for the subsequent fine-grained climate analysis.
2.4. Method
To visualize the spatial differentiation in the long-term average climate and interannual climate variations, we apply spatial cluster analysis to the grid values of the normalized monthly temperature and precipitation as a natural and effective statistical method to identify homogeneous climate zones based on observed values of meteorological variables [22]. A clustering process groups grids into several clusters by the similarity of their climatic characteristics. The whole clustering process is automatic and unsupervised without any prior assumptions. Each cluster corresponds to a fine-grained climate type. Compared with traditional climate classifications, which directly and quantitatively specify the climate types by classification rules, the similarity-based clustering methods can provide internally more homogeneous and externally more distinct climate zones. It even offers the opportunity to identify new climate types [25].
The K-means method and its various versions are widely applied clustering algorithms applied in climate classification studies [29,30,31]. The method requires the number of clusters, K, to be specified in advance and to remain the same throughout the iterations. However, it is hard to pre-define the optimum number of clusters, especially for fine-grained climate studies with high variability. To overcome this problem, the ISODATA (Iterative Self-organizing Data Analysis Technique Algorithm), an enhancement of a simple and widely used heuristic for k-means clustering, is introduced [32]. Its significant advantage over the k-means method is that the user need only provide an initial estimate of the number of clusters, and then the algorithm may heuristically alter the number of clusters by additional mechanisms to eliminate very small clusters, to split large diffuse clusters, and to merge nearby similar clusters [33].
Denoting as the set of samples to be clustered, the heart of the ISODATA is still to assign each sample to its closest cluster center based on the distance in the d-dimensional space,. For any :
where is randomly initialized at the first iteration. For each following iteration, the cluster centers will be recalculated and moved to the centroid of the associated set of samples:
where is the number of the samples in . Then, the clusters will be assessed by the inter-cluster distance and intra-cluster distance :
The large diffuse clusters will be split and the nearby similar clusters will be merged, which follows the specific rules as outlined in [33]. Finally, the iteration process can adaptively lead to a stable optimal clustering result.
Thus, we perform the ISODATA clustering on the long-term (1979–2018) normalized monthly average temperature and precipitation (introduced in the preceding subsection) to cluster the grids to form the fine-grained climate classification. The implementation is realized by the ISODATA cluster tool in the ArcMap 10.2 (Esri, Redlands, CA, USA). Köppen climate classification [14] will serve as the ground truth baseline for comparison with our fine-grained climate classification results.
3. Results
Based on the long-term (1979–2018) climatic dataset, we obtain the Köppen climate classification (Figure 3a) and cluster-based fine-grained climate classification (Figure 3b) in the Qaidam Basin.

Figure 3.
Long-term (1979–2018) climate classification in the Qaidam Basin: (a) Köppen climate classification and (b) fine-grained climate classification (proposed in this study). The black box contains three important lake regions denoted by I, II, and III.
Located in the transition zone of the Tibetan Plateau and the further inland arid and semi-arid regions, the Qaidam Basin is dominated by both an arid climate (B) and a polar climate (E) under the Köppen climate scheme. Spatially, the central basin is covered by a cold desert (arid) climate (BWk) while the surrounding mountains are mainly covered by tundra climate (ET). The cold steppe (semi-arid) climate (BSk) and ice cap climate (EF) are distributed on the eastern hilly areas of Qaidam Basin. The transition process between different climates is characterized by spatial climate gradients. However, it cannot be reflected well by the Köppen climate classification, as it sharply distinguishes climate types by prior specified thresholds.
Defined by both of the two primary climatic variables, temperature and precipitation, the cluster-based fine-grained climate classification provides a novel and nuanced view of local climates and their variations. It illustrates the climate spatial heterogeneity by the visualized form of the local climates. The shifting of the geographical boundary of fine-grained climates corresponds to the climate change process. Thus, fine-grained climate classification can intuitively reveal more detailed climatic facts under fine-scale clustering, leading to new insights of local climates and their changes. The following results are noted:
(i) During the clustering, each cluster is comprehensively determined by the similarity of all the climatic features. Thus, the clustering method is expected to provide a more comprehensive and objective climate classification. As shown in Figure 3, the fine-grained climate classification follows the division of the Köppen climate classification but further reveals spatial differentiations within the single climate type given by the Köppen climate scheme. The corresponding relationship between two climate classifications can be visualized by their distribution in the Temperature–Precipitation scatter plots (Figure 4).
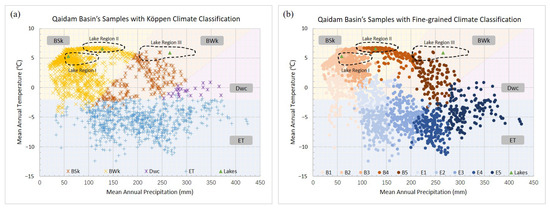
Figure 4.
Temperature–precipitation scatter plots for the Qaidam Basin: (a) Köppen climate classification and (b) the fine-grained climate classification. The three lake regions are also included in this feature diagram. The color division for both panels is based on the Köppen climate classification (a) and adopted for the fine-grained climate classification as an overlay to intuitively demonstrate the relation of two climate classifications.
The central basin controlled by an arid climate is divided into several meridionally arranged local climates. We define their climates as B1 to B5 (from west to east) to supplement Köppen climate types. Comparing the spatial distribution of two climate classification maps, the local climate sub-type B5 corresponds to the BSk climate, while the local climate sub-types B1 to B4 correspond to the BWk climate; that is, the region covered by the BWk climate shows great heterogeneity which, ignored in the Köppen climate classification, can be further distinguished as B1 to B4 local climates due to the clustering process by both temperature and precipitation differences. The B5 local climate (i.e., BSk climate) is solely identified as an independent climate type in the Köppen climate classification, not because it has significant difference with the climate of the surrounding areas, but due to it happening to reach the preset thresholds of the Köppen climate classification.
The surrounding mountainous region follows a different spatial pattern, where the local climates follow an elevation-dependent circular distribution from the central basin to the basin edges. We name these local climate sub-types E1 to E5 (from the central to the edges) to obtain a refinement of the ET climate. For global climate studies, the polar climate is significantly different from other climate types. Thus, the polar climate can be identified by a single criterion (the temperature of the hottest month (<10 °C)). However, for the Tibetan Plateau, characterized by the polar climate, it is far from enough to identify the inner climate heterogeneity by the temperature of the hottest month alone. The differences in the temperature and precipitation combination are also noteworthy. According to Figure 4, the tundra climate, which is characterized by the low temperature, is further sub-divided into Ex local climate sub-types by precipitation differences, with precipitation gradually increasing from E1 to E5 as the new local climates.
(ii) During the past forty years, all ten climate sub-types have experienced warming and wetting (Figure 5). The Bx and Ex climate sub-types are distinguished in annual average temperatures, which, for Bx sub-types, have increased with a faster growth rate than for the Ex climate sub-types, whose temperatures are lower (below 0 °C) and rise more slowly. For annual total precipitation, the B1 to B3 and E1 and E2 climate sub-types are characterized by rare precipitation with small fluctuation and slow growth, while the B4 and B5 and the E3 to E5 climates are characterized by relatively higher precipitation with severe fluctuations and significant growth. The B1 and E1 climate sub-types and the B5 and E5 climate sub-types, as two groups of spatially adjacent transitional climate sub-types, reveal a high differentiation in precipitation and temperature, respectively. The temperature difference between the B1 and E1 climate sub-types is small, but the B1 climate sub-type is characterized by extremely low precipitation, while the E1 climate sub-type has relatively higher precipitation. B5 and E5 climate sub-types both have high precipitation, and the B5 climate sub-type has a higher average annual temperature than E5.
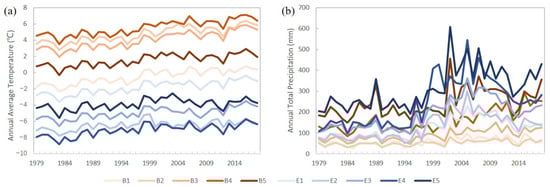
Figure 5.
Annual average temperature (a) and annual total precipitation (b) of the fine-grained climate types B1–B5 and E1–E5 during 1979 to 2018.
Such information of climate transition is obscured in traditional climate classification. However, in the clustering results, the demarcation line between different climate types under the Köppen climate scheme has broadened to a spectrum of local climates with characteristics composed by both of the two Köppen climate types. The E1 to E5 climate zones converting to arid B5 to B1 climates show a transition from the polar climate in the mountainous areas to arid climate in the basin, which is not abrupt but follows a gradual process. In this sense, the demarcation of local climates supports the visualization of the complex climate transformation processes, especially in the areas affected by the climate transition. Thus, it is more consistent with the real situation of the observed or simulated climate transition.
(iii) The central basin is divided into five meridionally arranged local climate zones which, from west to east, are dominated by the B1 to B5 climates. Based on the fine-grained climate classification (Figure 4b), we have identified three regimes of lakes interacting with their local climatic environment (Figure 6a). Each of the three central local climates contain an important lake region, which reveal a systematic structure (Figure 4b): these west-to-east-aligned lake regions are all characterized by climate characteristics which are similar to their wetter eastward neighbor but different from the local climate representative for the particular geographical location. That is, the dryer climate zones or watersheds are embedded by a wetter lake-affected area. Specifically, the lake region (L-I) embedded in the B2 climate zone is characterized by a B3 climate; next, the local B3 climate contains a lake region (L-II) with a B4 climate; and, finally, the last lake region (L-III) in the B4 climate zone also follows the same eastward moving trend that is characterized by the subsequent wetter B5 climate. Three wetter-lake regimes, with their dryer-embedding zones follow—step-by-step—an eastward track, where each step is about 150 km, becomes wetter with the wet-lake areas being as wet as the subsequent embedding zone. The structural similarity of all three lake regions hints to a balance between topography, atmospheric circulation and other local effects, which captures the interaction of lakes with their respective local climates.

Figure 6.
(a) Three representative lake-climate regions (L-I, L-II, L-III) identified by the fine-grained climate classification and (b) their lake area variations with linear trends shown by the dotted lines in the corresponding colors (1970 to 2020).
Having the moistening lake effect on the local climate, lakes are also sensitive to climate variability, whose surface conditions, such as ice cover, surface temperature, evaporation and water level, respond dramatically and immediately to changing climates. Thus, lakes are considered as key indicators of climate change [34,35]. In this study, we choose the lake area as the indicator to follow the climate effects on lakes. The lake data are from the Zhang’s dataset of the lakes larger than 1 km2 in Tibetan Plateau (V3.0) (1970s–2021) [36]. The results of the lake area variations from the 1970s to 2020s show that these three lake regions have experienced totally different change processes (Figure 6b): the lake area in the Lake Region I gradually increased in these years, while the lake area in the Lake Region II has declined with fluctuations. In Lake Region III, the lake area is relatively stable with less changes. The different patterns of lake area variation related to the local climate conditions are further discussed in the following section.
4. Discussion
The mainly descriptive results presented in the preceding section require some further interpretation to provide a better characterization of the study area with a more physical underpinning, to capture the robustness of the methods applied, and to illustrate the causal relationships of the observed climate distribution and controlling factors, which is covered in the Section 4.1. Then, we explore the causes of the fine-grained climate patterns, including the spatial distribution and gradient change of local climates in the Qaidam Basin (Section 4.2). Furthermore, we focus on the lake regions and discuss the interaction between the eco-hydrological environment and local climates (Section 4.3). From the perspective of local climates, we consider possible approaches to improve the ecological environment in the Qaidam Basin, establishing a harmonious human–environment relationship and realizing the sustainable development in the Qaidam Basin.
4.1. Physical, Biome, and Topographical Embedding of the Fine-Grained Climates
A more physical underpinning is provided in terms of the Budyko dryness ratio D [37], which is introduced as a basis for an analytical interpretation of climate diagnostics:
It characterizes the surface flux ratio of potential evapotranspiration (PET) versus precipitation (P) relating water demand and water supply [37], as seen also in [38]. The PET is estimated employing a modified Thornthwaite equation:
where T is the Kelvin temperature, and the estimated PET is in cm/year [39,40]. We choose this equation for its simplicity and frequent application because only one climatic input variable is required (Figure 7a). Then, employing the Budyko framework, the dryness ratio D is introduced to provide a quantitative measure of the geobotanical regimes governing the Qaidam Basin. The dryness ratio combines energy and water fluxes at the surface into one parameter relating water demand (or energy supply) to water supply, and it separates water from energy limited regimes at D = 1. This ratio also provides quantitative geobotanical measures of the climate–vegetation relation in terms of biomes: Tundra, D < 1/3, and forests, 1/3 < D < 1, are energy-limited because the available energy PET is low, so the runoff exceeds evaporation for given precipitation. Steppe and Savanna, 1 < D < 2, semi-desert 2 < D < 3, and desert 3 < D are water-limited climates, where the available energy is so high that water supplied by precipitation evaporates [37].
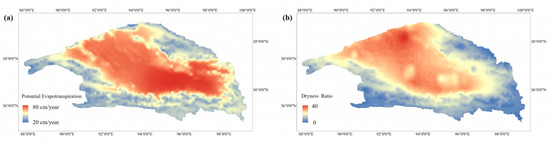
Figure 7.
The annual average potential evapotranspiration PET (a) and dryness ratio D (b) in the Qaidam Basin.
The robustness of the fine-grained climate classes obtained by the cluster method, described in Section 2.4 and applied in the Section 3, can be visualized comparing Figure 3b and Figure 7b, which shows the similarity in geographical coordinates. Both the Köppen related fine-grained climate classes and climate–vegetation-related biomes associated with Budyko’s geobotanical framework reveal similar geographical structures ranging from the very dry B-classes to the slightly wetter E-classes.
Relationships of the fine-grained climate classification with controlling factors of biome related dryness ratio (Budyko framework) and the topographic altitude are presented in the feature-specific box diagrams (Figure 8). The B and E classes appear to be well separated into the dryer and wetter regimes and are also located in lower and higher altitudes, resepctively.
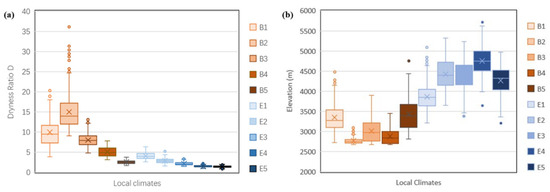
Figure 8.
The distributions of (a) dryness ratios and (b) altitudes associated with the fine-grained climate classification.
For completeness, the distribution of the Köppen and fine-grained climate classification embedded in the temperature–precipitation diagram (see Figure 4) can also be amended by an embedding in the more physical and vegetation-related Budyko framework using the (PET-D)-diagram (Figure 9). In particular, the biome-related location of the three lake regions (in combination with Figure 8) allows for further interpretation of the terminal-lake area (related to its watershed size) using a suitable dryness-based terminal lake model [38,41]. However, this is beyond the scope of this analysis, and we will further discuss it in the following work.

Figure 9.
Potential evapotranspiration versus dryness ratio scatter plots for the Qaidam Basin: (a) Köppen and (b) the fine-grained climate classification. The three lake regions are also included in this feature diagram.
4.2. The Causes of the Fine-Grained Climate Spatial Patterns
The fine-grained climate classification of the Qaidam Basin reveals the following spatial patterns: The basin can be divided into two parts, the central basin and the surrounding mountains roughly corresponding—under the Köppen climate scheme—to an arid and a polar climate. This demarcation of arid and polar climate zones is primarily determined by the large-scale topography, which is directly affected by the incoming solar radiation and the atmospheric water conditions. Furthermore, the more local climate distribution and the associated gradient changes are strongly related to the local circulation and climate processes. Local climates are also affected by the local factors such as local topography, land cover, etc.
The northeastern and southern high mountainous areas present a circular distribution extending from the central basin to the basin edges, which is highly consistent with the local topography. Increasing elevation, decreasing temperature, and increasing precipitation due to lifting of moist air lead to a height-dependent vertical climate differentiation. The spatial circular distribution of local climates also reflects the spatial differentiation of local climate variations. At the southern edge of the Qaidam Basin, the mountains are high and steep, so that the local climates in the southern mountainous area reveal a considerable spatial differentiation, which is further divided to five climate sub-types (E1–E5) representing smaller geographical spatial scales. For comparison, the north-eastern edge of the basin has a gentle slope, and the transition from an arid to the polar climate is slow.
The interior of the Qaidam Basin is relatively flat, whose climate spatial variation is mainly influenced by the local atmospheric circulation but not by elevation. From west to east, the weakening of the westerlies accompanied with an increasing influence of the Indian monsoon contribute to the meridionally arranged climate zonality, which is characterized by a sharp gradient from arid to humid, corresponding to the local climate spectrum from B1 to B5. The westernmost local climate zone is dominated by B1, which is located on the northwestern edge of the Qaidam Basin and connected with the arid region in northwestern China. The next eastward climate zone B2 is extremely arid controlled by the westerlies, which is broad highly uniform climate zone determined by highly homogeneous geographic and atmospheric conditions. Then, the eastern part of the basin has been affected by the Indian monsoon regime. This represents the strong plateau monsoon which, acting as an atmospheric river transporting water vapor from the Gulf of Bengal to the inland, supplies the intense precipitation events and causes the increasing trend of precipitation in the Qaidam Basin. However, the closed topographic structure makes it difficult for warm and wet air to fully reach the inner basin, and it instead accumulates in the middle and eastern parts of the Qaidam Basin. Thus, precipitation increases drastically from west to east, as represented in terms of the B3 to B5 climates, leading to an uneven distribution of precipitation that is higher in the eastern than in the western part and provides the dominant climate differentiation within the basin.
4.3. Interaction of Lakes and Local Climates
Lakes are an important part of the water cycle in arid areas. They are of great ecological and environmental relevance. They supply valuable water resources for animals, plants, and humans and link the systems of natural and human activities.
The presence of lakes has an important influence in the local circulation system and climate. The thermal storage and energy exchange capabilities of lakes differ from those of adjacent land surfaces, thus reducing the thermal amplitude of the diurnal and annual air temperature cycle on the lakes. Then, the large lake–land temperature differences lead to the local variations in wind, humidity, and precipitation, called the lake effect. The typical lake effect is that of precipitation initiated or enhanced by the advection of a colder airmass over a relatively warmer water body, both in the mid-latitudes [42] and in the tropics [43]. The result of fine-grained climate classification also shows an obvious lake effect in the Qaidam Basin because lake regions reveal local climate characteristics that differ from the adjacent land, especially in the arid hinterland of the basin. The climate of lake regions benefits from the lake-effect of precipitation being more humid than the surrounding areas, while the large-scale precipitation field dominated by the Indian monsoon circulation decreases from east to west. That is, following the general spatial distribution pattern of the larger scale climate, the local climates (B1 to B5) gradually become wetter from west to east. However, this general larger-scale climate pattern is offset by the lake effect in the sense that the lake regions attain a local climate regime which is similar to the larger-scale wetter climate observed further eastward. Thus, the lake-effect precipitation can efficiently improve the local climate and support that of the oases surrounding the lakes, whose good soil moisture conditions can enhance the vegetation growth. Furthermore, vegetation conservation and soil moisture supply provide suitable conditions to generate positive feedback, which enhances the local water cycle. Therefore, relying on the role of lakes in the regional energy and water balance and carefully conserving it, we may be able to combat dryness and, possibly, improve the ecological environment in the Qaidam Basin starting from the lake regions. This type of lake regime development may also provide insight for the analysis and interpretation of the paleo-climate evolution of the Qaidam basin. Thus, further details are presented in the following.
The different patterns of lake area variation are related to the local climate conditions, lake supply types, climate variations in lake upstreams, human activities, etc. (i) Lake Region I includes the east and west Taijinaier lakes, which are mainly supplied by the glacier meltwater from the Kunlun Mountain. As the upper reaches (covered by E climate) are getting warmer, the increasing glacier meltwater leads to the rapid expansion of lake area in the Lake Region I. (ii) Lake Region II is represented by Qarhan Salt Lake, which, as the largest potash production base in China, is largely affected by the human activities and policy managements. With the mining of the salt lake, the economic growth is built on the cost of the lake’s shrinkage [44]. Fortunately, people have been aware of this problem, and the government has carried out in-time policy intervention based on the goal of sustainable development from 2015 [45], which seeks for a balance between ecological protection and human development, and then pursues the sustainable development of human–lake as well as human–nature relationships. As a result, the lake area in Lake Region II has already rebounded since 2015, and the local environment has been improving. (iii) The lakes in the Lake Region III show another change pattern. Tuosu and Keluke Lakes are recharged by Bayin River supplied by both glacial meltwater and by precipitation. In the past forty years, the lake area in the Lake Region III has been relatively stable. That is, the increasing evapotranspiration by local warming accompanied by increasing local precipitation plus up-stream meltwater recharge are, to some degree, in balance and thus lead to a rather steady climate pattern.
In summarizing, there are strong interactions between lakes and local climates. Lake-effect precipitation can improve the local drought conditions while the local and upper-stream climates affect the water cycle of the lakes by promoting evapotranspiration and enhancing precipitation or runoff recharges. Especially, the melting glaciers due to the global warming have increased river runoff and lake water volume, which contribute to the relatively beneficial local climate conditions for the extremely arid Qaidam Basin in the short term and provide an important window period of local ecological environmental protection. Therefore, we can make the targeted plan of ecological restoration and environmental protection based on the lake–climate relation to form a positive feedback loop among the climate, hydrology, and ecology, so as to achieve long-term ecological-environmental improvement. Furthermore, not only for lakes as climate hot-spots, fine-grained climate classification provides an objectively refined climate division for many climate-related hydro-ecological studies of the environment. Monitoring the responses of the climate-related ecological environment at the fine spatial scale helps to develop adaptive protection for different climate zones, and thereby provide guidance for coping with possible disasters associated with floods and droughts in arid and semi-arid climates.
5. Conclusions
Given the climate transition zone of arctic–alpine Tibetan Plateau and the further inland arid and semi-arid regions, the climate within the Qaidam Basin is highly spatially-heterogeneous with a rapid climate gradient. However, current climate studies lack the fine expression of climate spatial differentiation within the Qaidam Basin. In order to obtain an objective and quantitative expression of local climate regions, as well as to avoid the challenge to pre-define the number of heterogeneous local climates, the ISODATA cluster method is employed to achieve the fine-grained climate divisions of the Qaidam Basin, which can heuristically alter the number of clusters based on the input of monthly temperature and precipitation data. The fine-grained climate classification embodies the latest facts of local climate distribution in the Qaidam Basin, extends the Köppen climate classification, and vividly visualizes the climate differentiation and the variation on a finer spatial scale. It provides an objective quantitative fine-scale division for climate studies of the Qaidam Basin, which fills the gap between the overall and grid-level studies. A more physical climate-vegetation related to biomes, which is associated with Budyko’s geobotanical framework, is introduced to verify the robustness of the fine-grained climate classes and to provide a wider diagnostic of both the Köppen and fine-grained climate classes. Furthermore, based on the validation of the robustness of the methodology, the cluster climate refinement, as an objective data-driven method, is transferable to regional, even global-scale climate studies, which have broad application prospects.
According to the fine-grained climate classification of the Qaidam Basin, we obtained a comprehensive and detailed understanding of the climate in the Qaidam Basin. The Qaidam Basin can be divided into an arid desert area within the basin and an alpine mountainous area surrounding it. The climate of the mountainous area is closer to the polar climate on the Tibetan Plateau. The climate spatial differentiation in the mountainous area is highly consistent with the topography and presents an elevation-dependent circular distribution from the basin center to its edges. The climate within the basin is more like the arid climate in northwestern China. Under the combined effect of westerlies and Indian monsoon, the climate heterogeneity within the basin presents a west-east meridional distribution. During the whole climate transition process, the surrounding mountainous areas reveal a large climate gradient compared with the inner basin. Furthermore, the southern mountain edge has experienced a more severe climate change than the northeastern mountain edge; the climate gradient in the eastern basin is larger than in the western part. The altitude and dryness ratio are two important controlling factors characterizing the changes in the energy–water fluxes at the surface, which subsequently influence the climate distributions. The fine-grained climate classification successfully captures their causal relationships and presents them well by the local climate classes.
In addition, there are interactions between lakes and local climates. The lake regions within the basin are strongly affected by the local climates, and they also show an obvious lake effect, which establishes itself as a local lake climate. A series of west-to-east aligned lake regimes represent a common structure with a dryer-climate zone or watershed embedding a wetter lake-affected area. Three wet-lake regimes with their dry-embedding zones follow—step by step—an eastward track, where each step is about 150 km in length. On this track, they become wetter, with the wet-lake areas being as wet as the subsequent embedding zone. In this sense, lake-affected moisture structures appear to migrate eastward from the very dry center to the wet eastern boundary of the Qaidam basin. This string of lakes embedded in a dryer watershed environment and their topographic expansion make the lake-influenced climate regions crucial to combat drought and thus improve the eco-hydrological environment of the Qaidam Basin; this may also provide—in a more qualitative sense—a topographically induced concept of a wet climate expansion within initially arid climates.
Author Contributions
Conceptualization, Y.F., S.D., K.F. and X.Z.; formal analysis, Y.F.; funding acquisition, S.D. and X.Z.; investigation, Y.F.; methodology, Y.F. and K.F.; project administration, S.D.; software, Y.F.; supervision, S.D. and K.F.; validation, Y.F.; visualization, Y.F.; writing–original draft, Y.F.; writing—review and editing, Y.F., S.D., K.F. and X.Z. All authors have read and agreed to the published version of the manuscript.
Funding
The work is funded by the National Key Research and Development Program of China (2021YFE0117100), the National Natural Science Foundation of China (42001327 and 41871372), and the China Postdoctoral Science Foundation (2019M660003 and 2020T130005).
Data Availability Statement
The data associated with this paper are available from the authors upon request.
Conflicts of Interest
The authors declare no conflict of interest.
References
- IPCC. Climate Change 2013: The Physical Science Basis. Contribution of Working Group I to the Fifth Assessment Report of the Intergovernmental Panel on Climate Change; Stocker, T.F., Qin, D., Plattner, G.-K., Tignor, M., Allen, S.K., Boschung, J., Nauels, A., Xia, Y., Bex, V., Midgley, P.M., Eds.; Cambridge University Press: Cambridge, UK; New York, NY, USA,, 2013.
- Walther, G.R.; Post, E.; Convey, P.; Menzel, A.; Parmesank, C.; Beebee, T.J.C.; Fromentin, J.M.; Hoegh-Guldberg, O.; Bairlein, F. Ecological responses to recent climate change. Nature 2002, 416, 389–395. [Google Scholar] [CrossRef] [PubMed]
- Pan, B.; Li, J. Qinghai-Tibetan Plateau: A driver and amplifier of the global climatic change. J. Lanzhou Univ. (Nat. Sci.) 1996, 32, 108–115. [Google Scholar]
- Yang, K.; Wu, H.; Qin, J.; Lin, C.; Tang, W.; Chen, Y. Recent climate changes over the Tibetan Plateau and their impacts on energy and water cycle: A review. Glob. Planet. Chang. 2014, 112, 79–91. [Google Scholar] [CrossRef]
- Liu, X.; Chen, B. Climatic warming in the Tibetan Plateau during recent decades. Int. J. Climatol. 2000, 20, 1729–1742. [Google Scholar] [CrossRef]
- Cai, D.; You, Q.; Fraedrich, K.; Guan, Y. Spatiotemporal temperature variability over the Tibetan Plateau: Altitudinal dependence associated with the global warming hiatus. J. Clim. 2017, 30, 969–983. [Google Scholar] [CrossRef]
- Pepin, N.; Lundquist, J. Temperature trends at high elevations: Patterns across the globe. Geophys. Res. Lett. 2008, 35, L14701. [Google Scholar] [CrossRef] [Green Version]
- Qiu, J. China: The Third Pole. Nature 2008, 454, 393–396. [Google Scholar] [CrossRef] [Green Version]
- Guo, D.; Wang, H. The significant climate warming in the northern Tibetan Plateau and its possible causes. Int. J. Clim. 2011, 32, 1775–1781. [Google Scholar] [CrossRef]
- Li, X. Characteristics of temperature and precipitation change on the Tibet Plateau under the background of global warming. Adv. Geosci. 2019, 9, 1042–1049. [Google Scholar] [CrossRef]
- Zeng, B.; Yang, T.B. Natural vegetation responses to warming climates in Qaidam Basin 1982–2003. Int. J. Remote Sens. 2009, 30, 5685–5701. [Google Scholar] [CrossRef]
- Li, L.; Chen, X.; Wang, Z.; Xu, W.; Tang, H. Climate change and its regional differences over the Tibetan Plateau. Adv. Clim. Chang. Res. 2010, 6, 181–186. [Google Scholar]
- Lan, C.; Zhang, Y.; Wu, Y.; Hou, M. Desertification affecting the Tibetan Plateau between 1971–2015: Viewed from a climate perspective. Land Degrad. Dev. 2020, 31, 1956–1968. [Google Scholar]
- Köppen, W. Grundriss der Klimakunde; Walter de Gruyter: Berlin, Germany, 1931. [Google Scholar]
- Geiger, R. Klassifikationen der Klimate nach W. Köppen. In Landolf-Börnstein: Zahlenwerte und Funktionen aus Physik, Chemie, Astronomie, Geophysik und Technik, (alte Serie); Springer: Berlin, Germany, 1954; Volume 3, pp. 603–607. [Google Scholar]
- Trewartha, G.T.; Horn, L.H. Introduction to Climate, 5th ed.; McGraw Hill: New York, NY, USA, 1980. [Google Scholar]
- Thornthwaite, C.W. The climates of North America according to new classification. Geogr. Rev. 1931, 21, 633–655. [Google Scholar] [CrossRef]
- Thornthwaite, C.W. An approach toward a rational classification of climate. Geogr. Rev. 1948, 38, 55–94. [Google Scholar] [CrossRef]
- Tu, C.; Kuo, S. Climatic regions of China according to Koeppen’s classification. Acta Meteorol. Sin. 1938, 4, 51–67. [Google Scholar]
- Karki, R.; Talchabhadel, R.; Aalto, J.; Baidya, S.K. New climatic classification of Nepal. Theor. Appl. Climatol. 2016, 125, 799–808. [Google Scholar] [CrossRef]
- Geng, Q.; Wu, P.; Zhang, Q.; Zhao, X.; Wang, Y. Dry/wet climate zoning and delimitation of arid areas of northwest china based on a data-driven fashion. J. Arid. Land 2014, 6, 287–299. [Google Scholar] [CrossRef] [Green Version]
- Unal, Y.; Kindap, T.; Karaca, M. Redefining the climate zones of turkey using cluster analysis. Int. J. Climatol. 2003, 23, 1045–1055. [Google Scholar] [CrossRef]
- Chen, B.; Pan, A.; Yang, M. Spatial and temporal characteristics and change trend of climatic elements of Qaidam Basin in recent 50 years. J. Arid. Land Resour. Environ. 2010, 5, 117–123. [Google Scholar]
- Wang, X.; Yang, M.; Liang, X.; Pang, G.; Wan, G.; Chen, X.; Luo, X. The dramatic climate warming in the Qaidam Basin, northeastern Tibetan Plateau, during 1961–2010. Int. J. Clim. 2014, 34, 1524–1537. [Google Scholar] [CrossRef]
- Netzel, P.; Stepinski, T. On using a clustering approach for global climate classification. J. Clim. 2016, 29, 3387–3401. [Google Scholar] [CrossRef]
- Bibi, S.; Wang, L.; Li, X.; Zhang, X.; Chen, D. Response of groundwater storage and recharge in the Qaidam Basin (Tibetan Plateau) to climate variations from 2002 to 2016. J. Geophys. Res. Atmos. 2019, 124, 9918–9934. [Google Scholar] [CrossRef]
- Fovell, B.; Fovell, M. Climate zones of the conterminous United States defined using cluster analysis. J. Clim. 1993, 6, 2103–2135. [Google Scholar] [CrossRef] [Green Version]
- He, J.; Yang, K.; Tang, W.; Lu, H.; Qin, J.; Chen, Y. The first high-resolution meteorological forcing dataset for land process studies over China. Sci. Data 2020, 7, 25. [Google Scholar] [CrossRef] [Green Version]
- Metzger, M.; Bunce, R.; Jongman, R.; Sayre, R.; Trabucco, A.; Zomer, R. A high-resolution bioclimate map of the world: A unifying framework for global biodiversity research and monitoring. Glob. Ecol. Biogeogr. 2013, 22, 630–638. [Google Scholar] [CrossRef] [Green Version]
- Zhang, X.; Yan, X. Spatiotemporal change in geographical distribution of global climate types in the context of climate warming. Clim. Dyn. 2014, 43, 595–605. [Google Scholar] [CrossRef]
- Zscheischler, J.; Mahecha, M.; Harmeling, S. Climate classifications: The value of unsupervised clustering. Procedia Comput. Sci. 2012, 9, 897–906. [Google Scholar] [CrossRef] [Green Version]
- Ball, G.; Hall, J. ISODATA, a Novel Method of Data Analysis and Pattern Classification; Stanford Research Institute: Menlo Park, CA, USA, 1965. [Google Scholar]
- Memarsadeghi, N.; Mount, D.M.; Netanyahu, N.S.; Moigne, J.L. A fast implementation of the ISODATA clustering algorithm. Int. J. Comput. Geom. Appl. 2007, 17, 71–103. [Google Scholar] [CrossRef]
- Brown, L.C.; Duguay, C.R. The response and role of ice cover in lake-climate interactions. Prog. Phys. Geogr. 2010, 34, 671–704. [Google Scholar] [CrossRef]
- Woolway, R.I.; Kraemer, B.M.; Lenters, J.D.; Merchant, C.J.; O’Reilly, C.M.; Sharma, S. Global lake responses to climate change. Nat. Rev. Earth Environ. 2000, 1, 388–403. [Google Scholar] [CrossRef]
- Zhang, G. The Lakes Larger than 1 km2 in Tibetan Plateau (V3.0) (1970S–2021); National Tibetan Plateau Data Center: Beijing, China, 2019. [Google Scholar] [CrossRef]
- Budyko, M.I. Climate and Life; Academic Press: New York, NY, USA, 1974. [Google Scholar]
- Fraedrich, K.; Sielmann, F.; Cai, D.; Zhu, X. Climate dynamics on watershed scale: Along the rainfall-runoff chain. In The Fluid Dynamcis of Climate, International Centre for Mechanical Sciences (CISM); Springer: Berlin/Heidelberg, Germany, 2016; pp. 183–209. [Google Scholar]
- Holland, H.D. The Chemistry of the Atmosphere and Oceans; Wiley: New York, NY, USA, 1978. [Google Scholar]
- Gordon, L.J.; Steffen, W.; Jönsson, B.F.; Folke, C.; Falkenmark, M.; Johannessen, A. Human modification of global water vapor flows from the land surface. Proc. Natl. Acad. Sci. USA 2005, 102, 7612–7617. [Google Scholar] [CrossRef] [PubMed] [Green Version]
- Fraedrich, K. A minimalist model of terminal lakes: Qinghai Lake (China) and Lake Chad (N-Africa). Hydrol. Res. 2015, 46, 222–231. [Google Scholar] [CrossRef]
- Alcott, T.I. Environmental and Orographic Influences on Great Salt Lake-Effect Precipitation. Ph.D. Thesis, The University of Utah, Salt Lake City, UT, USA, 2012. [Google Scholar]
- Fraedrich, K. A simple climatological model for the dynamics and energetics of the nocturnal circulation at Lake Victoria. Q. J. R. Meteorol. Soc. 1972, 98, 322–335. [Google Scholar] [CrossRef]
- Wei, C. Analysis of the Area Change and Driving Force of Dabson Lake. Ph.D. Thesis, Xi’an University of Science and Technology, Xi’an, China, 2019. [Google Scholar]
- Wang, X. Area Change and the Evaporation Estimation of Dabson Lake in Qinghai Province. Ph.D. Thesis, China University of Geosciences, Beijing, China, 2019. [Google Scholar]
Publisher’s Note: MDPI stays neutral with regard to jurisdictional claims in published maps and institutional affiliations. |
© 2022 by the authors. Licensee MDPI, Basel, Switzerland. This article is an open access article distributed under the terms and conditions of the Creative Commons Attribution (CC BY) license (https://creativecommons.org/licenses/by/4.0/).