Abstract
Air pollution is considered one of the most significant risk factors for human health. To ensure air quality and prevent and reduce the harmful impact on human health, it is necessary to identify and measure the main air pollutants (sulfur and nitrogen oxides, PM10 and PM2.5 particles, lead, benzene, carbon monoxide, etc.), their maximum values, as well as the impact they have on mortality/morbidity rates caused by respiratory diseases. This paper aims to assess the influence of air pollution on respiratory diseases based on an analysis of principal pollutants and mortality/morbidity data sets. In this respect, four types of data are used: pollution sources inventory, air quality data sets, mortality/morbidity data at the local and national level, and clinical data of patients diagnosed with different forms of lung malignancies. The results showed an increased number of deaths caused by respiratory diseases for the studied period, correlated with the decreased air quality due to industrial and commercial activities, households, transportation, and energy production.
1. Introduction
Air pollution represents the principal risk to human health. In 2021, European Commission adopted the EU Action Plan called “Towards a zero pollution for air, water, and soil”. The main objective is to improve the air quality and reduce the premature mortality caused by air pollution by 55% [1].
Several studies have demonstrated the adverse effects of air pollution on the environment and human health, especially on respiratory diseases. In 2018, Dumitru et al. [2] published a retrospective study on the influence of air pollution over the respiratory infections in Romania, covering a period of ten years. Similar studies were developed in different countries and for different periods of time: Rodríguez-Villamizar et al. [3] studied the influence of air pollution on respiratory and circulatory morbidity in Colombia, Nhung et al. [4] in Hanoi, the capital city of Vietnam, while Al-Taani et al. [5] and Nazzal et al. [6,7] focused their research in Sharjah and Ajman Emirates (UAE). Dastoorpoor et al. [8] studied the short-term effects of air pollution in Iran while Stafoggia et al. [9] conducted similar research for the Southern Europe. Carlsten et al. [10] recommended several strategies to minimize personal exposure to ambient air pollution, while Barbulescu et al. [11,12] used statistical methods for modeling and assessing the influence of different pollutants. According to Eurostat [13], 339,000 deaths were caused by respiratory diseases in EU-27, an equivalent of 75 death per 100,000 habitants (SDR–Standardized Death Rate). EEA (European Environment Agency) reported in 2020 that air pollution caused 400,000 premature deaths in Europe [14]. In a recent study, Schraufnagel et al. [15,16] demonstrated that air pollution can affect the respiratory tract and every organ in the body.
To secure the air quality, and prevent and reduce harmful impact on human health, the Directive 2008/50/EC [17] sets some measures: (i) quality standards under which the quality evaluation is based on threshold values of different pollutants such as sulfur dioxide, nitrogen dioxide and oxides of nitrogen, particulate matter (PM10 and PM2.5), lead, benzene and carbon monoxide; (ii) establishment of air quality management and evaluation area are mandatory for all member states and (iii) improving health.
Even if Romania has registered progress in reducing the emissions of pollutants during the 1990–2016 period, the air quality represents a significant concern and the authority shall endeavor to achieve the new limits proposed in the new Directive 2016/2284/UE [18]. Statistics from Eurostat [13] shows that Romania had an SDR greater than the EU-27 average in 2017 for all diseases associated with respiratory function (Table 1). At the same time, from the analysis concerning the average length of hospital stays for in-patients treated for respiratory disease, results show that in Romania, the average hospital stay in 2018 is 6.7 days, less than the EU-27 average (7.0). Asthma patients spent a highest number of days in hospital (7.9 days), more than the EU average. EEA estimated for 2018 that 29,200 premature deaths in Romania are due to particulate matter and NO2 concentrations, representing 6.5% of EU-27 countries [19]. According to with European Public Health Alliance report [20], Romania has the highest cost per capita caused by air pollution (1810 euros/capita).

Table 1.
Standardized death rates—respiratory disease (2017).
Currently, the most quality air index used in Europe is CAQI (Common Air Quality Index), calculated on a three-time level (hourly, daily and annual) developed under the project CITEAIR [21]. The pollutants used in CAQI evaluation are CO (Carbone monoxide), NO2 (Nitrogen Dioxide), O3 (Ozone), SO2 (Sulfur dioxide), PM2.5 (Fine Particle Matter), and PM10 (Particle Matter). This index does not have the flexibility to aggregate all the pollutants [14]; the air quality is given by the worst value of the contaminants included in the determination. Stieb [22] introduced a new index, AQHI (Air Quality Health Index), based on the “sum of excess mortality risk associated with individual pollutants.” Olstrup [23] calculated this index for Stockholm during 2015–2017 and concluded that it could be an efficient tool to estimate air quality based on the combined effect of multiple pollutants. Still, the meta coefficient is available only for a local AQHI evaluation. In a recent review, the authors [20] investigated 19 methods for AQHI evaluation and concluded that most of them could not include in the estimation a new pollutant whether it’s designed for a specific number of contaminants or the aggregation function has not the possibility to aggregate a new pollutant.
In this context, this paper aims to assess the influence of air pollution on respiratory diseases based on an analysis of principal pollutants and mortality/morbidity data sets. The main primary histopathological forms of lung malignancies are analyzed, including their association with environmental factors and the primary pollutants [1,2].
2. Materials and Methods
2.1. Study Data
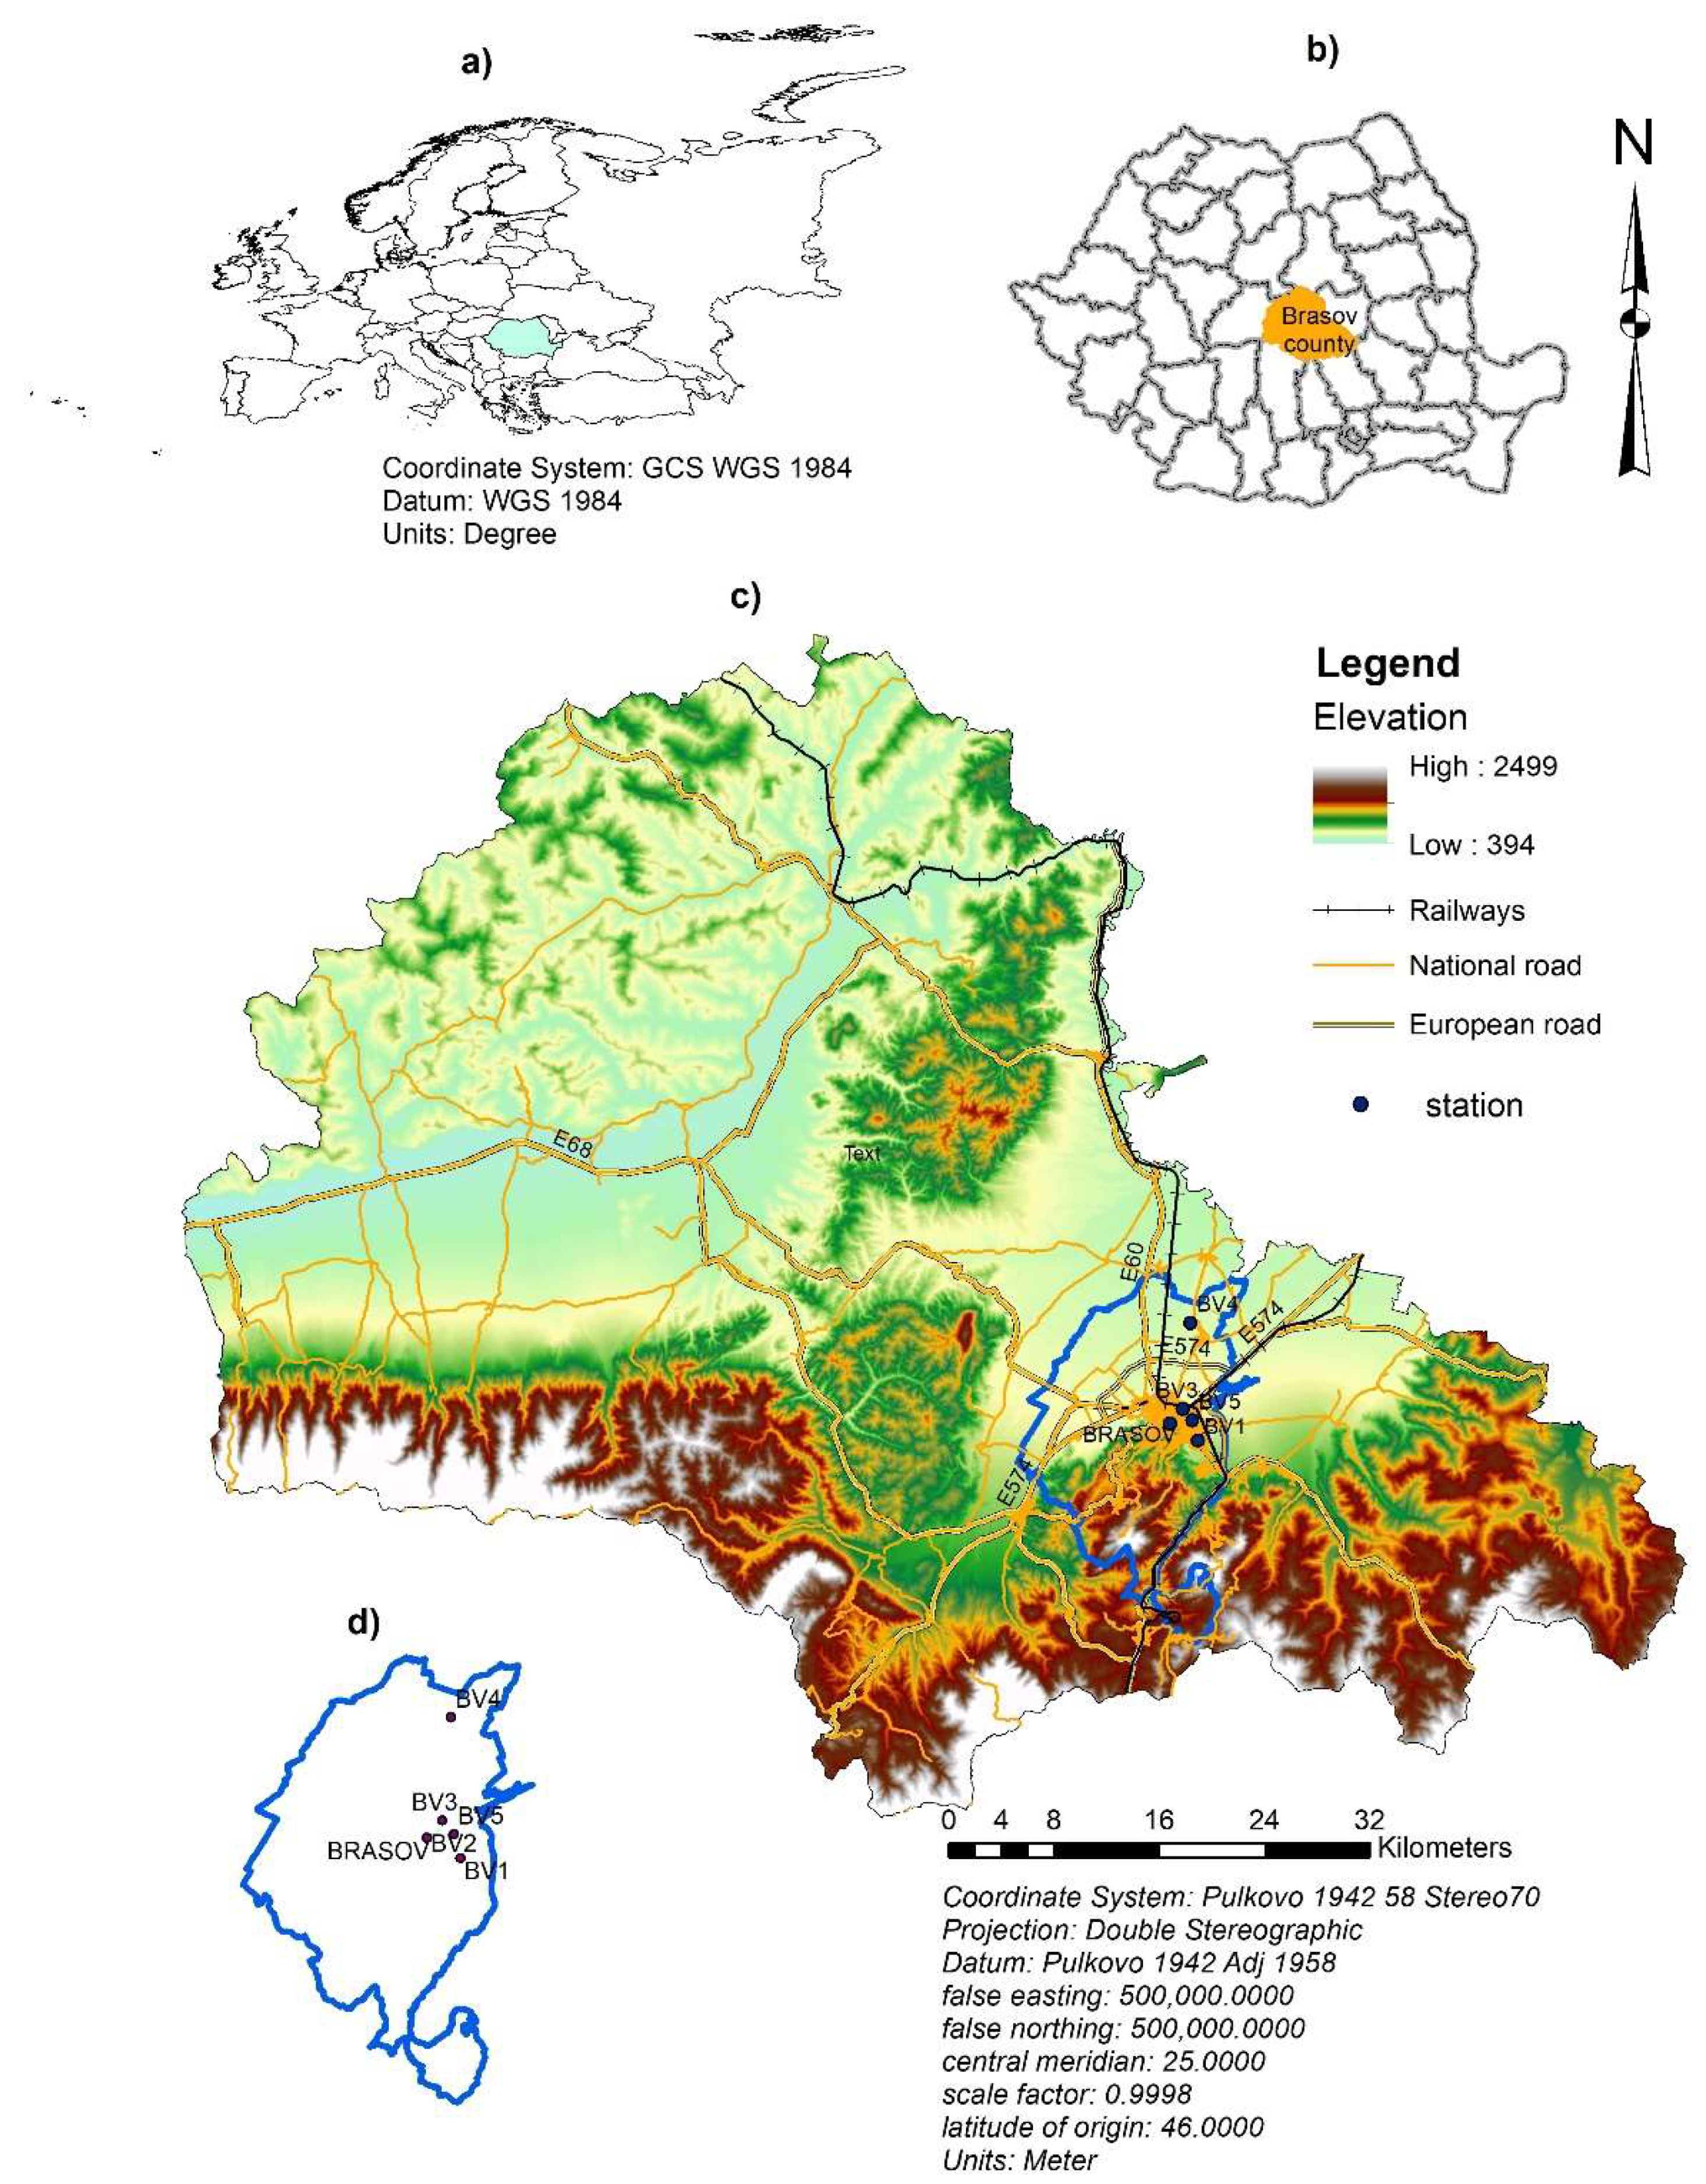
Brasov County is situated in the center part of Romania (Figure 1) at 45°38′ north latitude and 25°35′ east longitude. The elevation increases from north to south (Figure 1). The region is located at the junction of three large natural units: the Eastern Carpathians and the Southern Carpathians, some places exceeding 2000 m, and Transilvania Plateau. The average altitude is 625 m. The climate is temperate with 8.8 °C multiannual average temperature, and annual precipitation is around 654 mm.

Figure 1.
Location of Brasov County and air quality measurement stations: (a) map of Europe and the border of Romania; (b) map of Romania and the border of Brasov County; (c) relief, roads and railways traffic map of Brasov County and the location of monitoring stations; (d) Brasov metropolitan area.
The land use distribution is 52% agricultural and 48% non-agricultural, from which 38% are represented by forests.
From an administrative point of view, Brasov County is a part of the Center Development Region and has 58 localities with a population of 627,597 (according to 2011 census). The public road network of Brasov County has a length of 1659 km. It should be mentioned that Brasov is crossed by the European Corridor 4 and the European road E 60 (Figure 1). Brasov County has a railway network with a total length of 353 km, of which 184 km is electrified. Currently, an airport is under construction. In Brasov County, the machine-building industry, the metal processing industry, the pharmaceutical, food, and wood processing industry, and the field of construction, transport, and services have developed. Brașov has a long tradition in tourism, being the most popular ski and winter sports destination in Romania and the resorts in the Prahova Valley.
2.2. Data and Methodology Used
Four types of data are used in this study: pollution sources inventory, air quality data sets, data about mortality/morbidity at the Brasov County level, and clinical data of patients diagnosed histopathologically in Sacele Brasov Municipal Hospital.
Air quality data sets are obtained from the National/Local network of quality Air Monitoring (RLMCA Brasov). The air quality is monitored in five automatic stations in urban, suburban, and industrial areas (Figure 1 and Table 2). The sixth station is a reference station for air quality assessment situated in the mountain area (EMI-Fundata station). The period investigated is 2016–2020, and daily time series data are used. Notice that the Air Quality Monitoring National System was establish in 2011 by Law no 104, which transpose in national legislation Directive 2008/50/CE and 2004/107/CE provisions.
Table 2.
Monitoring stations in Brasov.
SDR and morbidity annually data are obtained from National Institute of Public Health. The clinical data were obtained from Sacele Brasov Municipal Hospital, Pathology Department.
The methodology used in this paper refers to:
- Understanding pollution sources; to achieve this analysis, we investigated the pollution inventory recorded by the Environment Pollution Agency of Brasov (APM) during 2016–2020. The objective of this activity is to identify the principal economic activity responsible for pollution in Brasov County and the prevalent pollutants that contribute to air quality reduction.
- Analysis of mortality/morbidity data; the objective of this analysis is to identify the mortality/morbidity caused by respiratory disease and its evolution.
- Analysis of the current status of principal air quality data and air quality index assessment. The analysis consists of (i) descriptive statistics to establish the frequency of occurrence for each pollutant and station; (ii) air index calculation based on daily, monthly, and annual data sets. For each daily value and pollutant is assigned a scale from “1”, excellent, to “6” severe with respect to the calculation grid [24]. The aggregated air quality index is calculated using the worst value of all pollutants used for each station.
- Analysis of clinical data of patients diagnosed with primary lung malignancies; the patient’s ages, sex, and domicile were quantified to identify a correlation between pollutants and histological forms of cancer. The diagnosed tissue specimens came from the thoracic Surgery Clinic of the Brasov Military Hospital’s surgery rooms and the Pneumoftiziology Clinic of the Respiratory Diseases Hospital Brasov. Thus, tumorectomies, lung specimens (lobes, segments), endobronchial biopsies, pleural fluids, aspirates, and bronchial lavages were diagnosed. The histopathological specimens were subjected to pathological processing techniques (fixation in 10% buffered formalin, dehydration, and paraffin impregnation by automatic processing, sectioning, staining of sections by hematoxylin-eosin stain. The examined liquids were centrifuged, the sediment being examined both directly and in Papanicolaou and Giemsa staining, and by inclusion in paraffin, in the form of a cytoblock prepared with neutral proteins. For histological confirmation of the microscopic diagnosis, immunohistochemistry was performed, using the panel of mom and polyclonal antibodies specific to primary lung malignancies (TTF1 clone SP141, Napsin A clone MRQ-60, anti-p40 clone BC28, Anti-Pan Keratin clone AE1/AE3/PCK26). Immunohistochemistry was performed automatically using Benchmark Ventana Gx equipment. The microscopic study was performed using a Zeiss Primo Star microscope and capturing images from the paper was performed using an AxioCam 105 color microscopy camera. The Pathology Department owns the medical equipment. To establish the post-surgical treatment, some specimens, depending on the tumor stage, were investigated by molecular biology techniques to develop the prognostic factors.
3. Results
3.1. Analysis of Pollution Sources
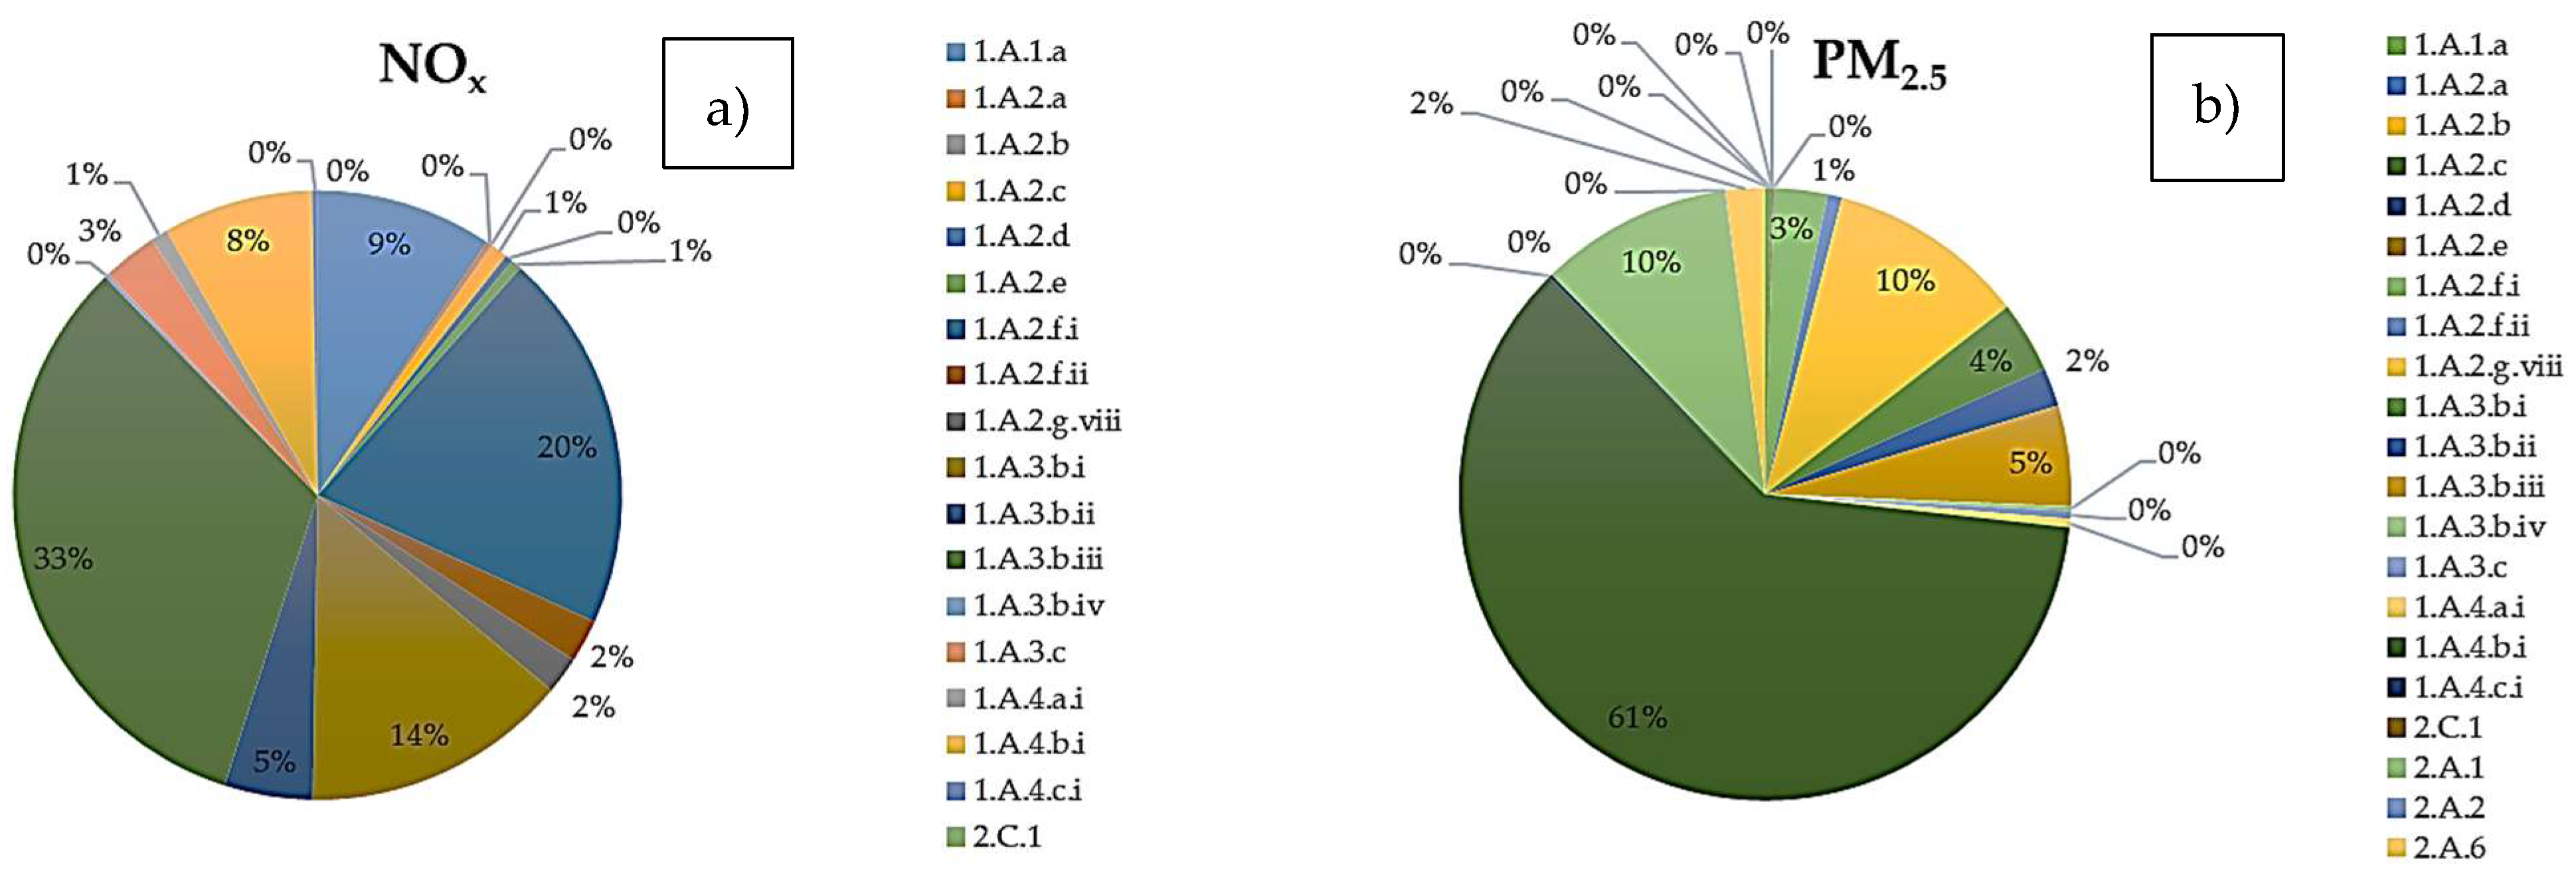
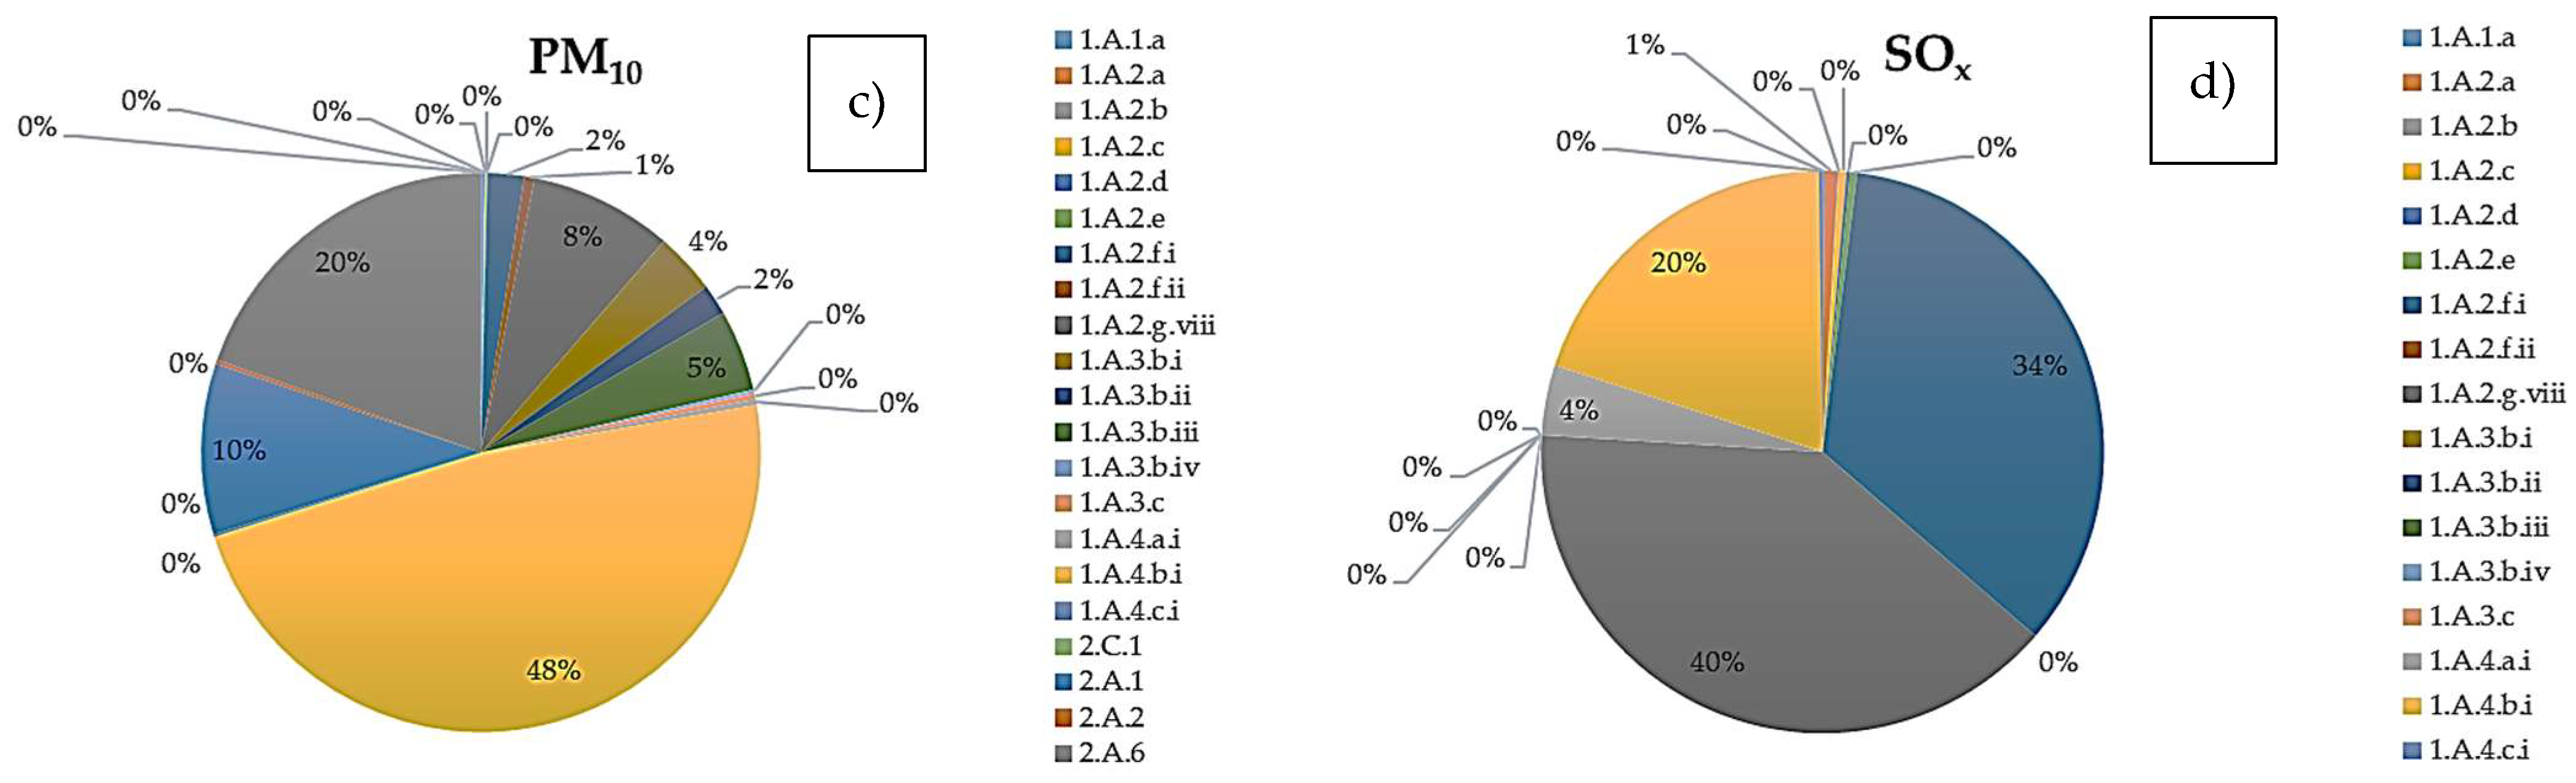
The analysis of pollution sources was based on the emission of pollutants inventory recorded by APM (Environment Pollution Agency) of Brasov during the 2016-2020 period and it is presented in Table 3. Figure 2 shows the distribution of PM2.5 and PM10, NOx, and SOx on activities type. As example, 61% of PM2.5 and 48% of PM10 emitting, respectively, are produced by households (1.A.4.b.i), followed by asphalting works (2.A.6), transport activity (1.A.3.b.i, 1.A.3.b.ii, 1.A.3.b.ii, 1.A.3.b.iv and 1.A.3.c) and cement production (2.A.1). The codes in brackets comply with NFR (Nomenclature for Reporting) code [25]. It can be concluded that the main sectors contributing to the emission of air pollutants in Brasov are: commercial, institutional, and households, transport (road and rail), industrial processes, and energy production and distribution (Table 3). Metal production (iron and steel production) is under 1%.
Table 3.
Industrial sectors contributing to emission of air pollutants in Brasov.

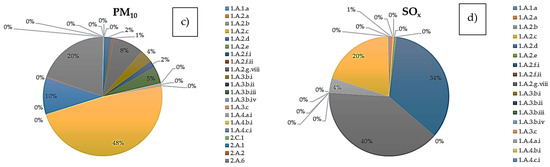
Figure 2.
Distribution of principal pollutant emitting. (a) NOx; (b) PM2.5; (c) PM10; (d) SOx; in respect with NFR code. Legend: 1.A.1.a-Public electricity and heat production; 1.A.2.a Combusting in manufacturing industry -iron and steel; 1.A.2.b-Combusting in manufacturing industry- nonferrous metal; 1.A.2.c Combusting in manufacturing industry-chemical; 1.A.2.d-Combusting in manufacturing industry-; 1.A.2.e Combusting in manufacturing industry -food, drink and tobacco; 1.A.2.f.i-Combusting in manufacturing industry-nonferrous mineral 1.A.2.f.ii-Combusting in manufacturing industry –mobile equipment and machinery; 1.A.2.g.viii-Stationary combustion in manufacturing industry and construction; 1.A.3.b.i-Road transport, passenger cars; 1.A.3.b.ii-Road transport, light duty vehicles; 1.A.3.b.iii-Road transport Heavy duty vehicles; 1.A.3.b.iv-Road transport, mopeds and motorcycles; 1.A.3.c-Railways; 1.A.4.a.i-Comercial hold; 1.A.4.b.i-Household residential; 1.A.4.c.i-Agriculture/Forestry/Fishing; 2.C.1-Iron and steel production; 2.A.1-Cement production; 2.A.2-Lime production; 2.A.6-Road paving with asphalt.
3.2. Analysis of SDR and Morbidity Data Sets
This analysis is carried out based on data sets of the National Institute of Statistics [26] and the National Institute of Public Health (INSP) during the 1990–2020 period. According to INSP, the main causes of death in Romania, in descending order, are the disease of the circulatory systems, malignant tumors, respiratory system, and digestive system diseases. Of these, the deaths caused by the respiratory disease are investigated, the leading cause of death from the respiratory illness being primary lung malignancy.
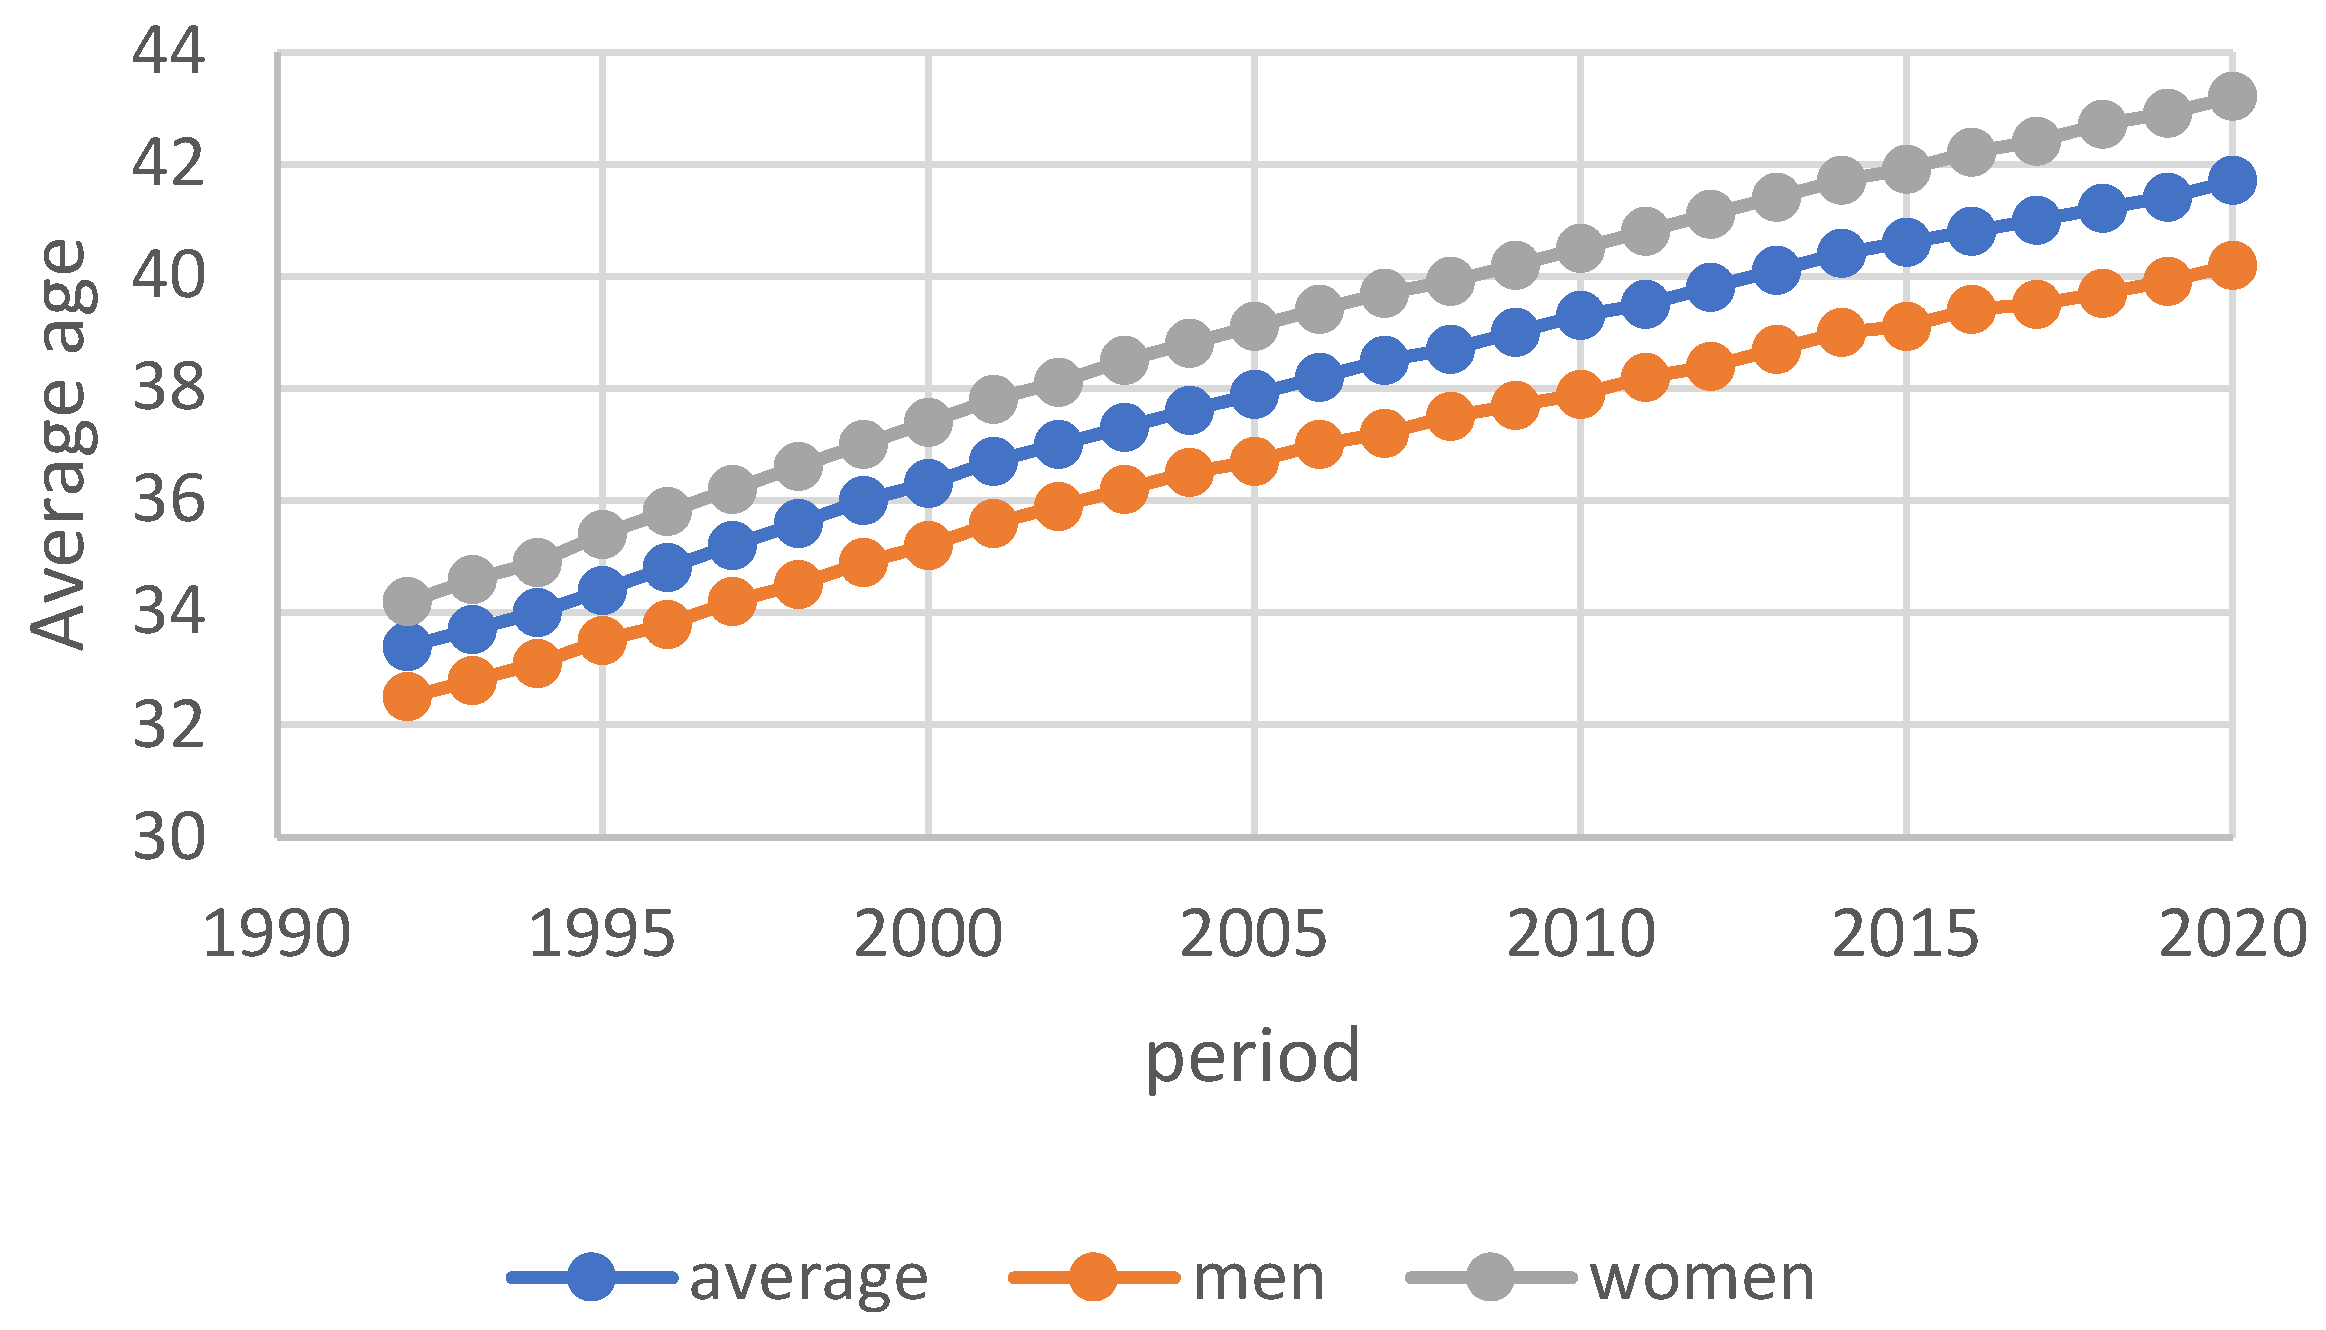
The population of Brasov County is 627,597and the average age of the population is 37.4 years (36.7 for men and 39 for women), continuing to increase (Figure 3).
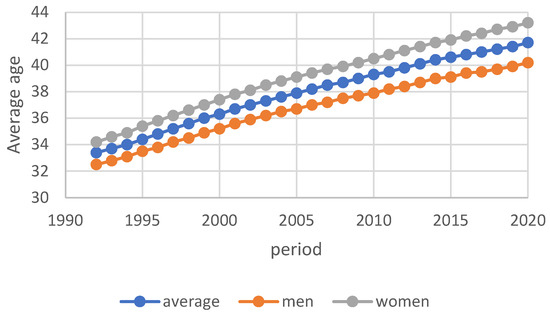
Figure 3.
Evolution of average age for the investigated period.
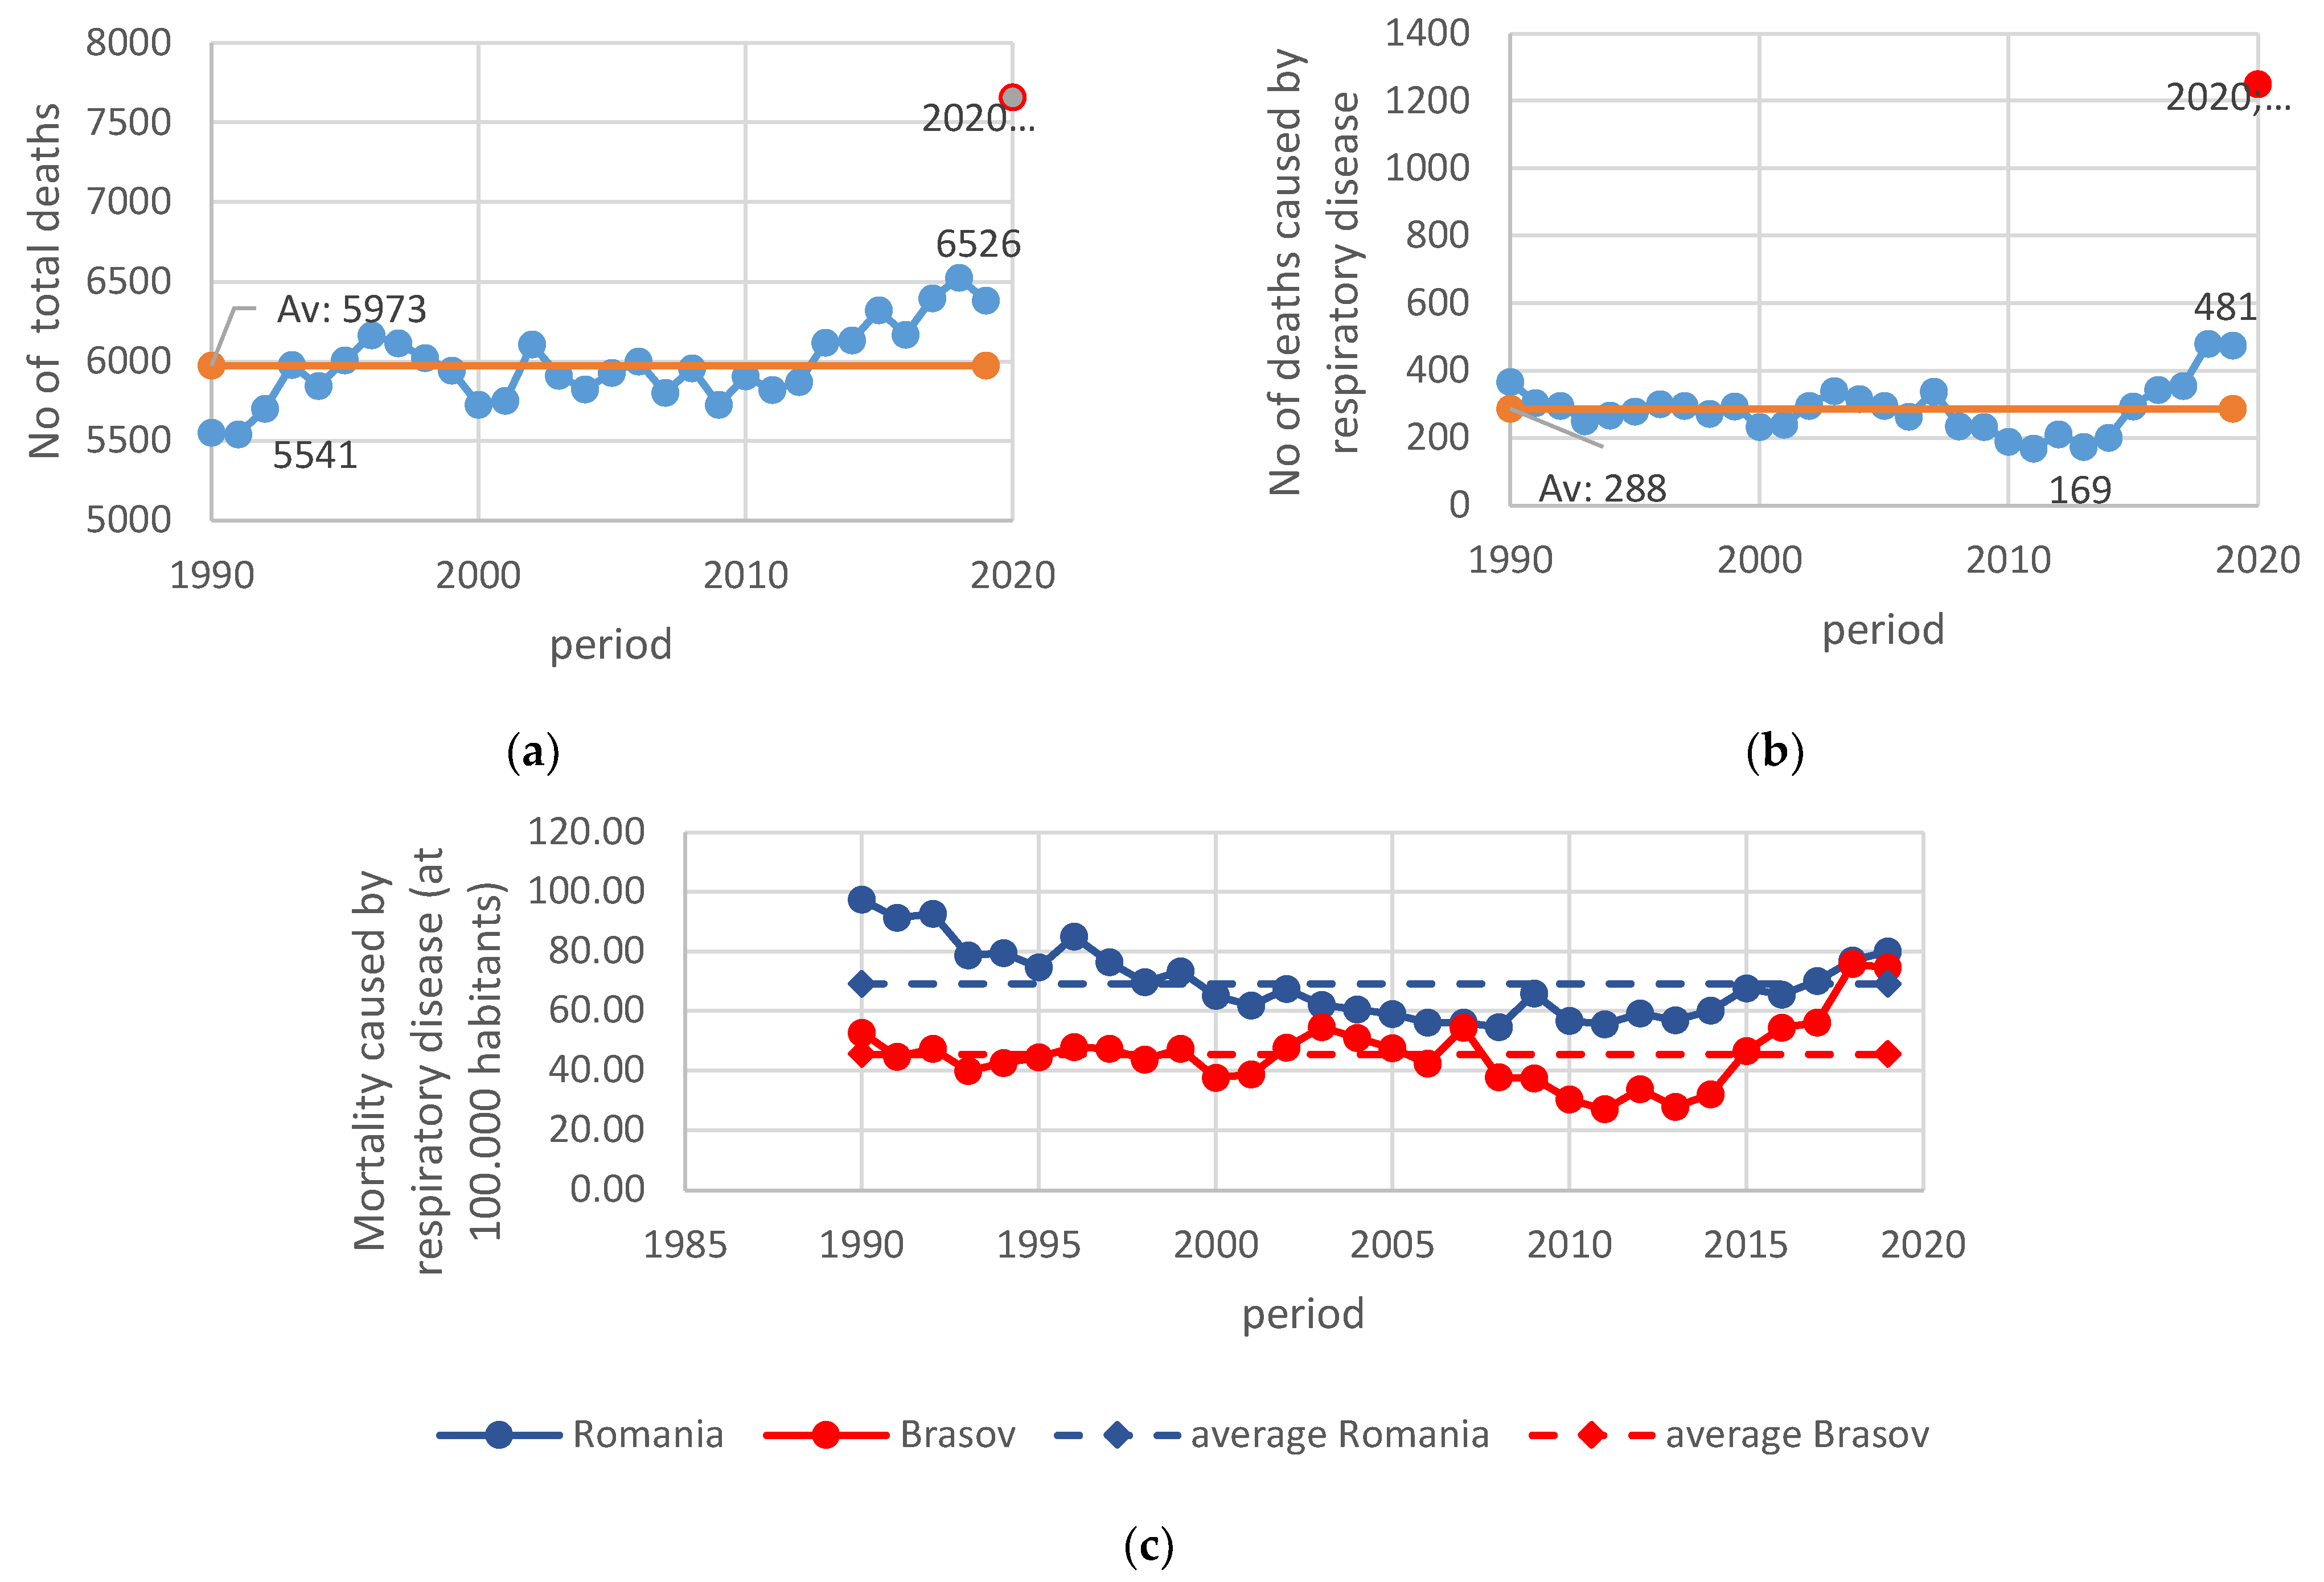
Several deaths in Brasov County are presented in Figure 4. As can be noted, the number of deaths varies from a minimum of 5541 to a maximum of 6526, the average being 5973 people (Figure 4a) and representing 9% of the population, on average. However, more important is that starting with 2013, the number of deaths exceeded the multiannual average (5973 people). Similar behavior can be noticed in the evolution of the number of deaths caused by respiratory disease (Figure 4b). During the 1990–2008 period, the values vary near the average; after 2008, the values decreased, and starting with 2014, an increase can be observed, reaching a value of 481 in 2019. Moreover, the number of deaths caused by respiratory disease represents 4.8% of the total number of deaths in Brasov County. The 2020 data were discarded from this analysis because they are temporarily affected by COVID-19 (Figure 4a,b in red).
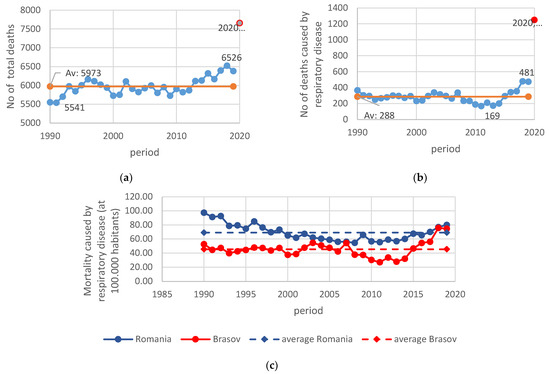
Figure 4.
The evolution of the number of deaths and SDR in Brasov County (a) Number of total deaths; (b) Number of deaths caused by respiratory diseases; (c) SDR caused by respiratory diseases.
The standardized Death Rate (SDR) caused by respiratory diseases during the investigated period is presented in Figure 4c. During the 1990–2008 period, a decrease in SDR can be observed at the national level (blue line—Figure 4c). More than that, in the period between 2000 and 2016, the SDR is under the multiannual average (69.14 deaths at 100,000 habitants). Starting with 2018–2019, this index is increasing. On the contrary, the evolution of the same parameter for Brasov Country (red line—Figure 4c) is different, and the period investigated could be divided into three sections (i) 1990–2006—there are no significant variations from the multiannual SDR average (45.5); (ii) 2007–2014 when the values of SDR are 0.6 to 1.2 times under the multiannual average and (iii) 2015–2019 when the values are increasing, reaching the national value in 2018 (75.73).
The most common diseases in neoplasm mortality is malignant neoplasm of bronchus and lungs [27]. In Brasov County, SDR caused by tumors is increasing; starting with 2005, the SDR value is over the multiannual average. Unfortunately, there is no information concerning the number of deaths caused by malignant neoplasm of the bronchus and lungs.
There are few data concerning the morbidity at Brasov County-level caused by respiratory disease. INSP communicates several healthy profile statuses starting with 2014 generally based on official statistics. Starting with 2017, three kinds of morbidity index are calculated: incidence rate (number of new cases at 100,000 habitants), prevalence rate (number of cases of a disease existing in a population), and hospitalized morbidity. The data are presented below (Table 4).
Table 4.
Morbidity for Brasov County per 100,000 habitants according to INSP data.
Due to this lack of data, we could not draw any conclusions. The morbidity rate for malign tumors, including neoplasm of the bronchus and lungs, is decreasing (except for the value for hospitalized morbidity in 2019). The prevalence for COPD morbidity is increasing, while the hospitalized morbidity is decreasing. Asthma incidence is rising.
3.3. The Current Status of Principal Air Quality Data
As previously stated, the air quality index is monitored at six stations from which one is situated at above 1000 m altitude, and it is a regional station.
Table 5 presents some statistical information on the daily values monitored. Generally, the values registered vary in significant limits. The standard daily limits for NOx and PM2.5 (50 mg/m3) exceed 67% of cases during the investigated period, while the SO2 values are under the standard daily limit (125 mg/m3). The values of PM10 exceed the level of 50 mg/m3 in 14% of cases (on average). It is known that the number of daily averages above the standard limit for PM10 must not exceed 35 days in a year [23]. This analysis has highlighted that, on average, this limit is exceeded for BV2 and BV3 stations (43 and 72 days, respectively). For BV4, which is situated in a suburban area, the value is not exceeded.
Table 5.
Statistical analysis of daily principal pollutants investigated.
The values measured at the EMI station do not exceed the standard limit, but the number of observations is under 500 values (less than 100 observations per year). For this reason, we decided to continue the analysis without this station. PM2.5 values are measured only on the BV2 station.
Based on the daily average, for the investigated period (2016–2020), the NOx index of frequency of occurrence is presented in the following table (Table 6).
Table 6.
NOx index frequency of occurrence.
For the BV4 station situated in a residential area, the criterion is excellent, with a 94% frequency of occurrence. For BV3 located in a heavy traffic area, the index is 11% frequency of occurrence for excellent criterion (Table 6). Similarly, the frequency of occurrence is calculated for each pollutant and station. Similar behavior was observed.
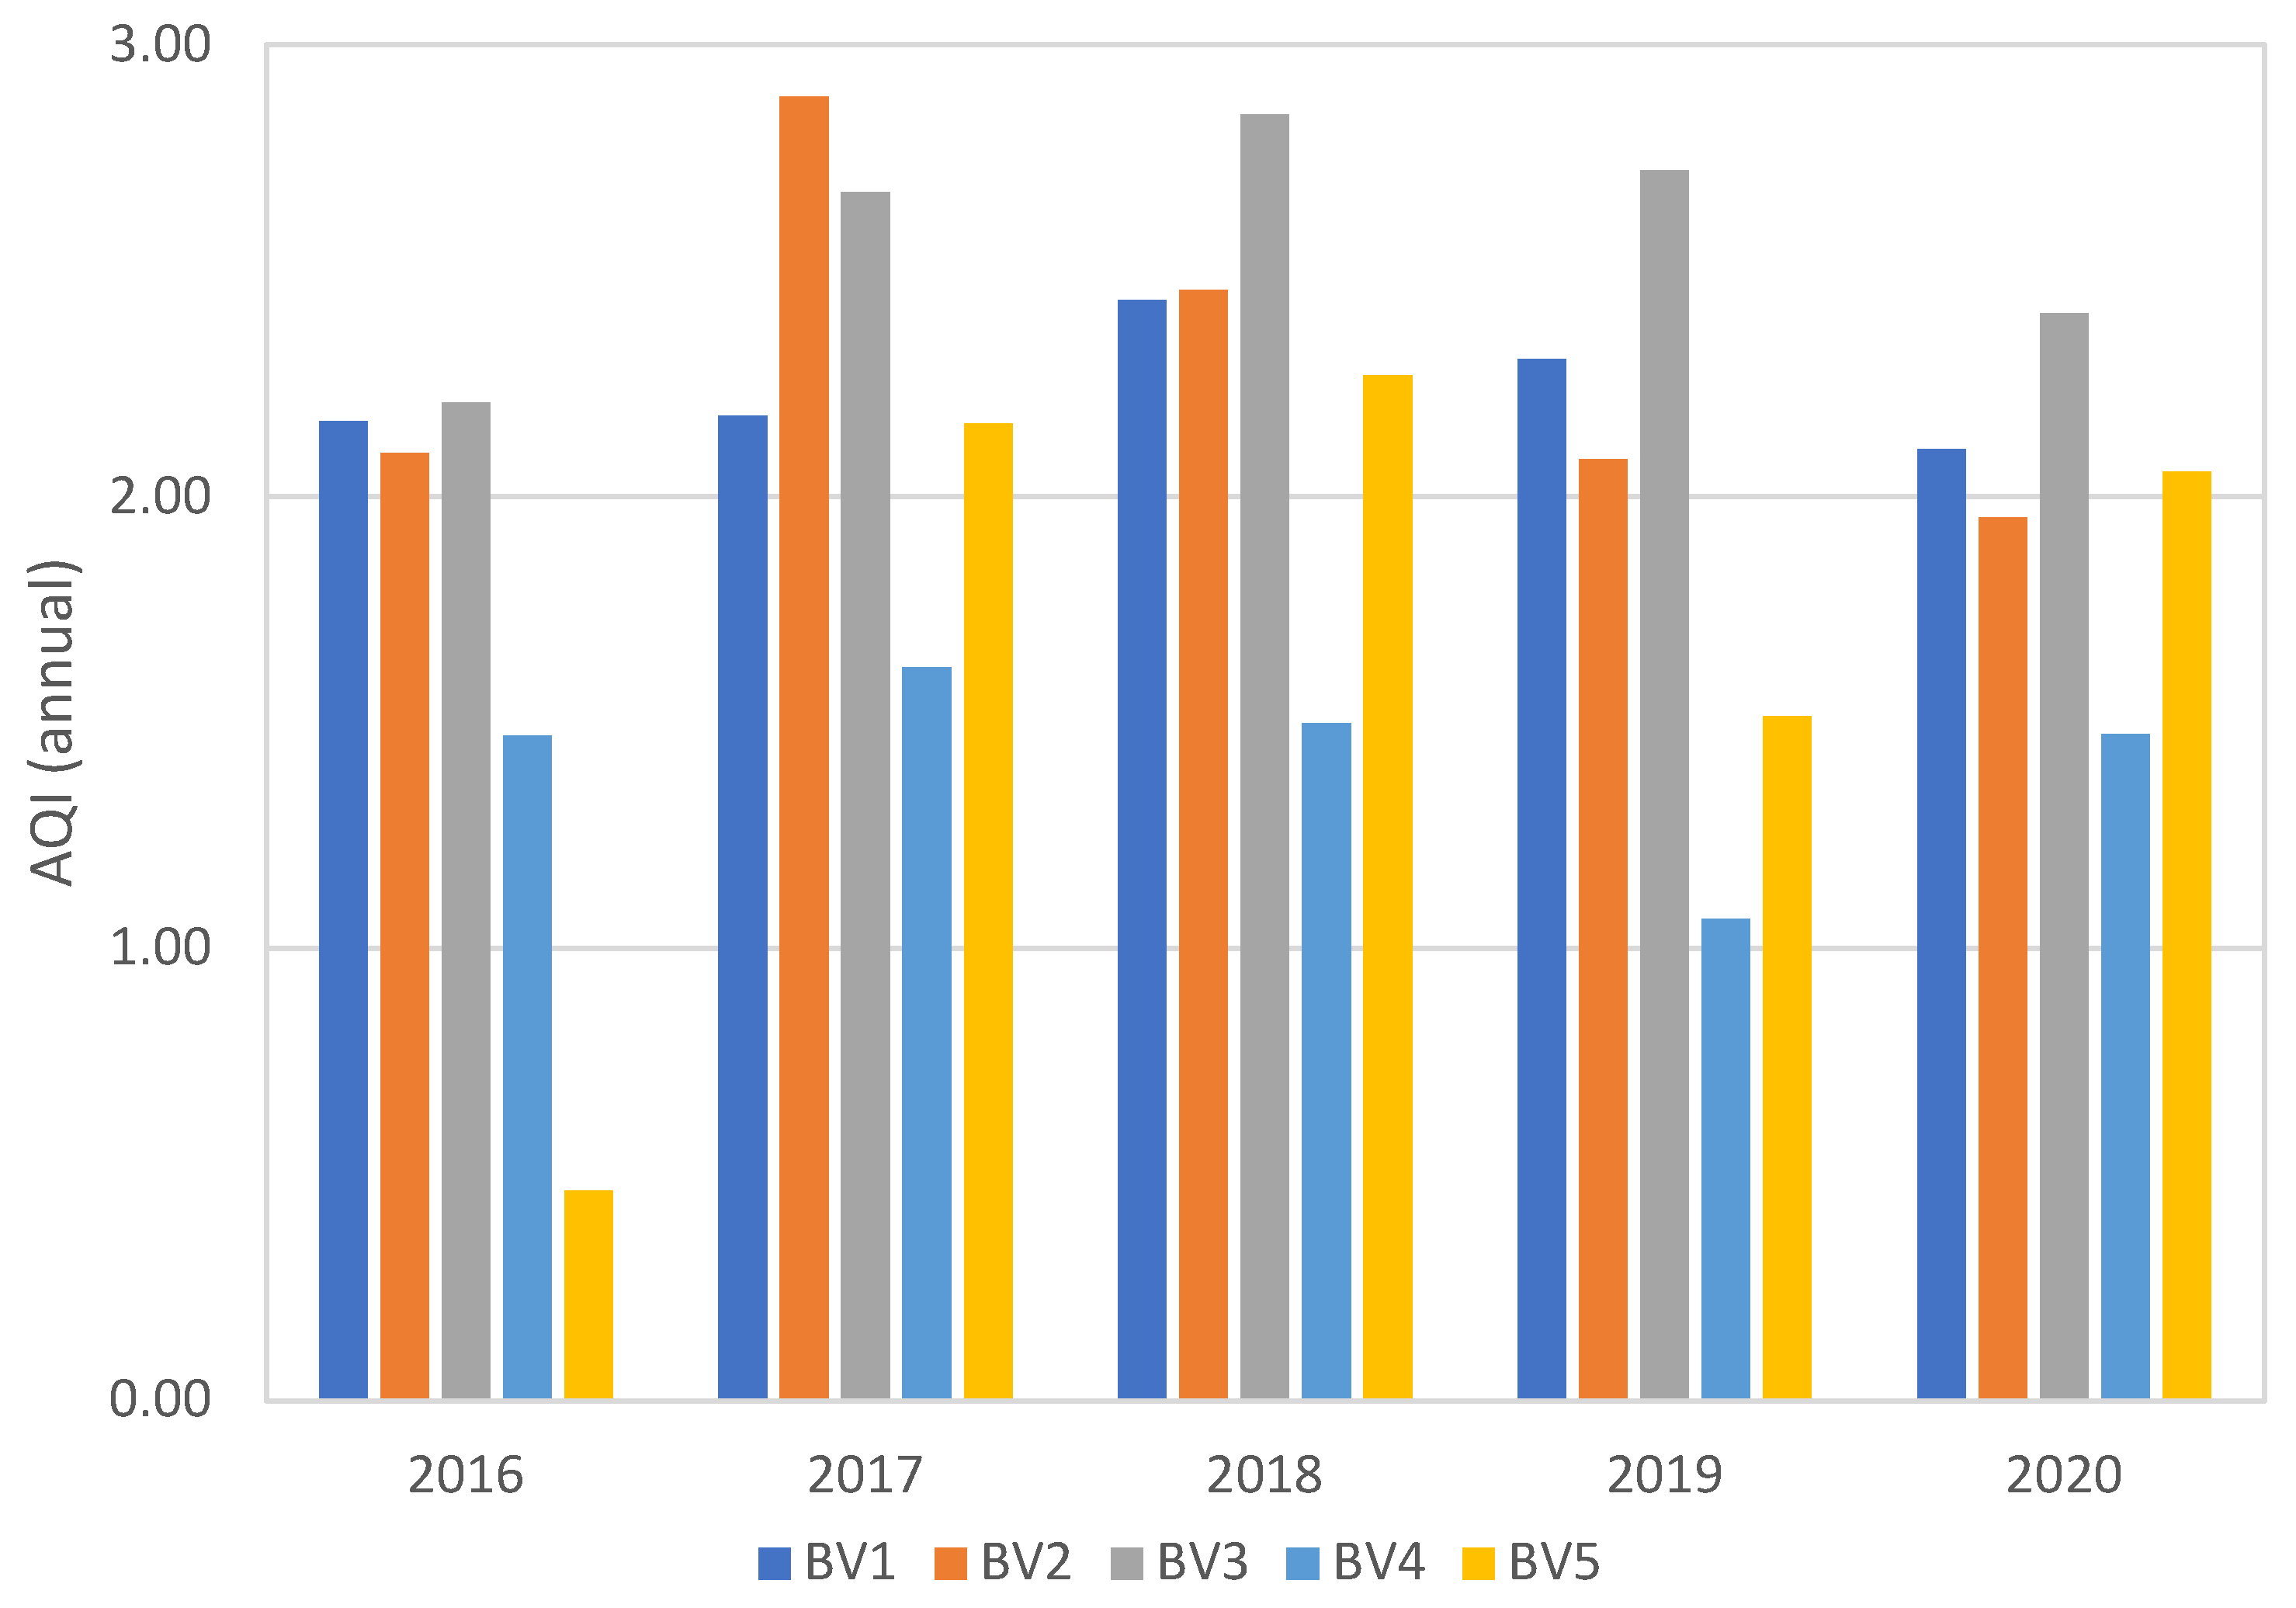
The aggregated air quality index (AQI) is calculated (Figure 5). The overall index is between “fine” (2) and “moderate” (3) for each station investigated and each year, with several exceptions (BV5 in 2016) due to lack of data for PM10 and BV4 situated in suburban area. For BV4, the index is between “excellence” and “fine.”

Figure 5.
Aggregated Air Quality Index for each station.
There are also “severe” (6) and “very poor” (5) levels registered generally in the winter period or/and late autumn.
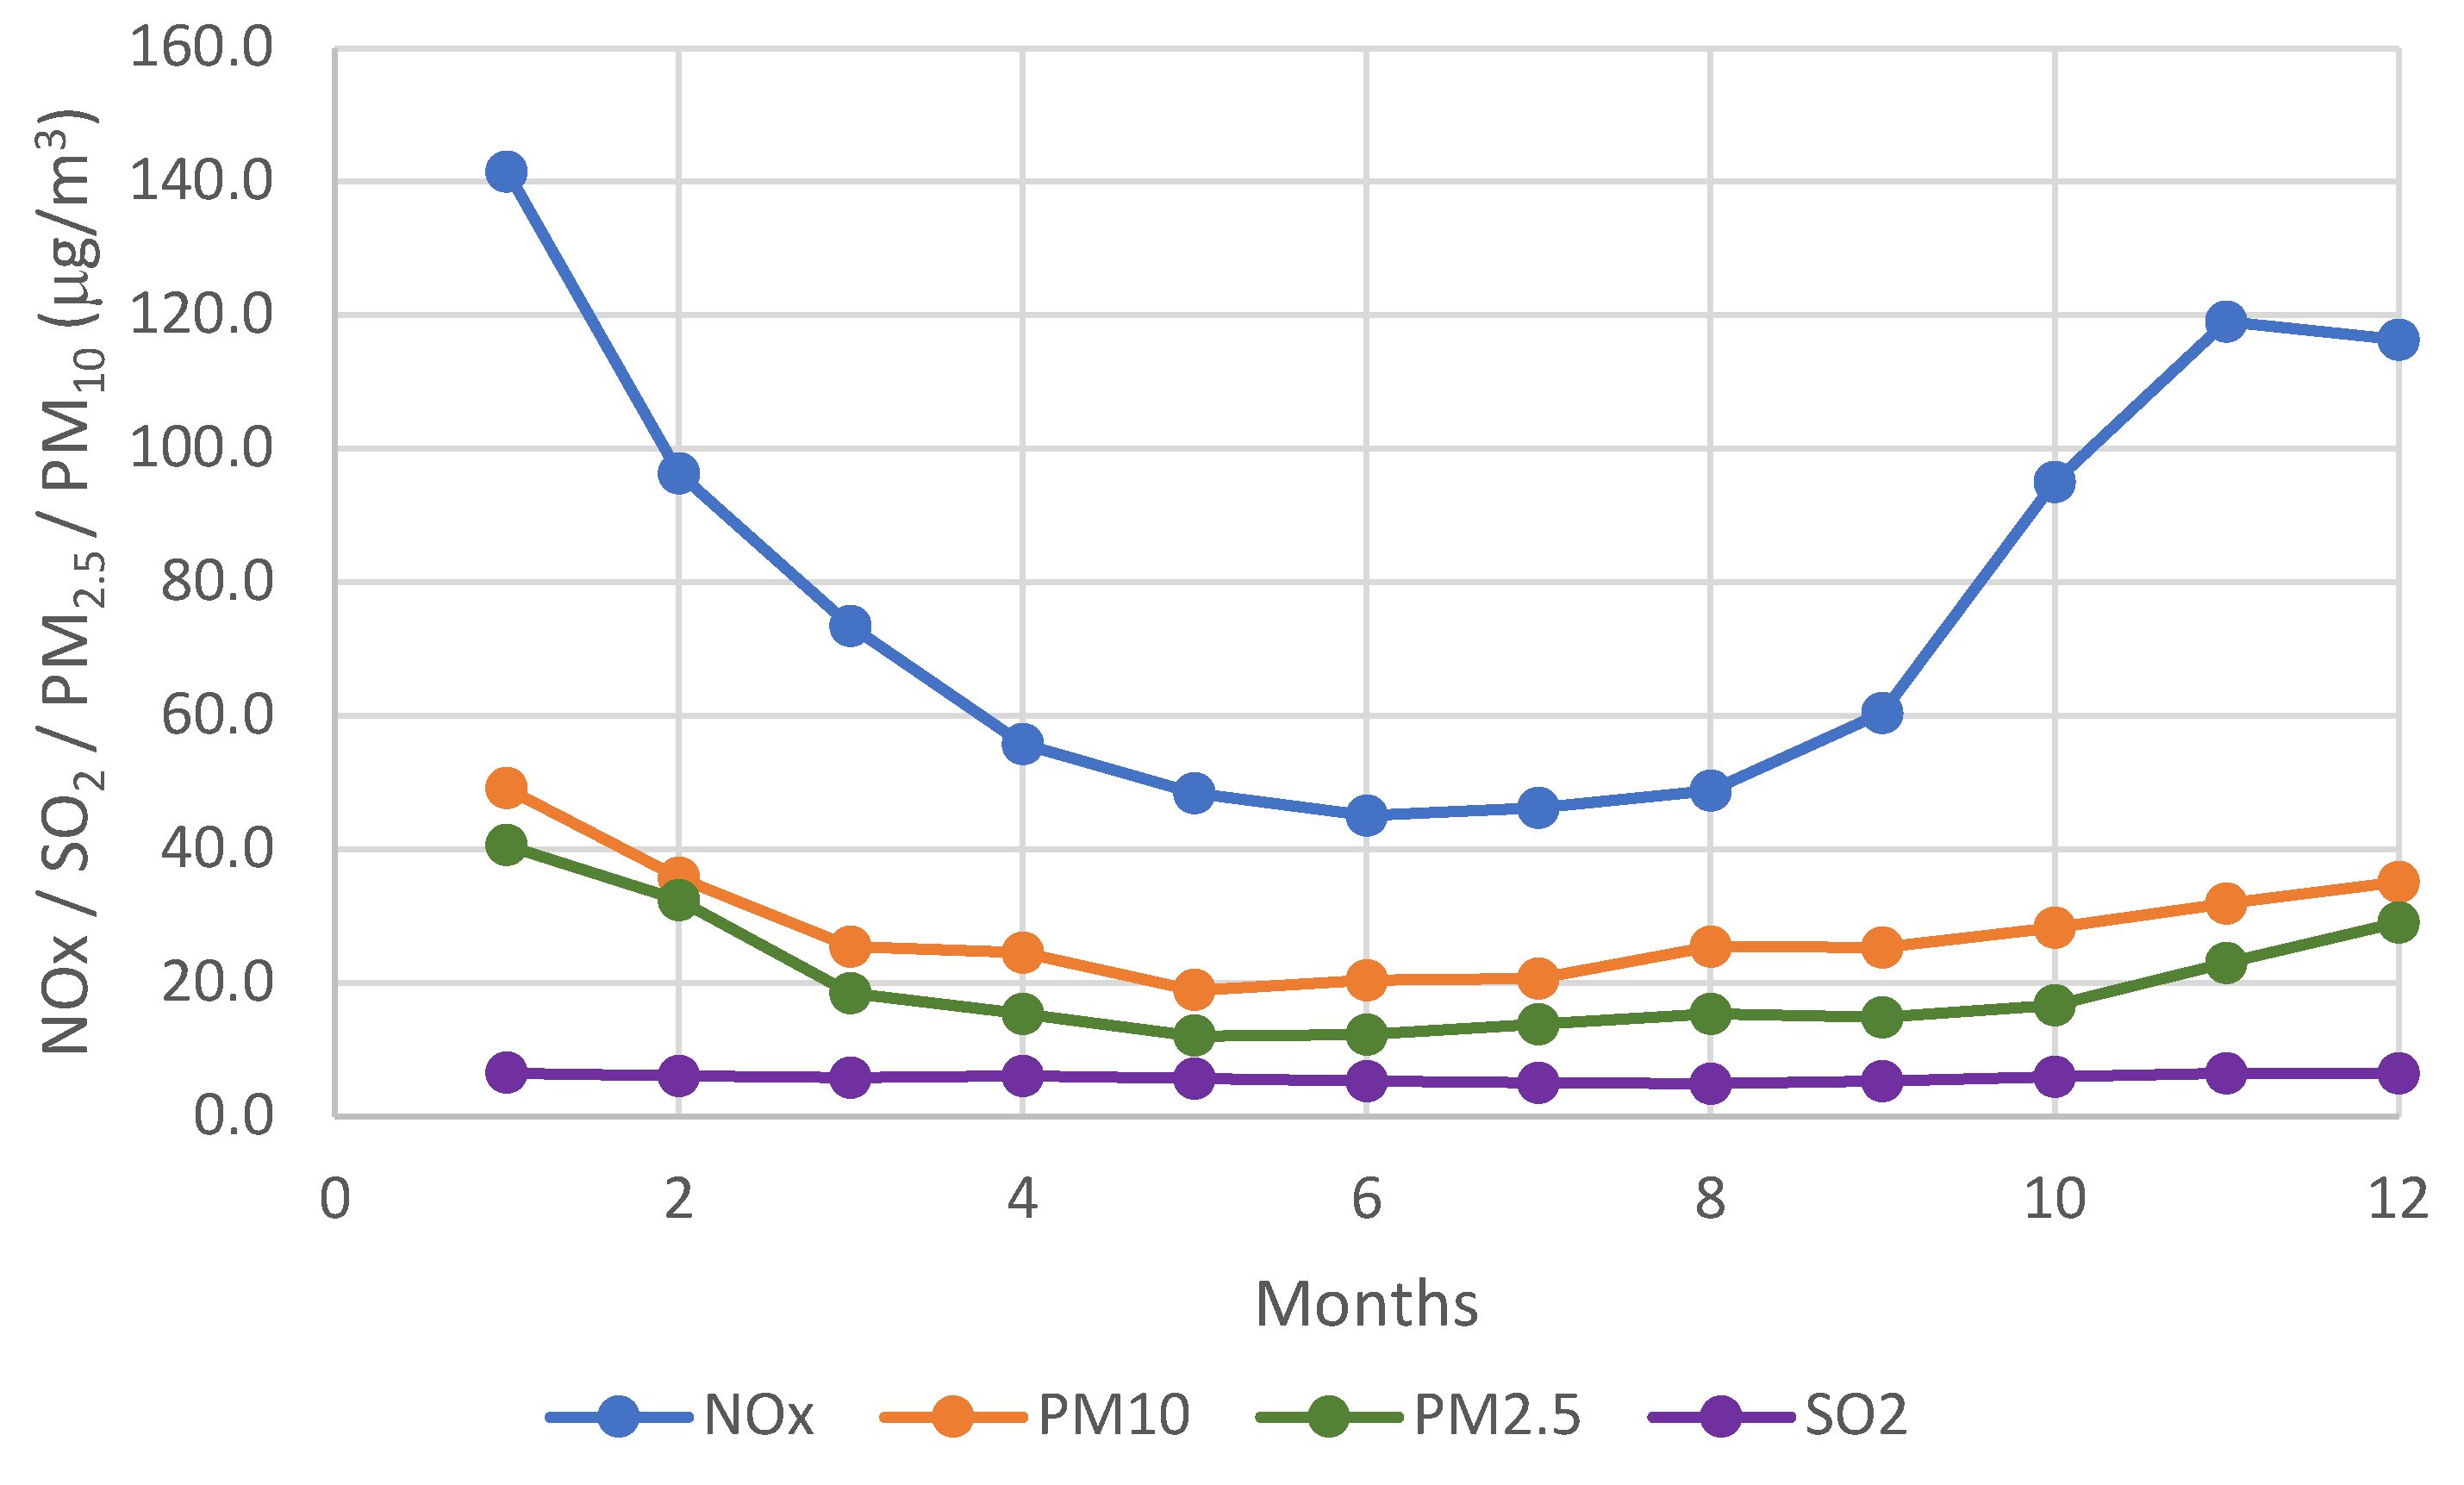
The variation of multiannual monthly average for each pollutant shows a certain behavior (Figure 6). In the winter and autumn months (October—February) the pollutant’s values are greater than in spring and summer period, much more pronounced for the NOx variation than for PM. Only SO2 di not have any variation.
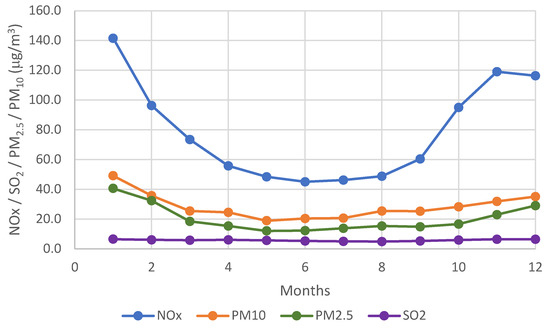
Figure 6.
Variation of the multiannual monthly average per pollutant.
Figure 7 presents the aggregated index calculated for each station based on multiannual monthly values of each pollutant. Indeed, between November and February, the air quality index value is high. The value 4 represents poor quality. For BV4 (suburban station), the value of the index is 2, meaning a “fine” quality, without May, June, and July when the air quality index is 1.
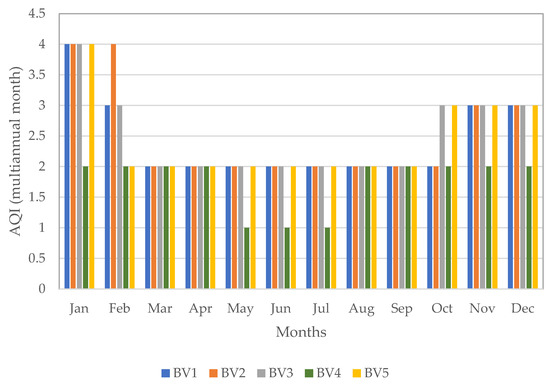
Figure 7.
Variation of the multiannual monthly average per station.
3.4. Analysis of Clinical Data of Patients Diagnosed with Primary Histological Forms of Lung Malignancies
All cases of microscopically diagnosed primary lung tumors from 2018–2021 were studied retrospectively. The study represented the establishment of a database that contains minimal patient identification forms (age, sex, and domicile) and the microscopic form of malignant tumors diagnosed in the hospital Pathology Department.
Table 7 shows the distribution of cases according to age, sex, domicile, and histological forms of primary lung malignancy. 104 primary lung malignancies were examined, and malignant histological forms were pulmonary adenocarcinoma and squamous cell carcinoma.
Table 7.
The distribution of cases.
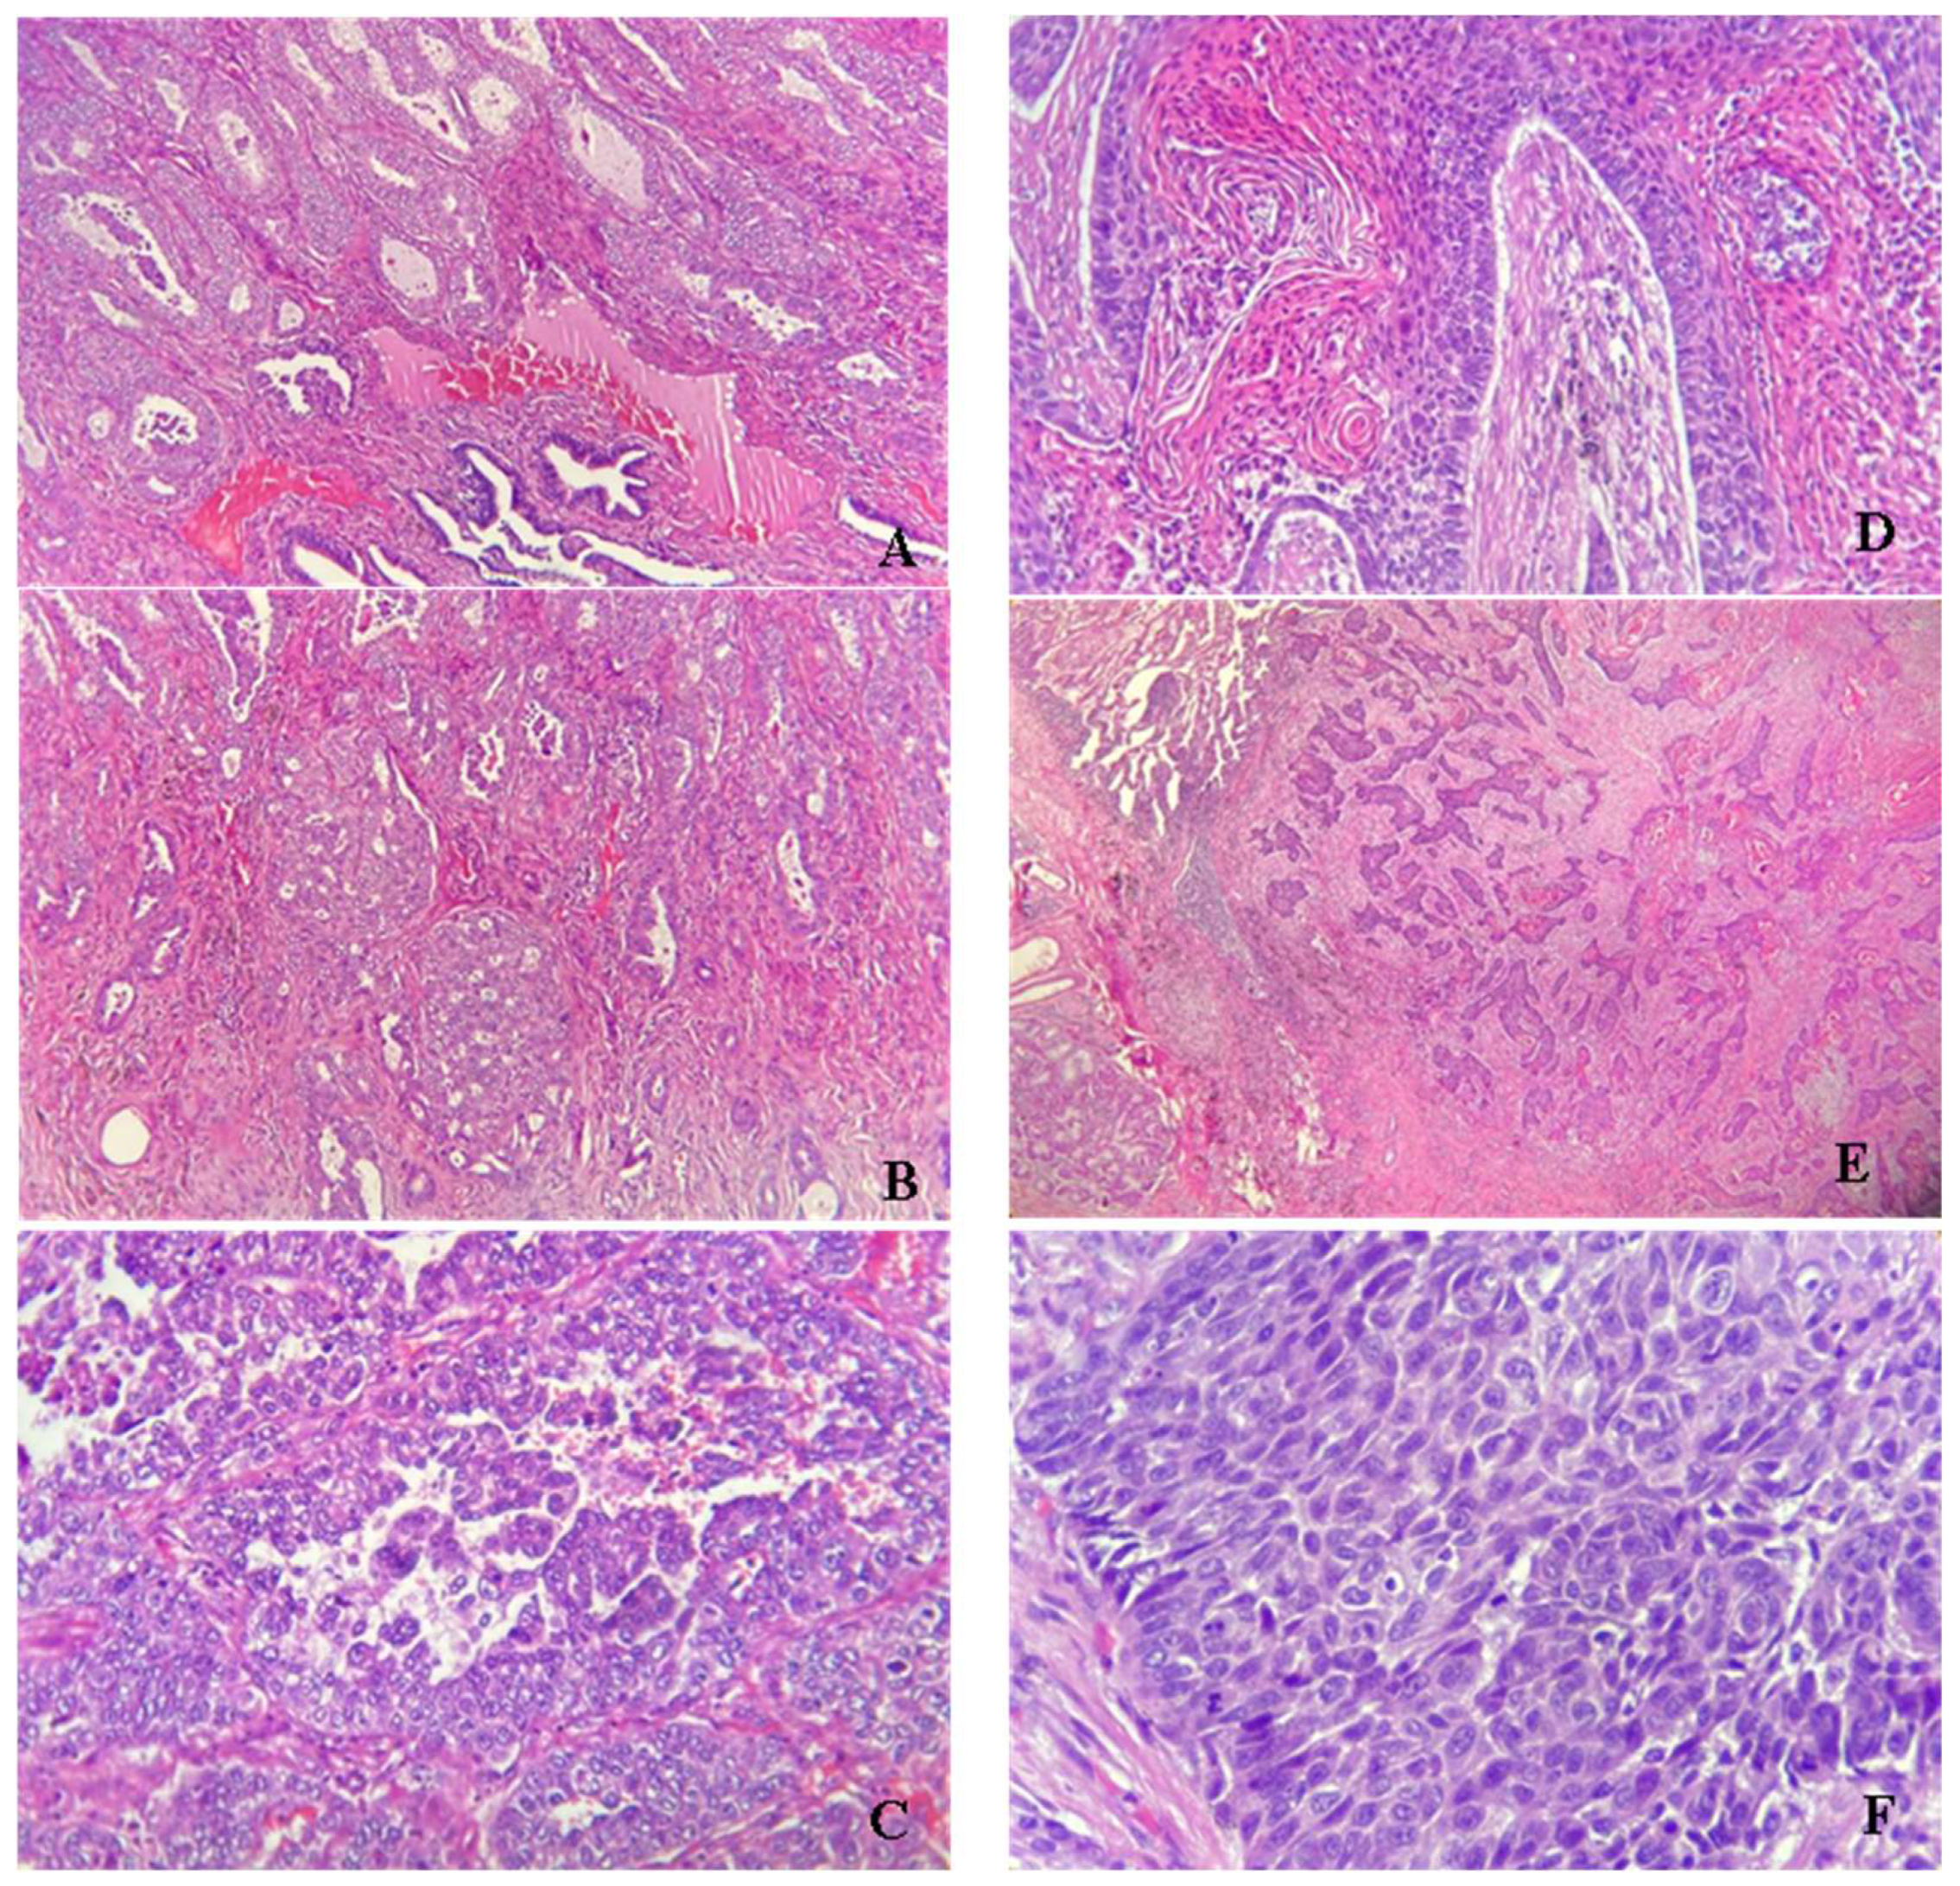
Figure 8 shows the microscopic aspects of the usual hematoxylin-eosin staining of pulmonary adenocarcinoma (ADK) and squamous cell carcinoma (SCC).
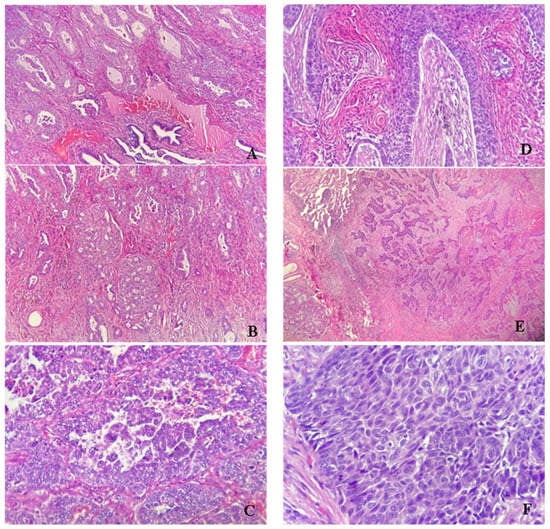
Figure 8.
(A) Pulmonary adenocarcinoma moderate defined, bronchial origin (HE × 100); (B) Cribriform pulmonary adenocarcinoma (HE × 100); (C) Poor differentiated pulmonary adenocarcinoma (HE × 400); (D) Keratinized squamous cell carcinoma (HE × 200); (E) Not differentiated squamous cell carcinoma (HE × 100); (F) Atypical mitoses in squamous cell carcinoma (HE × 400).
4. Discussion
The analysis of clinical and histological data analysis showed that the most common form of lung cancer in patients included in the study is squamous cell carcinoma (76%) compared with pulmonary adenocarcinoma (24%). It should be noted that no primary neuroendocrine forms or small cell carcinomas were identified in the study. In addition, the incidence of the disease was much higher in urban areas than in rural areas. Probably the pollutants and environment have given this point of view major importance in the context of the influence of the environment on the development of cancers in general, and lung cancers in particular. Among the cases diagnosed in rural areas, the highest frequency was squamous cell carcinoma as well as in the cases from urban areas.
Regarding the distribution by sex ratio, the most common cases were in men (67%), while in women, the frequency was half (33%), according to medical literature. By analyzing the incidence by age groups, out of 104 diagnosed cases, the most common were in the age category 61–70 years (52%), the other categories being less affected.
The incidence of primary malignant lung tumors during the four years of the study shows that in 2019, 45% of cases were diagnosed. The patient’s addressability to the doctor was also influenced by the SARS-CoV2 pandemic context, which explains the much lower number of cases in 2020 and the explosion recorded in 2021, approximately close to that of 2018 (over 20% of all tumors studied).
A report by John Hopkins University [28] shows that cigarettes cause 91% of squamous cell carcinoma, but the exposure to other toxic pollutants or radon are important risk factors. A study led in Korea shows that PM10 and NO2 increase the number of lung cancer incidence [29]. It is worth mentioning that Brasov operated a thermal power plant till 2015, which is the most important pollutant activity in the area. In this context, even if we have not a specific tool to distinguish between the effects of NOx pollution and other pollutants on lung diseases, considering the results obtained especially for NOx pollutant, we conclude that the increases of lung cancer number in the latest period could be affected by the air pollution.
Our study’s principal limitation consists in the number of pollution stations and their spatial distribution (Figure 1), which does not offer the possibility of realizing a spatial distribution of results or applying a Multicriteria Evaluation (MCE) method integrated with GIS. In this context, maybe modeling air quality based on wind, rainfall, or other climacteric parameters will be possible to continue this work. The second impediment is the lack of clinical data before 2018. This is because Sacele municipal hospital was closed in 2011 by a government decision. After its opening in 2017, the new Pathology Department started developing a research database related to malignant tumors.
The study represents an association of laboratory medical findings made on the group of patients who addressed the pulmonology services with malignant tumor suspicion that was confirmed histopathologically, with the level of air pollution in the metropolitan area of Brasov. The association found that the level of PM10 air pollutant detected in the respirated air in the metropolitan area is associated with the presence of squamous lung malignancies in patients, compared to other histological forms of bronchopulmonary cancer. The idea of developing the study started from the initially superficial analysis on the type of cases examined medically in the pathological anatomy service, due to the increased frequency of malignant lung tumor pathology in Brasov County compared to other counties in Romania. Thus, the analysis of the environmental factors in the territory was deepened and it was revealed that the polluting particles from the breathed air influence the malignant transformation of the respiratory epithelium by squamous metaplasia at bronchial level. The analysis and purpose of our study is to trigger an alarm signal that in the region, the risk of developing pulmonary squamous cell carcinoma is associated with the presence and levels of PM10 and NO2 pollutants.
Author Contributions
Conceptualization, C.M. and I.P.; methodology, C.M. and I.P.; validation, R.M., C.M. and I.P.; formal analysis, R.M.; investigation, C.M. and I.P.; resources, C.M. and I.P.; data curation, R.M. and I.P.; writing—original draft preparation, C.M. and I.P.; writing—review and editing, C.M., R.M and I.P. visualization, C.M. and I.P.; supervision, C.M. and RM; All authors have read and agreed to the published version of the manuscript.
Funding
This research received no external funding.
Institutional Review Board Statement
Not applicable.
Informed Consent Statement
Not applicable.
Conflicts of Interest
The authors declare no conflict of interest.
References
- European Commission Directorate-General for Environment; Kantor, E.; Klebba, M.; Richer, C.; Kubota, U.; Zeisl, Y.; Dittrich, M.; Blanes Guardia, N.; Fons Estevez, J.; Salomons, E.; et al. Assessment of Potential Health Benefits of Noise Abatement Measures in the EU: Phenomena Project; Publications Office of the European Union: Luxembourg, 2021. [Google Scholar]
- Dumitru, I.M.; Lilios, G.; Arbune, M. Respiratory Infections and Air Pollution, Retrospective Study Over the Past 10 Years. J. Environ. Prot. Ecol. 2018, 19, 1445–1451. [Google Scholar]
- Rodríguez-Villamizar, L.A.; Rojas-Roa, N.Y.; Blanco-Becerra, L.C.; Herrera-Galindo, V.M.; Fernández-Niño, J.A. Short-term effects of air pollution on respiratory and circulatory morbidity in colombia 2011–2014: A multi-city, time-series analysis. Int. J. Environ. Res. Public Health 2018, 15, 1610. [Google Scholar] [CrossRef] [PubMed] [Green Version]
- Nhung, N.T.T.; Schindler, C.; Dien, T.M.; Probst-Hensch, N.; Perez, L.; Künzli, N. Acute effects of ambient air pollution on lower respiratory infections in Hanoi children: An eight-year time series study. Environ. Int. 2018, 110, 139–148. [Google Scholar] [CrossRef] [PubMed]
- Al-Taani, A.A.; Nazzal, Y.; Howari, F.M.; Iqbal, J.; Bou Orm, N.; Xavier, C.M.; Bărbulescu, A.; Sharma, M.; Dumitriu, C.-S. Contamination Assessment of Heavy Metals in Agricultural Soil, in the Liwa Area (UAE). Toxics 2021, 9, 53. [Google Scholar] [CrossRef] [PubMed]
- Nazzal, Y.; Orm, N.B.; Barbulescu, A.; Howari, F.; Sharma, M.; Badawi, A.E.; Al-Taani, A.; Iqbal, J.; El Ktaibi, F.; Xavier, C.M.; et al. Study of Atmospheric Pollution and Health Risk Assessment: A Case Study for the Sharjah and Ajman Emirates (UAE). Atmosphere 2021, 12, 1442. [Google Scholar] [CrossRef]
- Nazzal, Y.; Bărbulescu, A.; Howari, F.; Al-Taani, A.A.; Iqbal, J.; Xavier, C.M.; Sharma, M.; Dumitriu, C.Ș. Assessment of Metals Concentrations in Soils of Abu Dhabi Emirate Using Pollution Indices and Multivariate Statistics. Toxics 2021, 9, 95. [Google Scholar] [CrossRef] [PubMed]
- Dastoorpoor, M.; Khanjani, N.; Bahrampour, A.; Goudarzi, G.; Aghababaeian, H.; Idani, E. Short-term effects of air pollution on respiratory mortality in Ahvaz, Iran. Med. J. Islam. Repub. Iran 2018, 32, 173–181. [Google Scholar] [CrossRef] [PubMed]
- Stafoggia, M.; Samoli, E.; Alessandrini, E.; Cadum, E.; Ostro, B.; Berti, G.; Faustini, A.; Jacquemin, B.; Linares, C.; Pascal, M.; et al. Short-term Associations between Fine and Coarse Particulate Matter and Hospitalizations in Southern Europe: Results from the MED-PARTICLES Project. Environ. Health Perspect. 2013, 121, 1026–1033. [Google Scholar] [CrossRef] [PubMed]
- Carlsten, C.; Salvi, S.; Wong, G.W.K.; Chung, K.F. Personal strategies to minimise effects of air pollution on respiratory health: Advice for providers, patients and the public. Eur. Respir. J. 2020, 55, 1902056. [Google Scholar] [CrossRef] [PubMed]
- Bărbulescu, A.; Dumitriu, C.Ș. Assessing Water Quality by Statistical Methods. Water 2021, 13, 1026. [Google Scholar] [CrossRef]
- Bărbulescu, A.; Dumitriu, C.S.; Ilie, I.; Barbeş, S.-B. Influence of Anomalies on the Models for Nitrogen Oxides and Ozone Series. Atmosphere 2022, 13, 558. [Google Scholar] [CrossRef]
- Respiratory Diseases Statistics. Available online: http://ec.europa.eu/eurostat/statistics-explained/index.php/Respiratory_diseases_statistics (accessed on 4 September 2021).
- European Environment Agency. Healthy Environment, Healthy Lives: How the Environment Influences Health and Well-Being in Europe; European Environment Agency: Copenhagen, Denmark, 2020.
- Schraufnagel, D.E.; Balmes, J.R.; Cowl, C.T.; De Matteis, S.; Jung, S.-H.; Mortimer, K.; Perez-Padilla, R.; Rice, M.B.; Riojas-Rodriguez, H.; Sood, A.; et al. Air Pollution and Noncommunicable Diseases: A Review by the Forum of International Respiratory Societies’ Environmental Committee, Part 1: The Damaging Effects of Air Pollution. Chest 2019, 155, 409–416. [Google Scholar] [CrossRef] [PubMed] [Green Version]
- Schraufnagel, D.E.; Balmes, J.R.; Cowl, C.T.; De Matteis, S.; Jung, S.-H.; Mortimer, K.; Perez-Padilla, R.; Rice, M.B.; Riojas-Rodriguez, H.; Sood, A.; et al. Air Pollution and Noncommunicable Diseases: A Review by the Forum of International Respiratory Societies’ Environmental Committee, Part 2: Air Pollution and Organ Systems. Chest 2019, 155, 417–426. [Google Scholar] [CrossRef] [PubMed]
- Directive 2008/50/EC of the European Parliament and of the Council of 21 May 2008 on Ambient Air Quality and Cleaner Air for Europe. Available online: http://news.cleartheair.org.hk/wp-content/uploads/2013/02/LexUriServ.pdf (accessed on 10 May 2022).
- European Parliament and Council. DIRECTIVE (EU) 2016/2284 on the Reduction of National Emissions of Certain Atmospheric Pollutants, Amending Directive 2003/35/EC and Repealing Directive 2001/81/EC. Available online: https://eur-lex.europa.eu/legal-content/RO/TXT/HTML/?uri=CELEX:32016L2284&from=RO (accessed on 2 September 2021).
- Romania—Air Pollution Country Fact Sheet—European Environment Agency. Available online: https://www.eea.europa.eu/themes/air/country-fact-sheets/2020-country-fact-sheets/romania (accessed on 2 September 2021).
- De Bruyn, S.; de Vries, J. Health Costs of Air Pollution in European Cities and the Linkage with Transport; CE Delft: Delft, The Netherlands, 2020. [Google Scholar]
- CITEAIR—Comparing Urban Air Quality across Borders. Available online: http://airqualitynow.eu/download/CITEAIR-Comparing_Urban_Air_Quality_across_Borders.pdf (accessed on 3 September 2021).
- Stieb, D.M.; Burnett, R.T.; Smith-Doiron, M.; Brion, O.; Shin, H.H.; Economou, V. A New Multipollutant, No-Threshold Air Quality Health Index Based on Short-Term Associations Observed in Daily Time-Series Analyses. J. Air Waste Manag. Assoc. 2008, 58, 435–450. [Google Scholar] [CrossRef] [PubMed] [Green Version]
- Olstrup, H. An Air Quality Health Index (AQHI) with Different Health Outcomes Based on the Air Pollution Concentrations in Stockholm during the Period of 2015–2017. Atmosphere 2020, 11, 192. [Google Scholar] [CrossRef] [Green Version]
- Order 1818 02/10/2020. Available online: http://legislatie.just.ro/Public/DetaliiDocument/231536 (accessed on 7 September 2021).
- European Environment Agency. EMEP/EEA Air Pollutant Emission Inventory Guidebook. 2019. Available online: https://www.eea.europa.eu/publications/emep-eea-guidebook-2019 (accessed on 4 February 2022).
- TEMPO Online. Available online: http://statistici.insse.ro:8077/tempo-online/#/pages/tables/insse-table (accessed on 4 September 2021).
- INSP-CNSISP. Mortalitatea Generală. 2019. Available online: https://cnsisp.insp.gov.ro/wp-content/uploads/2021/01/MORTALITATEA-GENERALA-2019.pdf (accessed on 5 September 2021).
- Ettinger, D.S.; Akerley, W.; Borghaei, H.; Chang, A.C.; Cheney, R.T.; Chirieac, L.R.; D’Amico, T.A.; Demmy, T.L.; Govindan, R.; Grannis, F.W.; et al. Non-Small Cell Lung Cancer, Version 2.2013. J. Natl. Compr. Cancer Netw. 2013, 11, 645–653. [Google Scholar] [CrossRef] [PubMed] [Green Version]
- Lamichhane, D.K.; Kim, H.-C.; Choi, C.-M.; Shin, M.-H.; Shim, Y.M.; Leem, J.-H.; Ryu, J.-S.; Nam, H.-S.; Park, S.-M. Lung Cancer Risk and Residential Exposure to Air Pollution: A Korean Population-Based Case-Control Study. Yonsei Med. J. 2017, 58, 1111. [Google Scholar] [CrossRef] [PubMed]

Publisher’s Note: MDPI stays neutral with regard to jurisdictional claims in published maps and institutional affiliations. |
© 2022 by the authors. Licensee MDPI, Basel, Switzerland. This article is an open access article distributed under the terms and conditions of the Creative Commons Attribution (CC BY) license (https://creativecommons.org/licenses/by/4.0/).