Article

Optimization of the Efficient Extraction of Organic Components in Atmospheric Particulate Matter by Accelerated Solvent Extraction Technique and Its Application

1
School of Science, China University of Geosciences, Beijing 100083, China
2
State Key Laboratory of Environmental Criteria and Risk Assessment, Chinese Research Academy of Environmental Sciences, Beijing 100012, China
3
Key Laboratory of Ecosystem Network Observation and Modeling, Institute of Geographic Sciences and Natural Resources Research, Chinese Academy of Sciences, Beijing 100101, China
4
Environmental Research Institute, Shandong University, Jinan 250100, China
5
Advanced Materials Institute, Qilu University of Technology (Shandong Academy of Sciences), Jinan 250014, China
6
Yishui Branch of Linyi Municipal Ecology and Environment Bureau, Linyi 276034, China
*
Authors to whom correspondence should be addressed.
Atmosphere 2022, 13(5), 818; https://doi.org/10.3390/atmos13050818
Submission received: 3 April 2022 / Revised: 6 May 2022 / Accepted: 13 May 2022 / Published: 17 May 2022

Abstract

:
Organic components in atmospheric fine particulate matter have attracted much attention and several scientific studies have been performed, although most of the sample extraction methods are time consuming and laborious. Accelerated solvent extraction (ASE) is a new sample extraction method offering number of advantages, such as low extraction cost, reduced solvent and time consumption, and simplified extraction protocols. In order to optimize ASE methods to determine the concentrations of organic compounds in atmospheric fine particulate matter, different parameters were set out for the experiment, and the optimal method was selected according to the recoveries of the standard (i.e., n−alkanes and polycyclic aromatic hydrocarbons (PAHs)). This study also involves a comparison of the optimal method with the traditional method of ultrasonic extraction (USE). In addition, the optimized method was applied to measure the mass concentrations of organic compounds (n−alkanes and PAHs) in fine particulate matter samples collected in Beijing. The findings showed that the average recovery of target compounds using ASE was 96%, with the majority of compounds falling within the confidence levels, and the ASE recoveries and precision were consistent with the USE method tested. Furthermore, ASE combines the advantages of high extraction efficiency, automation, and reduced solvent use. In conclusion, the optimal ASE methods can be used to extract organic components in atmospheric particulate matter and serve as a point of reference for the development of analytical methodologies for assessing organic compounds in atmospheric particulate matter in China.

1. Introduction

Atmospheric fine particulate matter (bearing aerodynamic diameters ≤ 2.5 µm, PM2.5) has attracted quite a lot of attention because of its significant impact on climate [1,2], visibility [3,4], and human health [5,6,7]. PM2.5 is made up of a mix of inorganic and organic molecules, with organic aerosols accounting for 20 to 70% of the total organic matter [8,9,10,11]. The determination of detection and quantitation of organic components in the particulate organic matter has been of growing concern over the past few years [6,12,13,14].
The organic components in PM2.5 include saturated hydrocarbons, aromatic hydrocarbons, fatty acids, asphaltenes, and other compounds [15,16]. Among the identified organic compounds, n−alkanes and PAHs are widely available due to their prevalence and sources [6]; their pollution characteristics are influenced by human activities, and they can be used as tracers to indicate sources [17]. Meanwhile, n−alkanes and PAHs are toxic to organisms and can cause strong irritation to the human respiratory system, as well as neurological disorders and skin damage, and even increase the risk of skin cancer [1,3]. Therefore, the study of the pollution characteristics of n−alkanes and PAHs in PM2.5 is of dual significance in the analysis of atmospheric fine particle sources and the protection of human health.
A large number of different isolation procedures for particulate organic matter from various environmental samples have been described in the literature [6,18,19,20,21,22]. In recent years, lots of extraction techniques for sample preparation were developed [23,24,25,26]. These techniques meet the need of particulate organic matter determination for a single class or several classes of components in samples of different origins. Recently, the majority of the extraction-based pretreatments of PM2.5 are traditionally performed using Soxhlet extraction (SOX) [17,23,27,28] and USE [25,29,30]. Among the above methods, the SOX method has high extraction efficiency, the single extraction time is long, the solvent dosage is large, it not suitable for high boiling point solvents, and heat to discolor or decompose the material is not suitable for this method [31,32,33,34]. The USE procedure is simple, but the extraction time is long and the separation operation of extraction residue and extracted material is time-consuming; to meet the monitoring for geological samples with low organic content, the sample volume or the number of extractions must be increased [31,33]. ASE is a solid–liquid organic component extraction process performed at high temperatures (50–200 °C) and high pressures (10–15 MPa), and combines the benefits of high-throughput, automation and low solvent consumption [32,35,36,37,38,39]. Although ASE has surfaced as a popular technology for the extraction of different groups of organic compounds present in a variety of soil, food, and feed samples; however, there are few studies on the parameters influencing ASE efficiency and the application advancement of ASE in analyzing organic components in fine particulate matter [36,37,38,39]. Therefore, it is meaningful to establish a simple and rapid method to extract organic components in atmospheric particulate matters based on the ASE technique.
In the current investigation, four groups of different levels of extraction parameters, such as temperature, static time, cycle, flush volume, and purge time, for the extraction method using ASE were investigated and the optimal method was subsequently chosen. The outcomes of the optimal ASE method were compared with the USE method, which has a high extraction efficiency compared to other methods [33,35]. The optimal method was then used to pretreat real-world samples to understand the pollution status of n−alkanes and PAHs in PM2.5 during an air pollution episode in a typical city i.e., Beijing. To our knowledge, this is the first application of an ASE method to pretreat PM2.5 samples. The results of this work will establish a low-cost extraction, with reduced solvent and time consumption, and a simplified protocol for an accelerated solvent extraction–gas chromatography (ASE-GC/MS) method for the determination of organic components in ambient air particulate matter, and will provide a reference for the detection of low-content organic fractions in bulk PM2.5 samples.

2. Experimental Section

2.1. Experimental Design Approach

To find the most effective extraction parameters for organic components in ASE 350 (Dionex Corp., Sunnyvale, CA, USA) in atmospheric particulate matters, four groups of experimental parameters were designed; keeping in view the orthogonal experimental design [40], each group was operated four times, and a group of blank experiments was included in each group, thereby requiring a total of 20 experiments in total. The orthogonal experimental design approach is considered an effective strategy for dealing with multifactor tests and screening optimum levels and reasonable and representative levels of all factors based on theories or prior experiments. After that, tests representing all of the experimental factors’ level groups were performed. Temperature, static time, cycle, flush volume, and purge time were evaluated utilizing a full orthogonal experimental design for the ASE operational variables. The most successful extraction operating parameters for n−alkanes and PAHs were then compared to the USE extraction method [15,20,21,41,42]. In addition, the optimized method was applied to measure the mass concentrations of organic components in fine particle samples collected in Beijing.

2.2. Standards Reference Samples

In this study, n−alkanes standard mixtures (500 μg/mL) and PAHs (2000 μg/mL) were chosen as representative organic matter to determine the prevalence of these two substances, which were both obtained from Sigma-Aldrich (Merck KGaA, Darmstadt, Germany). The n-alkane mixtures comprised 18 n−alkanes, while tridecane in n−alkanes was used as an internal standard [41,42]. The PAHs mixture, on the other hand, contains 11 PAHs. GC-grade solvents (n−hexane, dichloromethane (DCM), and methanol) and diatomaceous earth were purchased from J.T. Baker (Fisher Scientific, Loughborough, UK) and Dionex (Dionex Corp., Sunnyvale, CA, USA). n−Alkanes and PAHs mixed solution (1 ng/μL) was prepared with the standard mixtures mentioned above.
The mixed solution (1 mL) was transferred using a glass Pasteur pipette (BRAND GMBH + CO KG., Wertheim, Germany) and sprayed evenly onto pieces of precombusted (450 °C, 6 h) blank quartz filters (203 mm × 254 mm, Whatman Company, Buckinghamshire, UK). The filters were then immediately put into the corresponding stainless steel extraction cells of 34 mL (Dionex Corp., Sunnyvale, CA, USA) for organic extraction.

2.3. Accelerated Solvent Extraction (ASE) and Ultrasonic Solvent Extraction (USE) Methods
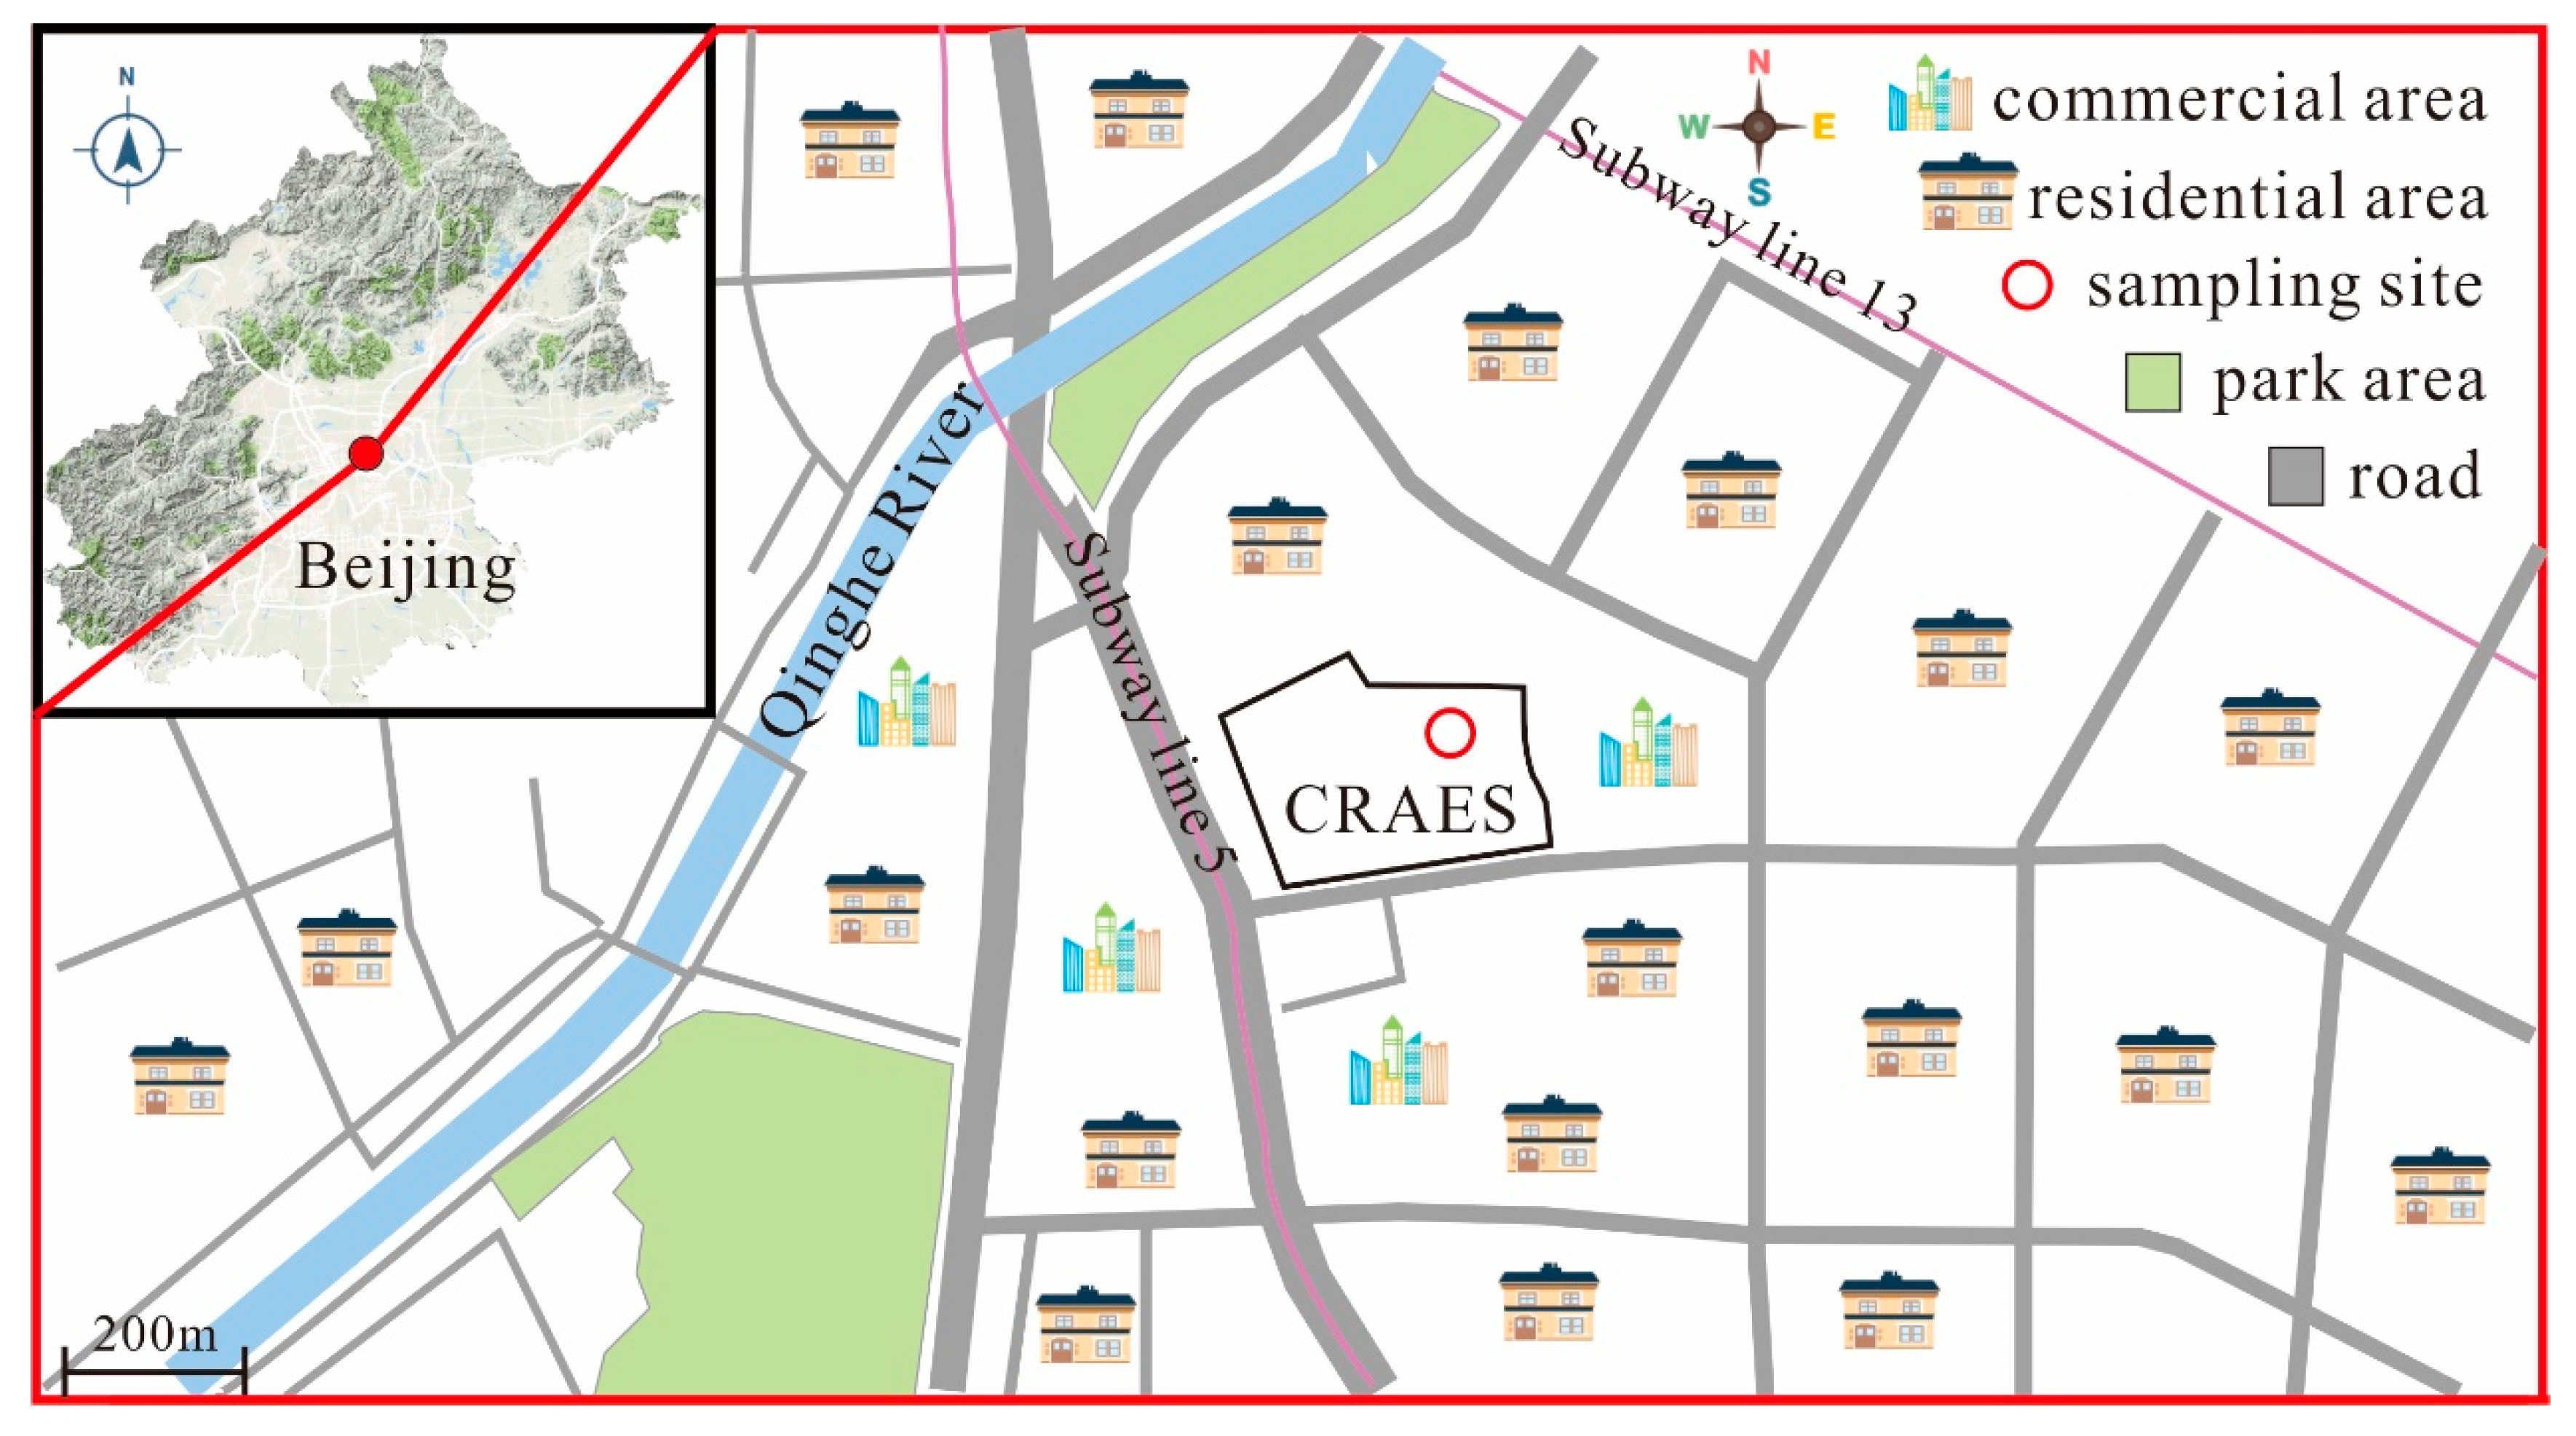
ASE. The Dionex ASE 350 equipment system was used for the extraction of the n−alkanes and PAHs in standard reference samples using different operating parameters. A 34 mL stainless steel extraction cell was filled with the first layer of diatomaceous earth (to minimize the extraction solvent volume), then pieces of quartz fiber containing the standard mixed solutions, and then another layer of diatomaceous earth. To avoid suspended particles collecting in the extract, a cellulose filter (Dionex Corp., Sunnyvale, CA, USA) was inserted in the lowest part of the cell. Then, the filter samples were extracted with dichloromethane/methanol (2:1, v/v). Ultimately, the cell was set in the cell tray and extracted according to the whole orthogonal experimental design’s requirements. In each experiment group, the detailed operating settings were set as shown in Table 1. A rotary evaporator (LABO ROTA4011, Heidolph, Schwabach, Germany) was used to concentrate the solvent extracts, which were subsequently blown dry with pure nitrogen gas (>99.999%, Beijing Haipu Gas Company. Ltd., Beijing, China). The extracts were collected in 1 mL glass vials (1.5 mL, Shimadzu, Japan) and diluted with 100 μL n-hexane before being stored at −20 °C in the dark.
USE. An aliquot of the prepared standards references samples (each around 30 cm2) was cut into pieces and sonicated three times for 20 min with dichloromethane/methanol (2:1, v/v) [20,21]. Quartz fiber wool packed in a glass Pasteur pipet was employed to filter the solvent extracts, which were then concentrated with a rotary evaporator (LABO ROTA4011, Heidolph), and finally dried using pure nitrogen gas. For analysis, the extracts were diluted with 100 μL of n-hexane and stored at −20 °C in the dark [43,44].

2.4. Case Study

The PM2.5 samples were collected during an air pollution episode (Figures S1 and S2) from 14–21 April 2017 on the roof of the Laboratory of Atmospheric Photochemical Simulation at the Chinese Research Academy of Environmental Sciences (CRAES) situated in Chaoyang District of Beijing, which is about 8 m above the ground and surrounded by commercial–residential areas and residential areas (Figure 1). It is a representative analysis of the ambient air pollution state of typical urban districts in Beijing, because there are no visible local industrial pollution sources (Ren et al., 2021a; Zhang et al., 2017). The PM2.5 samples were taken with a high-volume sampler (TE-6070VFC-PM2.5, Thermofisher Company, USA) with a 1.13 m3/min airflow rate and an 11.5-h sampling interval [42]. There were 16 PM2.5 samples collected in total. Individual samples are wrapped in aluminum foil bags and allowed to sit in a freezer well below −20 °C after sampling and before analysis.
The PM2.5 filter samples pretreatment and analysis methods employed in this study were the same as above mentioned ASE pretreatment (using the optimal experimental parameters). In brief, the aliquot of the PM2.5 filter samples (with each approximately 30 cm2) were cut into pieces and extracted using the ASE equipment with the most effective operation parameters. The rotary evaporator was used to concentrate the solvent extracts, which were subsequently blown dry with pure nitrogen gas. For examination, the extracts were diluted in 100 μL of n-hexane. For quality assurance, the laboratory and field blanks were treated in the same way as actual samples.
The extracts from standard reference samples and the PM2.5 filter samples were analyzed using a gas chromatograph (GC)–mass spectrometer (MS) (GC, 7890A; MS, 5975C, Agilent Co., Santa Clara, CA, USA). A DB-5MS fused silica capillary column (30 m × 0.25 mm i.d., 0.25 μm film thickness, Agilent Co., Santa Clara, CA, USA) was utilized in the GC. The details of the temperature program for GC operation are mentioned below; the temperature was initially 50 °C (maintained for 2 min), then raised to 120 °C at 15 °C/min, followed by a rise to 300 °C at 5 °C/min, with a final isothermal hold at 300 °C for 16 min. A needle was employed to inject 2 μL of sample extract into the GC-MS inlet. The electron impact ionization (EI) mode was used to run the MS, with a 70 eV electron energy and a scanning range of 50 to 650 Da. The diluted commercial standard solution was used to determine the GC-MS response factors of n−alkanes and PAHs.
The PM2.5 data used in the study were obtained from the Olympic Sports Center Station (116.397° E, 39.982° N) of the Beijing Municipal Ecological and Environmental Monitoring Center (http://www.bjmemc.com.cn/, accessed on 17 April 2021) in Chaoyang District, which is approximately 2 km southwest of CRAES [45].

2.5. Quality Assurance and Quality Control (QA/QC)

Samples were prepared and analyzed under strict quality control. To avoid contamination, all pre-baked (450 °C for 6 h) glass instruments used in this study were promptly cleaned with methanol, dichloromethane, and hexane. The target chemicals’ limit of detection (LOD) and quantification (LOQ) were respectively estimated, making use of the signal-to-noise ratios of 3:1 and 10:1. The LODs of n−alkanes and PAHs in the current investigation were 0.004–0.049 ng/mL and 0.003–0.008 ng/mL, respectively. Their LOQs are 0.0146–0.1629 ng/mL and 0.0095–0.0266 ng/mL, respectively (Table S1). The accuracy of the methodology is 98.2%, as measured by the error in the mean values of triplicate measurements of a 2 ng/mL standard solution. The precision of the methodology is 3.1%, as estimated using the relative standard deviation (%RSD). The study of field blank samples revealed no severe contamination (5% of real samples). The data shown here have been adjusted for blanks but not for recoveries.

3. Results and Discussion

3.1. Optimization of ASE Parameters

The standard reference samples added with standard mixtures of n−alkanes and PAHs were analyzed by the design of the experiment. Table S1 summarized the recoveries of 17 n−alkanes and 11 PAHs from the standard reference samples; all the target species were detected in the four groups. In addition, the recoveries of 17 n−alkanes obtained from the four group experiments under various experimental parameters were from 51 to 531%, whereas the recoveries of 11 PAHs ranged from 55–667%.
A comparison of the recoveries of the four groups of experimental parameters, the recoveries of the first group showed a smooth variation and a homogeneous response across the n−alkanes and PAHs (Figure 2 and Figure 3, Table 2). This implied that, out of the four experimental groups, the first group performed better and satisfied the optimization parameters, so that the instrument parameters of the first group were selected as the optimized parameters for comparison with the USE method under the same experimental parameters, namely extraction temperature, 100 °C; static time, 3 min; cycle number, 2; rinse volume, 50%; purge time, 60 s. A detailed explanation regarding the selection of parameters has been discussed below.

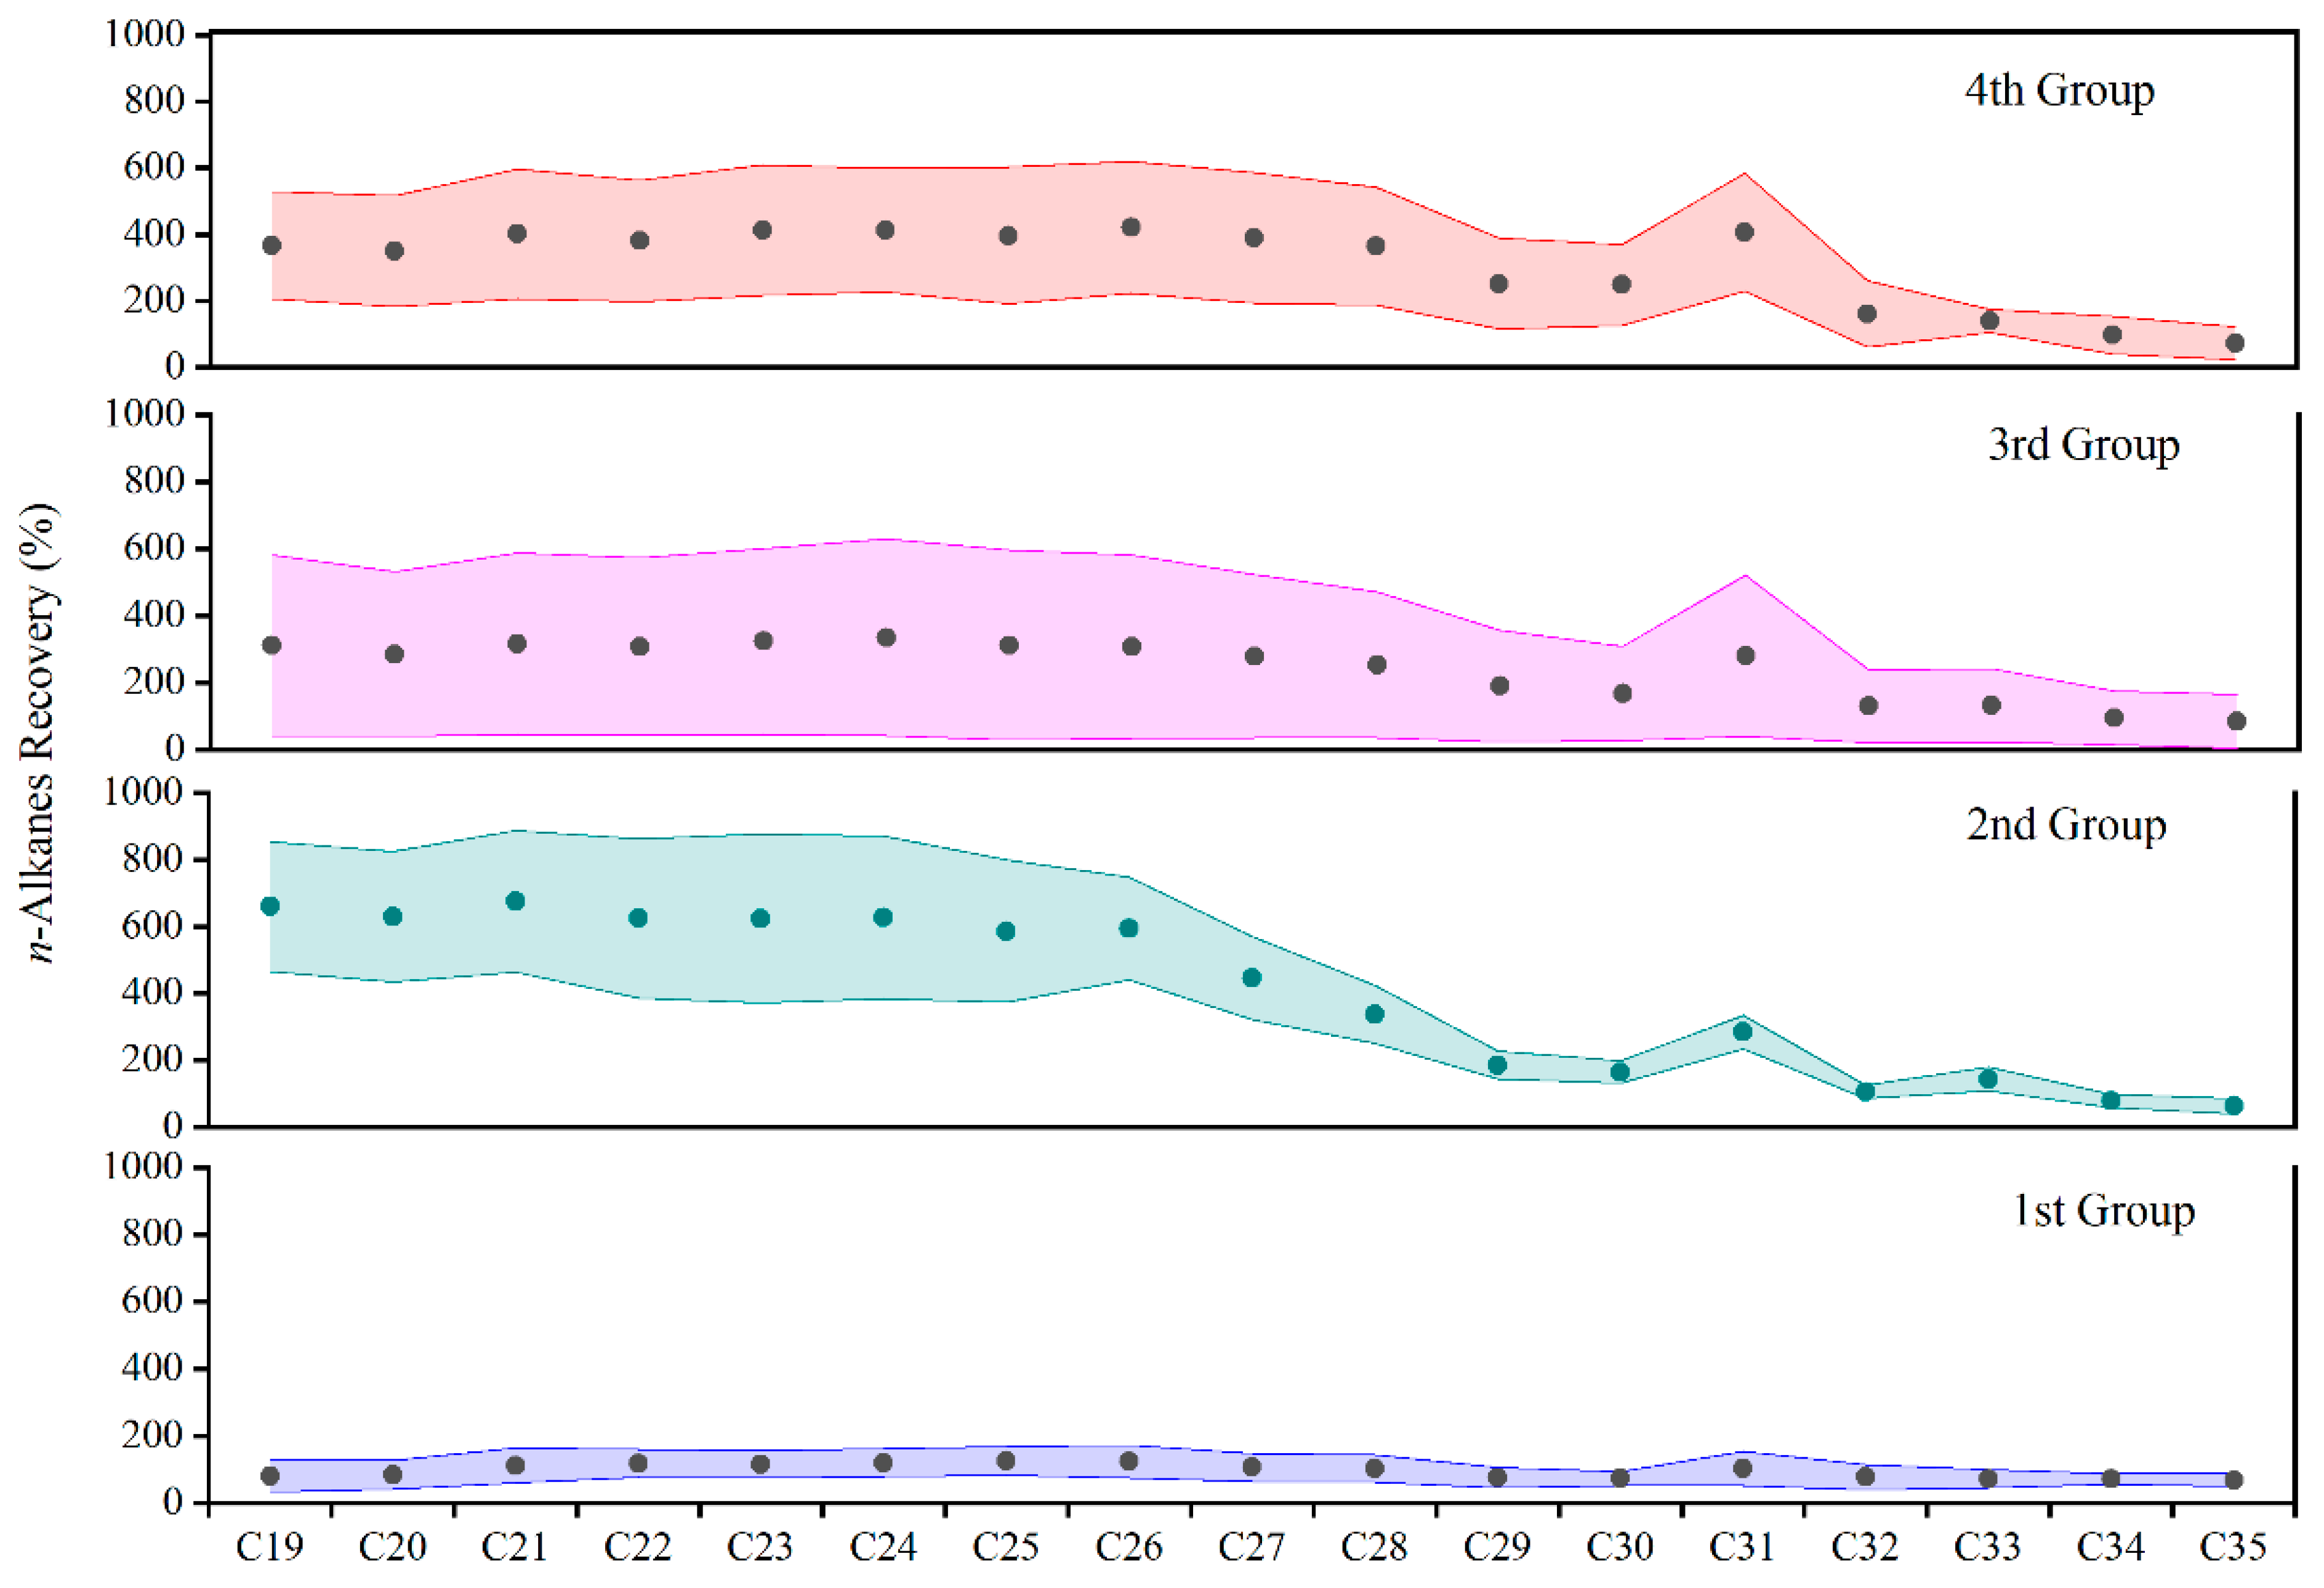
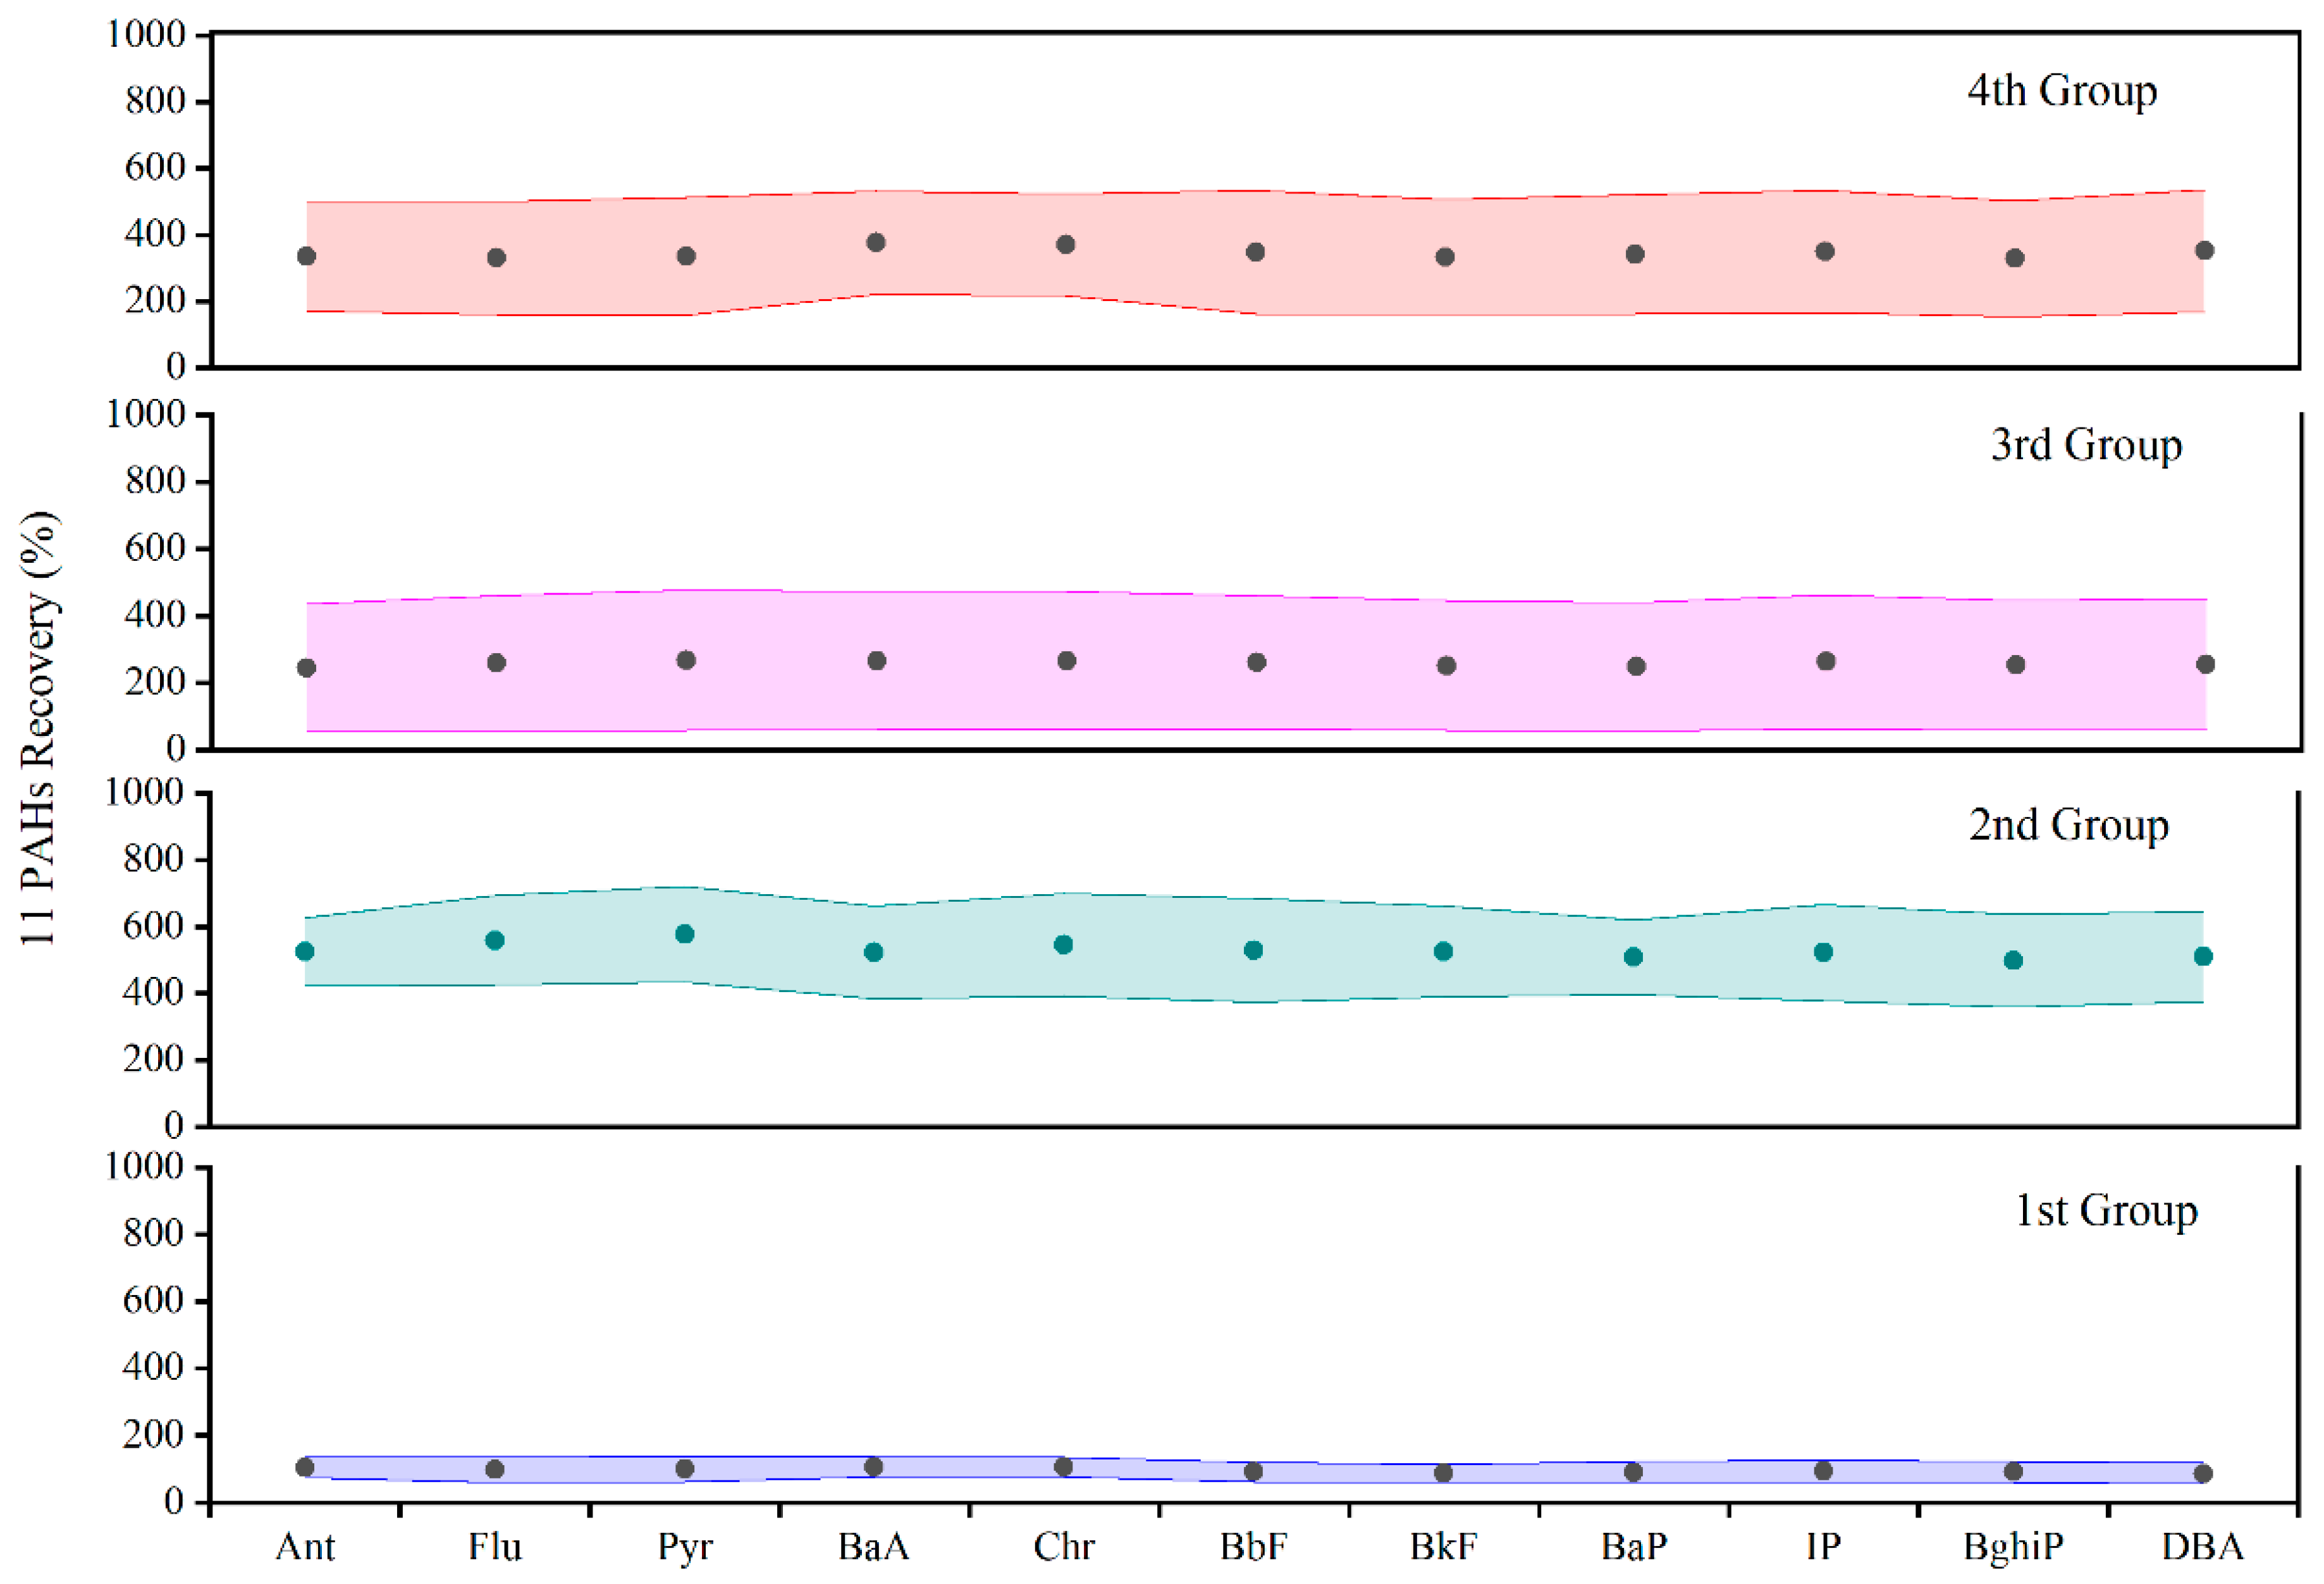
3.2. Influences of Different Parameters

Effects of Temperature in ASE. In this study, 100 °C was chosen as the optimum temperature parameter. One of the most critical criteria for ASE is temperature, which is also a significant operational difference between ASE and USE [36,46]. Extraction temperatures much beyond the solvent’s typical boiling point can be used in ASE. The boiling point of the solvent employed in USE, on the other hand, limits the extraction temperature. Higher temperatures aid diffusion of the constituents from the interior of the fine particulate matter up to their surface [46]. Furthermore, the transfer of information from the particle surface to the extraction solvent will be rather swift. Besides, when working at higher temperatures, the solubility of the constituents within the extraction fluid is improved [32,47]. As a result, at greater extraction temperatures, the extraction rate will be much higher. High temperatures increase mass transfer and solubility, but they also reduce selectivity. High temperatures may also have an impact on thermo-labile chemicals that are susceptible to hydrolytic breakdown and disintegration [33,47]. Finally, 100 °C was chosen as the best temperature value after combining the results of the n−alkanes and PAHs recovery.
Effects of Static Time. The static time of 3 min was chosen as the optimum parameter. Static and dynamic ASE modes are both available. During the static extraction mode, the extraction of the specimen is performed using a solvent at an elevated temperature and pressure in the absence of any solvent outflow. Once the extraction has attained equilibrium, which takes around 5 min, rapid flushing of the extraction cell with solvent and pure nitrogen gas is carried out to recover the analytes [36,48]. In the dynamic mode, the extraction solvent flows constantly through the extraction cell. Although the dynamic extraction mode of ASE enhances mass transfer, it does so at the expense of a larger volume of a solvent when compared to the static extraction mode. The dynamic extraction model was used in our tests. According to certain research, the influence of static time on ASE extraction recoveries, extraction recoveries grow significantly as the static duration is increased, but after a certain point, there is no further improvement in extraction recoveries. A static time of 3 min was used for the combined analysis of the above.
Effect of Cycle and Flush volume. In this study, two extraction cycles and a flush volume of 50% were chosen as the optimum parameters. Longer exposure to solvents in the static extraction mode of the ASE causes swelling of the matrix, which promotes solvent penetration into the sample interstices and interaction with the analytes. To reduce the number of cycles, several sequential sample extractions might be performed. The second extract included significant levels of the analytes, although the recoveries for both compounds were regarded low in the other cycles. Two extraction cycles were employed to save solvent and time while allowing the fresh solvent to be injected [31,36]. After the static time for dragging the analytes toward the collection vial, the percent value of fresh volume delivered into the sample is the flush volume. This volume is intimately associated with the final volume and guarantees that all analytes are eluted. To extract analytes, several flush volumes were used; generally, a flush volume of 50% was sufficient to drive the n−alkanes and PAHs out of the fine particulate matter [36,48].
Effect of other parameters. The recoveries of the target analytes are unaffected by the other three parameters (pressure, preheating time, and purge time). Pressure is used in ASE to keep the extraction solvent liquid at a temperature above its ambient boiling point. In several investigations, it was claimed that pressure did not influence ASE recovery [46,49]. Keeping under consideration the above reasons and the limitations of our experimental parameters, the effects of pressure in the extractions of n−alkanes and PAHs were not subject to experimentation; only the recommended value (1.03 MPa) was used in our experiments. Preheating time refers to the amount of time the cell was kept in the oven at the desired temperature before the solvent is added; typically, 5 min is sufficient to guarantee the cell is at the desired temperature [36].

3.3. Comparison of Extraction Approach

Under the experimental parameters of the above optimal ASE extraction pretreatment method, two pretreatment methods, namely the ASE extraction method and conventional USE method, were used for the recovery of the mixed standards (four replicates were made for each group), and Table 3 compares the recovery of mixed standards using the two pretreatment procedures mentioned previously. The recoveries were 50.7–121% for n−alkanes and 55.3–122% for PAHs in the ASE method, and there were extremely significant differences between the two groups (p < 0.01). The recoveries were 71.2–85.8% for n−alkanes and 35.2–45.3% for PAHs in the USE method, with no significant differences (p > 0.05) (Table S2). Except for the first group, the ASE method showed good extraction efficiency for each chemical pollutant, as shown in Table 3. Meanwhile, under the optimal ASE sample analysis settings, the solvent dosage was around 20 mL and the extraction time was around 20 min, but for USE, the solvent dosage was more than 50 mL and the extraction time was more than 30 min. It is worth pointing out that the ASE can achieve batch analysis while the USE method can only process individual samples manually; the advantage of ASE is that it can pretreat a large number of samples. It was clear that the ASE approach was quick, required less solvent, and had a high extraction efficiency, making it ideal for batch analysis.

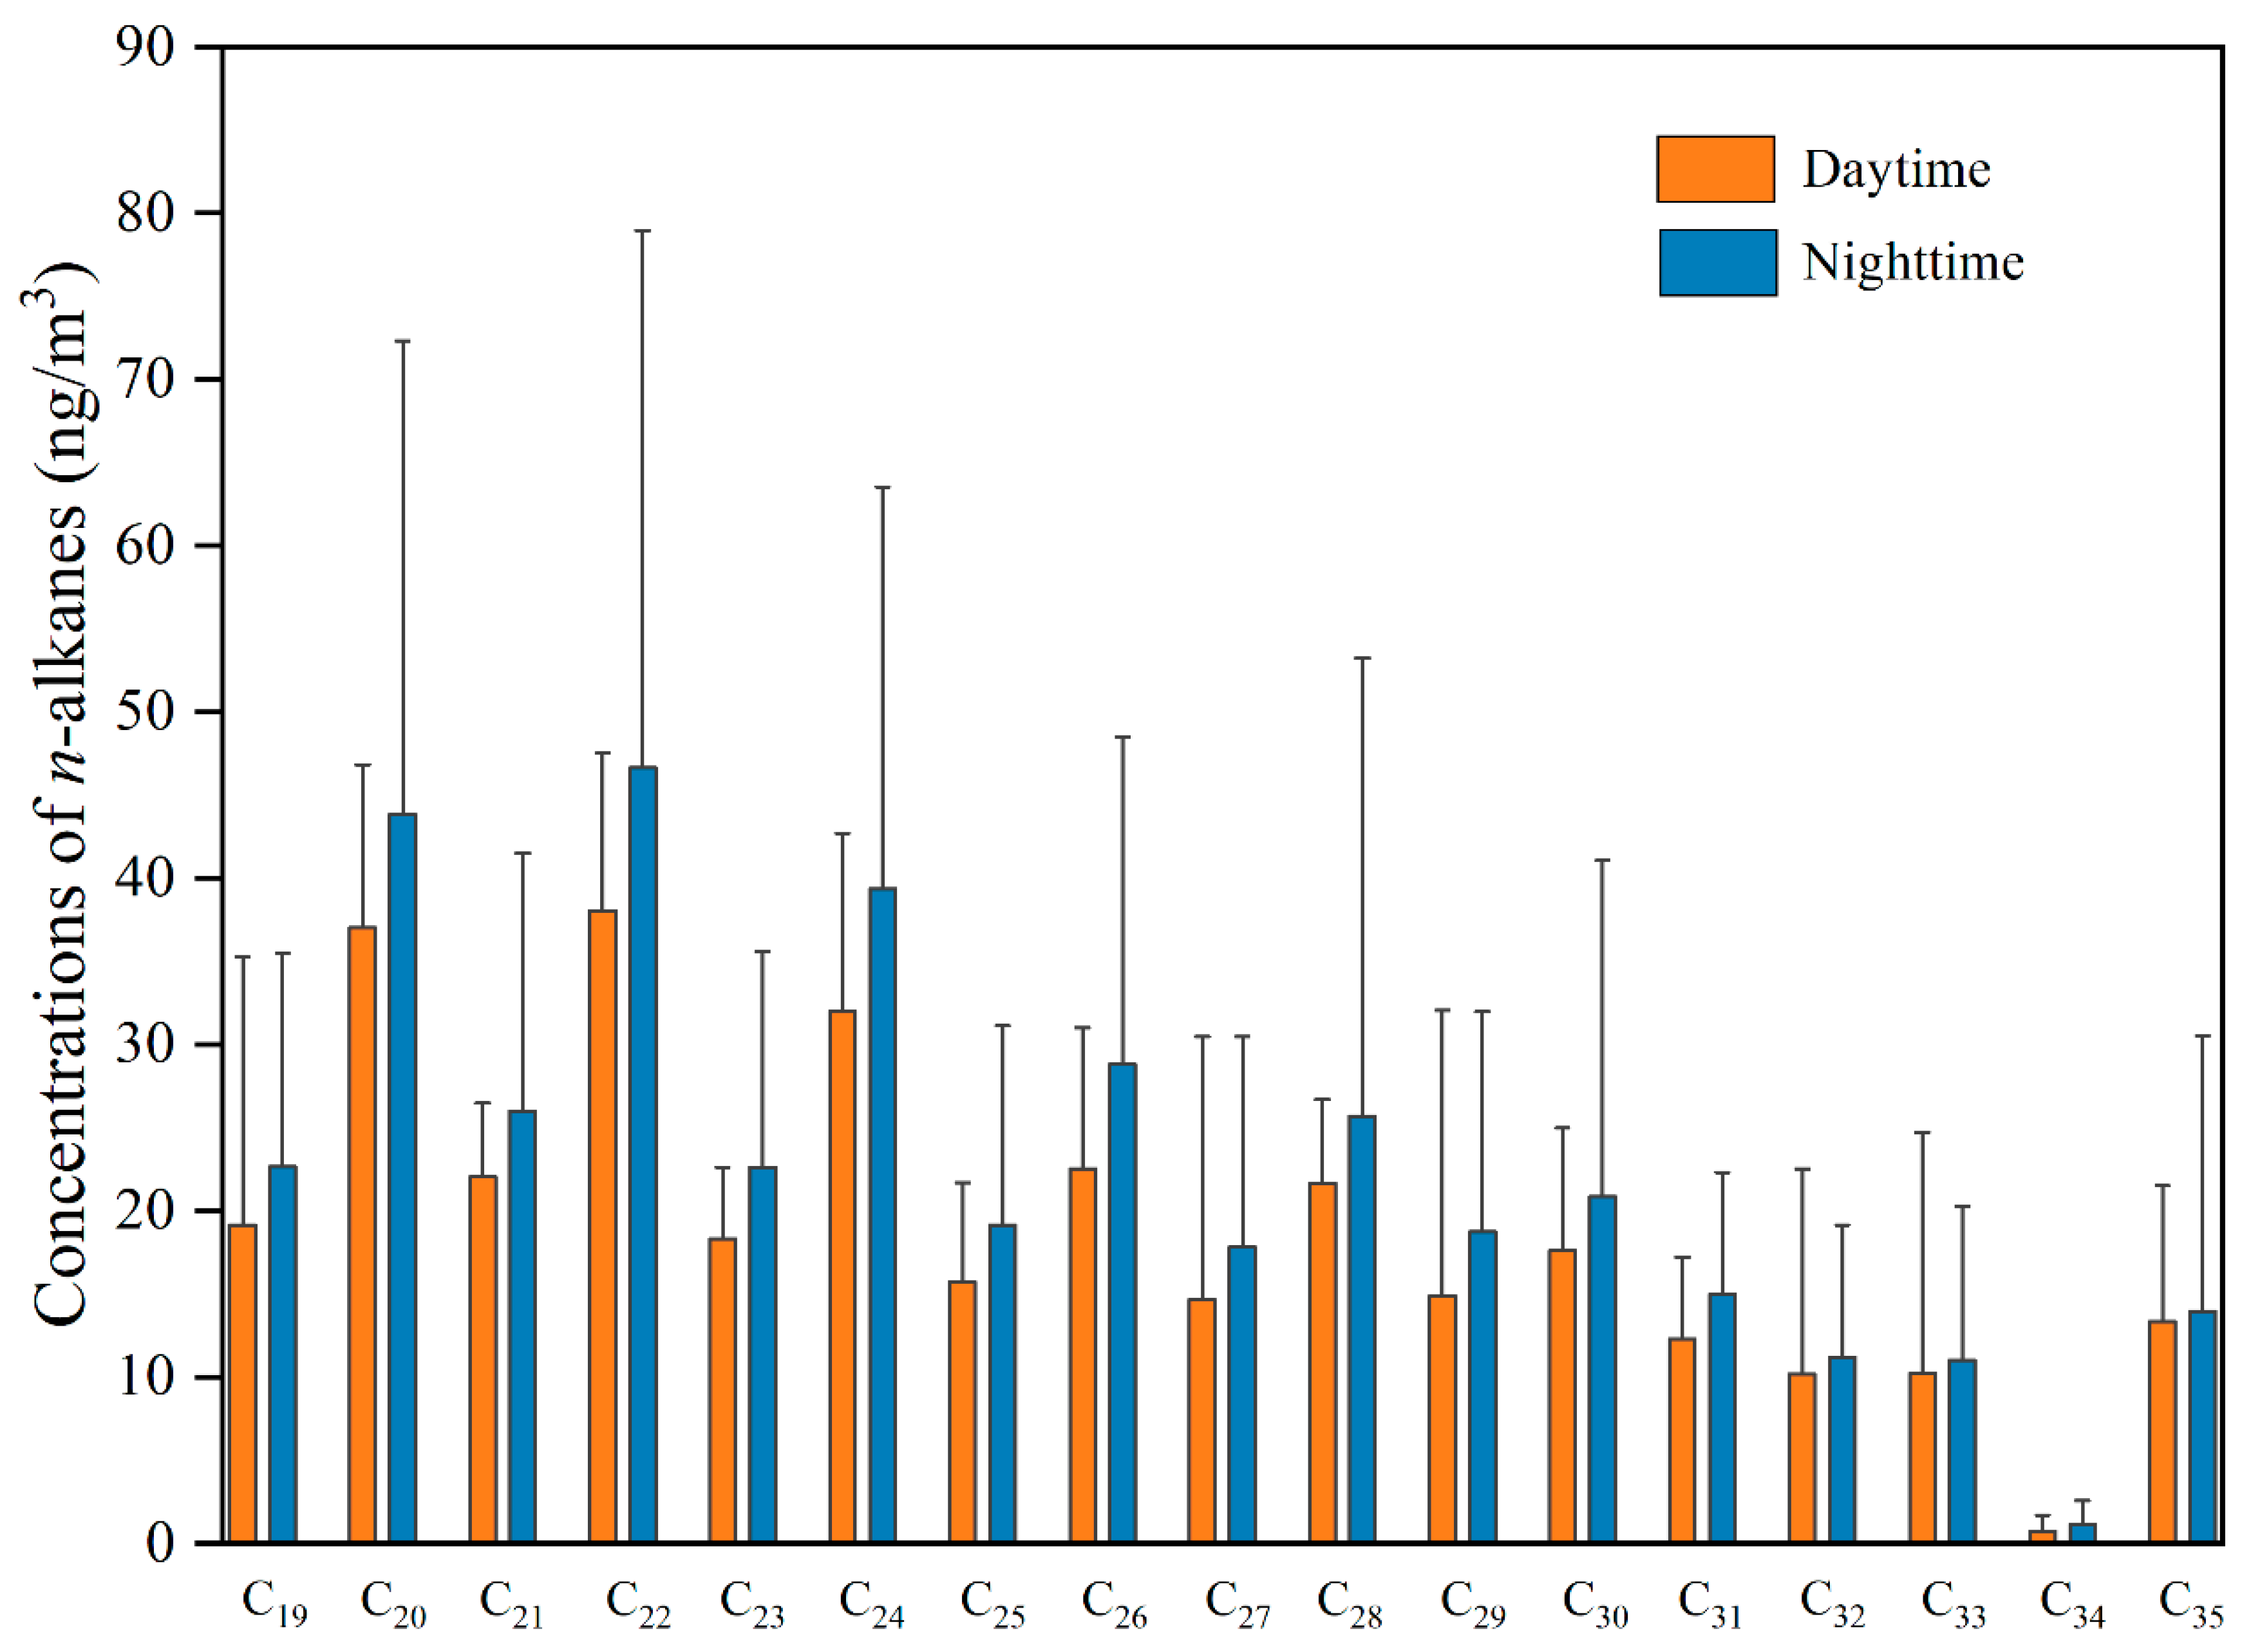
4. Results from Local Sample Collection

During the observation period in the research area, PM2.5 mass concentrations in a typical Beijing metropolitan area ranged from 28 to 178 μg/m3 (Figure 4). The mean concentration of 17 n−alkanes in PM2.5 ranged from 108.14 to 720.89 ng/m3, with a mean value of 350.02 ng/m3, accounting for 0.45% of the mean PM2.5 mass concentration. C22 n−alkanes had the largest mass concentration (42.05 ng/m3), followed by C20 (40.21 ng/m3) and C24 (35.40 ng/m3) (Figure S3), which, cumulatively, accounted for 33.62% of the average 17 n−alkanes mass concentration. The mean total of 17 n−alkanes mass concentrations during the pollution period was slightly lower during the daytime than at night. The concentration of 11 PAHs in PM2.5 ranged from 4.51 to 38.67 ng/m3, with a mean value of 12.20 ng/m3, accounting for 0.02% of the mean PM2.5 mass concentration. Fluoranthene (Flu) accounts for the largest proportion (3.19 ng/m3), followed by pyrene (Pyr) (2.29 ng/m3) and benzo[b]fluoranthene (BbF) (1.17 ng/m3) (Figure S3). The three PAHs concentration accumulated 54.55% of the total PAHs, and their concentration trends were the same as those of PM2.5 mass concentrations. During the pollution period, the mean values of total PAHs mass concentrations were somewhat lower during the day than at night.
The average value of daily mean 17 n−alkanes mass concentration in PM2.5 during the monitoring period was found to be 350.02 ng/m3, which is notably higher than the previous studies focusing on Beijing in 2004 [50], 2005 [51], 2006 [52], 2008 [53], and 2013 [54] (Table 4). The occurrence of this phenomenon may potentially be attributed to the influence of pollution episodes. The average value of daily mean benzo[a]pyrene (BaP) mass concentration in PM2.5 during the monitoring period was estimated to be 0.69 ng/m3, which is substantially lower than that during the heating periods of Beijing in 2008–2009 [55], 2015–2016 [56] and 2018 [57]. The results showed that the BaP mass concentration in PM2.5 in this work had decreased, but was still relatively high.
The most numerous organics in this investigation were n−alkanes (C19–C35), with C22 and C20 being the most prominent congeners (Figure 5). It can be seen that the mass concentrations of 17 n−alkanes were somewhat lower during the day than at night. The high concentrations of 17 n−alkanes at night are contributed to by both the low ambient temperature and high relative humidity at night, which lead to the conversion from the gas phase to the particle phase [45,58,59]. In the entire sampling period, the carbon preference index (CPI, concentration ratio of odd to even) values of 17 n−alkanes were 0.82 ± 0.09. The Cmax (the maximum concentration of C19–C35) was less than 23, and the CPI values were near to 1, thereby implying that n−alkanes in the urban ground surface were primarily the result of incomplete combustion of the sources of fossil fuels and biomass in this work [16,41,60].
During the monitoring period, the ratios of Flu/(Pyr + Flu) and indeno(1,2,3-cd)pyrene (IP)/(IP + benzo[ghi]perylene (BghiP)) were 0.57–0.61 and 0.47–0.52 in the daytime and 0.57–0.61 and 0.49–0.51 in the nighttime (Figure 6). All Flu/(Pyr + Flu) ratios were greater than 0.50, suggesting that biomass and coal combustion influenced PAHs within the region under investigation in the course of the monitoring period [45,61]. All IP/(IP + BghiP) ratios were close to 0.50, indicating that motor vehicle exhaust emissions influenced PAHs in PM2.5 in the area under investigation, but the PAHs in PM2.5 were also affected by diesel and gasoline combustion emissions [62]. The ratios of benz[a]anthracene (BaA)/(BaA+ chrysene (Chr)) and benzo[a]pyrene (BaP)/BghiP were 0.38–0.46 and 0.43–0.78 during the daytime and 0.40–0.55 and 0.55–0.72 during the nighttime, indicating that PAHs in PM2.5 were influenced by combustion activity during the day and at night [63].
This application revealed that the ASE method is efficient, rapid, precise, and accurate. It can provide a reference for the determination of organic components in fine particles. Moreover, the mass concentrations and trends in n−alkanes and PAHs extracted by ASE in ambient air PM2.5 in Beijing’s typical urban areas were similar to previous studies [15,54,55,57], and were also heavily influenced by combustion sources and by regional transport [42,55,56,57,64]. The comparison with previous results shows that the results of this study were reliable and could be used for the extraction of organic components from atmospheric fine particle matters. In this study, ASE-GC/MS methods were used for the determination of n−alkanes and PAHs in PM2.5. The sample processing time is only 20 min, the solvent consumption is low, the operation is simple, the recovery is high, and the sample can be processed semi-automatically, which meets the requirements for the determination of trace organic components in bulk ambient air particulate matter.

5. Conclusions

The most suitable ASE method for assessing n−alkanes and PAHs from fine particulate matter was explored, and experimental parameters, including extraction temperature (100 °C), static duration (3 min), cycles (2 times), flush volume (50%), and purge time (60 s), were identified. For the simultaneous analysis of n−alkanes and PAHs, the ASE approach showed the same recoveries and precision as the traditional USE method. The results of the experiments demonstrated that the ASE approach may be utilized to extract organic components from fine particulate matter in a fast and efficient manner. In comparison to typical USE, the ASE method has a low sample processing time and solvent consumption, simple operation, high recovery rate, and semi-automatic sample processing, which can meet the requirements for the batch testing of organic matter in airborne particulate matter. The application case showed that the ASE method can be employed as an analytical method for n−alkanes and PAHs in PM2.5 in ambient air and that it can meet the requirements for n−alkanes and PAHs detection in PM2.5 in ambient air. Because analytical standards for n−alkanes and PAHs in fine particulate matter in China are yet to be developed, this work can serve as a point of reference for the development of analytical methodologies for assessing organic compounds in fine particulate matter in China.
It is clear that the ASE technology for the extraction of organic components of atmospheric fine particulate matter is low extraction cost, reduced solvent and time consumption, and simplified extraction protocols. However, in order to save the experimental cost, the orthogonal factor technique was employed to improve the parameters of ASE for the simultaneous extraction of n−alkanes and PAHs in fine particulate matter, but there are still lack of details for the experiments. Moreover, due to the limitations of the experimental conditions, the extraction cell used in this study was a 34 mL stainless steel extraction cell, which required a large amount of diatomaceous earth to fill the cell during the experiment, resulting in solvent waste and prolonged extraction time, so it is recommended to use a smaller extraction cell in the future.

Supplementary Materials

The following supporting information can be downloaded at: https://www.mdpi.com/article/10.3390/atmos13050818/s1, Figure S1: Daily variation of the concentration of PM10, PM2.5, SO2, NO2, CO, O3 and ambient air quality index (AQI) in the study area during the monitoring period; Figure S2: Daily and diurnal variation of PM2.5 mass concentrations in the study area during the monitoring period; Figure S3: The main components of n−alkanes and PAHs in the study area during the monitoring period; Table S1: ASE recoveries (%) of 17 n−alkanes and 11 PAHs from the standards reference samples and limit of detection (LOD) and quantification (LOQ) of the target compounds in this study (ng/µL); Table S2: One-way analysis of variance (ANOVA) results of n−alkanes and PAHs in different extraction approaches.

Author Contributions

All authors made great contributions to this study. H.Z. analyzed data and wrote the paper. Y.R. and Z.P. provided structure and data analysis methods and reviewed and revised the paper. X.B. and Y.J. participated in the observation and data analysis. H.L., R.G., Z.W., J.W., Y.S. and F.X. shared ideas about the work. All authors agree to submit this paper. All authors have read and agreed to the published version of the manuscript.

Funding

This research was funded by the program from National Natural Science Foundation of China (No. 41907197), the Fundamental Research Funds for Central Public Welfare Scientific Research Institutes of China, Chinese Re-search Academy of Environmental Sciences (No. 2019YSKY-018), the National Key R&D Program of China (No. 2019YFC0214800), Standard System and Key Standards Research of National Eco-logical Environment Protection and Risk Prevention (No. 2020YFC18063).

Institutional Review Board Statement

Not applicable.

Informed Consent Statement

Not applicable.

Data Availability Statement

Data are available from authors.

Acknowledgments

We would like to show our deep gratitude to the reviewers and editors who have contributed valuable comments to improve the quality of the paper.

Conflicts of Interest

All authors declare that there is no conflict of interest.

References

  1. Park, S.; Allen, R.J.; Lim, C.H. A likely increase in fine particulate matter and premature mortality under future climate change. Air Qual. Atmos. Health 2020, 13, 143–151. [Google Scholar] [CrossRef] [Green Version]
  2. Zhai, S.; Jacob, D.J.; Wang, X.; Shen, L.; Li, K.; Zhang, Y.; Gui, K.; Zhao, T.; Liao, H. Fine particulate matter (PM2.5) trends in China, 2013–2018: Separating contributions from anthropogenic emissions and meteorology. Atmos. Chem. Phys. 2019, 19, 11031–11041. [Google Scholar] [CrossRef] [Green Version]
  3. Garcia Rivera, P.; Dinkelacker, B.T.; Kioutsioukis, I.; Adams, P.J.; Pandis, S.N. Source-Resolved Variability of Fine Particulate Matter and Human Exposure in an Urban Area. Atmos. Chem. Phys. 2022, 22, 2011–2027. [Google Scholar] [CrossRef]
  4. Won, W.S.; Oh, R.; Lee, W.; Kim, K.Y.; Ku, S.; Su, P.C.; Yoon, Y. Impact of Fine Particulate Matter on Visibility at Incheon International Airport, South Korea. Aerosol Air Qual. Res. 2020, 20, 1048–1061. [Google Scholar] [CrossRef] [Green Version]
  5. Cohen, A.J.; Brauer, M.; Burnett, R.; Anderson, H.R.; Frostad, J.; Estep, K.; Balakrishnan, K.; Brunekreef, B.; Dandona, L.; Dandona, R.; et al. Estimates and 25-year trends of the global burden of disease attributable to ambient air pollution: An analysis of data from the Global Burden of Diseases Study 2015. Lancet 2017, 389, 1907–1918. [Google Scholar] [CrossRef] [Green Version]
  6. Wang, M.; Huang, R.; Cao, J.; Dai, W.; Zhou, J.; Lin, C.; Ni, H.; Duan, J.; Wang, T.; Chen, Y.; et al. Determination of n-alkanes, polycyclic aromatic hydrocarbons and hopanes in atmospheric aerosol: Evaluation and comparison of thermal desorption GC-MS and solvent extraction GC-MS approaches. Atmos. Meas. Tech. 2019, 12, 4779–4789. [Google Scholar] [CrossRef] [Green Version]
  7. Zheng, S.; Pozzer, A.; Cao, C.X.; Lelieveld, J. Long-term (2001–2012) concentrations of fine particulate matter (PM2.5) and the impact on human health in Beijing, China. Atmos. Chem. Phys. 2015, 15, 5715–5725. [Google Scholar] [CrossRef] [Green Version]
  8. Jang, K.S.; Choi, M.; Park, M.; Park, M.H.; Kim, Y.H.; Seo, J.; Wang, Y.; Hu, M.; Bae, M.S.; Park, K. Assessment of PM2.5-bound nitrogen-containing organic compounds (NOCs) during winter at urban sites in China and Korea. Environ. Pollut. 2020, 265, 114870. [Google Scholar] [CrossRef]
  9. Losacco, C.; Perillo, A. Particulate matter air pollution and respiratory impact on humans and animals. Environ. Sci. Pollut. Res. Int. 2018, 25, 33901–33910. [Google Scholar] [CrossRef]
  10. Sharma, S.K.; Mandal, T.K.; Sharma, C.; Kuniyal, J.C.; Joshi, R.; Dhyani, P.P.; Rohtash; Sen, A.; Ghayas, H.; Gupta, N.C.; et al. Measurements of Particulate (PM2.5), BC and Trace Gases Over the Northwestern Himalayan Region of India. Mapan 2014, 29, 243–253. [Google Scholar] [CrossRef]
  11. Spyros, N.P.; Robert, A. Harley, G.R.; Cass, John, H.S. Secondary organic aerosol formation and transport. Atmos. Environ. 1992, 26, 2269–2282. [Google Scholar]
  12. Chan, M.N.; Surratt, J.D.; Chan, A.W.H.; Schilling, K.; Offenberg, J.H.; Lewandowski, M.; Edney, E.O.; Kleindienst, T.E.; Jaoui, M.; Edgerton, E.S.; et al. Influence of aerosol acidity on the chemical composition of secondary organic aerosol from β-caryophyllene. Atmospheric Chem. Phys. 2011, 11, 1735–1751. [Google Scholar] [CrossRef] [Green Version]
  13. Fu, P.; Aggarwal, S.G.; Chen, J.; Li, J.; Sun, Y.; Wang, Z.; Chen, H.; Liao, H.; Ding, A.; Umarji, G.S.; et al. Molecular Markers of Secondary Organic Aerosol in Mumbai, India. Environ. Sci. Technol. 2016, 50, 4659–4667. [Google Scholar] [CrossRef] [PubMed]
  14. Surratt, J.D.; Gómez-González, Y.; Chan, A.W.H.; Vermeylen, R.; Shahgholi, M.; Kleindienst, T.E.; Edney, E.O.; Offenberg, J.H.; Lewandowski, M.; Jaoui, M.; et al. Organosulfate Formation in Biogenic Secondary Organic Aerosol. J. Phys. Chem. A 2008, 112, 8345–8378. [Google Scholar] [CrossRef] [Green Version]
  15. Ren, Y.; Wang, G.; Wu, C.; Wang, J.; Li, J.; Zhang, L.; Han, Y.; Liu, L.; Cao, C.; Cao, J.; et al. Changes in concentration, composition and source contribution of atmospheric organic aerosols by shifting coal to natural gas in Urumqi. Atmos. Environ. 2017, 148, 306–315. [Google Scholar] [CrossRef]
  16. Ren, Y.; Wei, J.; Wu, Z.; Ji, Y.; Bi, F.; Gao, R.; Wang, Z.; Wang, G.; Li, H. Chemical components and source identification of PM2.5 in non-heating season in Beijing: The influences of biomass burning and dust. Atmos. Res. 2021, 251, 105412. [Google Scholar] [CrossRef]
  17. Trusz, A.; Ghazal, H.; Piekarska, K. Seasonal variability of chemical composition and mutagenic effect of organic PM2.5 pollutants collected in the urban area of Wroclaw (Poland). Sci. Total Environ. 2020, 733, 138911. [Google Scholar] [CrossRef]
  18. Andreae, M.O.; Crutzen, P.J. Atmospheric aerosols biogeochemical sources and role in atmospheric chemistry. Science 1997, 276, 1052–1058. [Google Scholar] [CrossRef] [Green Version]
  19. Chen, Y.; Cao, J.; Zhao, J.; Xu, H.; Arimoto, R.; Wang, G.; Han, Y.; Shen, Z.; Li, G. n-Alkanes and polycyclic aromatic hydrocarbons in total suspended particulates from the southeastern Tibetan Plateau: Concentrations, seasonal variations, and sources. Sci. Total Environ. 2014, 470–471, 9–18. [Google Scholar]
  20. Wang, G.; Kawamura, K.; Xie, M.; Gao, S.H.S.; Cao, J.; An, Z.; Wang, Z. Size-distributions of n-alkanes, PAHs and hopanes and their sources in the urban, mountain and marine atmospheres over East Asia. Atmos. Chem. Phys. 2009, 9, 8869–8882. [Google Scholar] [CrossRef] [Green Version]
  21. Wang, G.; Kawamura, K.; Lee, S.; Ho, K.; Cao, J. Molecular, Seasonal, and Spatial Distributions of Organic Aerosols from Fourteen Chinese Cities. Environ. Sci. Technol. 2006, 40, 4619–4625. [Google Scholar] [CrossRef] [PubMed]
  22. Li, J.; Wang, G.; Ren, Y.; Wang, J.; Wu, C.; Han, Y.; Zhang, L.; Cheng, C.; Meng, J. Identification of chemical compositions and sources of atmospheric aerosols in Xi’an, inland China during two types of haze events. Sci. Total Environ. 2016, 566-567, 230–237. [Google Scholar] [CrossRef] [PubMed]
  23. Castro-Guijarro, P.A.; Alvarez-Vazquez, E.R.; Fernandez-Espinosa, A.J. A rapid Soxhlet and mini-SPE method for analysis of polycyclic aromatic hydrocarbons in atmospheric particles. Anal. Bioanal. Chem. 2021, 413, 2195–2206. [Google Scholar] [CrossRef] [PubMed]
  24. Dos Santos Souza, E.J.; Zapata Mora, C.; Aristizabal Zuluaga, B.H.; Britto do Amaral, C.D.; Grassi, M.T. Multi-elemental analysis of particulate matter PM2.5 and PM10 by ICP OES. Talanta 2021, 221, 121457. [Google Scholar] [CrossRef]
  25. Han, J.; Tian, J.; Feng, J.; Guo, W.; Dong, S.; Yan, X.; Su, X.; Sun, J. Spatiotemporal distribution and mass loading of organophosphate flame retardants (OPFRs) in the Yellow River of China (Henan segment). Environ. Pollut. 2021, 290, 118000. [Google Scholar] [CrossRef]
  26. Zhang, Z.; Li, Q.; Guo, B.; Zhang, S.; Zhang, S.; Hu, D. Optimization of process parameters for preparation of polystyrene PM2.5 particles by supercritical antisolvent method using BBD-RSM. Sci. Rep. 2020, 10, 11187. [Google Scholar] [CrossRef]
  27. Kim, I.; Lee, S.; Kim, S.D. Determination of toxic organic pollutants in fine particulate matter using selective pressurized liquid extraction and gas chromatography-tandem mass spectrometry. J. Chromatogr. A 2019, 1590, 39–46. [Google Scholar] [CrossRef]
  28. Zhang, Y.; Yang, L.; Zhang, X.; Li, J.; Zhao, T.; Gao, Y.; Jiang, P.; Li, Y.; Chen, X.; Wang, W. Characteristics of PM2.5-bound PAHs at an Urban Site and a Suburban Site in Jinan in North China Plain. Aerosol Air Qual. Res. 2019, 19, 871–884. [Google Scholar] [CrossRef]
  29. He, M.; Ichinose, T.; Yoshida, Y.; Arashidani, K.; Yoshida, S.; Takano, H.; Sun, G.; Shibamoto, T. Urban PM2.5 exacerbates allergic inflammation in the murine lung via a TLR2/TLR4/MyD88-signaling pathway. Sci. Rep. 2017, 7, 11027. [Google Scholar] [CrossRef] [Green Version]
  30. Roper, C.; Delgado, L.S.; Barrett, D.; Massey Simonich, S.L.; Tanguay, R.L. PM2.5 Filter Extraction Methods: Implications for Chemical and Toxicological Analyses. Environ. Sci. Technol. 2019, 53, 434–442. [Google Scholar] [CrossRef]
  31. Hubert, A.; Wenzel, K.D.; Manz, M.; Weissflog, L.; Engewald, W.; Schuurmann, G. High Extraction Efficiency for POPs in Real Contaminated Soil Samples Using Accelerated Solvent Extraction. Anal. Chem. 2000, 72, 1294–1300. [Google Scholar] [CrossRef]
  32. Fisher, J.A.; Scarlett, M.J.; Stott, A.D. Accelerated Solvent Extraction: An Evaluation for Screening of Soils for Selected U.S. EPA Semivolatile Organic Priority Pollutants. Environ. Sci. Technol. 1997, 31, 1120–1127. [Google Scholar] [CrossRef]
  33. Lau, E.V.; Gan, S.; Ng, H.K. Extraction techniques for polycyclic aromatic hydrocarbons in soils. Int. J. Anal. Chem. 2010, 2010, 398381. [Google Scholar] [CrossRef] [PubMed]
  34. Lopez-Avila, V.; Young, R.; Beckert, W.F. Microwave-Assisted Extraction of Organic Compounds from Standard Reference Soils and Sediments. Anal. Chem. 1994, 66, 1097–1106. [Google Scholar] [CrossRef]
  35. Heemken, O.P.; Theobald, N.; Wenclawiak, B.W. Comparison of ASE and SFE with Soxhlet, Sonication, and Methanolic Saponification Extractions for the Determination of Organic Micropollutants in Marine Particulate Matter. Anal. Chem. 1997, 69, 2171–2180. [Google Scholar] [CrossRef] [PubMed]
  36. Sun, H.; Ge, X.; Lv, Y.; Wang, A. Application of accelerated solvent extraction in the analysis of organic contaminants, bioactive and nutritional compounds in food and feed. J. Chromatogr. A 2012, 1237, 1–23. [Google Scholar] [CrossRef] [PubMed]
  37. Szulejko, J.E.; Kim, K.H.; Brown, R.J.C.; Bae, M.S. Review of progress in solvent-extraction techniques for the determination of polyaromatic hydrocarbons as airborne pollutants. TrAC Trends Anal. Chem. 2014, 61, 40–48. [Google Scholar] [CrossRef]
  38. Toubane, A.; Rezzoug, S.A.; Besombes, C.; Daoud, K. Optimization of Accelerated Solvent Extraction of Carthamus Caeruleus L. Evaluation of antioxidant and anti-inflammatory activity of extracts. Ind. Crops Prod. 2017, 97, 620–631. [Google Scholar] [CrossRef]
  39. Wang, Y.; Li, X.; Peng, X.; Tang, X.; Deng, X. Optimization of sample pretreatment for determination of polycyclic aromatic hydrocarbons in estuarine sediments by gas chromatography. J. Ocean. Univ. China 2012, 11, 159–164. [Google Scholar] [CrossRef]
  40. Ji, L.; Si, Y.; Liu, H.; Song, X.; Zhu, W.; Zhu, A. Application of orthogonal experimental design in synthesis of mesoporous bioactive glass. Microporous Mesoporous Mater. 2014, 184, 122–126. [Google Scholar] [CrossRef]
  41. Ren, Y.; Wei, J.; Ji, Y.; Wu, Z.; Bi, F.; Gao, R.; Wang, X.; Li, H. Chemical composition of fine organic aerosols during a moderate pollution event in summertime in Beijing: Combined effect of primary emission and secondary formation. Atmos. Environ. 2021, 246, 118167. [Google Scholar] [CrossRef]
  42. Ren, Y.; Wang, G.; Li, J.J.; Wu, C.; Cao, C.; Li, J.; Wang, J.Y.; Ge, S.; Xie, Y.; Li, X.; et al. Evolution of aerosol chemistry in Xi’an during the spring dust storm periods: Implications for heterogeneous formation of secondary organic aerosols on the dust surface. Chemosphere 2019, 215, 413–421. [Google Scholar] [CrossRef] [PubMed]
  43. Li, J.; Wang, G.; Wu, C.; Cao, C.; Ren, Y.; Wang, J.; Li, J.; Cao, J.; Zeng, L.; Zhu, T. Characterization of isoprene-derived secondary organic aerosols at a rural site in North China Plain with implications for anthropogenic pollution effects. Sci. Rep. 2018, 8, 535. [Google Scholar] [CrossRef] [PubMed] [Green Version]
  44. Ren, Y.; Wei, J.; Wang, G.; Wu, Z.; Ji, Y.; Li, H. Evolution of aerosol chemistry in Beijing under strong influence of anthropogenic pollutants: Composition, sources, and secondary formation of fine particulate nitrated aromatic compounds. Environ. Res. 2021, 204, 111982. [Google Scholar] [CrossRef]
  45. Zhang, H.; Ji, Y.; Wu, Z.; Peng, L.; Bao, J.; Peng, Z.; Li, H. Atmospheric volatile halogenated hydrocarbons in air pollution episodes in an urban area of Beijing: Characterization, health risk assessment and sources apportionment. Sci. Total Environ. 2022, 806, 150283. [Google Scholar] [CrossRef] [PubMed]
  46. Lou, X.; Janssen, J.G.M.; Cramers, C.A. Parameters Affecting the Accelerated Solvent Extraction of Polymeric Samples. Anal. Chem. 1997, 69, 1598–1603. [Google Scholar] [CrossRef] [Green Version]
  47. Saim, N.; Dean, J.R.; Abdullah, M.P.; Zakari, Z. An Experimental Design Approach for the Determination of Polycyclic Aromatic Hydrocarbons from Highly Contaminated Soil Using Accelerated Solvent Extraction. Anal. Chem. 1998, 70, 420–424. [Google Scholar] [CrossRef]
  48. Wang, G.; Lee, A.S.; Lewis, M.; Kamath, B.; Archer, R.K. Accelerated Solvent Extraction and Gas Chromatography/Mass Spectrometry for Determination of Polycyclic Aromatic Hydrocarbons in Smoked Food Samples. J. Agric. Food Chem. 1999, 47, 1062–1066. [Google Scholar] [CrossRef]
  49. Richter, B.E.; Jones, B.A.; Ezzell, J.L.; Porter, N.L. Accelerated Solvent Extraction: A Technique for Sample Preparation. Anal. Chem. 1996, 68, 1033–1039. [Google Scholar] [CrossRef]
  50. Duan, F.; He, K.; Liu, X. Characteristics and source identification of fine particulate n-alkanes in Beijing, China. J. Environ. Sci. 2010, 22, 998–1005. [Google Scholar] [CrossRef]
  51. Wang, Q.; Shao, M.; Zhang, Y.; Wei, Y.; Hu, M.; Guo, S. Source apportionment of fine organic aerosols in Beijing. Atmos. Chem. Phys. 2009, 9, 8573–8585. [Google Scholar] [CrossRef] [Green Version]
  52. Li, Y.; Cao, J.; Li, J.; Zhou, J.; Xu, H.; Zhang, R.; Ouyang, Z. Molecular distribution and seasonal variation of hydrocarbons in PM2.5 from Beijing during 2006. Particuology 2013, 11, 78–85. [Google Scholar] [CrossRef]
  53. Guo, S.; Hu, M.; Guo, Q.; Zhang, X.; Schauer, J.J.; Zhang, R. Quantitative evaluation of emission controls on primary and secondary organic aerosol sources during Beijing 2008 Olympics. Atmos. Chem. Phys. 2013, 13, 8303–8314. [Google Scholar] [CrossRef] [Green Version]
  54. Li, H.; Lu, J.; Feng, J.; Yu, Y.; Xia, F.; Ren, L. Distribution characteristics and source identification of n-alkanes in PM2.5 in typical urban area of Beijing. Res. Environ. Sci. 2015, 28, 691–696. [Google Scholar]
  55. Wu, Y.; Yang, L.; Zheng, X.; Zhang, S.; Song, S.; Li, J.; Hao, J. Characterization and source apportionment of particulate PAHs in the roadside environment in Beijing. Sci. Total Environ. 2014, 470–471, 76–83. [Google Scholar] [CrossRef]
  56. Gao, Y.; Ji, H. Characteristics of polycyclic aromatic hydrocarbons components in fine particle during heavy polluting phase of each season in urban Beijing. Chemosphere 2018, 212, 346–357. [Google Scholar] [CrossRef]
  57. Luo, M.; Ji, Y.; Ren, Y.; Gao, F.; Zhang, H.; Zhang, L.; Yu, Y.; Li, H. Characteristics and Health Risk Assessment of PM2.5-Bound PAHs during Heavy Air Pollution Episodes in Winter in Urban Area of Beijing, China. Atmosphere 2021, 12, 323. [Google Scholar] [CrossRef]
  58. Yao, L.; Li, X.; Liu, X.; Wang, Y. Pollution Characteristics of n-alkanes in Atmospheric Fine Particles During Spring Festival of 2007 in Beijing. Environ. Sci. 2009, 30, 549–593. [Google Scholar]
  59. Li, X.; Guo, X.; Liu, X.; Liu, C.; Zhang, S.; Wang, Y. Distribution and sources of solvent extractable organic compounds in PM2.5 during 2007 Chinese Spring Festival in Beijing. J. Environ. Sci. 2009, 21, 142–149. [Google Scholar] [CrossRef]
  60. Rogge, W.F.; Hildemann, L.M.; Mazurek, M.A.; Cass, G.R.; Simoneit, B.R.T. Sources of fine organic aerosol. 4. Particulate abrasion products from leaf surfaces of urban plants. Environ. Sci. Technol. 1993, 27, 2700–2711. [Google Scholar] [CrossRef]
  61. Fernández, P.G.; Grimalt, J.O.; Vilanova, R.M. Atmospheric Gas-Particle Partitioning of Polycyclic Aromatic Hydrocarbons in High Mountain Regions of Europe. Environ. Sci. Technol. 2002, 36, 1162–1168. [Google Scholar] [CrossRef]
  62. De La Torre-Roche, R.J.; Lee, W.Y.; Campos-Diaz, S.I. Soil-borne polycyclic aromatic hydrocarbons in El Paso, Texas: Analysis of a potential problem in the United States/Mexico border region. J. Hazard. Mater. 2009, 163, 946–958. [Google Scholar] [CrossRef] [PubMed] [Green Version]
  63. Feng, B.; Li, L.; Xu, H.; Wang, T.; Wu, R.; Chen, J.; Zhang, Y.; Liu, S.; Ho, S.S.H.; Cao, J.; et al. PM2.5-bound polycyclic aromatic hydrocarbons (PAHs) in Beijing: Seasonal variations, sources, and risk assessment. J. Environ. Sci. 2019, 77, 11–19. [Google Scholar] [CrossRef] [PubMed]
  64. Dong, X.; Wang, Q.; Yibing, Y.; Tong, L.; Qin, W.; Yaxi, W.; Jianlong, F. Characterization of ambient PM2.5 and PAHs during 2017 Spring Festival in urban and suburb areas of Beijing. Environ. Chem. 2018, 37, 2191–2198. [Google Scholar]
Figure 1. Location of the monitoring site and its surroundings [45].
Atmosphere 13 00818 g001
Figure 2. The recoveries of 17 n−alkanes with ASE pretreatment under the different experimental parameters (shading represents the upper and lower errors).
Atmosphere 13 00818 g002
Figure 3. The recoveries of 11 PAHs of ASE pretreatment under the different experimental parameters (shading represents the upper and lower errors).
Atmosphere 13 00818 g003
Figure 4. Daily and diurnal variation of mass concentrations of 17 n−alkanes and 11 PAHs in the study area during the monitoring period.
Atmosphere 13 00818 g004
Figure 5. Average concentrations of 17 n−alkanes during the daytime and nighttime during the monitoring period. Error bar is one standard deviation of each individual n-alkane.
Atmosphere 13 00818 g005
Figure 6. Variation in Flu/(Flu + Pyr) and IP/(IP + BghiP), BaP/BghiP and BaA (BaA + Chr) during the monitoring period.
Atmosphere 13 00818 g006
Table 1. Four groups of ASE experimental parameters.
ASE ParametersFirst GroupSecond GroupThird GroupFourth Group
Temperature (°C)100100120150
Static time (minutes)3255
Cycle (times)2222
Flush volume (%)50406060
Purge time (seconds)60509060
Table 2. The recoveries of 17 n−alkanes and 11 PAHs by ASE pretreatment under the different experimental parameters (%).
SpeciesFirst GroupSecond GroupThird GroupFourth Group
n−alkanes50.7–123302–531197–505218–483
PAHs55.3–122371–667255–484177–587
Note: the different sets came from the averages of each of the four experiments.
Table 3. The comparison of recoveries of ASE and USE method (%).
Pretreatment MethodsASEUSE
17 n−Alkanes11 PAHs17 n−Alkanes11 PAHs
First group50.7 ± 13.055.3 ± 15.171.2 ± 36.835.5 ± 87.7
Second group123 ± 36.0118 ± 30.285.8 ± 42.245.3 ± 112
Third group87.7 ± 19.590.2 ± 22.174.8 ± 34.239.1 ± 90.3
Fourth group121 ± 33.7122 ± 31.076.4 ± 31.835.2 ± 91.0
Average recovery rate95.7 ± 21.196.4 ± 23.177.0 ± 35.438.4 ± 95.2
Table 4. Comparison of 17 n−alkanes and BaP mass concentrations in PM2.5 in Beijing with other studies.
Sampling YearSpeciesMass ConcentrationReference
2004C11–C34105.38[50]
2005C18–C3648.00[51]
2006C19–C36179.00[52]
2008C12–C3671.60[53]
2013C14–C3680.52[54]
2017C19–C35350.02This study
2008–2009BaP3.25[55]
2015–20162.77[56]
20170.69This study
20180.82[57]
Publisher’s Note: MDPI stays neutral with regard to jurisdictional claims in published maps and institutional affiliations.

