Article

Atmospheric Carbonyl Compounds in the Central Taklimakan Desert in Summertime: Ambient Levels, Composition and Sources

1
State Key Laboratory of Environmental Criteria and Risk Assessment, Chinese Research Academy of Environmental Sciences, Beijing 100012, China
2
The Xinjiang Uygur Autonomous Region Environmental Monitoring Station, Urumchi 830011, China
3
Univ Lyon, Université Claude Bernard Lyon 1, CNRS, IRCELYON, 69626 Villeurbanne, France
4
Department of Planning, Industry and Environment, New South Wales Government, Parramatta 1825, Australia
*
Author to whom correspondence should be addressed.
These authors contributed equally to this work.
Atmosphere 2022, 13(5), 761; https://doi.org/10.3390/atmos13050761
Submission received: 21 March 2022 / Revised: 20 April 2022 / Accepted: 28 April 2022 / Published: 8 May 2022

Abstract

:
Although carbonyl compounds are a key species with atmospheric oxidation capacity, their concentrations and sources have not been sufficiently characterized in various atmospheres, especially in desert areas. In this study, atmospheric carbonyl compounds were measured from 16 May to 15 June 2018 in Tazhong in the central Taklimakan Desert, Xinjiang Uygur Autonomous Region, China. Concentrations, chemical compositions, and sources of carbonyl compounds were investigated and compared with those of different environments worldwide. The average concentration of total carbonyls during the sampling period was 11.79 ± 4.03 ppbv. Formaldehyde, acetaldehyde, and acetone were the most abundant carbonyls, with average concentrations of 6.08 ± 2.37, 1.68 ± 0.78, and 2.52 ± 0.68 ppbv, respectively. Strong correlations between formaldehyde and other carbonyls were found, indicating same or similar sources and sinks. A hybrid single-particle Lagrangian integrated trajectory was used to analyze 72 h back trajectories. The values of C1/C2 (formaldehyde to acetaldehyde, 3.22–4.59) and C2/C3 (acetaldehyde to propionaldehyde, 15.00–17.03) from different directions and distances of the trajectories were consistent with the characteristics of a remote area. Relative to various environments, the carbonyl concentration in the Tazhong desert site was lower than that in urban areas and higher than that in suburban and remote areas, implying contributions from local primary and secondary sources. The obtained data can be used to improve the source and sink estimation of carbonyls at the regional scale.

1. Introduction

Carbonyl compounds exist widely in ambient air and play an important role in atmospheric photochemical reactions. The photolysis of most carbonyls generates many free radicals [1,2], which makes carbonyls important precursors of near-surface ozone and intermediate products in secondary organic aerosol (SOA) formation [3,4]. Additionally, many carbonyl compounds have been proven to have adverse health effects [5]. Formaldehyde and acetaldehyde are inherently toxic and have been listed as dangerous carcinogens by the World Health Organization and the United States Environmental Protection Agency (US EPA), and acetone has critical effects on the blood and kidneys [6].
In recent years, carbonyls have received much attention. Carbonyls are derived from a variety of sources, including anthropogenic (e.g., vehicles and industry) and biogenic emissions (e.g., vegetation) [3,7,8,9]. Secondary production via hydrocarbon oxidation also plays a significant role in carbonyl formation [10,11]. Carbonyls are the major sources of OH, HO2, RO, and RO2 radicals, which affect the atmospheric oxidation capacity [3,12,13,14]. Formaldehyde, acetaldehyde, and acetone are the three most abundant compounds, sometimes accounting for more than 70% [3,15,16].
For carbonyls’ sampling and analysis, the typically used method is the EPA method TO-11A. Because of the instability of carbonyls, DNPH cartridge sampling and HPLC analysis are required. So, most carbonyl compound studies have been performed in large cities, with fewer focusing on rural or suburban areas or mountain, marine, or polar environments [17,18,19]. In particular, there has been little research on desert areas. A previous study of desert areas focused on alkanes, alkenes, and aromatics, rather than carbonyls [20]. Desert areas have few anthropogenic emission sources and sparse vegetation coverage, but with sufficient solar radiation, making them a unique environment. Carbonyls might have various formation mechanisms and characteristics, and impacts on the local atmosphere.
The Taklimakan Desert in the Xinjiang Uygur Autonomous Region of China is the world’s second-largest shifting sand desert. The area of this desert is approximately 340,000 km2 and has important environmental effects on the Tibetan Plateau and eastern Asia [21,22]. In this study, air samples were collected in the central region of the Taklimakan Desert, and their carbonyl compounds were analyzed to understand the ambient level, composition, and sources of carbonyl compounds in that environment. Based on previous research, the carbonyl concentration and species’ ratio in this study were compared with those in various atmospheres. Adding data from a desert environment to existing knowledge and exploring their similarities and differences would help to guide future research and to better understand carbonyl pollution.

2. Materials and Methods
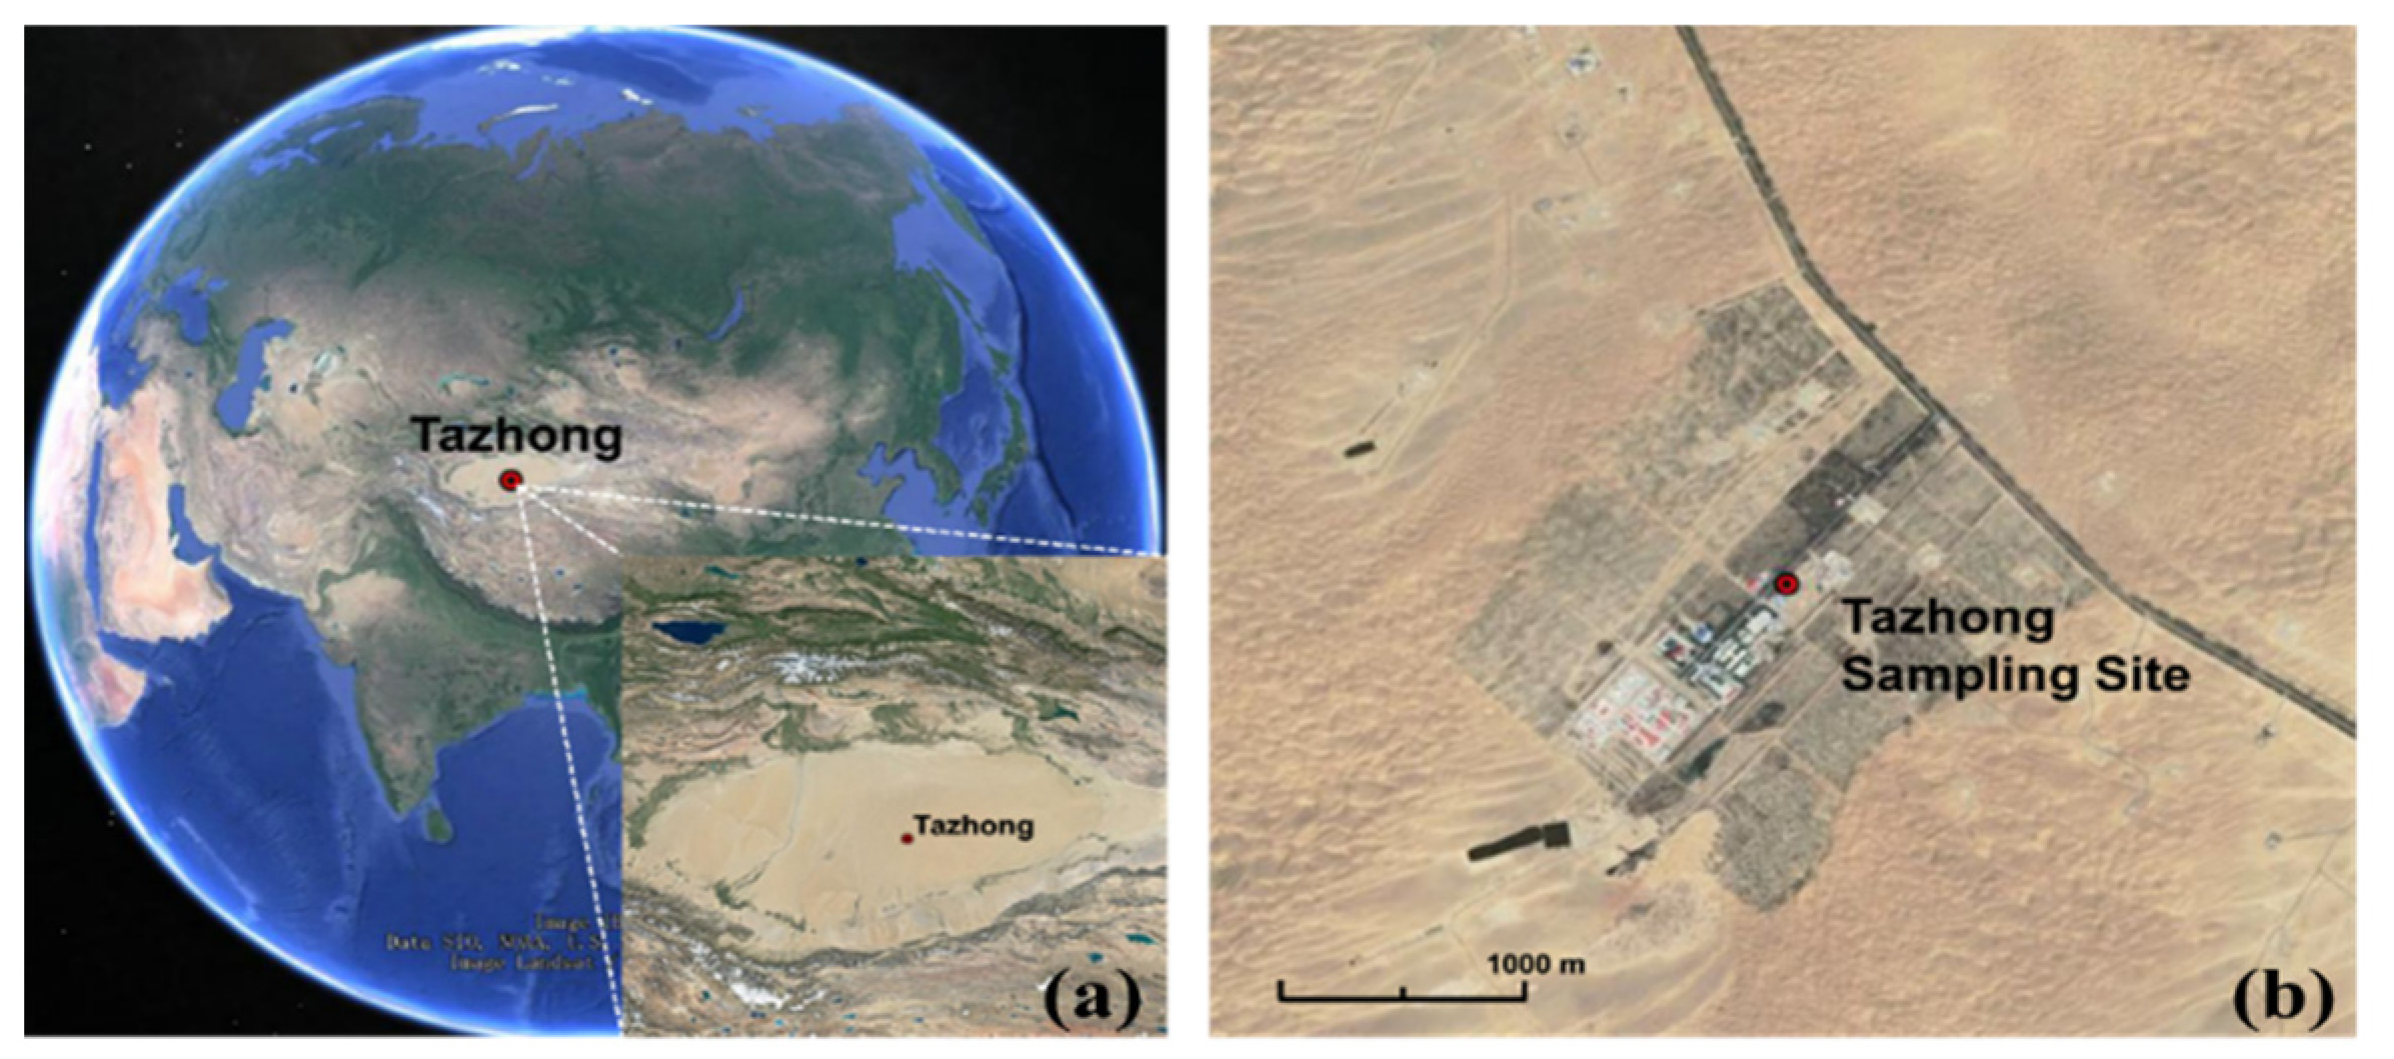
2.1. Sampling Site

Samples were collected in Tazhong (38.97° N, 83.66° E; Figure 1), which is located in the center of the Taklimakan Desert in the Xinjiang Uygur Autonomous Region, western China. There was extremely low vegetation coverage and a human settlement (less than 1.5 km2) around the sampling site, with a road 1 km to the northeast. Oil wells and pumping machines are distributed across the region. Due to its continental climate, diurnal temperature variation is wide, and annual precipitation is extremely low, with an average precipitation of 26 mm in the center of the desert [23]. Due to the extremely arid climate, there was a sparse coverage of desert plants, such as Tamarix ramosissima and Populus euphratica, around the sampling site and on both sides of the road.

2.2. Sampling and Analysis

The carbonyl sampling and analysis were based on the EPA method TO-11A [24,25,26]. Air samples were collected at a local automated meteorological station from 16 May to 15 June 2018. Sampler was placed in the laboratory. The sampling tube extended out of the window with a filter in the inlet of the tube to avoid particle interference. The sampling height was about 1.5 m above the ground. Sampling was conducted with a multichannel automatic sampler with four channels, each connected to a 2,4-dinitrophenylhydrazine (DNPH) cartridge (Inertsep Mini Aero DNPH 300 MG, Shimadzu Corporation, Kyoto, Japan). The inlet and outlet of each channel were equipped with two program-controlled electromagnetic valves. Sampling was conducted in four channels in succession. Each channel corresponded to a sampling time period. The DNPH cartridges were sealed after sampling and stored in a refrigerator before being analyzed. KI columns (Tianjin Agela Technology Co., Ltd., Tianjin, China) were used to eliminate ozone interference. When relative humidity in the ambient air was high, KI changed to yellow after absorbing a certain amount of water. If this happened, KI column was changed immediately.
The sampling flow rate was approximately 1.5 L/min, and real-time measurement was performed with a digital flowmeter. Sampling was performed in four periods of the day: 9:00–13:00, 13:00–17:00, 17:00–21:00, and 21:00 to 9:00 the next day (local time was UTC+06:00, as it was for times mentioned later). Four samples were obtained every 24 h, and a total of 119 samples were collected. Two DNPH cartridges were connected in series to collect and evaluate the breakthrough every 3 d. The samples were stored in a refrigerator below 4 °C until analysis, which met the requirement of EPA TO-11A.
Eighteen carbonyls were selected as target species. Fifteen of the carbonyls are listed in EPA method TO-11A: formaldehyde, acetaldehyde, acrolein, acetone, propionaldehyde, crotonaldehyde, butyraldehyde, benzaldehyde, isovaleraldehyde, valeraldehyde, o-tolualdehyde, m-tolualdehyde, p-tolualdehyde, hexaldehyde, and 2,5-dimethylbenzaldehyde. Additionally, methacrolein and two dialdehydes (glyoxal and methylglyoxal) were studied [25,26].
The hydrazone derivatives in the DNPH cartridges were eluted with 5 mL acetonitrile (ACN) (HPLC grade, Fisher, USA). Part of the solution was transferred to a 1.5 mL brown analytical flask. Then, a 20 μL sample was extracted by an automatic sampler and injected into a high-performance liquid chromatography (LC-20AD, Shimadzu, Kyoto, Japan)/ultraviolet (SPD-20A, Shimadzu, Kyoto, Japan)/mass spectrometry (MS) API3200 (AB Sciex Company, Framingham, MA, USA) system. The mobile phase of HPLC comprised two eluent: acetonitrile (HPLC grade, Fisher, Hampton, NH, USA) and deionized water (Watsons, Beijing, China). The total flow rate was constant and was 1.0 mL/min. The gradient program was as follows: (1) 0–20 min 60% acetonitrile and 40% water, (2) 20–30 min from 60% to 100% acetonitrile and 40% to 0% water, (3) 30–32 min from 100% to 60% acetonitrile and 0% to 40% water, (4) 32–40 min 60% acetonitrile and 40% water.
The carbonyls listed in TO-11A and the methacrolein were detected by a 360 nm UV detector at 40 °C in a column oven, and the others were detected by an MS detector. The qualitative and quantitative analyses of the carbonyls were based on their retention times and peak areas. The mass concentrations of carbonyls were obtained by AB SCIEX software [25,26]. Besides acrolein, the other seventeen carbonyls were detected in this study.
Meteorological data obtained from the automated weather station at the sampling site included temperature, relative humidity, wind direction, and wind speed.

2.3. Quality Assurance and Quality Control

The standard materials were as follows [24,26]: TO-11A standard solution (Supelco, Bellefonte, PA, USA), methacrolein DNPH standard (Supelco, Bellefonte, PA, USA), 40% glyoxal in water (analytical grade, Sigma-Aldrich Company, Burlington, MA, USA), and 40% methylglyoxal aqueous solution (analytical grade, Sigma-Aldrich Company, Burlington, MA, USA). Blank cartridges from each batch were tested before sampling. The derivative standard curves of 18 carbonyl compounds were positively correlated (R2 = 0.9968–1.0000). Cartridge collection efficiency was calculated as over 97.8%, and it was demonstrated that one 5 mL extraction was enough to recover all carbonyls completely by double-extraction testing. The method detection limits were 0.006–0.045 ppbv for the 18 carbonyls with a 360 L sampling volume [25,26]. The field blank was usually the same order of magnitude as the laboratory blank, indicating no contamination. For all identified carbonyls, the relative standard deviation of each calibration standard measurement value was <7.9%. For each sample, the HPLC chromatogram was calibrated to ensure the accuracy of different carbonyl identifications.

3. Results and Discussion

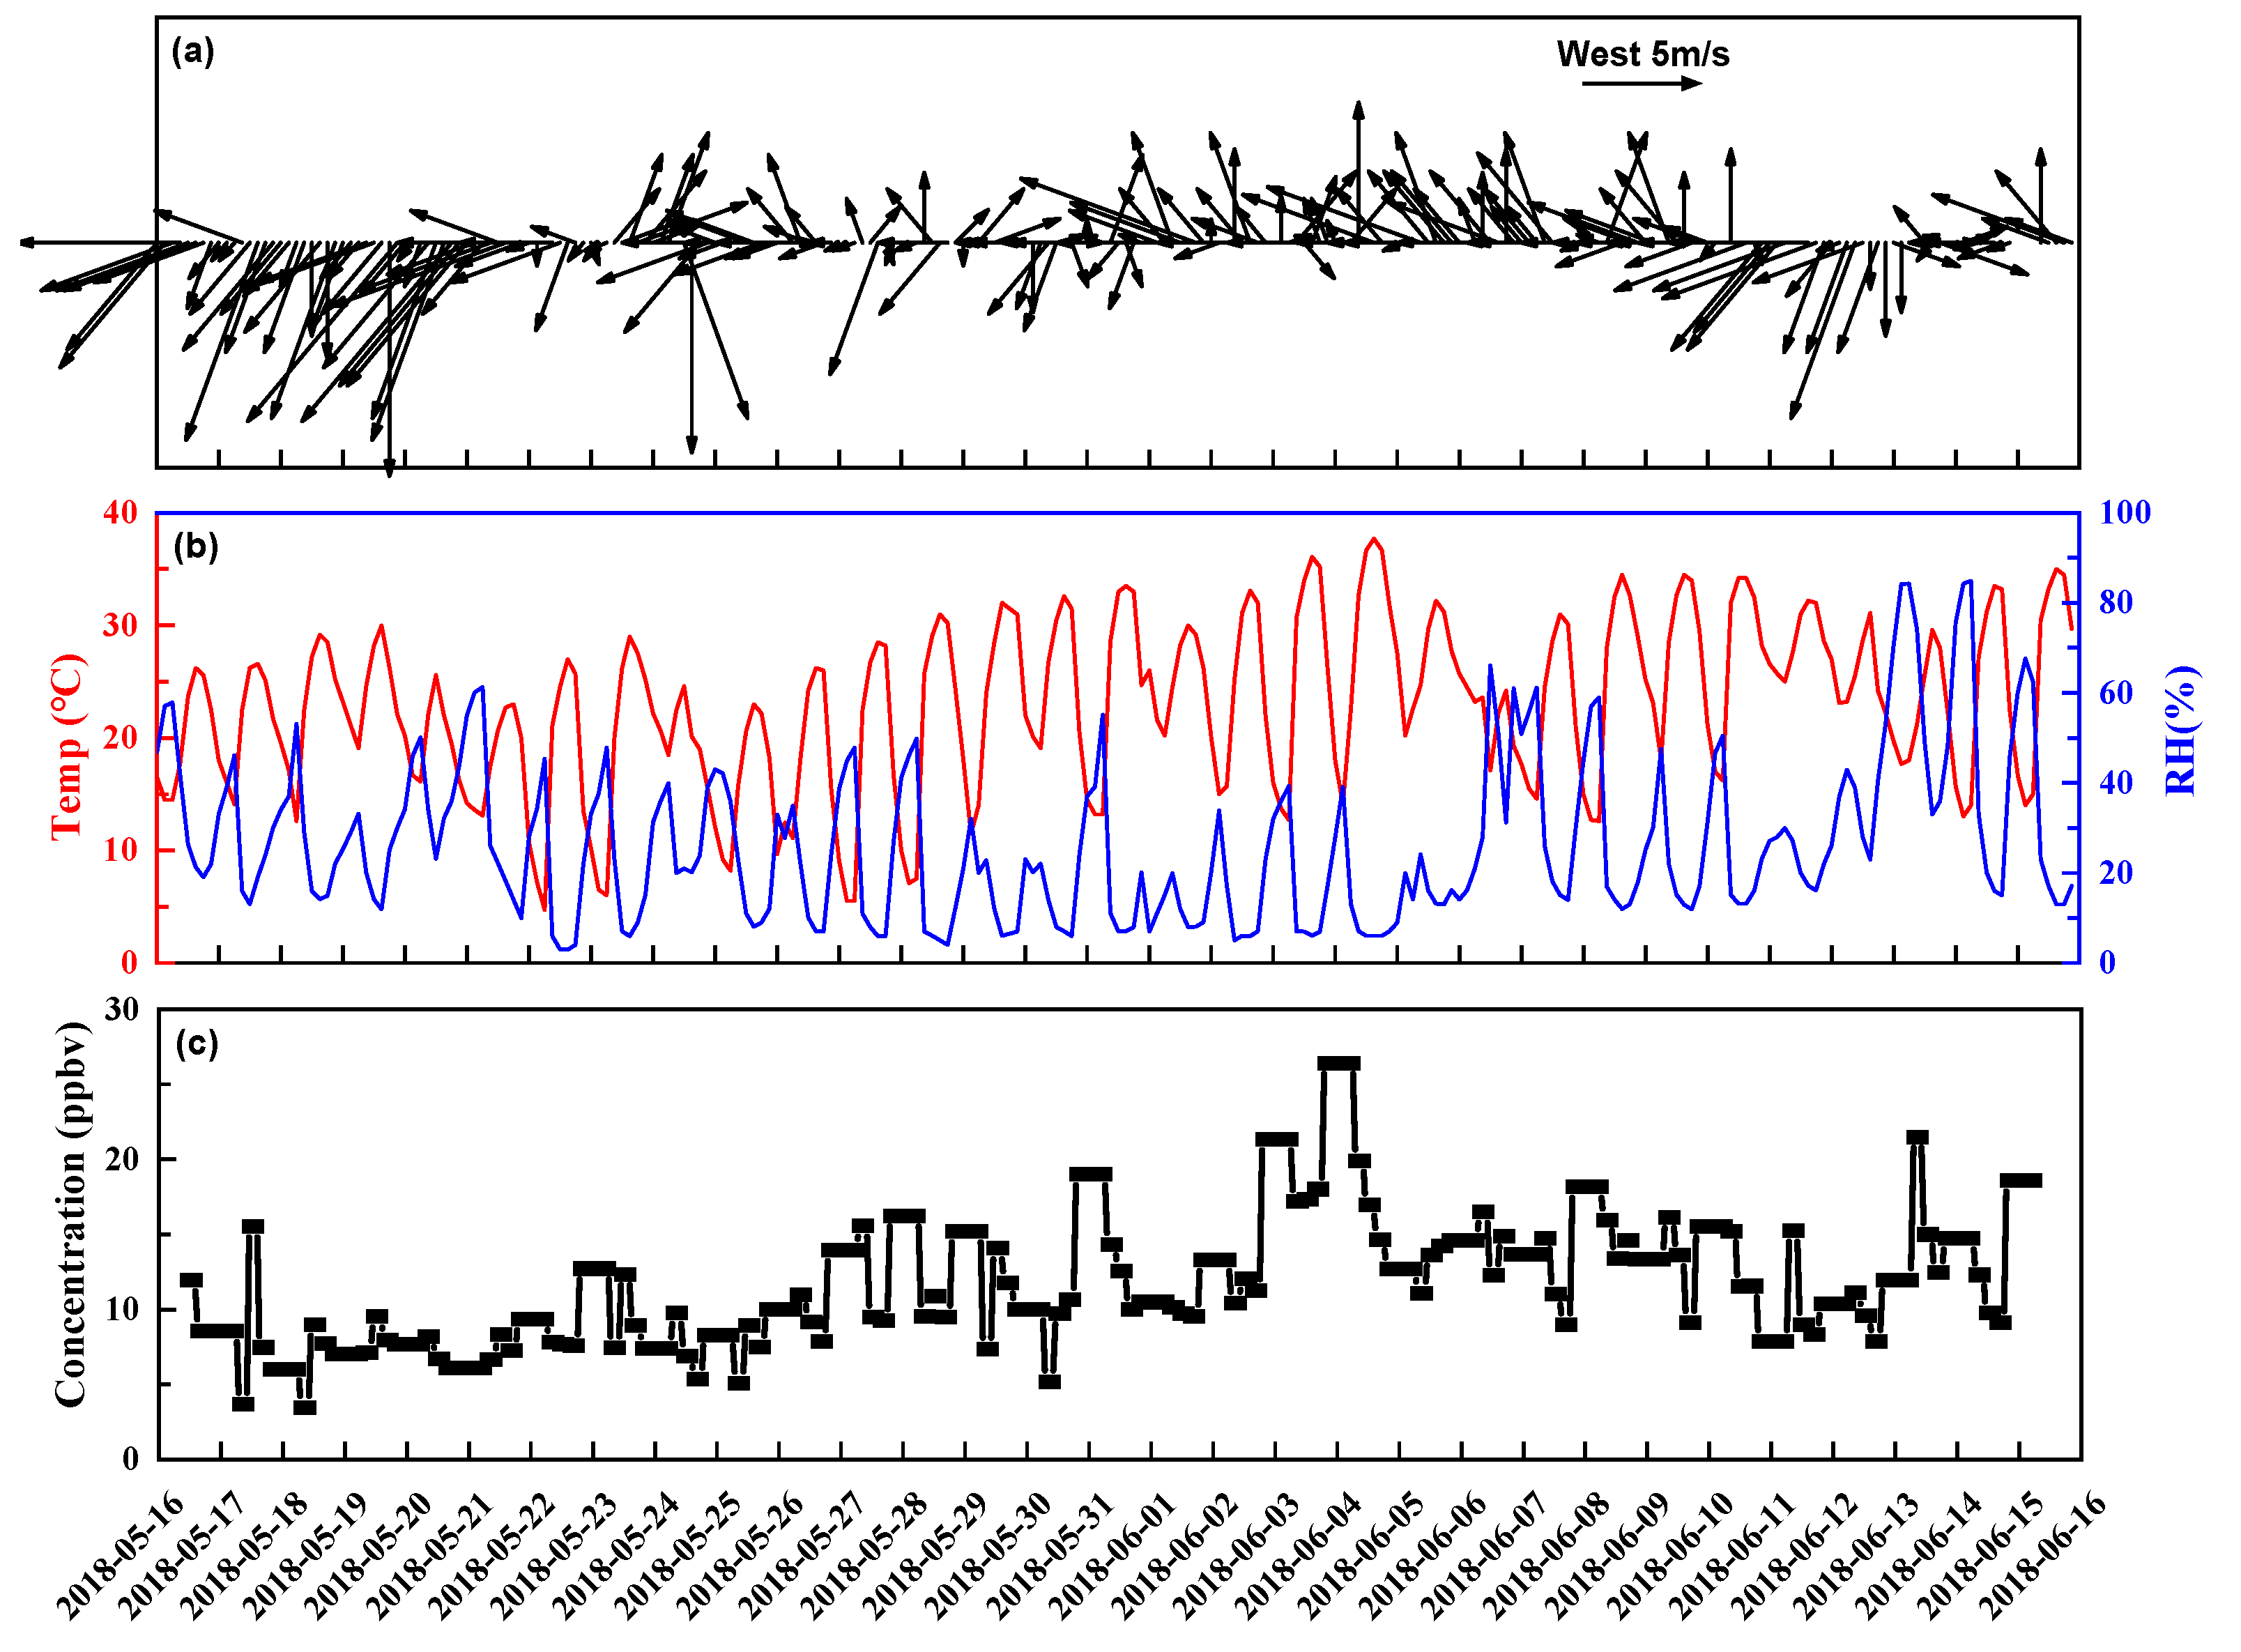
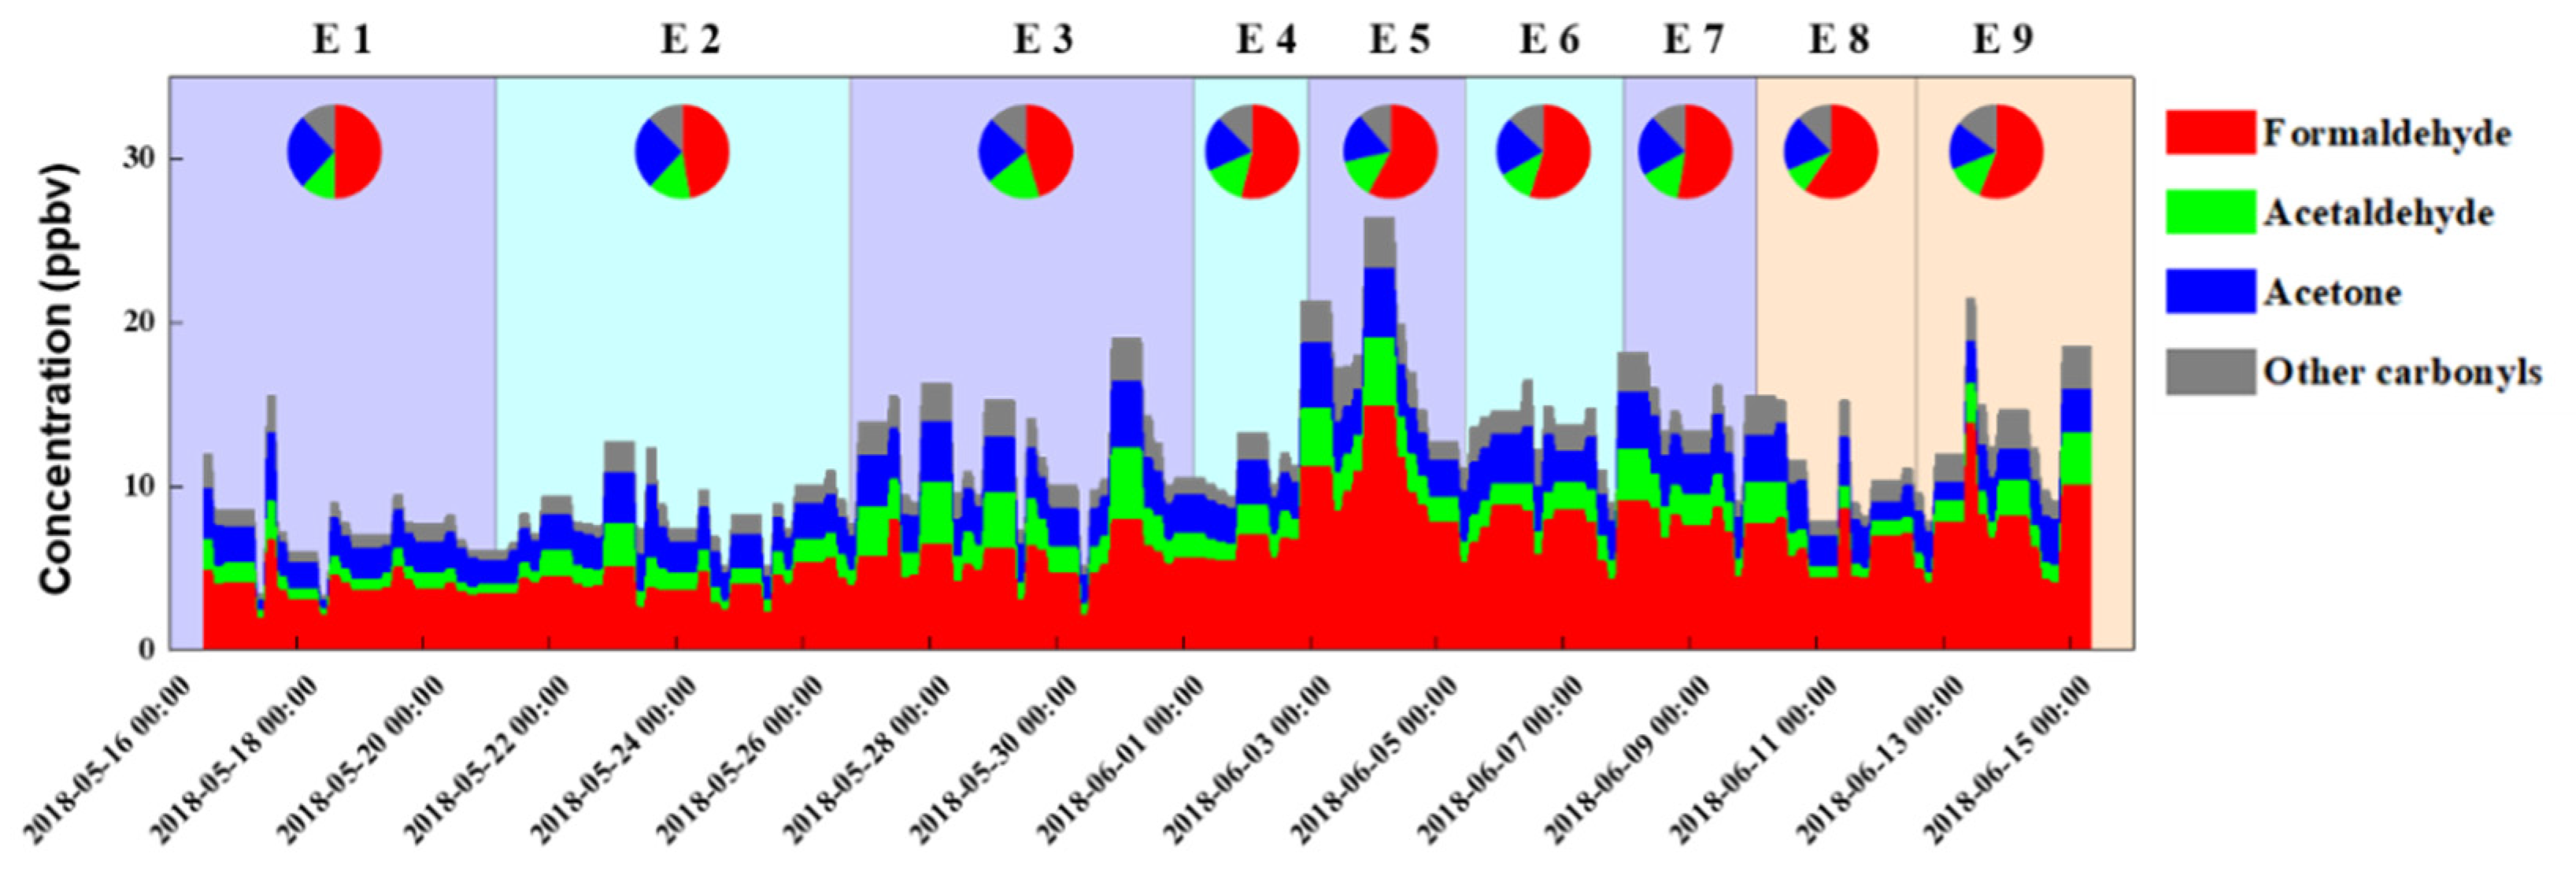
3.1. Carbonyl Concentrations and Compositions

Figure 2 shows the general meteorological conditions and total concentrations of carbonyls observed during the sampling period. The sampling site’s average temperature and relative humidity were 22.9 ± 7.4 °C and 26.6 ± 17.8%, respectively. The dominant wind direction was northeast. The average wind speed was 3.5 ± 2.2 m/s.
The average concentrations (±standard deviation) of those carbonyls measured at four time periods are summarized in Table 1. The average concentration of total carbonyls during the sampling period was 11.79 ± 4.03 ppbv, ranging from 3.70 to 26.44 ppbv. The three most abundant carbonyls were formaldehyde (6.08 ± 2.37 ppbv), acetaldehyde (1.68 ± 0.78 ppbv), and acetone (2.52 ± 0.68 ppbv), which accounted for 51.6%, 14.2%, and 21.4%, respectively, of the average total carbonyl concentration. Those three compounds as major components are similar to those in studies of urban areas [18,27,28] and other rural areas [17,19,29,30]. However, the total percentage of those three components (87.2%) was higher than that found in previous studies [17,19]. The other individual carbonyl concentrations were <1 ppbv and accounted for only 12.8% of the average total carbonyl concentration.
It was also found that two dicarbonyls, glyoxal and methylglyoxal, had relatively high concentrations of 0.21 ± 0.15 ppbv and 0.42 ± 0.25 ppbv, respectively. Glyoxal and methylglyoxal are important precursors of SOAs due to their strong reactivity [4,31]. Relative to those of other studies, the concentrations of those two dicarbonyls in Tazhong were lower than those of glyoxal (0.30 to 0.69 ppbv) and methylglyoxal (0.90 to 1.39 ppbv) recorded in summer in an urban area [11]. However, they were higher than those of glyoxal (0.02 to 0.08 ppbv) and methylglyoxal (0.03 to 0.09 ppbv) recorded in summer in suburban and forest areas [32,33].
There were no marked diurnal variations for the carbonyls. The total concentration difference between day and night was 16%. Higher average concentrations of total carbonyls and some individual carbonyl compounds, such as formaldehyde, acetaldehyde, propionaldehyde, glyoxal, and methylglyoxal, were recorded in the period of 21:00 to 9:00 the next day, whereas lower average concentrations were recorded in the period of 17:00−21:00. At the sampling site, sunrise, noon, and sunset occurred at 6:25−6:45, 14:06−14:10, and 21:30−21:50, respectively, during the sampling period. Thus, the sampling period from 21:00 to 9:00 the next day can represent nighttime. So, the total carbonyl concentration peaked in the nighttime instead of at noon. That was different from the noon peaks reported in cities, such as Orléans and Beijing, and oil fields, such as the Dongying oil field [18,34,35], where carbonyl concentrations were strongly elevated by the local photo-oxidation of relatively high concentrations of hydrocarbon precursors. That suggests that local secondary formation might not have been the dominant source of carbonyls in the test area. The boundary layer descent at night could have also caused the accumulation of carbonyls. Note that the relatively low temporal resolution used might have obscured some diurnal variations.

3.2. Sources of Carbonyls

3.2.1. Pearson Correlation

Pearson correlations (version 22.0, SPSS, Almonc, USA) were used to investigate the relationships among concentrations of carbonyl species (Table S1). Strong correlations (0.55**, Pearson correlation, 0.01 level) were found between formaldehyde and other carbonyls, such as acetaldehyde, acetone, propionaldehyde, butyraldehyde, benzaldehyde, p-tolualdehyde, hexaldehyde, and methacrolein. Significant positive correlations (0.57**, Pearson correlation, 0.01 level) were also observed between glyoxal and methylglyoxal. This suggests that most major carbonyls had the same or similar sources and sinks. Glyoxal was used as an indicator to estimate secondary formaldehyde concentrations because it does not react with NO and has sink reactions similar to those of formaldehyde [36]. Glyoxal had a weak correlation (0.35**, Pearson correlation, 0.01 level) with formaldehyde over the sampling period, indicating the existence of secondary carbonyl formation. Acetone has a relatively long lifetime (53 days with ● OH reaction, approximately 60 days by photolysis) [37] and is considered one of the potential precursors of methylglyoxal [38,39,40,41]. In this study, the mean daily concentration of ketone was five times higher than that of methylglyoxal, and there was a significant positive correlation between acetone and methylglyoxal (0.62**, Pearson correlation, 0.01 level). Those also confirmed that the secondary formation played an important role in methylglyoxal formation. For meteorological factors, there were weak correlations between some carbonyl concentrations and meteorological factors. This suggests that meteorological conditions may have some effect on carbonyl formation, but a minimal one.

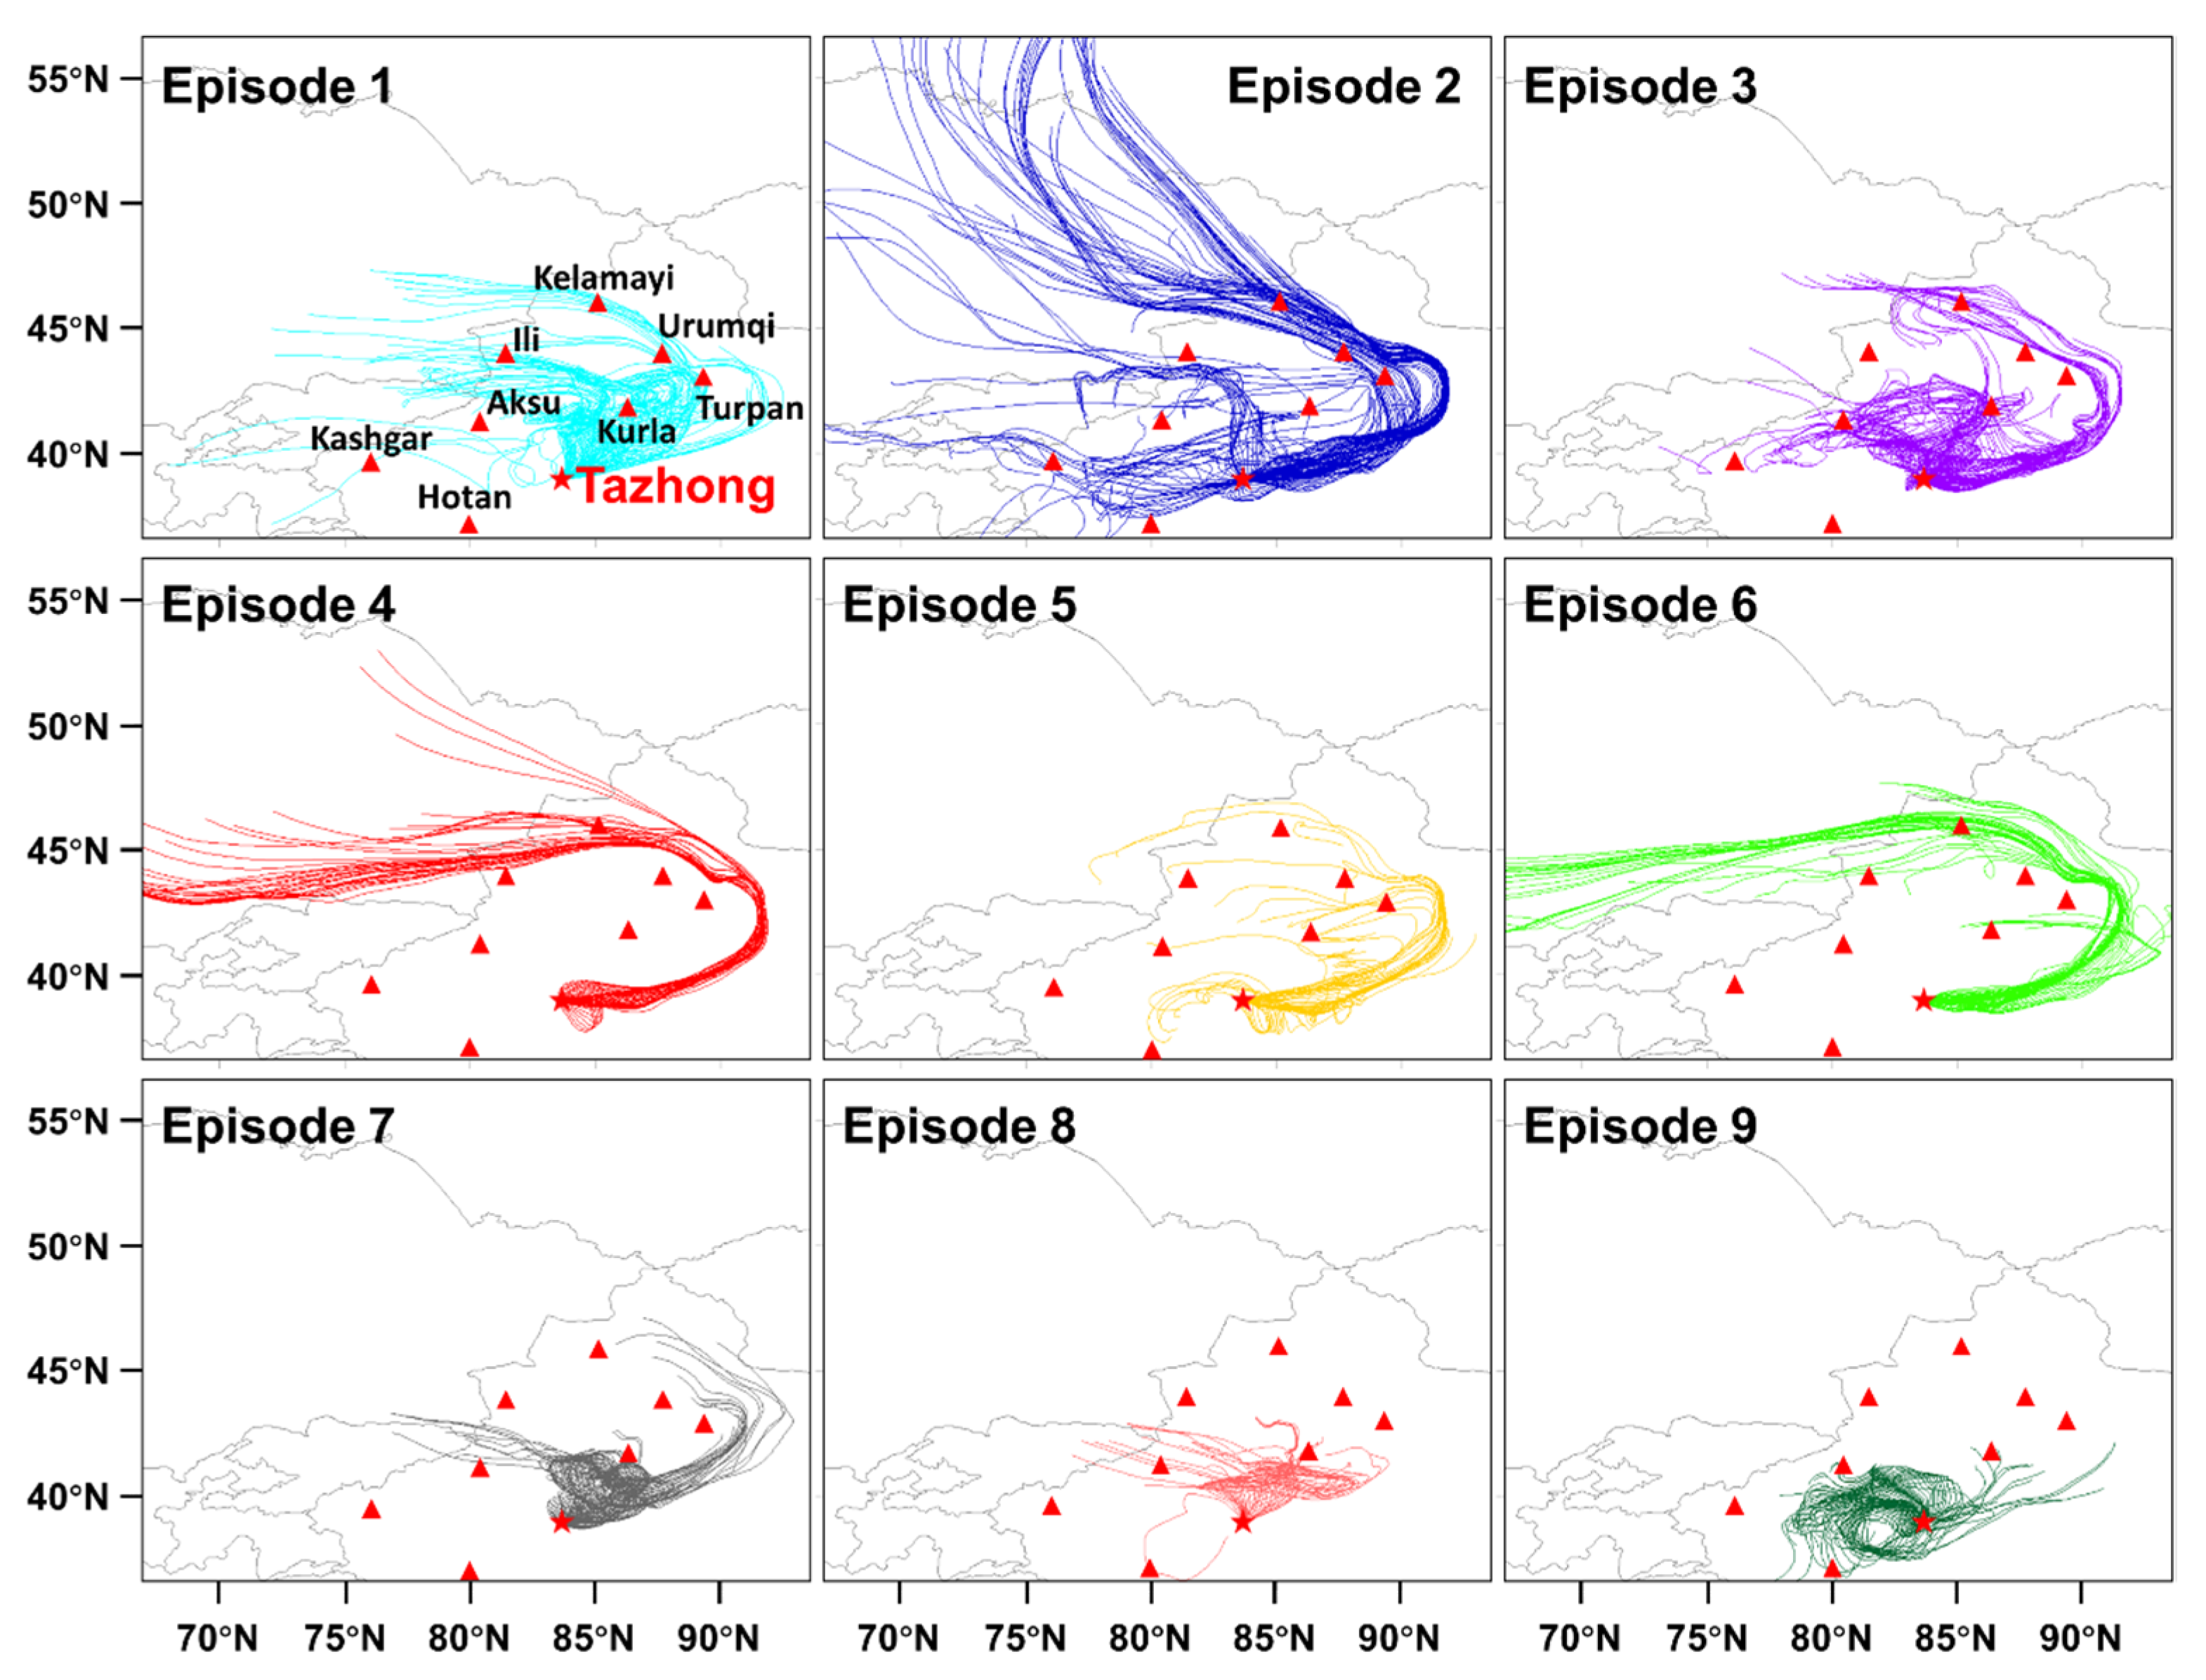
3.2.2. Back Trajectory Analysis

To better understand the sources of carbonyls, the back trajectories of air masses were calculated (as shown in Figure 3). Trajectories were computed by hybrid single-particle Lagrangian integrated trajectory (HYSPLIT) software (v 5.0). Each trajectory was calculated every 1 h for 72 h (24 trajectories per d). Based on the dominant directions and distances of the trajectories, the sampling period was divided into nine episodes (E1–E9) and was then classified into three types. The time series and chemical constituents of the carbonyls are shown in Figure 4 and Table S2.
Corresponding with the paths of air masses, the carbonyl concentrations of each type showed different characteristics. Type 1 contained E1, E3, E5, and E7, the air masses with medium-distance transport. Those air masses were derived from multiple cities (including the provincial capital Urumqi, Kelamayl, Turpan, Kurla, Illi, and Aksu) with a relatively low wind speed (3.31 m/s). The hourly mean concentrations of HCHO (6.00 ± 2.66 ppbv) and total carbonyls (11.97 ± 4.86) were in the middle level among the three types. When those air masses passed over large cities, they carried highly polluted air masses, so high concentrations were observed in those periods. Type 2 comprised E2, E4, and E6, the air masses with long-distance transport. Those air masses were from Kazakhstan or Kyrgyzstan and brought clean air masses and better diffusion conditions with a wind speed of 3.60 m/s. In those cases, most carbonyl compounds and total concentrations were relatively low. The hourly mean concentrations of HCHO and total carbonyls were 5.69 ± 2.25 ppbv and 11.07 ± 3.84 ppbv, respectively. Type 3 comprised E8 and E9, the air masses with short-range transport distances. Those masses were more affected by local air masses than those of other episodes, with the highest HCHO (7.04 ± 2.17 ppbv) and total carbonyl (12.59 ± 3.58 ppbv) concentrations. The air masses hovered over the area and passed through the nearby cities, such as Kurla and Kashgra for E8 and Hotan and Aksu for E9. Those short-distance transports led to an accumulation of pollutants. For acetone, the average concentration was similar in each type and was from 2.29 ± 0.69 ppbv to 2.64 ± 0.77 ppbv. Acetone has a relatively long life, as previously stated. During the 72 h of transport, chemical formation and consumption occurred simultaneously, and the acetone showed a similar concentration in each episode. The values of C1/C2 (formaldehyde to acetaldehyde, 3.22–4.59) and C2/C3 (acetaldehyde to propionaldehyde, 15.00–17.03) were consistent with the characteristics of a remote area [32,42].
Additionally, the temperature gradually increased from spring (May) to summer (June). As photochemical reaction products, the concentrations of carbonyls increased too, especially HCHO. From E1 to E3, the sum of carbonyls (9.71 ± 3.37 ppbv on average) was lower than that in the following episode, which was in accord with the lower temperature (20.74 °C). Formaldehyde maintained similar percentages and never exceeded 50%. In E4, the concentration of formaldehyde increased by approximately 9% compared to E3. In E5, the highest total carbonyl concentration (18.49 ± 5.61 ppbv) was obtained, accompanied with the low relative humidity (15.75%) and the second-highest temperature (27.06 °C). Although the proportion of formaldehyde fluctuated in subsequent episodes, a high formaldehyde content was maintained at >53% in E4−E7. Then, the formaldehyde proportion increased to 56% in E8 and E9.

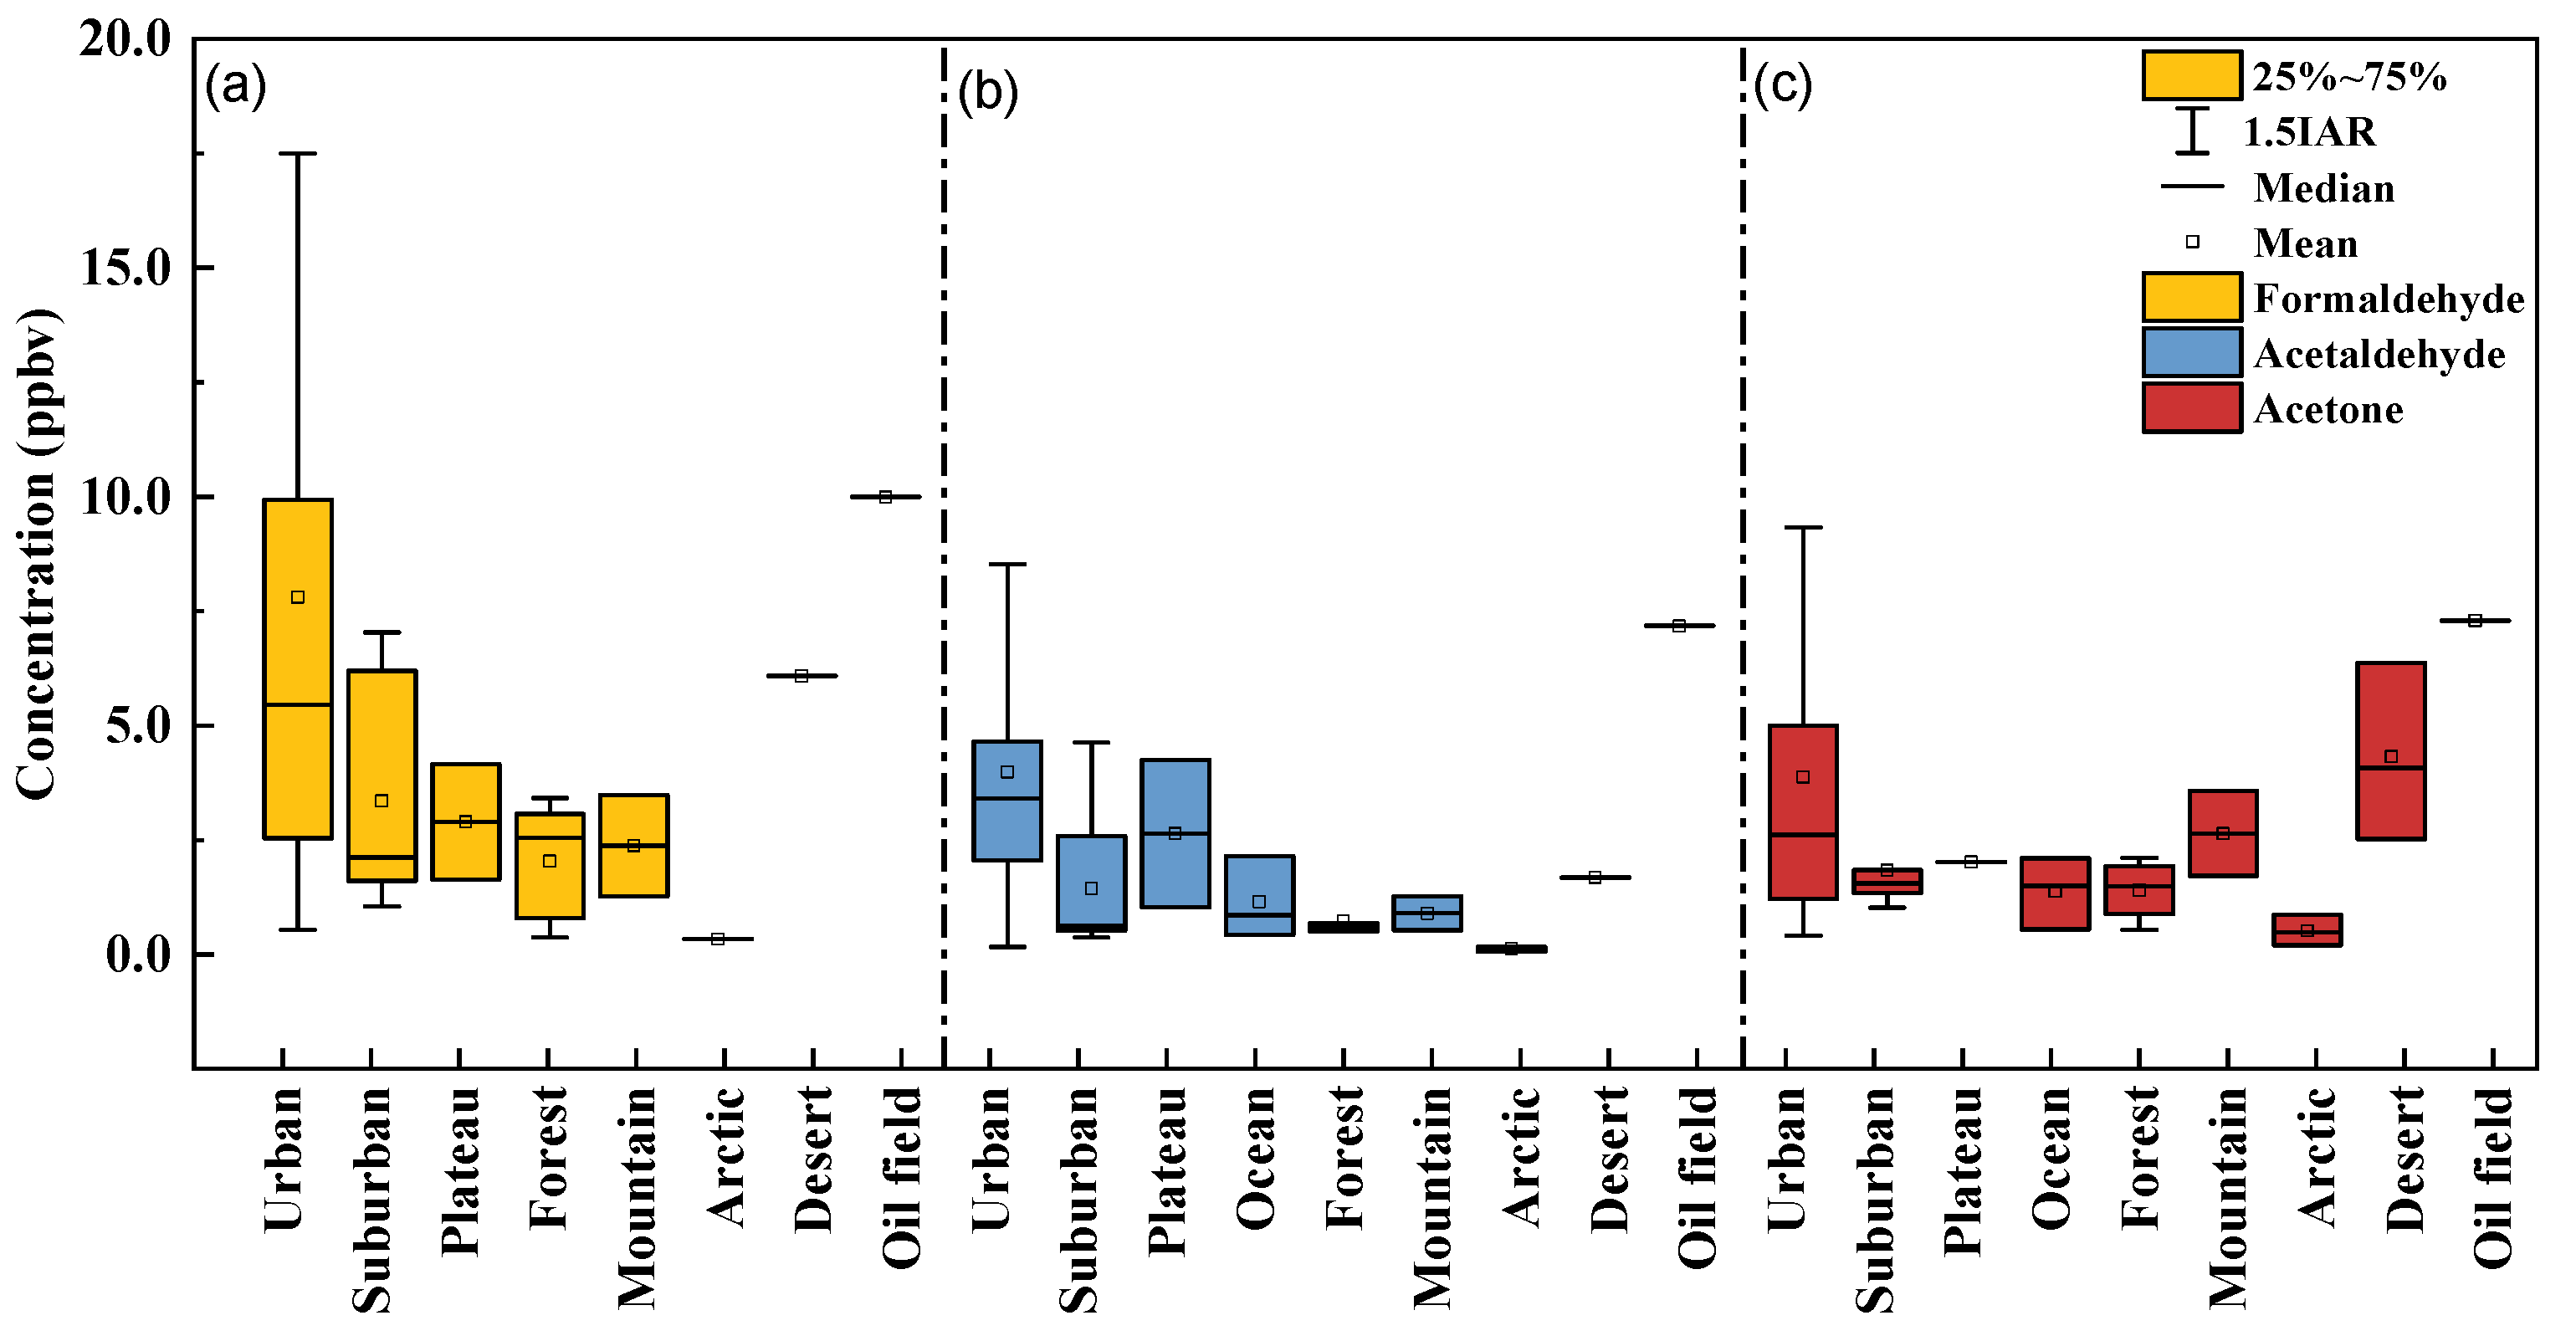
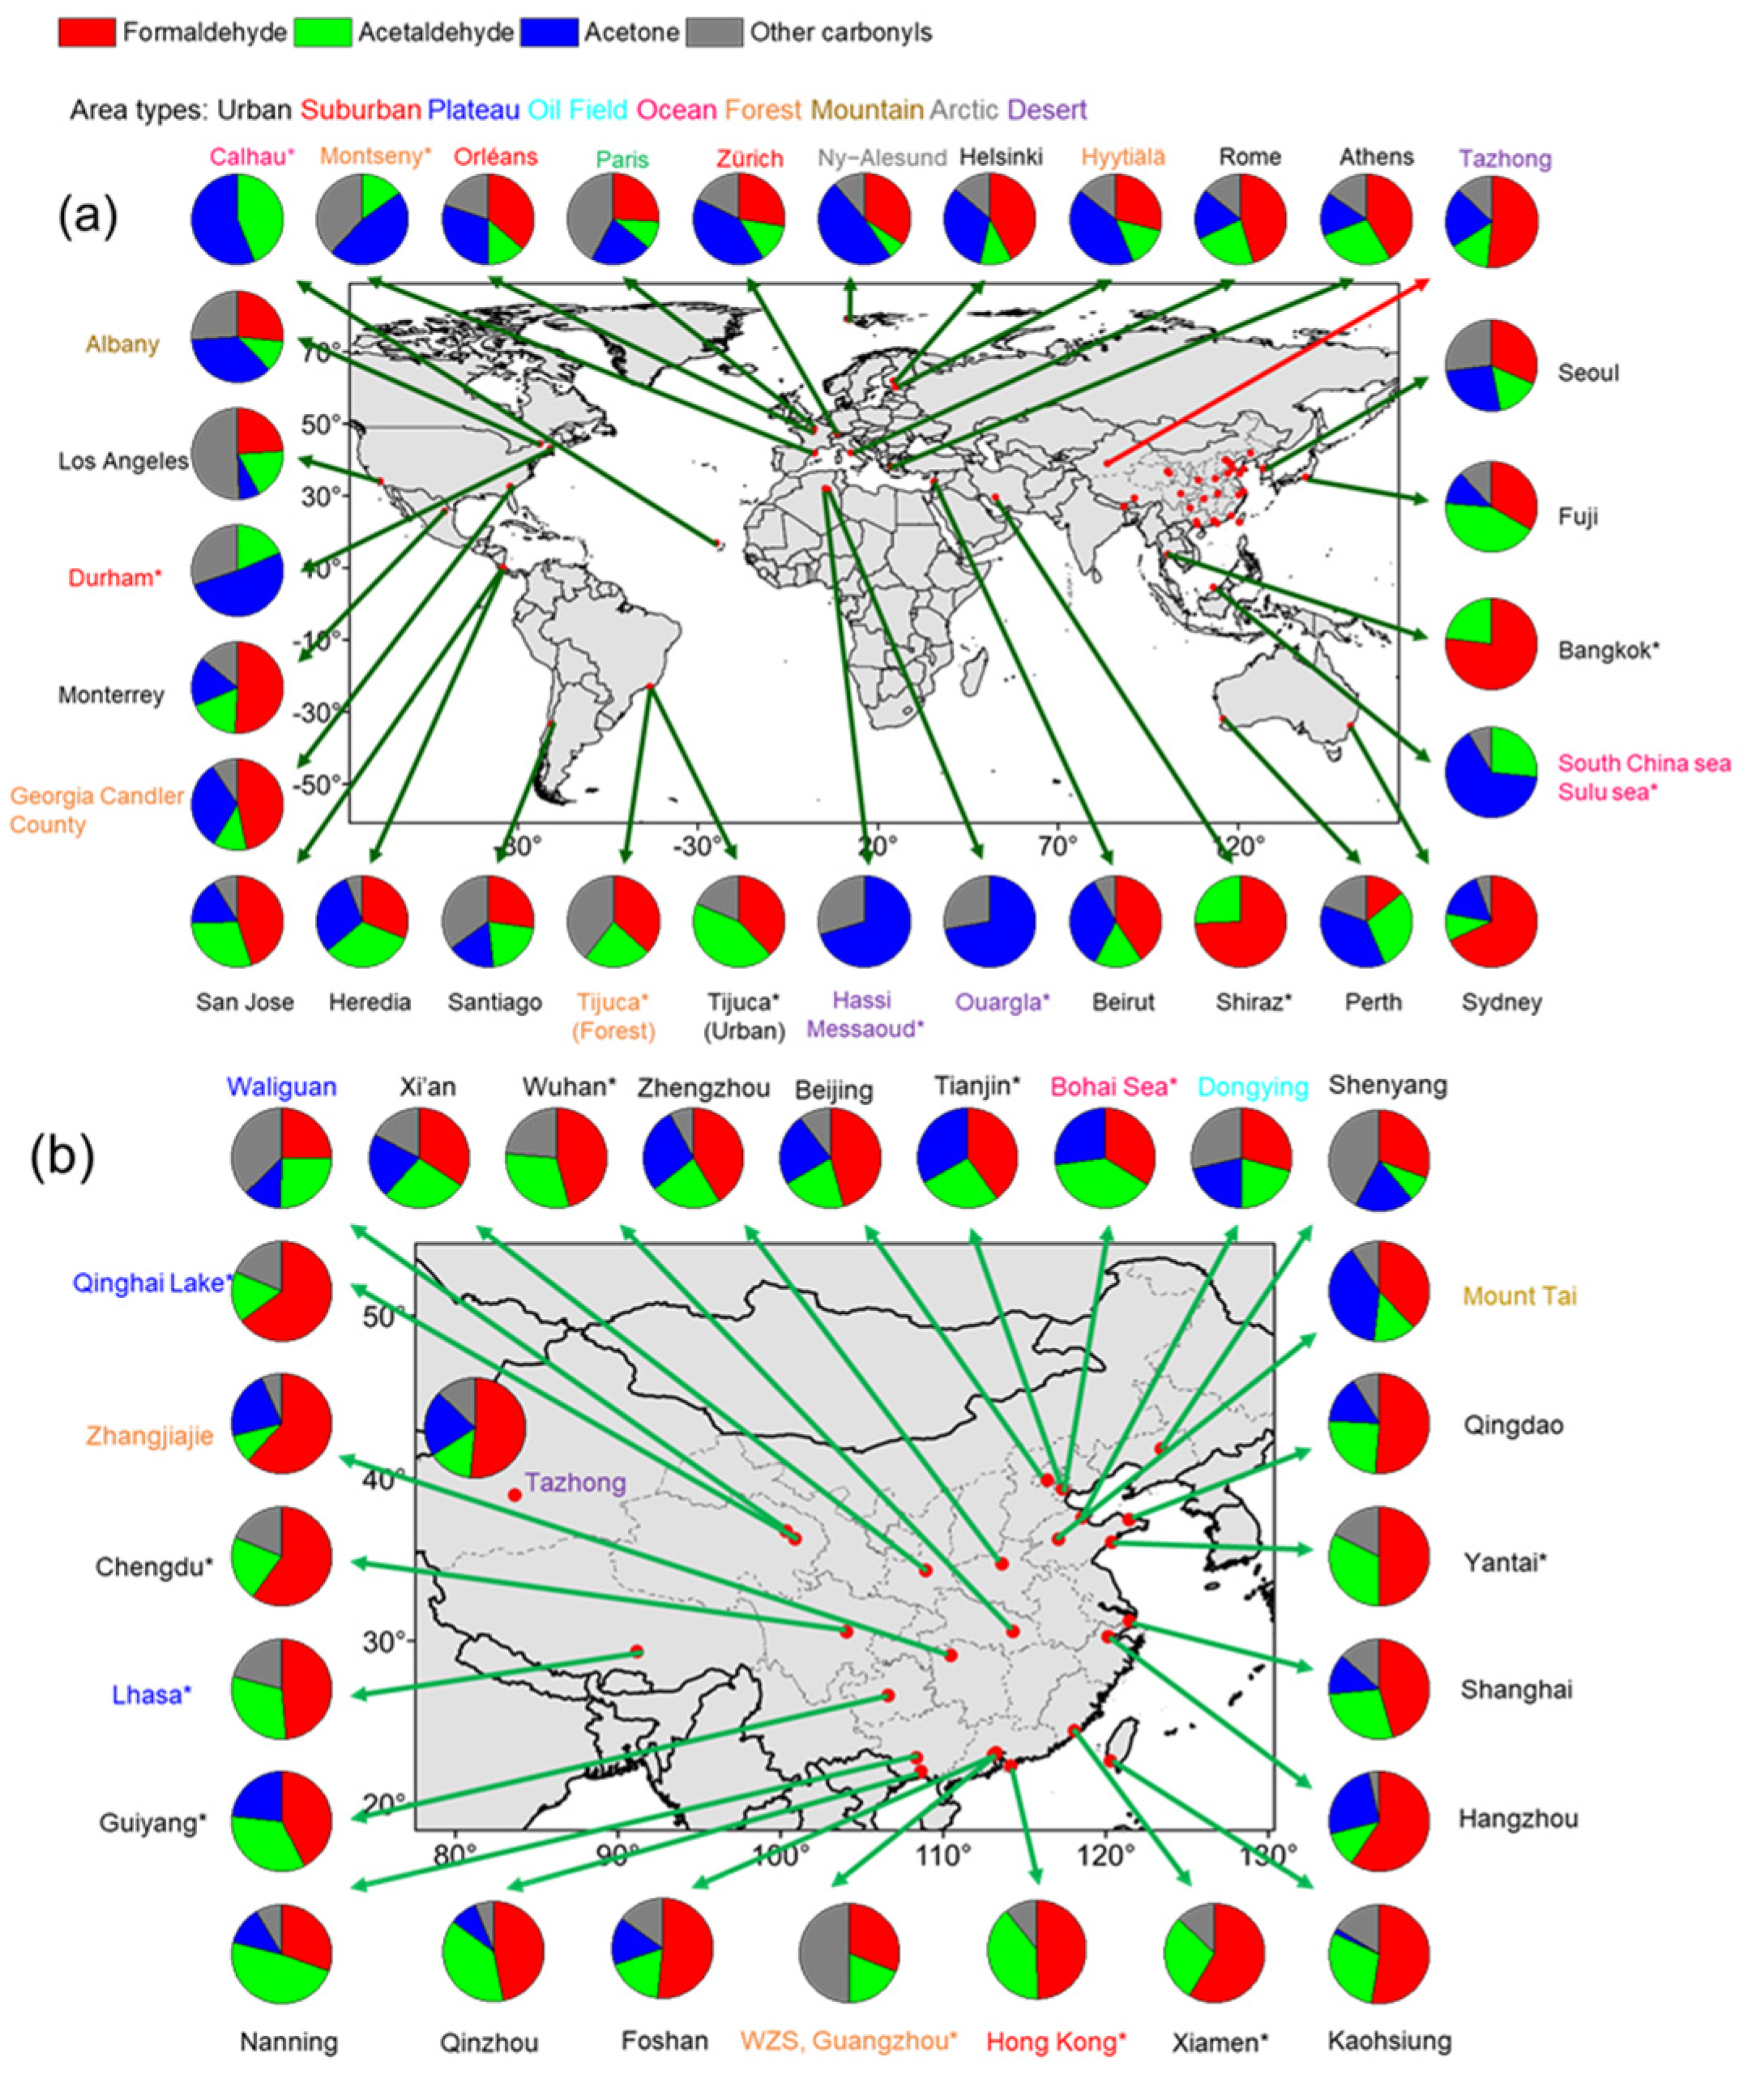
3.3. Comparison with Carbonyls in Various Environments

Based on research in China and other countries, the carbonyl concentration and the proportion of the three most abundant carbonyls (formaldehyde, acetaldehyde, and acetone) in the Tazhong desert were compared with those in various atmospheres, as shown in Figure 5 and Figure 6. The data were from 35 urban, 7 suburban, 2 plateau, 3 ocean, 6 forest, 2 mountain, 3 arctic, 3 desert, and 1 oil field area. Note that, due to the limited number of studies, the sampling season of each site is not all consistent. The sampling time and other detailed information are shown in Table S3. Among the data collected, the average concentrations of formaldehyde, acetaldehyde, and acetone in the various environments were 6.16 ± 6.18, 2.90 ± 2.66, and 3.13 ± 3.31 ppbv, respectively, worldwide. The highest concentrations of formaldehyde, acetaldehyde, and acetone were found in the oil field. Carbonyl concentrations in Tazhong were higher than those of most remote areas, which could have been the influence of oil exploitation around the sampling site. Previous studies [43,44,45,46] found VOCs emitted from oil exploitation region were mainly composed of alkanes, alkenes, and aromatic hydrocarbons, and played an important role in photochemical reactions. So, carbonyls produced by photochemical reaction might be an important source in this study and presented a higher concentration than in some remote areas.
As shown in Figure 6a, the formaldehyde proportion in Tazhong (52%) was higher than that in other sites (<50% at most sites), except in some urban cities. The acetaldehyde ratio in Tazhong (14%) was quite low and was only higher than that of forest areas (12% on average). The acetone ratio (21%) was also relatively low and was only higher than that of urban areas (20% on average). As shown in Figure 6b, several cities in China, such as Hong Kong and Hangzhou, had high formaldehyde ratios, indicating a more active oxidation capacity of the atmosphere [47].
The C1/C2 ratio can effectively indicate the contribution of hydrocarbons emitted by natural sources to carboxyl compounds in the atmosphere through photochemical oxidation [40]. Because the photochemical oxidation of hydrocarbons emitted by natural sources produces significantly more formaldehyde than acetaldehyde, C1/C2 ratios are lower in urban areas than rural and remote areas [42]. C1/C2 ratios were reported to vary from about 1–3 in urban areas [33,34,48,49,50] to 3–10 in rural and remote areas [32,42]. Additionally, the C2/C3 ratio is often used as an indicator of anthropogenic and natural sources. It is generally believed that propionaldehyde in the atmosphere mainly comes from anthropogenic sources, including direct emissions and oxidation of anthropogenic precursors, while acetaldehyde has both anthropogenic and natural sources [42]. This means that urban areas have lower C2/C3 ratios than rural and other remote areas.
The average C1/C2 ratios in different types of environments are 2.14 ± 1.34 (urban), 2.43 ± 0.64 (suburban), 1.29 ± 0.43 (plateau), 0.87 (ocean), 3.15 ± 2.19 (forest), 2.57 ± 0.25 (mountain), 5.56 (arctic), 3.74 (Tazhong desert), and 1.39 (oil field). The average C2/C3 values of different types of environments are 11.02 ± 8.63 (urban), 6.25 ± 1.44 (suburban), 5.73 (ocean), 5.90 ± 3.19 (forest), 9.46 ± 7.38 (arctic), 16.80 (Tazhong desert), and 8.50 (oil field). See Table S3 for detailed information. In the Tazhong desert area, the C1/C2 and C2/C3 ratios were both higher than the average urban level, which means that natural sources are contributing more to Tazhong’s carbonyl concentrations than urban areas. It can also be seen that the C1/C2 ratios of suburban, rural, plateau, forest, and other areas do not all satisfy the ratio experience judgment, and the same is the case for C2/C3 ratios. Therefore, although many studies use the species ratio method to explore the primary sources of carbonyls, they provide only qualitative analysis, and there remains much uncertainty in those ratio methods.

4. Conclusions

Ambient carbonyl compound samples were collected at Tazhong in the center of the Taklamakan Desert from 16 May to 15 June 2018. The average concentration of total carbonyls was 11.79 ± 4.03 ppbv, ranging from 3.70 to 26.44 ppbv. Formaldehyde (6.08 ± 2.37 ppbv), acetaldehyde (1.68 ± 0.78 ppbv), and acetone (2.52 ± 0.68 ppbv) were the most abundant species, accounting for 87% of the total carbonyl compounds. Strong correlations were found between formaldehyde and other carbonyls. Significant positive correlations were also observed between glyoxal and methylglyoxal. Those suggest that most of the carbonyls had the same or similar sources and sinks. Back trajectory analysis showed that carbonyl concentration might vary depending on where the air mass has passed. Weak positive correlations between carbonyl concentrations and meteorological factors indicated that meteorological conditions might have some effect on carbonyl formation, but only minimal.
Based on carbonyl data from previous studies, including in urban, suburban, plateau, ocean, forest, mountain, arctic, desert, and oil field areas, C1/C2 and C2/C3 ratios might vary substantially within the same type of environment and do not satisfy the experienced parameters. Relative to other environments, Tazhong’s total carbonyl levels (11.79 ± 4.03 ppbv) were lower than the average of urban areas, but higher than most remote areas, suggesting that local sources cannot be ignored.
Due to the limited sampling conditions at the center of the desert, this study was only a preliminary study for carbonyls. More studies could be conducted in the future, including the comprehensive monitoring of NMHCs, NOx, O3, and so forth. Relevant research will benefit the knowledge of spatial and temporal distributions, sources, and carbonyl sinks in desert areas.

Supplementary Materials

The following supporting information can be downloaded at: https://www.mdpi.com/article/10.3390/atmos13050761/s1, Table S1: Correlation coefficients between carbonyls and meteorological factors in Tazhong in the summer of 2018; Table S2: The specific time period corresponding to each episode; Table S3: Detailed data summary of field observation of carbonyls related to areas or cities adopted in Figure 5 and Figure 6. References [51,52,53,54,55,56,57,58,59,60,61,62,63,64,65,66,67,68,69,70,71,72,73,74,75,76,77,78,79,80,81,82,83,84,85,86,87,88,89,90] are cited in the Supplementary Materials.

Author Contributions

Conceptualization, C.G. (Chunmei Geng), K.L. and M.A.; methodology, S.L. and L.L.; software, S.L.; validation, C.G. (Chunmei Geng) and W.Y.; formal analysis, Y.L.; investigation, B.Y. and C.G. (Chao Gu); resources, W.Y. and C.G. (Chao Gu); data curation, C.G. (Chao Gu) and H.L.; writing—original draft preparation, S.L. and C.G. (Chunmei Geng); writing—review and editing, C.G. (Chunmei Geng), K.L., Y.Z. and H.L.; visualization, S.L. and X.W.; supervision, W.Y.; project administration, W.Y. and C.G. (Chao Gu); funding acquisition, Z.B. and W.Y. All authors have read and agreed to the published version of the manuscript.

Funding

This research was funded by the National Natural Science Foundation of China (41275135) and the Central-Level Public Welfare Research Institute’s Basic Research Special Funding (CRAES 2018-041).

Institutional Review Board Statement

Not applicable.

Informed Consent Statement

Not applicable.

Data Availability Statement

Not applicable.

Conflicts of Interest

The authors declare no conflict of interest.

References

  1. Atkinson, R.; Arey, J. Atmospheric Degradation of Volatile Organic Compounds. Chem. Rev. 2003, 103, 4605–4638. [Google Scholar] [CrossRef] [PubMed]
  2. Jia, C.; Wang, Y.; Li, Y.; Huang, T.; Mao, X.; Mo, J.; Li, J.; Jiang, W.; Liang, X.; Gao, H.; et al. Oxidative Capacity and Radical Chemistry in a Semi-arid and Petrochemical-industrialized City, Northwest China. Aerosol Air Qual. Res. 2018, 18, 1391–1404. [Google Scholar] [CrossRef] [Green Version]
  3. Mellouki, A.; Wallington, T.; Chen, J. Atmospheric chemistry of oxygenated volatile organic compounds: Impacts on air qual-ity and climate. Chem. Rev. 2015, 115, 3984–4014. [Google Scholar] [CrossRef]
  4. Volkamer, R.; Martini, F.S.; Molina, L.T.; Salcedo, D.; Jimenez, J.L.; Molina, M.J. A missing sink for gas-phase glyoxal in Mex-ico City: Formation of secondary organic aerosol. Geophys. Res. Lett. 2007, 34, L19807. [Google Scholar] [CrossRef] [Green Version]
  5. Huang, J.; Feng, Y.; Li, J.; Xiong, B.; Feng, J.; Wen, S.; Sheng, G.; Fu, J.; Wu, M. Characteristics of carbonyl compounds in ambient air of Shanghai, China. J. Atmos. Chem. 2008, 61, 1–20. [Google Scholar] [CrossRef]
  6. Flowers, L.; Broder, M.W.; Forsyth, C. Toxicological Review of Acetone; U.S. Environmental Protection Agency: Washington, DC, USA, 2003.
  7. Graus, M.; Schnitzler, J.P.; Hansel, A.; Cojocariu, C.; Rennenberg, H.; Wisthaler, A.; Kreuzwieser, J. Transient release of oxy-genated volatile organic compounds during light-dark transitions in grey poplar leaves. Plant Physiol. 2004, 135, 1967–1975. [Google Scholar] [CrossRef] [PubMed] [Green Version]
  8. Janson, R.; de Serves, C. Acetone and monoterpene emissions from the boreal forest in northern Europe. Atmos. Environ. 2001, 35, 4629–4637. [Google Scholar] [CrossRef]
  9. Kim, K.-H.; Hong, Y.-J.; Pal, R.; Jeon, E.-C.; Koo, Y.-S.; Sunwoo, Y. Investigation of carbonyl compounds in air from various industrial emission sources. Chemosphere 2008, 70, 807–820. [Google Scholar] [CrossRef] [PubMed]
  10. Possanzini, M.; Di Palo, V.; Cecinato, A. Sources and photodecomposition of formaldehyde and acetaldehyde in Rome am-bient air. Atmos. Environ. 2002, 36, 3195–3201. [Google Scholar] [CrossRef]
  11. Qian, X.; Shen, H.; Chen, Z. Characterizing summer and winter carbonyl compounds in Beijing atmosphere. Atmos. Environ. 2019, 214, 116845. [Google Scholar] [CrossRef]
  12. Shirley, T.R.; Brune, W.H.; Ren, X.; Mao, J.; Lesher, R.; Cardenas, B.; Volkamer, R.; Molina, L.T.; Molina, M.J.; Lamb, B.; et al. Atmospheric oxidation in the Mexico City Metropolitan Area (MCMA) during April 2003. Atmos. Chem. Phys. 2006, 6, 2753–2765. [Google Scholar] [CrossRef] [Green Version]
  13. Wang, F.; Du, W.; Lv, S.; Ding, Z.; Wang, G. Spatial and Temporal Distributions and Sources of Anthropogenic NMVOCs in the Atmosphere of China: A Review. Adv. Atmos. Sci. 2021, 38, 1085–1100. [Google Scholar] [CrossRef]
  14. Xue, L.K.; Gu, R.R.; Wang, T.; Wang, X.F.; Saunders, S.; Blake, D.; Louie, P.K.K.; Luk, C.W.Y.; Simpson, I.; Xu, Z.; et al. Oxidative capacity and radical chemistry in the polluted atmosphere of HongKong and Pearl River Delta region: Analysis of a severe photochemical smogepisode. Atmos. Chem. Phys. 2016, 16, 9891–9903. [Google Scholar] [CrossRef] [Green Version]
  15. Huang, X.-F.; Zhang, B.; Xia, S.-Y.; Han, Y.; Wang, C.; Yu, G.-H.; Feng, N. Sources of oxygenated volatile organic compounds (OVOCs) in urban atmospheres in North and South China. Environ. Pollut. 2020, 261, 114152. [Google Scholar] [CrossRef] [PubMed]
  16. Yuan, B.; Hu, W.W.; Shao, M.; Wang, M.; Chen, W.T.; Lu, S.H.; Zeng, L.M.; Hu, M. VOC emissions, evolutions and contri-butions to SOA formation at a receptor site in eastern China. Atmos. Chem. Phys. 2013, 13, 8815–8832. [Google Scholar] [CrossRef] [Green Version]
  17. Guo, S.; He, X.; Chen, M.; Tan, J.; Wang, Y. Photochemical Production of Atmospheric Carbonyls in a Rural Area in Southern China. Arch. Environ. Contam. Toxicol. 2014, 66, 594–605. [Google Scholar] [CrossRef]
  18. Jiang, Z.; Grosselin, B.; Daële, V.; Mellouki, A.; Mu, Y. Seasonal, diurnal and nocturnal variations of carbonyl compounds in the semi-urban environment of Orléans, France. J. Environ. Sci. 2016, 40, 84–91. [Google Scholar] [CrossRef]
  19. Yang, X.; Xue, L.; Yao, L.; Li, Q.; Wen, L.; Zhu, Y.; Chen, T.; Wang, X.; Yang, L.; Wang, T.; et al. Carbonyl compounds at Mount Tai in the North China Plain: Characteristics, sources, and effects on ozone formation. Atmos. Res. 2017, 196, 53–61. [Google Scholar] [CrossRef]
  20. Yassaa, N.; Ciccioli, P.; Brancaleoni, E.; Frattoni, M.; Meklati, B.Y. Ambient measurements of selected VOCs in populated and remote sites of the Sahara desert. Atmos. Res. 2011, 100, 141–146. [Google Scholar] [CrossRef]
  21. Liu, J.; Zheng, Y.; Li, Z.; Flynn, C.; Welton, E.; Cribb, M. Transport, vertical structure and radiative properties of dust events in southeast China determined from ground and space sensors. Atmos. Environ. 2011, 45, 6469–6480. [Google Scholar] [CrossRef]
  22. Yuan, T.; Chen, S.; Huang, J.; Wu, D.; Lu, H.; Zhang, G.; Ma, X.; Chen, Z.; Luo, Y.; Ma, X. Influence of Dynamic and Thermal Forcing on the Meridional Transport of Taklimakan Desert Dust in Spring and Summer. J. Clim. 2019, 32, 749–767. [Google Scholar] [CrossRef]
  23. Zhou, C.; Yang, X.; Wen, H.; Zhong, X.; Fan, Y.; He, Q. Characteristics of precipitation at the Hinterland of the Taklimakan Desert. J. Desert Res. 2017, 3, 343–348. [Google Scholar]
  24. Environmental Protection Agency, United State of America. Compendium Method TO-11A. In Determination of Formaldehyde in Ambient Air Using Adsorbent Cartridge Followed by High Performance Liquid Chromatography (HPLC) [Active Sampling Methodology]; Center for Environmental Research Information Office of Research and Development, U.S. Environmental Protection Agency: Cincinnati, OH, USA, 1999. [Google Scholar]
  25. Zhang, X.; Li, H.; Zhang, C.; Zhang, Y.; He, Z.; Gao, R.; Wang, W. Optimization and preliminary application of detection method of carbonyl compounds in the ambient air. Res. Environ. Sci. 2019, 32, 821–829. [Google Scholar]
  26. Zhang, X.; Wu, Z.H.; He, Z.; Zhong, X.F.; Bi, B.; Li, Y.F.; Gao, R.; Li, H.; Wang, W.X. Spatiotemporal patterns and ozone sen-sitivity of gaseous carbonyls at eleven urban sites in southeastern China. Sci. Total Environ. 2022, 824, 153719. [Google Scholar] [CrossRef]
  27. Lü, H.; Cai, Q.-Y.; Wen, S.; Chi, Y.; Guo, S.; Sheng, G.; Fu, J. Seasonal and diurnal variations of carbonyl compounds in the urban atmosphere of Guangzhou, China. Sci. Total Environ. 2010, 408, 3523–3529. [Google Scholar] [CrossRef]
  28. Menchaca-Torre, H.L.; Mercado-Hernández, R.; Rodríguez-Rodríguez, J.; Mendoza-Dominguez, A. Diurnal and seasonal variations of carbonyls and their effect on ozone concentrations in the atmosphere of Monterrey, Mexico. J. Air Waste Manag. Assoc. 2015, 65, 500–510. [Google Scholar] [CrossRef] [Green Version]
  29. Guo, H.; Jiang, F.; Cheng, H.R.; Simpson, I.J.; Wang, X.M.; Ding, A.J.; Wang, T.J.; Saunders, S.M.; Lam, S.H.M.; Blake, D.R.; et al. Concurrent observations of air pollutants at two sites in the Pearl River Delta and the implication of regional transport. Atmos. Chem. Phys. 2009, 9, 7343–7360. [Google Scholar] [CrossRef] [Green Version]
  30. Mu, Y.; Pang, X.; Quan, J.; Zhang, X. Atmospheric carbonyl compounds in Chinese background area: A remote mountain of the Qinghai-Tibetan Plateau. J. Geophys. Res. 2007, 112, D22302. [Google Scholar] [CrossRef] [Green Version]
  31. Fu, T.-M.; Jacob, D.J.; Wittrock, F.; Burrows, J.P.; Vrekoussis, M.; Henze, D.K. Global budgets of atmospheric glyoxal and methylglyoxal, and implications for formation of secondary organic aerosols. J. Geophys. Res. Earth Surf. 2008, 113. [Google Scholar] [CrossRef] [Green Version]
  32. Lee, Y.-N.; Zhou, X.; Hallock, K. Atmospheric carbonyl compounds at a rural southeastern United States site. J. Geophys. Res. Atmos. 1995, 100, 25933–25944. [Google Scholar] [CrossRef]
  33. Ait-Helal, W.; Borbon, A.; Sauvage, S.; de Gouw, J.A.; Colomb, A.; Gros, V.; Freutel, F.; Crippa, M.; Afif, C.; Baltensperger, U.; et al. Volatile and intermediate volatility organic compounds in suburban Paris: Variability, origin and importance for SOA formation. Atmos. Chem. Phys. 2014, 14, 10439–10464. [Google Scholar] [CrossRef] [Green Version]
  34. Pang, X.; Mu, Y. Seasonal and diurnal variations of carbonyl compounds in Beijing ambient air. Atmos. Environ. 2006, 40, 6313–6320. [Google Scholar] [CrossRef]
  35. Yang, X. Characteristics and Source of Carbonyls and Effects on Photochemistry Pollution in North China Plain. Ph.D. Thesis, Shandong University, Shandong, China, 2018. [Google Scholar]
  36. Garcia, A.R.; Volkamer, R.; Molina, L.T.; Molina, M.J.; Samuelson, J.; Mellqvist, J.; Galle, B.; Herndon, S.C.; Kolb, C.E. Separation of emitted and photochemical formaldehyde in Mexico City using a statistical analysis and a new pair of gas-phase tracers. Atmos. Chem. Phys. 2006, 6, 4545–4557. [Google Scholar] [CrossRef] [Green Version]
  37. Atkinson, R. Atmospheric chemistry of VOCs and NOx. Atmos. Environ. 2000, 34, 2063–2101. [Google Scholar] [CrossRef]
  38. Alvarado, A.; Tuazon, E.C.; MAschmann, S.; Arey, J.; Atkinson, R. Products and mechanisms of the gas-phase reactions of OH radicals and O3 with 2-methyl-3-buten-2-ol. Atmos. Environ. 1999, 33, 2893–2905. [Google Scholar] [CrossRef]
  39. Dai, W.; Ho, S.S.H.; Ho, K.; Liu, W.; Cao, J.; Lee, S. Seasonal and diurnal variations of mono- and di-carbonyls in Xi’an, China. Atmos. Res. 2012, 113, 102–112. [Google Scholar] [CrossRef]
  40. Orlando, J.J.; Nozière, B.; Tyndall, G.S.; Orzechowska, G.E.; Paulson, S.E.; Rudich, Y. Product studies of the OH- and ozone-initiated oxidation of some monoterpenes. J. Geophys. Res. 2000, 105, 11561–11572. [Google Scholar] [CrossRef]
  41. Reissell, A.; Harry, C.; Aschmann, S.M.; Atkinson, R.; Arey, J. Formation of acetone from the OH radical- and O3-initiated reactions of a series of monoterpenes. J. Geophys. Res. 1999, 104, 13869–13879. [Google Scholar] [CrossRef]
  42. Shepson, P.; Hastie, D.; Schiff, H.; Polizzi, M.; Bottenheim, J.; Anlauf, K.; Mackay, G.; Karecki, D. Atmospheric concentra-tions and temporal variations of C1-C3 carbonyl compounds at two rural sites in central Ontario. Atmos. Environ. 1991, 25, 2001–2015. [Google Scholar] [CrossRef] [Green Version]
  43. Chen, T.; Xue, L.; Zheng, P.; Zhang, Y.; Liu, Y.; Sun, J.; Han, G.; Li, H.; Zhang, X.; Li, Y.; et al. Volatile organic compounds and ozone air pollution in an oil production region in northern China. Atmos. Chem. Phys. 2020, 20, 7069–7086. [Google Scholar] [CrossRef]
  44. Gilman, J.B.; Lerner, B.; Kuster, W.; de Gouw, J. Source Signature of Volatile Organic Compounds from Oil and Natural Gas Operations in Northeastern Colorado. Environ. Sci. Technol. 2013, 47, 1297–1305. [Google Scholar] [CrossRef]
  45. Koss, A.; Gouw Jd Warneke, C.; Gilman, J.; Lerner, B.; Graus, M.; Yuan, B.; Edwards, P.; Brown, S.; Wild, R. Photo-chemical aging of volatile organic compounds associated with oil and natural gas extraction in the Uintah Basin, UT, during a wintertime ozone formation event. Atmos. Chem. Phys. 2015, 15, 5727–5741. [Google Scholar] [CrossRef] [Green Version]
  46. Zheng, H.; Kong, S.; Xing, X.; Mao, Y.; Hu, T.; Ding, Y.; Li, G.; Liu, D.; Li, S.; Qi, S. Monitoring of volatile organic compounds (VOCs) from an oil and gas station in northwest China for 1 year. Atmos. Chem. Phys. 2018, 18, 4567–4595. [Google Scholar] [CrossRef] [Green Version]
  47. Yuan, B.; Chen, W.; Shao, M.; Wang, M.; Lu, S.; Wang, B.; Liu, Y.; Chang, C.C.; Wang, B. Measurements of ambient hydro-carbons and carbonyls in the Pearl River Delta (PRD), China. Atmos. Res. 2012, 116, 93–104. [Google Scholar] [CrossRef]
  48. Bakeas, E.B.; Argyris, D.I.; Siskos, P.A. Carbonyl compounds in the urban environment of Athens, Greece. Chemosphere 2003, 52, 805–813. [Google Scholar] [CrossRef]
  49. Hellén, H.; Hakola, H.; Reissell, A.; Ruuskanen, T. Carbonyl compounds in boreal coniferous forest air in Hyytiälä, Southern Finland. Atmos. Chem. Phys. 2004, 4, 1771–1778. [Google Scholar] [CrossRef] [Green Version]
  50. Rao, Z.; Chen, Z.; Liang, H.; Huang, L.; Huang, D. Carbonyl compounds over urban Beijing: Concentrations on haze and non-haze days and effects on radical chemistry. Atmos. Environ. 2016, 124, 207–216. [Google Scholar] [CrossRef]
  51. Jiang, D. Current pollution status of aldoketones compounds in the ambient air of Shenyang. Environ. Protect. Sci. 2015, 41, 118–119. [Google Scholar]
  52. Ho, K.; Ho, S.S.H.; Huang, R.-J.; Dai, W.; Cao, J.; Tian, L.; Deng, W. Spatiotemporal distribution of carbonyl compounds in China. Environ. Pollut. 2015, 197, 316–324. [Google Scholar] [CrossRef]
  53. Liu, Y.; Yuan, B.; Li, X.; Shao, M.; Lu, S.; Chang, C.-C.; Wang, Z.; Hu, W.; Huang, X.; He, L.; et al. Impact of pollution controls in Beijing on atmospheric oxygenated volatile organic compounds (OVOCs) during the 2008 Olympic Games: Observation and modeling implications. Atmos. Chem. Phys. 2015, 15, 3045–3062. [Google Scholar] [CrossRef] [Green Version]
  54. Shao, M.; Lu, S.; Liu, Y.; Xie, X.; Chang, C.; Huang, S.; Chen, Z. Volatile organic compounds measured in summer in Beijing and their role in ground-level ozone formation. J. Geophys. Res. 2009, 114, D00G06. [Google Scholar] [CrossRef]
  55. Sheng, J.; Zhao, D.; Ding, D.; Li, X.; Huang, M.; Gao, Y.; Quan, J.; Zhang, Q. Characterizing the level, photochemical reactivity, emission, and source contribution of the volatile organic compounds based on PTR-TOF-MS during winter haze period in Bei-jing, China. Atmos. Res. 2018, 212, 54–63. [Google Scholar] [CrossRef]
  56. Xu, Z.; Liu, J.; Zhang, Y.; Liang, P.; Mu, Y. Ambient levels of atmospheric carbonyls in Beijing during the 2008 Olympic Games. J. Environ. Sci. 2010, 22, 1348–1356. [Google Scholar] [CrossRef]
  57. Yang, X.; Xue, L.; Wang, T.; Wang, X.; Gao, J.; Lee, S.; Blake, D.R.; Chai, F.; Wang, W. Observations and Explicit Modeling of Summertime Carbonyl Formation in Beijing: Identification of Key Precursor Species and Their Impact on Atmospheric Oxidation Chemistry. J. Geophys. Res. 2018, 123, 1426–1440. [Google Scholar] [CrossRef] [Green Version]
  58. Shi, J.; Pang, X.; Bai, Z.; Jin, M.; Li, W.; Kong, S. Measurement of carbonyl compounds in ambient air of Tianjin City and Bohai Sea. J. Tianjin Univ. 2011, 44, 233–241. [Google Scholar]
  59. Tan, P.; Yu, Y.; Jiang, H.; Liu, Z. Analysis and concentration variability of carbonyl compounds in Qingdao atmosphere. China Environ. Sci. 2002, 22, 68–72. [Google Scholar]
  60. Weng, M.; Zhu, L.; Yang, K.; Chen, S. Levels and health risks of carbonyl compounds in selected public places in Hangzhou, China. J. Hazard. Mater. 2009, 164, 700–706. [Google Scholar] [CrossRef] [PubMed]
  61. Guo, H.; Lee, S.-C.; Louie, P.; Ho, K.F. Characterization of hydrocarbons, halocarbons and carbonyls in the atmosphere of Hong Kong. Chemosphere 2004, 57, 1363–1372. [Google Scholar] [CrossRef] [PubMed]
  62. Chi, Y.; Feng, Y.; Wen, S.; Lü, H.; Yu, Z.; Zhang, W.; Sheng, G.; Fu, J. Determination of carbonyl compounds in the atmosphere by DNPH derivatization and LC–ESI-MS/MS detection. Talanta 2007, 72, 539–545. [Google Scholar] [CrossRef] [PubMed]
  63. Pang, X.; Lee, X. Temporal variations of atmospheric carbonyls in urban ambient air and street canyons of a Mountainous city in Southwest China. Atmos. Environ. 2010, 44, 2098–2106. [Google Scholar] [CrossRef]
  64. Guo, S.-J.; Chen, M.; He, X.-L.; Yang, W.-W.; Tan, J.-H. Seasonal and Diurnal Characteristics of Carbonyls in Urban Air in Qinzhou, China. Aerosol Air Qual. Res. 2014, 14, 1653–1664. [Google Scholar] [CrossRef]
  65. Guo, S.; Chen, M.; Tan, J. Seasonal and diurnal characteristics of atmospheric carbonyls in Nanning, China. Atmos. Res. 2016, 169, 46–53. [Google Scholar] [CrossRef]
  66. Wang, L.; Wang, W.; Zhao, X.; Xu, X. Pollution characteristics and sources of carbonyl compounds in Zhengzhou ambient air of winter and summer. China Environ. Monit. 2014, 30, 35–40. [Google Scholar]
  67. Wang, H.; Huang, C.; Chen, K.; Peng, Y.; Lai, C. Measurement and source characteristics of carbonyl compounds in the at-mosphere in Kaohsiung city, Taiwan. J. Hazard Mater. 2010, 179, 1115–1121. [Google Scholar] [CrossRef]
  68. Kanjanasiranont, N.; Prueksasit, T.; Morknoy, D.; Tunsaringkarn, T.; Sematong, S.; Siriwong, W.; Zapaung, K.; Rungsiyothin, A. Determination of ambient air concentrations and personal exposure risk levels of outdoor workers to carbonyl compounds and BTEX in the inner city of Bangkok, Thailand. Atmos. Pollut. Res. 2016, 7, 268–277. [Google Scholar] [CrossRef]
  69. Kume, K.; Ohura, T.; Amagai, T.; Fusaya, M. Field monitoring of volatile organic compounds using passive air samplers in an industrial city in Japan. Environ. Pollut. 2008, 153, 649–657. [Google Scholar] [CrossRef] [PubMed]
  70. Seo, Y.-K.; Jeong, E.-H.; Seo, S.-J.; Hwang, Y.-J.; Han, J.-S.; Bae, S.-O. Spatial and Temporal Variations of Atmospheric Concentrations of Carbonyl Compounds in Seoul Metropolitan Area. J. Korean Soc. Atmos. Environ. 2008, 24, 206–219. [Google Scholar] [CrossRef]
  71. Possanzini, M.; Di Palo, V.; Petricca, M.; Fratarcangeli, R.; Brocco, D. Measurements of lower carbonyls in Rome ambient air. Atmos. Environ. 1996, 30, 3757–3764. [Google Scholar] [CrossRef]
  72. Grosjean, E.; Grosjean, D.; Fraser, M.P.; Cass, G.R. Air Quality Model Evaluation Data for Organics. 2. C1−C14 Carbonyls in Los Angeles Air. Environ. Sci. Technol. 1996, 30, 2687–2703. [Google Scholar] [CrossRef] [Green Version]
  73. Murillo, J.H.; Marín, J.F.R.; Román, S.R. Determination of carbonyls and their sources in three sites of the metropolitan area of Costa Rica, Central America. Environ. Monit. Assess. 2012, 184, 53–61. [Google Scholar] [CrossRef] [PubMed]
  74. Braga, A.L.; Siciliano, B.; Dantas, G.; André, M.; da Silva, C.M.; Arbilla, G. Levels of Volatile Carbonyl Compounds in the Atlantic Rainforest, in the City of Rio de Janeiro. Bull. Environ. Contam. Toxicol. 2019, 102, 757–762. [Google Scholar] [CrossRef] [PubMed]
  75. Rubio, M.A.; Zamorano, N.; Lissi, E.; Rojas, A.; Gutiérrez, L.; Von Baer, D. Volatile carboxylic compounds in downtown San-tiago, Chile. Chemosphere 2006, 62, 1011–1020. [Google Scholar] [CrossRef] [PubMed]
  76. Zardin, E. Long-term monitoring of trace volatile organic compounds in ambient air of Western Australia by proton transfer reaction-mass spectrometry (PTR-MS). Ph.D. Thesis, University of Western Australia, Perth, Australia, 2011. [Google Scholar]
  77. Lawson, S.J.; Galbally, I.E.; Cheng, M.; Quigley, S.; Azzi, M. PTR-MS measurement of photochemical smog precursors at an inner city site in Sydney, and comparison with emissions inventories. In Proceedings of the CASANZ 2009 Conference: 19th International Clean Air and Environment Conference, Perth Convention Exhibition Centre, Perth, Australia, 6–9 September 2009; Clean Air Society of Australia and New Zealand: Perth, Australia; p. 63. [Google Scholar]
  78. Delikhoon, M.; Fazlzadeh, M.; Sorooshian, A.; Baghani, A.N.; Golaki, M.; Ashournejad, Q.; Barkhordari, A. Characteristics and health effects of formaldehyde and acetaldehyde in an urban area in Iran. Environ. Pollut. 2018, 242, 938–951. [Google Scholar] [CrossRef]
  79. Moussa, S.G.; El-Fadel, M.; Saliba, N.A. Seasonal, diurnal and nocturnal behaviors of lower carbonyl compounds in the urban environment of Beirut, Lebanon. Atmos. Environ. 2006, 40, 2459–2468. [Google Scholar] [CrossRef]
  80. Cheng, Y.; Lee, S.-C.; Huang, Y.; Ho, K.F.; Ho, S.S.H.; Yau, P.; Louie, P.; Zhang, R. Diurnal and seasonal trends of carbonyl compounds in roadside, urban, and suburban environment of Hong Kong. Atmos. Environ. 2014, 89, 43–51. [Google Scholar] [CrossRef]
  81. Lui, K.; Ho, S.S.H.; Louie, P.K.; Chan, C.; Lee, S.-C.; Hu, D.; Chan, P.W.; Lee, J.C.W.; Ho, K. Seasonal behavior of carbonyls and source characterization of formaldehyde (HCHO) in ambient air. Atmos. Environ. 2017, 152, 51–60. [Google Scholar] [CrossRef]
  82. Legreid, G.; Lööv, J.B.; Staehelin, J.; Hueglin, C.; Hill, M.; Buchmann, B.; Prevot, A.; Reimann, S. Oxygenated volatile organic compounds (OVOCs) at an urban background site in Zürich (Europe): Seasonal variation and source allocation. Atmos. Environ. 2007, 41, 8409–8423. [Google Scholar] [CrossRef]
  83. Jordan, C.; Fitz, E.; Hagan, T.; Sive, B.; Frinak, E.; Haase, K.; Cottrell, L.; Buckley, S.; Talbot, R. Long-term study of VOCs measured with PTR-MS at a rural site in New Hampshire with urban influences. Atmos. Chem. Phys. 2009, 9, 4677–4697. [Google Scholar] [CrossRef] [Green Version]
  84. Schlundt, C.; Tegtmeier, S.; Lennartz, S.; Bracher, A.; Cheah, W.; Krüger, K.; Quack, B.; Marandino, C.A. Oxygenated volatile organic carbon in the western Pacific convective centre: Ocean cycling, air-sea gas exchange and atmospheric transport. Atmos. Chem. Phys. 2017, 17, 10837–10854. [Google Scholar] [CrossRef] [Green Version]
  85. Read, K.; Carpenter, L.; Arnold, S.; Beale, R.; Nightingale, P.; Hopkins, J.; Lewis, A.; Lee, J.D.; Mendes, L.; Pickering, S.J. Multiannual Observations of Acetone, Methanol, and Acetaldehyde in Remote Tropical Atlantic Air: Implications for Atmospheric OVOC Budgets and Oxidative Capacity. Environ. Sci. Technol. 2012, 46, 11028–11039. [Google Scholar] [CrossRef] [PubMed]
  86. Yu, Y.; Wen, S.; Lü, H.; Feng, Y.; Wang, X.; Sheng, G.; Fu, J. Characteristics of atmospheric carbonyls and VOCs in Forest Park in South China. Environ. Monit. Assess. 2007, 137, 275–285. [Google Scholar] [CrossRef]
  87. Seco, R.; Peñuelas, J.; Filella, I.; Llusià, J.; Molowny-Horas, R.; Schallhart, S.; Metzger, A.; Müller, M.; Hansel, A. Contrasting winter and summer VOC mixing ratios at a forest site in the Western Mediterranean Basin: The effect of local biogenic emissions. Atmos. Chem. Phys. 2011, 11, 13161–13179. [Google Scholar] [CrossRef] [Green Version]
  88. Khwaja, H.A.; Narang, A. Carbonyls and non-methane hydrocarbons at a rural mountain site in northeastern United States. Chemosphere 2008, 71, 2030–2043. [Google Scholar] [CrossRef]
  89. Boudries, H.; Bottenheim, J.; Guimbaud, C.; Grannas, A.; Shepson, P.; Houdier, S.; Perrier, S.; Domine, F. Distribution and trends of oxygenated hydrocarbons in the high Arctic derived from measurements in the atmospheric boundary layer and in-terstitial snow air during the ALERT2000 field campaign. Atmos. Environ. 2002, 36, 2573–2583. [Google Scholar] [CrossRef]
  90. Mabilia, R.; Di Palo, V.; Cassardo, C.; Ciuchini, C.; Pasini, A.; Possanzini, M. Measurements of lower carbonyls and hydro-carbons at Ny-Alesund, Svalbard. Ann. Chim. J. Anal. Environ. Cult. Herit. Chem. 2007, 97, 1027–1037. [Google Scholar]
Figure 1. Sampling site in Tazhong, Xinjiang Uygur Autonomous Region, China (Source: Google Earth). (a) The overview of sampling site. (b) The zoom-up of sampling site.
Atmosphere 13 00761 g001
Figure 2. Time series of averaged data for (a) wind speed and direction (every 3 h), (b) temperature and relative humidity (every 3 h), and (c) total carbonyl concentration during the sampling period (every 4 h from 9:00−21:00, and 12 h from 21:00−9:00 the next day).
Atmosphere 13 00761 g002
Figure 3. Back trajectories of air masses arriving in Tazhong at an elevation of 200 m during the nine episodic events. The 72 h of back trajectories were calculated, with a new trajectory starting every 1 h. See Table S2 for the start and end times of each episode. Red triangles = cities; red star = Tazhong, with city names shown in the Episode 1 chart.
Atmosphere 13 00761 g003
Figure 4. Time series of concentrations and chemical components of carbonyls over the sampling period. E1–E9 correspond to Episode 1–Episode 9 in Figure 3.
Atmosphere 13 00761 g004
Figure 5. The average concentration of formaldehyde (a), acetaldehyde (b), and acetone (c) in various environments. See Table S3 for detailed information.
Atmosphere 13 00761 g005
Figure 6. Summary of major carbonyl component (formaldehyde, acetaldehyde, acetone, other carbonyls) compositions worldwide (a) and in China (b). Pie chart colors indicate carbonyl components, and name colors indicate different environments. * Indicates that some species were not measured. See Table S3 for detailed information.
Atmosphere 13 00761 g006
Table 1. Average ± SDs of carbonyl concentrations in each time period in Tazhong (units: ppbv).
Carbonyl9:00–13:00 *13:00–17:00 *17:00–21:00 *21:00–9:00 *Mean
Formaldehyde5.96 ± 2.965.55 ± 1.645.25 ± 1.96.57 ± 2.676.08 ± 2.37
Acetaldehyde1.42 ± 0.641.54 ± 0.531.16 ± 0.451.98 ± 1.121.68 ± 0.78
Acetone2.51 ± 0.812.72 ± 0.562.43 ± 0.432.50 ± 0.842.52 ± 0.68
Propionaldehyde0.08 ± 0.050.10 ± 0.030.07 ± 0.030.12 ± 0.090.10 ± 0.06
Crotonaldehyde0.01 ± 0.020.01 ± 0.030.01 ± 0.020.02 ± 0.020.02 ± 0.02
Butyraldehyde0.28 ± 0.130.28 ± 0.090.24 ± 0.100.39 ± 0.210.33 ± 0.15
Benzaldehyde0.05 ± 0.030.04 ± 0.030.04 ± 0.020.05 ± 0.030.05 ± 0.03
i-Valeraldehyde0.02 ± 0.020.03 ± 0.040.02 ± 0.020.04 ± 0.040.03 ± 0.03
n-Valeraldehyde0.05 ± 0.020.06 ± 0.020.06 ± 0.020.03 ± 0.010.04 ± 0.02
o-Tolualdehyde0.02 ± 0.000.02 ± 0.000.02 ± 0.000.01 ± 0.000.01 ± 0.00
m-Tolualdehyde0.03 ± 0.000.03 ± 0.000.03 ± 0.000.01 ± 0.010.02 ± 0.01
p-Tolualdehyde0.08 ± 0.090.07 ± 0.070.05 ± 0.050.11 ± 0.120.09 ± 0.09
Hexaldehyde0.08 ± 0.050.09 ± 0.040.07 ± 0.030.13 ± 0.090.10 ± 0.06
2,5-Dimethyl-benzaldehyde0.02 ± 0.030.01 ± 0.020.02 ± 0.030.02 ± 0.030.02 ± 0.03
Methacrolein0.06 ± 0.060.05 ± 0.030.05 ± 0.040.10 ± 0.080.08 ± 0.06
Glyoxal0.25 ± 0.200.20 ± 0.160.14 ± 0.100.22 ± 0.100.21 ± 0.15
Methylglyoxal0.48 ± 0.310.49 ± 0.280.30 ± 0.170.41 ± 0.140.42 ± 0.25
Total11.39 ± 4.8111.27 ± 2.809.95 ± 2.9612.7 ± 4.8311.79 ± 4.03
* Note: Time is local time (UTC+06:00).
Publisher’s Note: MDPI stays neutral with regard to jurisdictional claims in published maps and institutional affiliations.

