Article

Interannual Variations of Rainfall in Late Spring over Southwest China and Associated Sea Surface Temperature and Atmospheric Circulation Anomalies

1
National Meteorological Center, China Meteorological Administration, Beijing 100081, China
2
Center for Monsoon System Research, Institute of Atmospheric Physics, Chinese Academy of Sciences, Beijing 100029, China
*
Author to whom correspondence should be addressed.
Atmosphere 2022, 13(5), 735; https://doi.org/10.3390/atmos13050735
Submission received: 15 February 2022 / Revised: 22 April 2022 / Accepted: 28 April 2022 / Published: 4 May 2022
(This article belongs to the Section Meteorology)

Abstract

:
Based on rainfall data for the period of 1960–2018 from 382 stations in southwest China and multiple reanalysis datasets, interannual variation of rainfall in late spring over Southwest China and associated sea surface temperature and atmospheric circulation anomalies are examined. The first leading mode of late-spring rainfall anomalies displays a uniform-distribution pattern. The second leading mode shows a zonal dipole pattern. The leading mode is related to an atmospheric wave train over mid-high latitudes of Eurasia, with a center of action of atmospheric anomaly over Southwest China. The atmospheric anomalies over Southwest China modulate late-spring rainfall there via modulating vertical motion and water vapor transport. In addition, the leading mode of late-spring rainfall anomalies has a close relation with sea surface temperature anomalies (SSTA) in the central and eastern equatorial Pacific. SSTA in the central and eastern equatorial Pacific impacts late-spring rainfall anomalies over Southwest China via modulation of the tropical Walker and Hadley circulation. The second leading mode of late-spring rainfall variation over Southwest China is closely associated with SSTA in the tropical western Pacific and a mid-high latitude wave train. SSTA in the tropical western Pacific and the mid-high latitudes wave train together leads to out-of-phase variation of meridional wind anomalies between western and eastern parts of Southwest China, which further results in a zonal dipole rainfall anomaly over Southwest China.

1. Introduction

Southwest China is characterized by complex topography, diverse climate and frequent meteorological disasters, among which droughts and floods are the most serious, bringing great harm to people’s lives and properties and national economic construction. For example, an extreme high-temperature drought event occurred in Yunnan Province in spring and early summer of 2019. This extreme high-temperature drought event affected 1.35 million hectares of crops, with direct economic losses amounting to CNY 6.5 billion [1,2]. In addition, heavy rainstorms swept across most of Yunnan Province in late October of 2008, which resulted in mudslides, landslides and other geological disasters, affecting 410,000 people. Therefore, investigating rainfall variability in southwest China and revealing the underlying mechanism are of great importance for disaster prevention and mitigation.
Previous studies have demonstrated that rainfall variations over Southwest China are influenced by a number of large-scale climate factors, including Arctic Oscillation (AO)/North Atlantic Oscillation (NAO), South Asian monsoon, the Madden-Julian Oscillation (MJO), plateau snow cover, SST anomaly (SSTA) in the tropical Pacific and Indian Ocean [3]. For example, studies have demonstrated that rainfall in Southwest China can be markedly modulated by the circulation systems over mid-high and low latitudes [4,5]. It is suggested that El Niño and La Niña events have an asymmetric effect on the summer rainfall anomalies in Chongqing, a city with a dense population over Southwest China [6]. SSTA in the North Atlantic in boreal spring can impact rainfall anomalies in Southwest China via inducing an atmospheric wave train [7]. A study reported that winter AO has a high correlation with the simultaneous winter rainfall variation over Southwest China [8]. Various factors contribute to the occurrence of drought event in Southwest China. In spring, drought event over Southwest China could be affected by the western Pacific subtropical high and atmospheric anomalies over the northern Indian Ocean [9,10,11]. In autumn and winter, drought events in Southwest China are related to SSTA in the tropical central Pacific and tropical Indian Ocean, MJO, AO and NAO [12,13,14,15,16,17].
Late spring (i.e., May) is a critical period for the transition between the dry and rainy seasons in Southwest China [18]. This period corresponds to the onset of monsoon in Bay of Bengal, Indochina Peninsula and South China Sea, and is the transitional period between winter and summer monsoons in Northern Hemisphere [19]. Rainfall anomalies during this period play an important role in determining the spatio-temporal distribution of droughts and floods in Southwest China. When late-spring rainfall is below normal, rainy season starts later, which leads to significant increase in the occurrence of drought events in Southwest China. By contrast, if late-spring rainfall is abundant, Southwest China is prone to landslides, mudslides and other geological hazards [3]. Dong and Duan [20] proposed the distinct transition between dry and wet seasons in Southwest China. A recent study showed that rainfall in late spring accounts for 55.3% of the total spring rainfall in Southwest China [21]. Zheng et al. [3] investigated the primary features of the atmospheric circulation anomalies in late spring in association with the extreme drought and floods events in Yunnan Province. Chen et al. [22] pointed out that interannual variation of late-spring rainfall in Yunnan Province is closely related to the large-scale water vapor transport. In particular, above-normal rainfall would be observed in Southwest China when water vapor transport is stronger in the tropical Indian Ocean and the Bay of Bengal, and vice versa. Sun et al. [23] showed that change in the Somali jet has a pronounced relation with the late-spring rainfall in Southwest China. When the Somali jet is stronger, more rainfall appears in Southwest China in late spring. In addition, the early signals of rainfall in Southwest China, such as the spring snow cover in the Northern Hemisphere [24], the SST in the equatorial eastern Pacific and Indian Ocean [25] and the surface heating field of Qinghai–Tibet Plateau [5] are also investigated.
At present, few studies have examined interannual variation of rainfall anomalies in late spring as well as the associated SSTA and atmospheric anomalies. This study first identifies the dominant patterns of rainfall anomalies. Then, we examine the SSTA and atmospheric anomalies related to the dominant patterns of rainfall anomalies. The processes by which SSTA and atmospheric anomalies impact late-spring rainfall anomalies are also discussed.

2. Data and Methods

2.1. Data

Southwest China (21°–33° N, 97°–110° E) includes Sichuan, Yunnan, Guizhou and Chongqing Provinces (Figure 1), consistent with Li et al. [26], Li et al. [7] and Yu et al. [27]. Daily rainfall data from 382 national meteorological stations released by the National Meteorological Information Center were adopted for analyzing rainfall anomaly in late spring in Southwest China. Monthly vertical velocity, specific humidity, geopotential height, wind and temperature are obtained from the NCEP/NCAR reanalysis I project [28] with a horizontal resolution of 2.5° × 2.5°. Global monthly SST data with a horizontal resolution of 2° × 2° are provided by the National Oceanic and Atmospheric Administration of the United States (NOAA Extended Reconstructed SST V4; Smith et al. [29]; Huang et al. [30]; Liu et al. [31]). The India–Burma trough height field index is extracted from the National Climate Center of China Meteorological Administration. The study period is 1960–2018.

2.2. Method

The empirical orthogonal function (EOF) decomposition [32] and regression analysis are used to investigate the rainfall patterns in Southwest China and associated atmospheric circulation and SST anomalies. The two-sided Student’s t-test was used to examine the significance of regression coefficients. The Takaya–Nakamura (TN) wave activity flux [33] is used to examine the propagation of atmospheric wave train in association with the rainfall anomalies in Southwest China. The formula of the TN wave activity flux is as follows.
W = p cos φ 2 U U α 2 cos 2 φ ψ λ 2 ψ 2 ψ λ 2 + V α 2 cos φ ψ λ ψ φ ψ 2 ψ λ φ U α 2 cos φ ψ λ ψ φ ψ 2 ψ λ φ + V α 2 ψ φ 2 ψ 2 ψ φ 2
Here, ψ =   Φ f is the disturbance of quasi-geostrophic stream function relative to the climatic field, and the basic flow of U = (U, V) represents the climatic field. φ , λ , ϕ , a and Ω indicate the latitude, longitude, geopotential, earth radius and earth rotation rate, respectively.

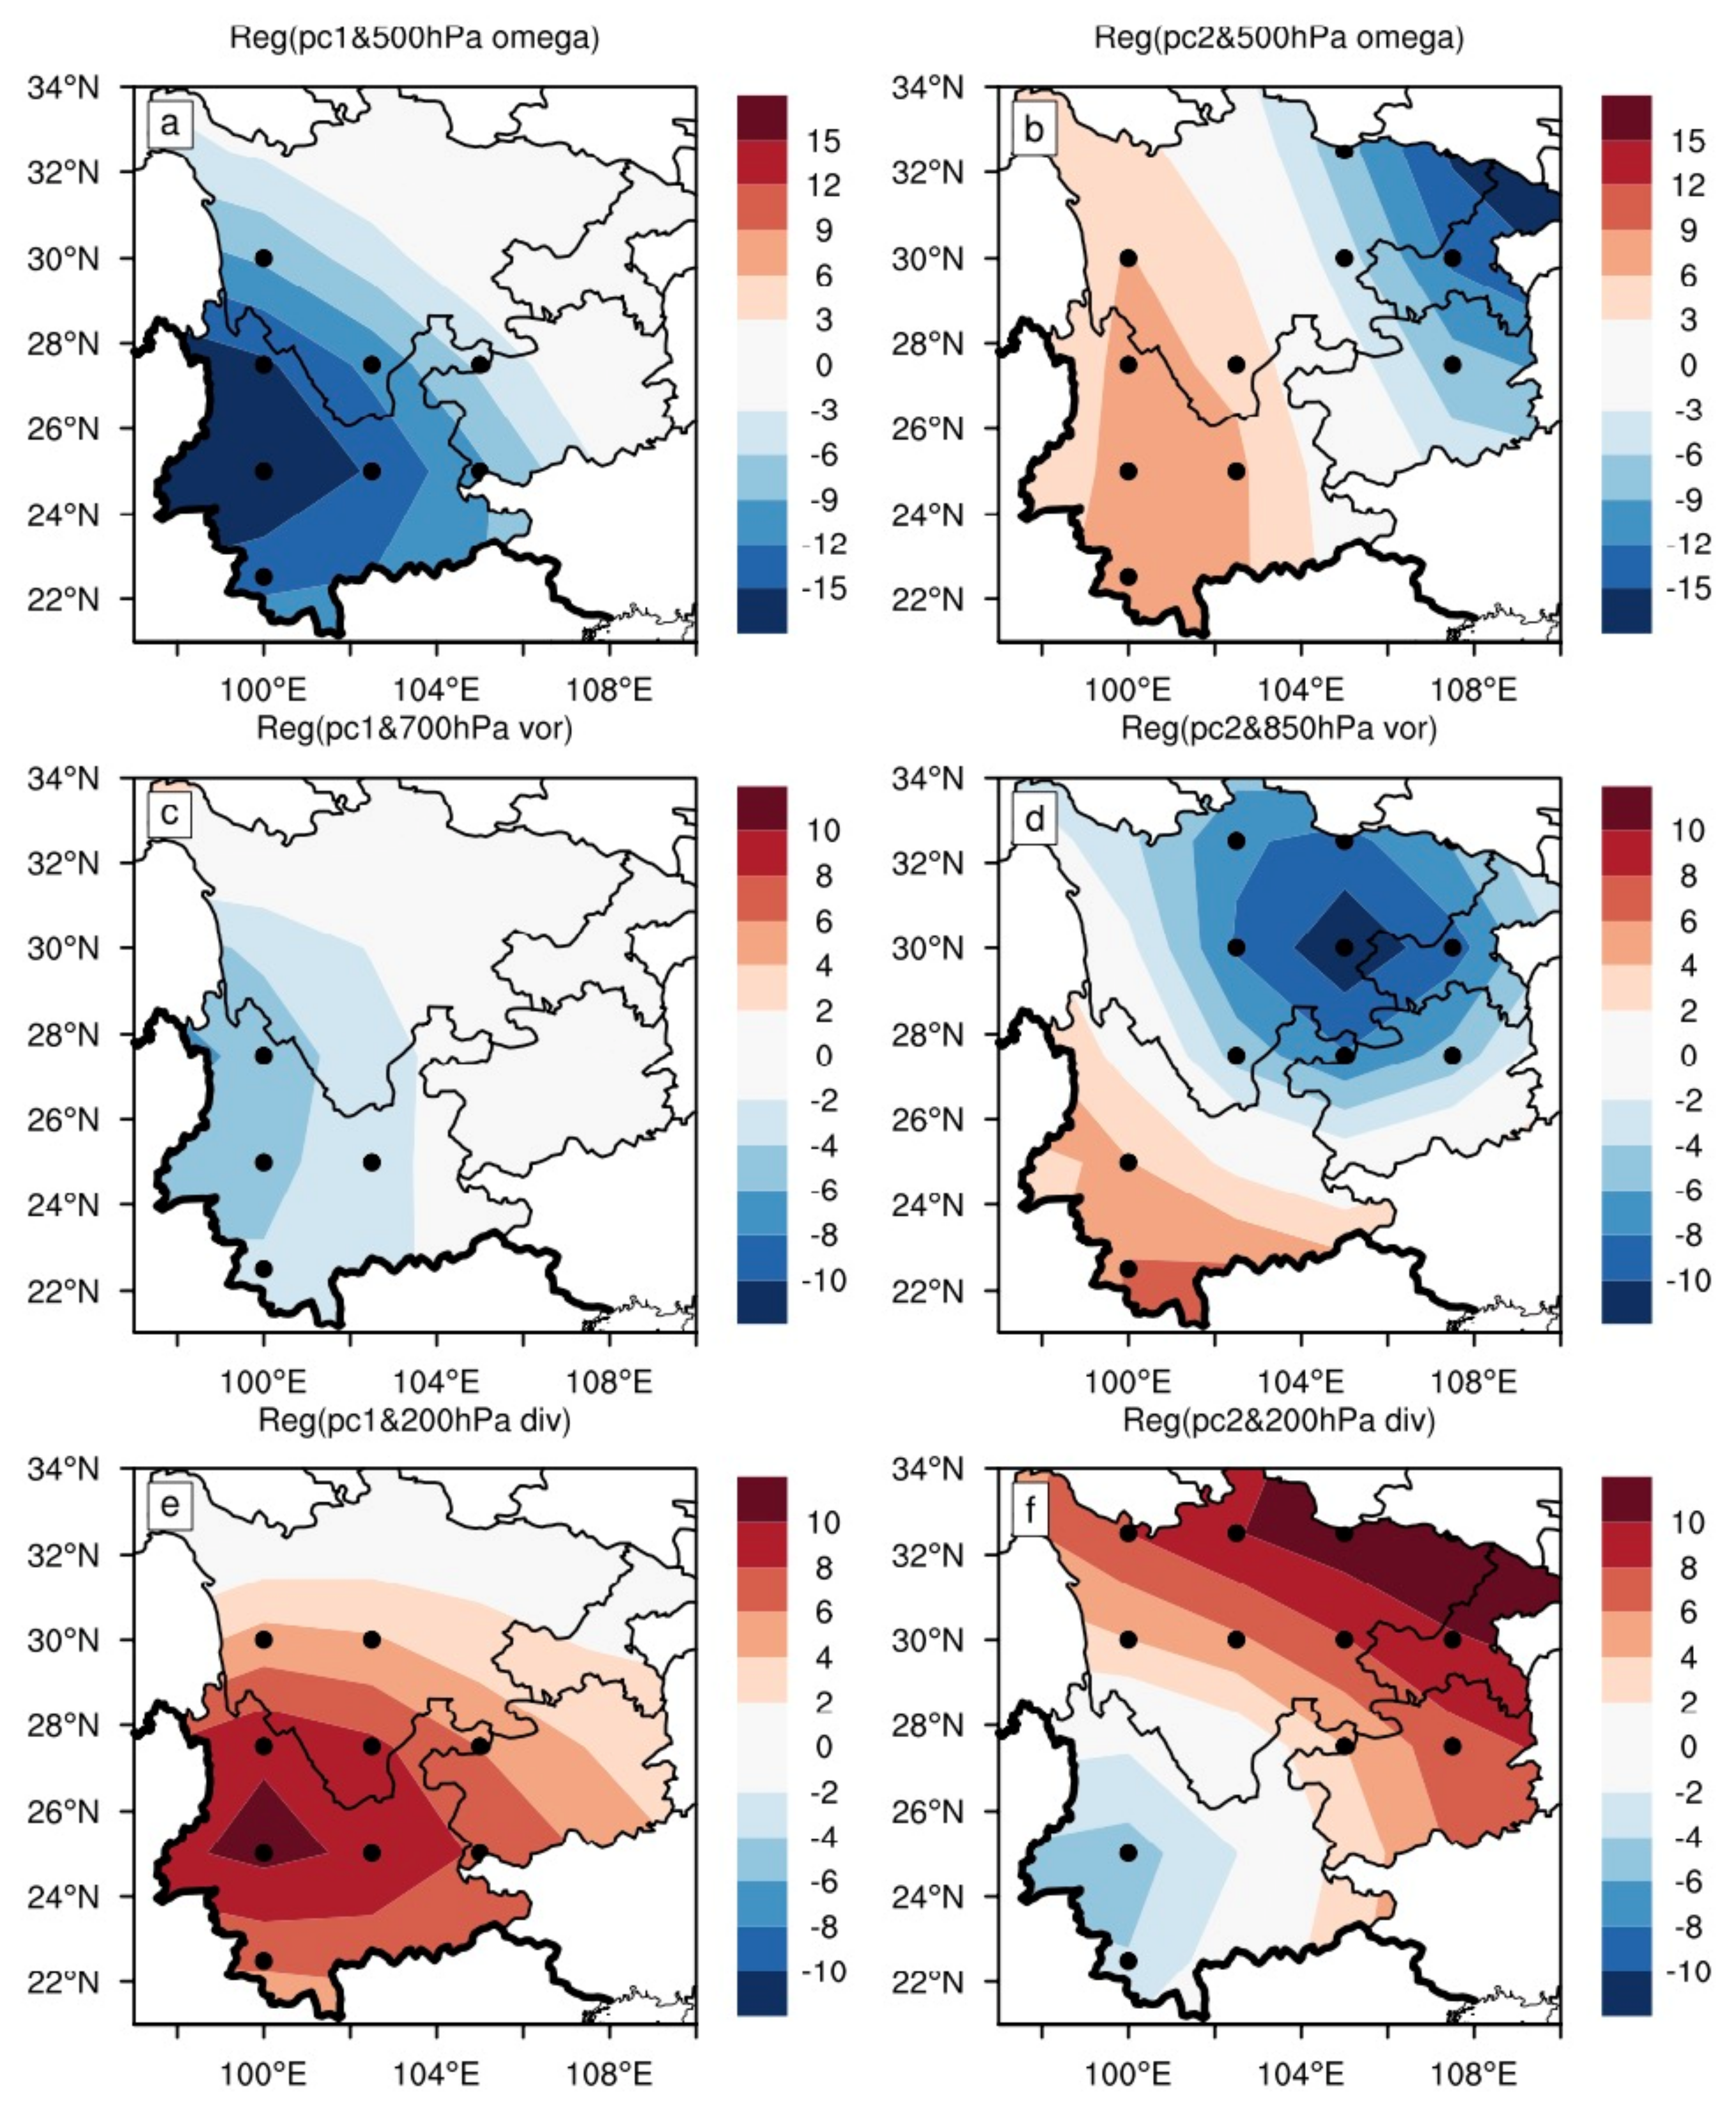
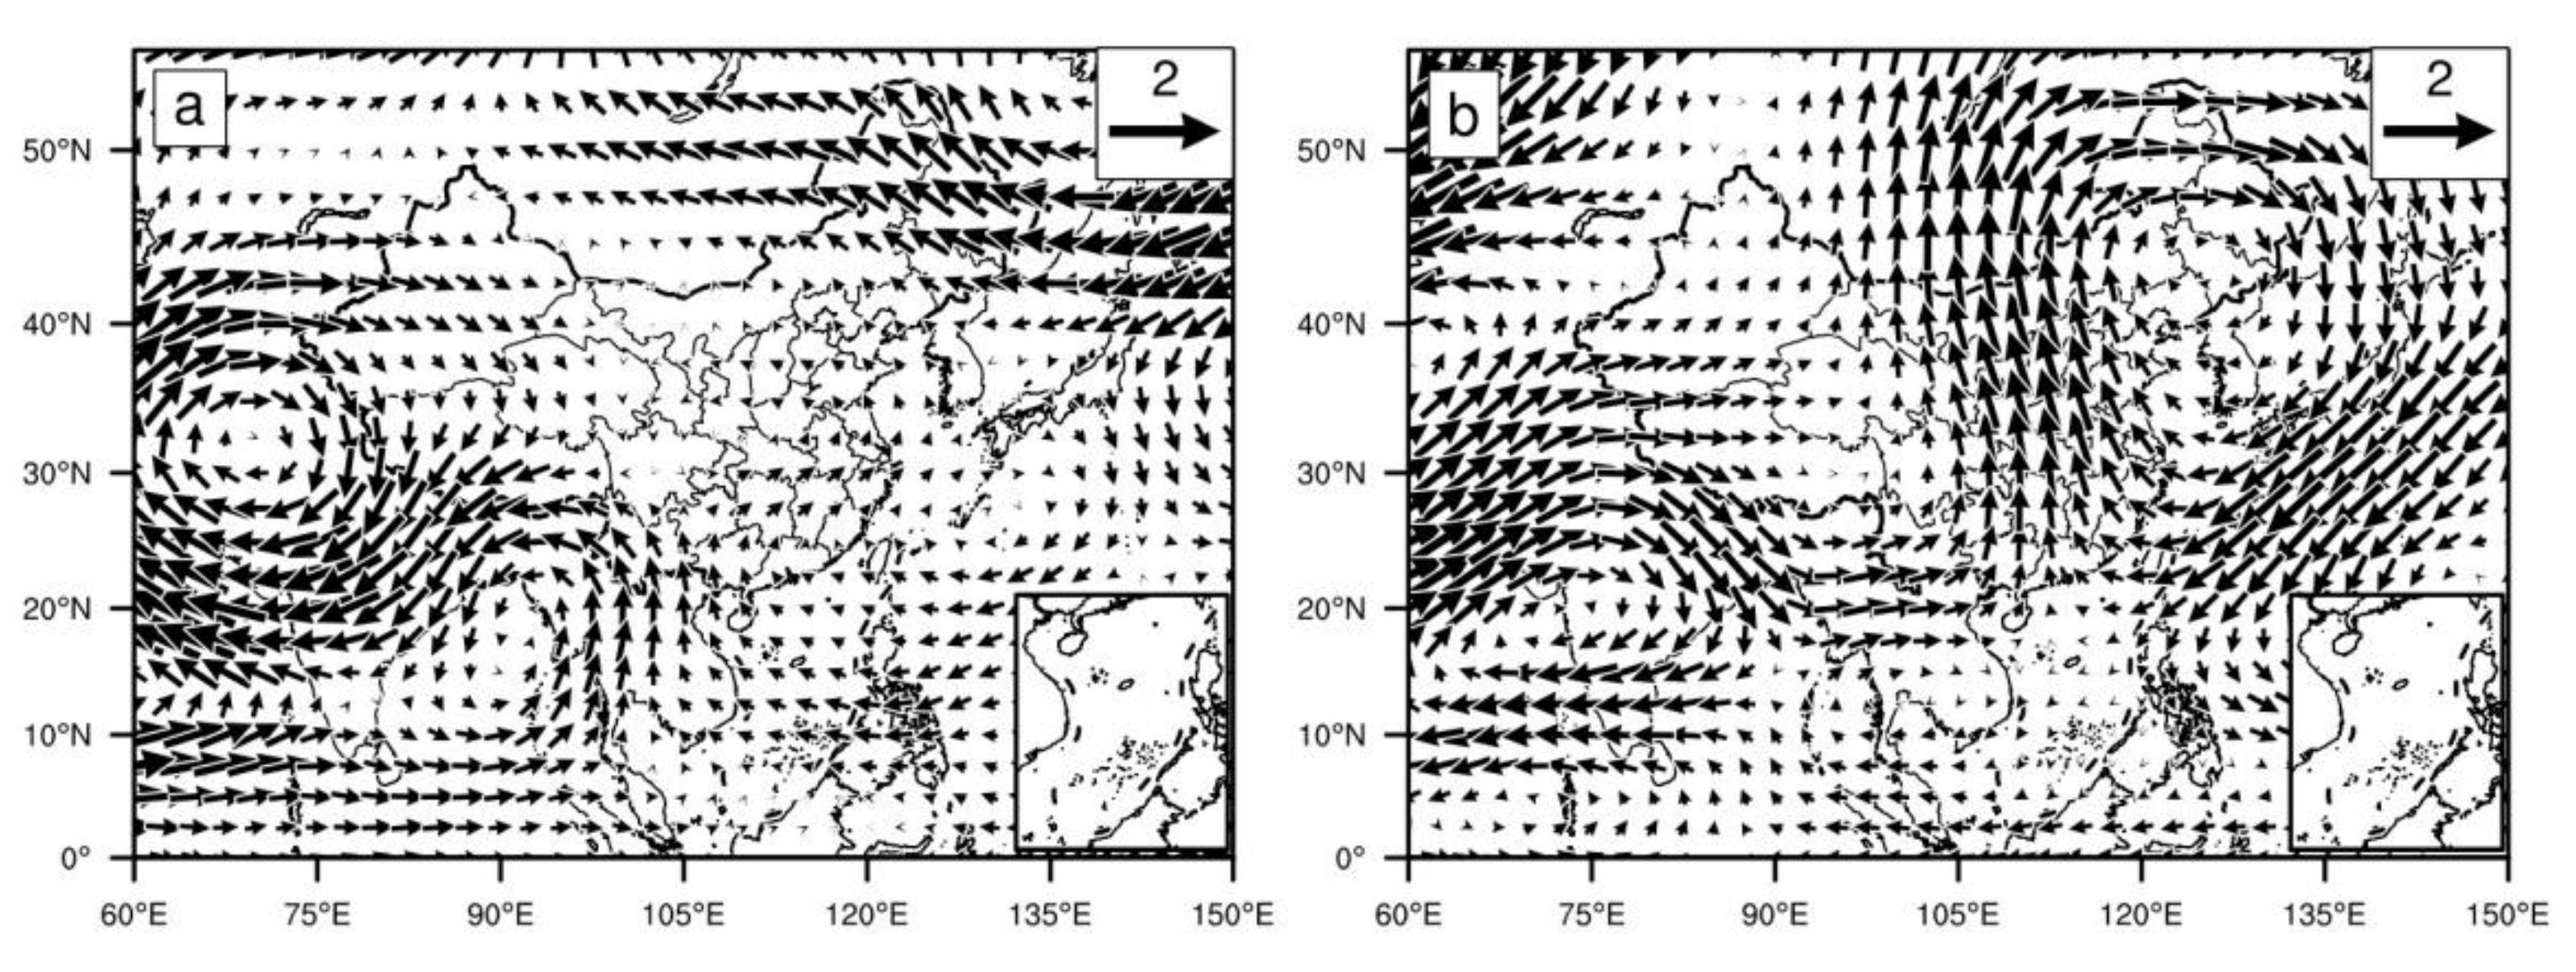
3. Leading Patterns of Rainfall Variation in Late Spring and Related Atmospheric Characteristics in Southwest China

We use the EOF method to extract the leading EOF modes of interannual variation of rainfall in late spring over Southwest China. Figure 1 show the spatial patterns of the first and second EOF modes (EOF1 and EOF2) of late-spring rainfall anomalies. The EOF1 and EOF2 account for 34.8% and 10.8% of the total variance, respectively. EOF1 and EOF2 can be well separated from each other and from other EOF modes. It should be mentioned that EOF3 is not examined in this study as it explains much less variance of the total rainfall variation (not shown). Positive (negative) phase of EOF1 shows a consistent increase (decrease) of rainfall in Southwest China except for small patches around the Sichuan Basin (Figure 1). This result is consistent with the findings of Jing et al. [34]. Significant increases (decreases) in rainfall appear over the Yunnan Province as well as the western and southern Sichuan Province. EOF2 presents a zonal dipole pattern, with an inverse variation of rainfall between eastern and western regions. In relation to the positive phase of the EOF2, significant decrease in rainfall appears in Yunnan Province and the Western Sichuan Plateau, and pronounced increase in rainfall occurs in the Sichuan Basin, Chongqing and most of Guizhou (Figure 2b). To assess the robustness of the results, we have slightly changed the regions used for EOF analysis. In particular, we have examined the two leading EOF modes of late-spring rainfall variation in five provinces of Southwest China, including Tibet, selected by Pang et al. [35]. The results (not shown) show that the first two leading modes are consistent with the above-mentioned spatial patterns. The time series corresponding to the first and second leading EOF modes present strong interannual variability (Figure 2c,d). It should be mentioned that the results obtained in this study are similar whether the long-term trend is removed or retained.
Water vapor is a critical factor for the occurrence of rainfall. Figure 3 shows vertically integrated water vapor flux and its divergence anomalies in late spring regressed onto the PC1 and PC2 of rainfall variation. Increase in the water vapor transport from the Bay of Bengal to Southwest China is seen in association with the positive phase of EOF1. In addition, marked water vapor flux convergent anomalies are apparent over most parts of Southwest China (Figure 3a). These conditions are conducive to the occurrence of rainfall. In association with the EOF2, obvious water vapor transports are seen from the South China Sea to the East of Southwest China. Note that the transport path related to EOF2 shifts eastward compared to that related to the EOF1. Large convergent anomalies of water vapor flux are observed over eastern parts of Southwest China, which favors formation of rainfall there (Figure 3a). The above analysis indicates that atmospheric circulation and related water vapor transports are important for the formation of rainfall anomalies related to the first two EOF modes. So where does the water vapor in the tropics come from and how is it transported? Zou et al. [36] investigated the interannual variability of summer water vapor source and sink over the tropical eastern Indian Ocean–Western Pacific and the underlying mechanism. Further research on the source of water vapor in the tropics related to the rainfall modes in Southwest China in late spring will be carried out in the future.
In the following, we further examined the large-scale atmospheric circulation anomalies associated with the two leading EOF modes of rainfall anomaly in late spring over Southwest China. Figure 4 shows 500 hPa vertical motion, low-level vorticity and upper-level divergence anomalies regressed onto the PC1 and PC2 of late-spring rainfall variation. In association with the EOF1, most parts of Southwest China are covered by anomalous convergence at low level and anomalous divergence at upper level. This pumping effect is beneficial to the ascending motion, which are thus favorable for the occurrence of rainfall (Figure 4a,c,e). In association with the EOF2, there are an ascending motion in the eastern part of Southwest China, a convergence zone in the low-level vorticity over the eastern Sichuan, Chongqing and northern Guizhou, as well as a significant divergence zone at the upper level over the east side of Southwest China (Figure 4b,d,f). These conditions facilitate increase in rainfall in eastern part of Southwest China. However, the West Sichuan Plateau and Yunnan Province are mainly dominated by descending motions, lower-level divergence and upper-level convergence (Figure 4b,d,f). This circulation configuration, combined with less water vapor in this region (Figure 3b), contribute to decrease in rainfall.
Figure 5 shows the 700 hPa wind anomalies regressed onto the PC1 and PC2 of late-spring rainfall variation. Simultaneously, the corresponding 500 hPa geopotential height anomalies with reference to the EOF1 and EOF2 are illustrated in Figure 6. In the positive phase of EOF1, Southwest China is dominated by a cyclonic circulation anomaly, which is the part of a wave train over the Eurasian region. The associated southerly wind anomaly provides preferable dynamic condition, energy accumulation and water vapor condition, which contribute to the increase in rainfall (Figure 5a vs. Figure 6a). In the positive phase of EOF2, the east of Southwest China is controlled by a southerly wind anomaly. This southerly wind anomaly is a part of the anomalous anticyclonic circulation over eastern China, which is more obvious at 500 hPa and corresponds to a positive anomaly of geopotential height (Figure 6b), carrying water vapor and energy to the north. Thus, this configuration is favorable for the rainfall over the east of Southwest China. In addition, the southerly wind anomaly is also closely related to the circulation in the west, which is associated with the situation of wave train (Figure 5b vs. Figure 6b).

4. Physical Mechanism Analysis

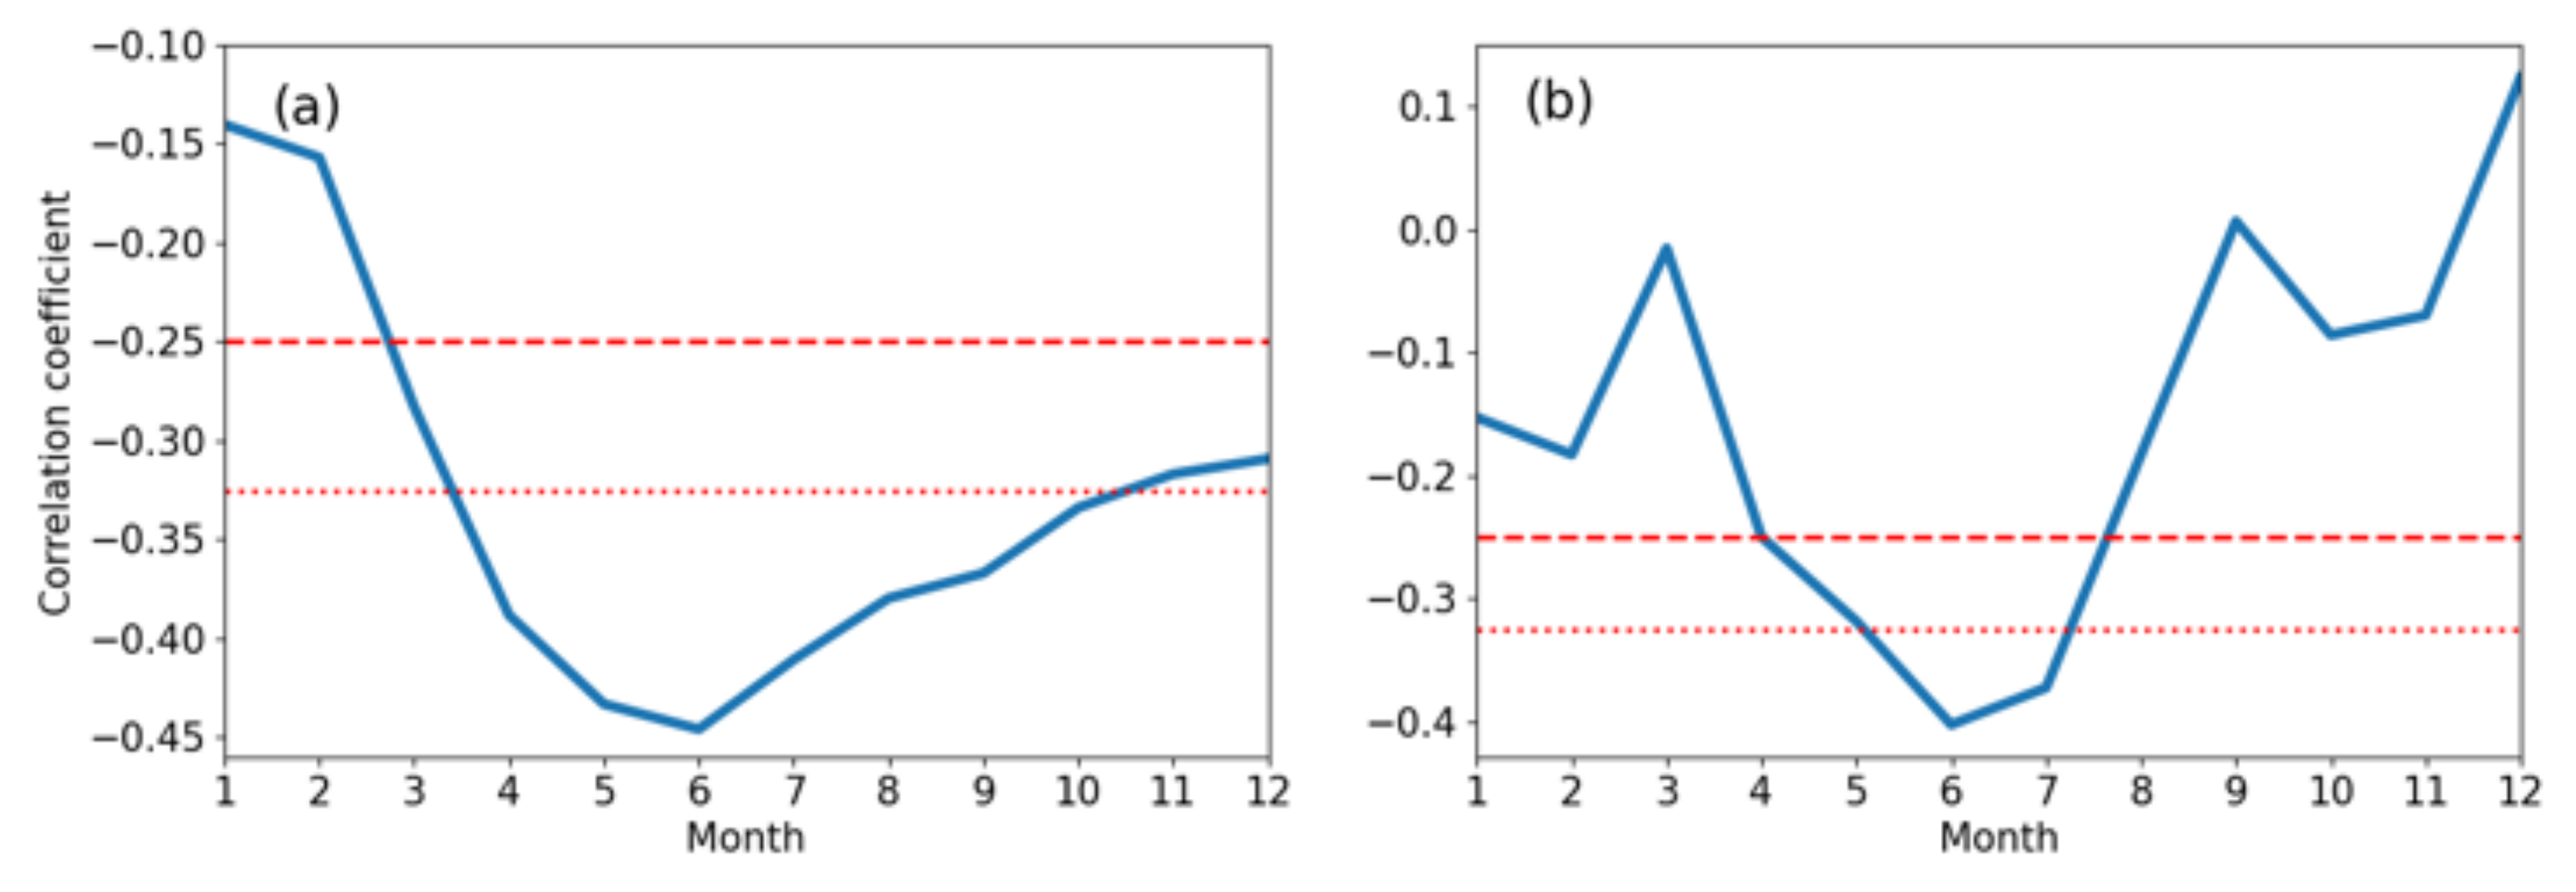
4.1. The Role of Tropical Sea Surface Temperature

In order to further explore the causes of atmospheric circulation anomalies in Southwest China in late spring and the factors influencing the rainfall patterns, this section investigates the influences of the preceding and contemporaneous SST anomalies. Figure 7 displays evolutions of SSTA from the preceding January to late spring regressed onto PC1 and PC2 of late-spring rainfall anomalies in Southwest China. It reveals that the positive phase of EOF1 of rainfall anomalies is highly correlated with a La Niña-like SSTA in the tropical central–eastern Pacific. The La Niña-like SSTA in the central and eastern equatorial Pacific develops and intensifies from March. Moreover, the signal of Pacific Decadal Oscillation (PDO) is also obvious in Figure 7a–e. The above results are consistent with the results that relevant interdecadal SST anomalies exhibit a La Niña-like mode with robust SST warming over the western Pacific–central North Pacific since 1998 [37]. Here, we only discuss the role of the equatorial eastern Pacific on the formation of rainfall modes in the southwest China in late spring. Whether the PDO has an effect on the first mode of the rainfall in Southwest China in late spring and how it affects on the interdecadal time scale will be studied in the future work. In addition, negative SSTA near 15° S in the Indian Ocean persists from April to late spring (Figure 7a–e). Note that SST anomalies in the tropical Pacific and in the Indian Ocean are not completely independent of each other. Conversely, they are closely related to each other through the Walker circulation and other processes [38]. During the positive phase of EOF2, there is a clear correlation between PC2 and the cold SSTA near the Philippines in the Northwest Pacific, where the negative SSTA persists from January to late spring and passes the 95% confidence level from April to May (Figure 7f–j). In addition, there is a significant positive correlation in eastern Indian Ocean, which persists from February to May. Figure 7 reveals the influence of the preceding factors on late-spring rainfall in Southwest China. The preceding SSTA located in the central-eastern equatorial Pacific can be used as an EOF1 indicator, whereas the preceding SSTA located in the Northwest Pacific warm pool and the eastern Indian Ocean can be used as the EOF2 indicator.
The SSTAs averaged in the Niño3.4 region and the Northwest Pacific warm pool are identified as indicators to further verify the effect of SSTA on rainfall anomalies in Southwest China. The lead–lag correlation between the PC1 (PC2) and the interannual component of the Niño3.4 SSTA index (SSTA index of Northwest Pacific warm pool) is given in Figure 8. The correlation coefficient between PC1 and Nino3.4 SSTA index passes the 95% confidence level from March to May, and passes the 99% confidence test from April to May, indicating that the central and eastern equatorial Pacific SSTA in the preceding two months have a significant impact on the EOF1 of the late-spring rainfall anomaly in Southwest China. During the positive phase of EOF1, the influence is mainly through zonal Walker circulation and meridional Hadley circulation. The specific process is that there is a cold (warm) SSTA in the central and eastern equatorial Pacific (Maritime Continent), and a cold SSTA in the Indian Ocean. Thus, the ascending branch of the Walker circulation is located in the Maritime Continent, and the descending branch is located in the equatorial central and eastern Pacific and around the Sumatra Island (Figure 9a). The descending branch near the Sumatra Island is also affected by the Hadley circulation, whose ascending branch is located within 20–30° N in Southwest China, and the southerly wind anomaly in the lower level and the northerly wind anomaly in the upper level form a closed vertical circulation cell (Figure 9b), which is conducive to the formation of the ascending motion corresponding to EOF1. In addition, Yu et al. [27] also explained this type of rainfall process during spring. When the equatorial central Pacific is in a cold SSTA phase in spring, a subtropical anticyclonic circulation anomaly (cyclonic circulation anomaly) is generated over the northwestern part of the equatorial central Pacific (mid-latitude western Pacific), and the anomalous winds on the west flank of the cyclonic circulation anomaly in the western Pacific affect the northeastern part of the Southwest China in the lower troposphere. Rainfall increases in the Marine Continent with cyclonic circulation anomalies on the northwest side. The cyclonic circulation anomaly strengthens the trough in the Bay of Bengal. The southerly flow in the south of Southwest China strengthens the transport of water vapor to Southwest China. The anomalous warm and humid air intersects with the anomalous cold air transported to Southwest China from its northeast side, leading to the increase of spring rainfall in Southwest China. Verifications on this explanation will be provided in the future.
The correlations between PC2 and the SSTA of the western Pacific warm pool in the previous April and contemporaneous May have passed the significance test at 95% confidence level, suggesting that the negative SSTA of the western Pacific warm pool in the previous month has a significant effect on the EOF2 of the late-spring rainfall anomaly in Southwest China. During the positive phase of EOF2, this process acts mainly through the Gill-type Rossby wave response [39] in the Northwest Pacific, i.e., the suppressed convective anomaly in the northwestern Pacific warm pool stimulates an anticyclonic circulation anomaly on its northwest flank (Figure 5b), which is more pronounced at 500 hPa (Figure 6b). Under this circulation configuration, the eastern part of Southwest China is controlled by southerly wind anomalies, and the water vapor transport path is more eastward and northward than normal (Figure 3b), resulting in more rainfall on its eastern side and less rainfall in most of the Southwest China, especially in the western part of Southwest China.

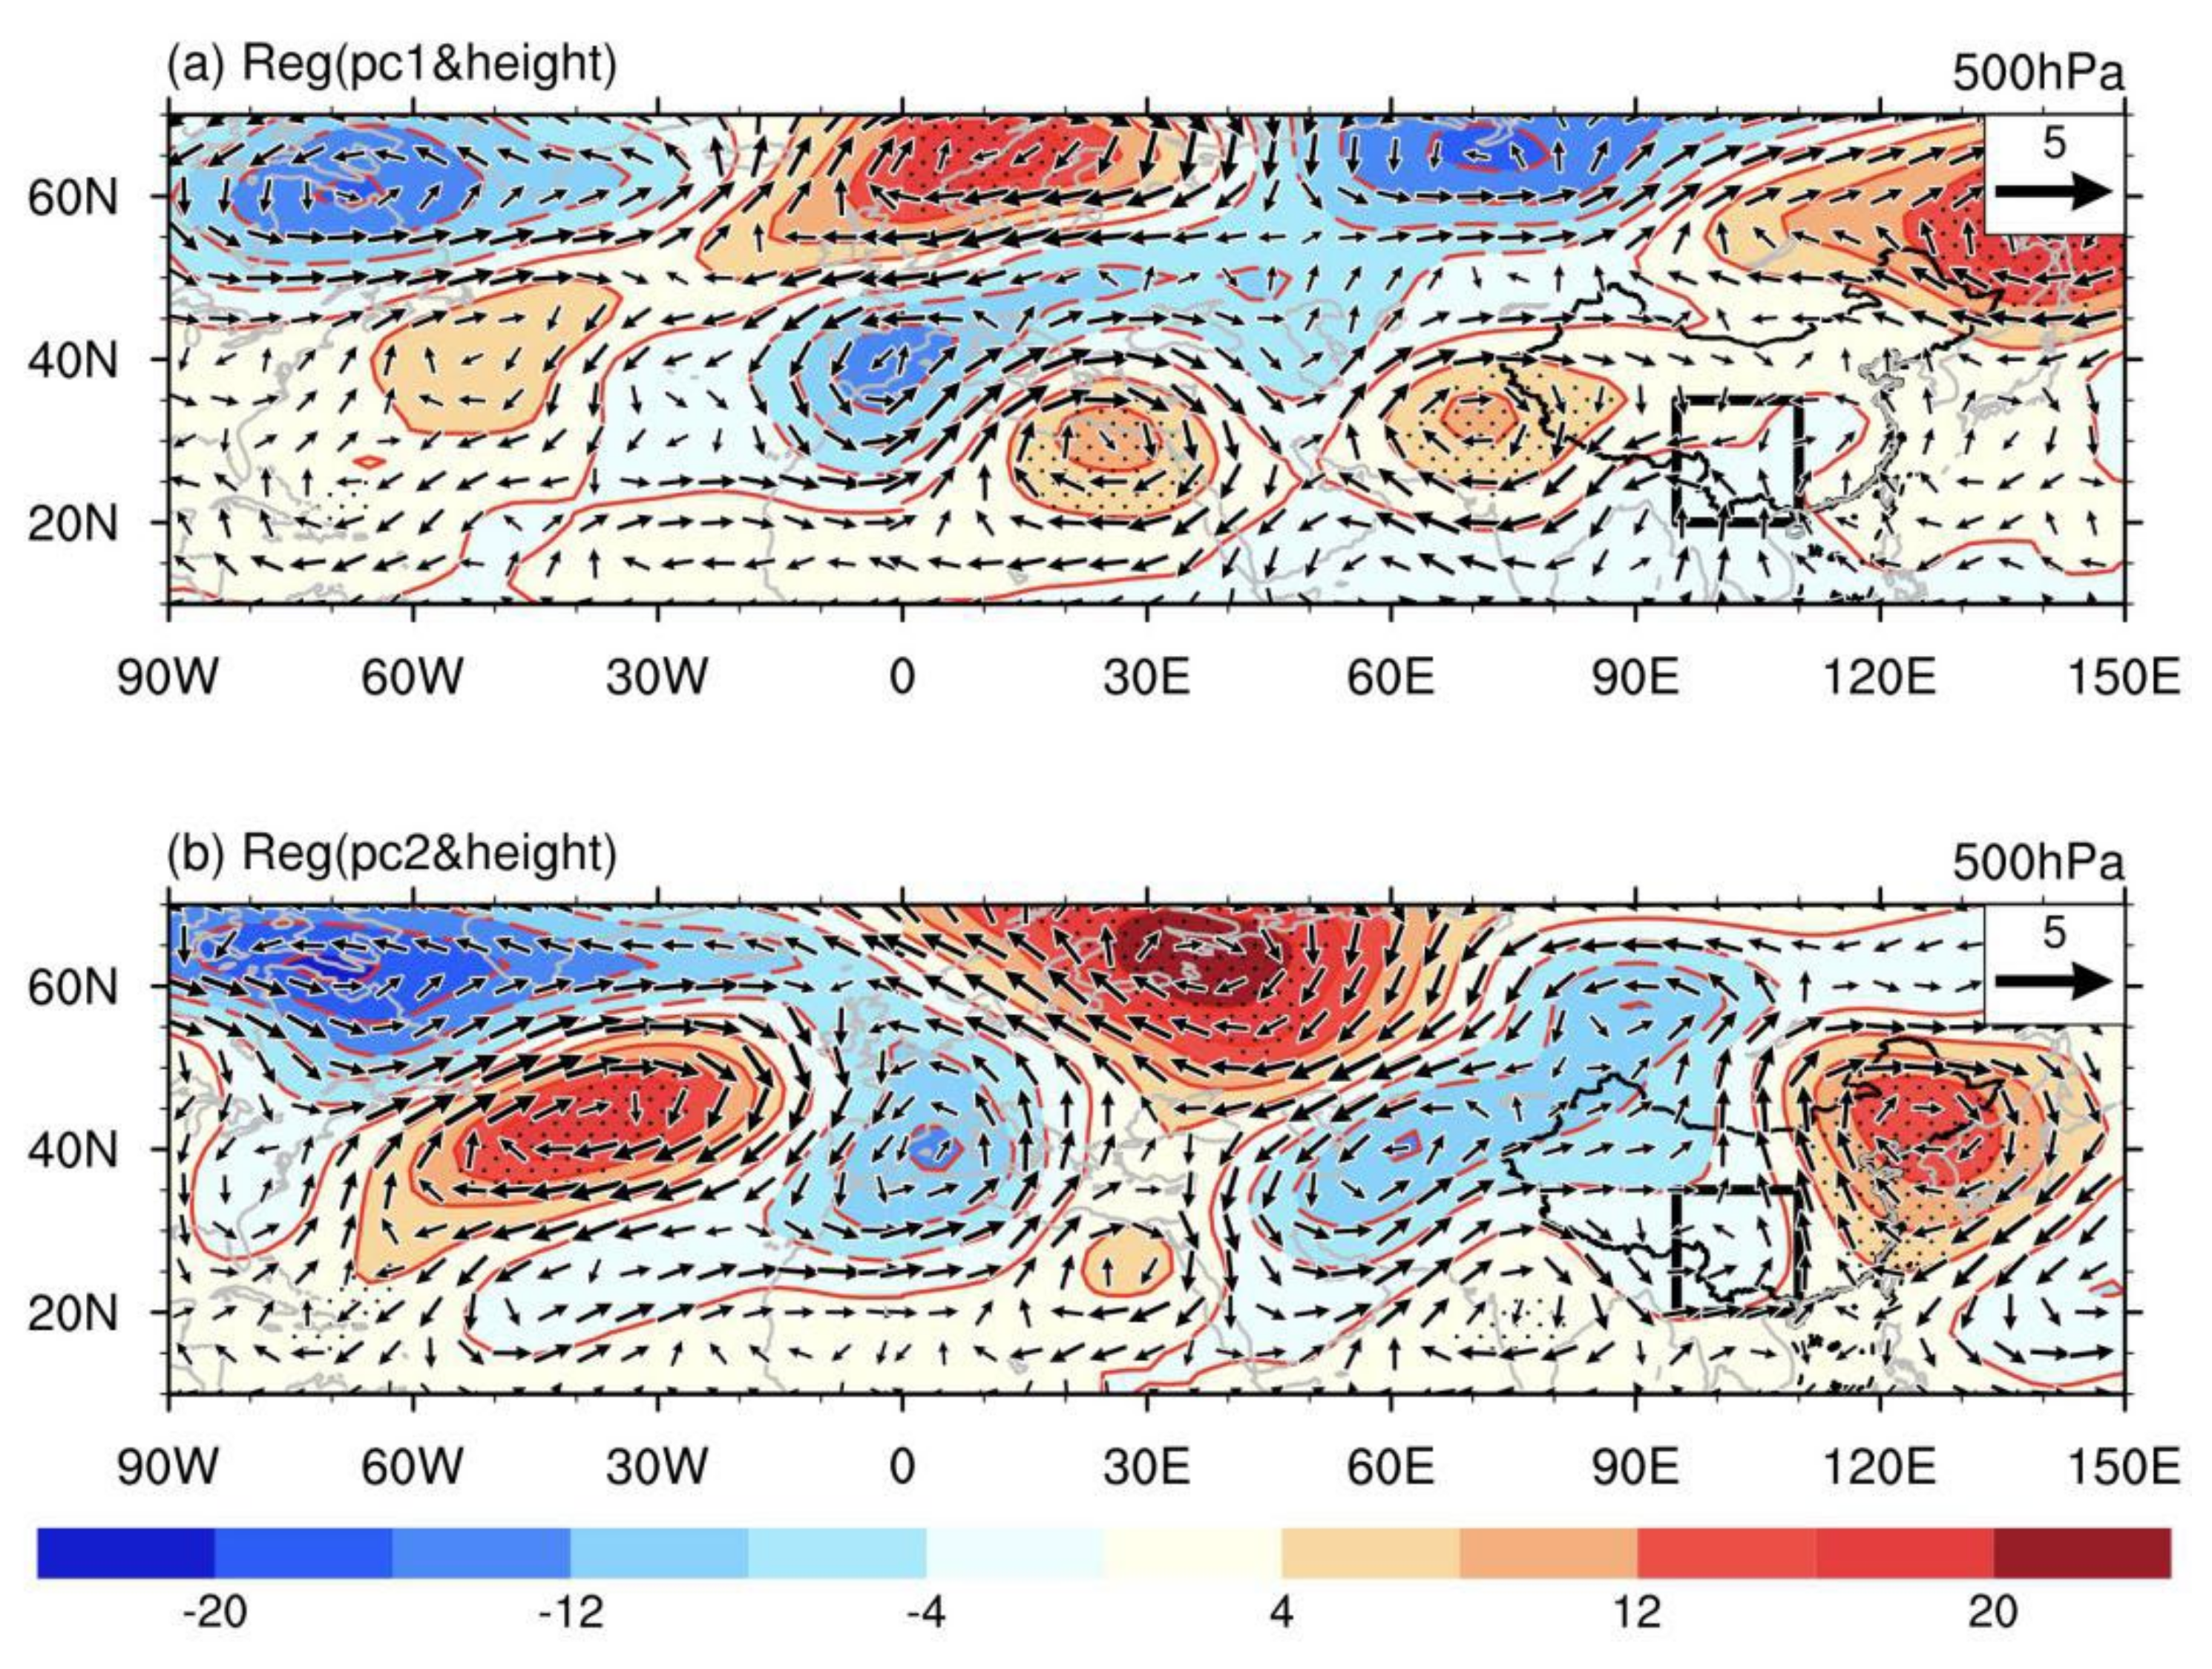
4.2. The Role of Mid-High Latitude Circulation Systems

To study the influence of the mid-high latitude circulation systems on the rainfall in Southwest China, the regressions of the anomalies of the wave activity flux and stream function at 500 hPa onto the PC1 and PC2 are performed, as shown in Figure 10. In the positive phase of EOF1, there is an obvious northwest–southeast wave train, which originates from the Northwestern Atlantic and covers the whole Eurasian continent. The wave train exhibits an alternat distribution of positive–negative–positive–negative pattern extending into South Asia, which is consistent with the results shown in Figure 6a. Meanwhile, the Rossby wave activity flux propagates to Asia, causing the alternative development of positive and negative height anomalies downstream, and the northern Indian Ocean and northern Indian Peninsula are controlled by negative height anomalies (Figure 6a and Figure 10a), which is conducive to the development of the India–Burma trough. The correlation coefficient between the India–Burma trough index and PC1 also passes the significance test at the 95% confidence level, and the enhancement of India–Burma trough is favorable to the transport of water vapor to Southwest China (Figure 3a). This is consistent with the result that the anomalous weakness of the southern branch trough played a critical role in occurrence and persistence of extreme drought in Yunnan of Southwest China in 2019 [1].
In the positive phase of EOF2, there are two wave propagation paths, as shown in Figure 10b. Along the first path, the wave energy propagates southeastward from the North Atlantic towards the Middle East and South Asia. This path is favorable for the establishment of a positive height anomaly in the India–Burma region, which is unfavorable to the rainfall occurrence over the west of Southwest China. The second path extends eastward along the high latitude to eastern China [40]. This path is beneficial to the establishment and maintenance of the positive height anomaly in eastern China, producing a southerly wind anomaly from the east of Southwest China to Mongolia (Figure 5b), which is conducive to the formation of the atmospheric circulation corresponding to EOF2. These two paths are consistent with the results in Figure 6b, as well as with the conclusion drawn by Ma et al. [2] that the mid-latitude Rossby wave propagates through North Africa, the Black Sea and the Iranian Plateau to East Asia and the high-latitude Rossby wave propagates from North Atlantic to East Asia through the East European Plain and West Siberian Plain during a period with persistent high temperatures from April to June in 2019.
In summary, the rainfall anomalies in the positive phase of EOF1 are mainly affected by the Eurasian wave train in the mid-high latitude and the SSTA in the equatorial central and eastern Pacific. The Eurasian wave train affects the 500 hPa India–Burma trough over the south flank of the plateau and the cyclonic circulation anomaly over the region, which makes the path of water vapor transport to Southwest China more westward and southward. In addition, the SSTA of La Niña pattern in the equatorial central and eastern Pacific makes Southwest China controlled by ascending motions through the zonal (Walker) and meridional (Hadley) circulations. Likewise, the rainfall anomalies in the positive phase of EOF2 are mainly affected by the cold SSTA in the Western Pacific Warm Pool and by the wave train in the mid-high latitude. The anticyclonic circulation anomaly generated by the cold SSTA in the Western Pacific Warm Pool and the positive height anomaly in eastern China affected by the Eurasian wave train plays an important role in the formation of the southerly wind anomaly in the eastern part of Southwest China, which shifts the water vapor transport path more eastward and northward. The wave trains in mid-high latitude also weaken the role of the south branch trough, which is not conducive to the establishment of dynamic and water vapor conditions favorable to rainfall in Southwest China.

5. Conclusions and Discussion

Based on multiple datasets, this study examines the first two leading EOF modes of rainfall variation over Southwest China. The EOF1 shows a consistent pattern of more (less) rainfall in Southwest China and is the dominant mode of rainfall in late spring in Southwest China, whereas EOF2 presents a zonal dipole pattern between western and eastern parts of Southwest China. Atmospheric circulation anomalies play an important role in the formation of rainfall anomalies related to the two leading modes. In the positive phase of EOF1, Southwest China is controlled by updrafts and cyclonic circulation anomalies, and the water vapor mainly comes from the Bay of Bengal, with the water vapor transport path being more westward and southward. In the positive phase of EOF2, areas with more rainfall correspond to updrafts, while areas with less rainfall in Southwest China correspond to downdrafts. The region from the east of Southwest China to Mongolia is controlled by southerly wind anomalies. The water vapor is mainly from the South China Sea, with the water vapor transport path being mostly to the east and north.
The positive phase of EOF1 corresponds to the SSTA of La Niña pattern, and its influence process is mainly realized by the Walker circulation and Hadley circulation. In the mid-high latitude, there are obvious wave train and wave energy propagating to the negative-height-anomaly areas over the northern Indian Ocean, north India and the Bay of Bengal, which favor the development of the India–Burma trough. The positive phase of EOF2 corresponds to the cold SSTA in the Western Pacific warm pool, which affects this rainfall mode mainly through the Gill-type Rossby wave response. In the mid-high latitude, the wave energy in a southward path propagates southeastward from the North Atlantic towards North Africa and South Asia, which plays a role in the positive height anomaly in the India–Burma region. Another northward path extends eastward along the high latitude to eastern China, which is conducive to the establishment of positive height anomalies and circulation associated with the EOF2 in this region. In addition, the SSTA in the equatorial central-east Pacific and the northwest Pacific warm pool are mainly indicative of the two leading EOF modes for predicting late-spring rainfall in Southwest China.
In this paper, the first EOF mode of rainfall pattern in Southwest China is consistent with the results obtained by Jing et al. [34] and Li et al. [7]. However, their analysis of the major modes of rainfall mainly focuses on the causes of interdecadal time scale, while our study gives a possible explanation for the formation of rainfall patterns in Southwest China in late spring on the interannual time scale. With regards to the influence of wave trains, it seems that the originations of the two wave trains (Figure 9) are from northern Atlantic, but their eastward propagations are different. Li et al. [7] proposed that the Atlantic SST influences rainfall in Southwest China through wave trains. Moreover, the internal dynamics of the atmosphere contribute to the emergence of wave trains. On the propagation modes of wave train, Song et al. [15] found that NAO influences the winter rainfall in Yunnan by affecting wave train of the South Branch trough and the high-pressure ridge system of Baikal Lake. The essence of the connection between NAO and the wave train system of the South Branch trough is that the disturbance energy caused by NAO in the Mediterranean region propagates downstream along the Asian-African subtropical jet, and the influence of NAO on Baikal Lake Ridge system is caused by wave reflection. These issues require further in-depth study. Furthermore, regarding the early signal of rainfall, Zhang et al. [41] analyzed early SST signals of rainfall in the pre-flood season in South China, and the results show that the early SST signal is mainly associated with SSTA in the tropical East Pacific and North Indian Ocean related to El Niño in development phase before 1998, which mainly affects the rainfall anomaly in late spring in South China through the Philippine anticyclone excited by atmospheric bridge. After 1998, the early SST signal is mainly related to SST anomaly of the horseshoe shape (PDO) in the mid-high latitude North Pacific, and it can modulate the intensity and location of the subtropical jet by affecting the transient activity in the middle latitude, causing rainfall anomalies in South China. The physical mechanism of the relationship between the rainfall in late spring and preceding indicators in Southwest China also needs to be further investigated in the future.

Author Contributions

S.M. and S.C. created the design. S.M. contributed to the writing—original draft and performed the data analysis. S.C. and H.A. revised the manuscript. Y.L. reviewed the draft. All authors have read and agreed to the published version of the manuscript.

Funding

This work was jointly supported by National Natural Science Foundation of China, grants number U2142207, the Project of National Science and Technology Supporting Plan, grants number 2015BAC03B06, and Special program for innovation and development of China Meteorological Administration, grants number CXFZ2021010.

Institutional Review Board Statement

Not applicable.

Informed Consent Statement

Not applicable.

Data Availability Statement

Daily rainfall data from national meteorological stations are archived at the National Meteorological Information Center. NCEP/NCAR reanalysis data are openly available at https://psl.noaa.gov/data/gridded/data.ncep.reanalysis.html (accessed on 20 April 2020). NOAA Extended Reconstructed SST data was obtained from https://psl.noaa.gov/data/gridded/data.ncep.reanalysis.html (accessed on 20 April 2020). The India–Burma trough height field index extracted from the National Climate Center of China Meteorological Administration is available at http://cmdp.ncc-cma.net/station/cn_india_burma_trough.php (accessed on 20 April 2020).

Acknowledgments

We thank three anonymous reviewers for their constructive suggestions, which substantially improved our paper.

Conflicts of Interest

The authors declare no conflict of interest.

References

  1. Ding, T.; Gao, H. The record-breaking extreme drought in Yunnan Province, Southwest China during spring–early summer of 2019 and possible causes. J. Meteorol. Res. 2020, 34, 997–1012. [Google Scholar] [CrossRef]
  2. Ma, S.; Zhu, C.; Liu, B. Possible causes of persistently extreme-hot-days-related circulation anomalies in Yunnan from April to June 2019. Chin. J. Atmos. Sci. 2021, 45, 165–180. (In Chinese) [Google Scholar]
  3. Zheng, J.; Zhang, W.; Ma, T.; Zhao, J. Composite characteristics of the abnormal circulation in May between extreme drought years and rainy years of Yunnan. Plateau Meteorol. 2014, 33, 916–924. (In Chinese) [Google Scholar]
  4. Chen, Y.; Ding, Y. Cold air activity in July 2004 and its impacts on intense rainfalls over Southwest China. Acta Meteorol. Sin. 2006, 64, 743–759. (In Chinese) [Google Scholar]
  5. Xia, Y.; Wan, X.; Yan, X.; Wu, L.; Long, Y. Variations of spring precipitation over southwest China and characteristic circulations for precipitation anomalies. Acta Meteorol. Sin. 2016, 74, 510–524. (In Chinese) [Google Scholar]
  6. Xiang, B.; Zhou, J.; Li, Y.H. Asymmetric relationships between El Niño/La Niña and floods/droughts in the following summer over Chongqing, China. Atmos. Ocean. Sci. Lett. 2020, 13, 171–178. [Google Scholar] [CrossRef] [Green Version]
  7. Li, G.; Chen, J.; Wang, X.; Luo, X.; Yang, D.; Zhou, W.; Tan, Y.; Yan, H. Remote impact of North Atlantic sea surface temperature on rainfall in southwestern China during boreal spring. Climate Dyn. 2018, 50, 541–553. [Google Scholar] [CrossRef]
  8. Jiang, X.W.; Li, Y.Q. Spatio-temporal variability of winter temperature and precipitation in Southwest China. J. Geogr. Sci. 2011, 21, 250–262. [Google Scholar] [CrossRef]
  9. Yan, H.; Duan, X.; Cheng, J. Study on a severe drought event over Yunnan in Spring 2005. J. Trop. Meteorol. 2007, 23, 300–306. (In Chinese) [Google Scholar]
  10. Liu, Y.; Zhao, E.; Sun, D.; Ju, J. Impacts of anomaly of summer monsoon over the Southeast Asia on the early Summer drought of Yunnan in 2005. Meteorol. Mon. 2006, 32, 91–96. (In Chinese) [Google Scholar]
  11. Liu, Y.; Zhao, E.; Peng, G.; Yang, S. Severe drought in the early summer of 2005 in Yunnan and middle-high latitudes circulation. Arid Meteorol. 2007, 25, 32–37. (In Chinese) [Google Scholar]
  12. Yang, J.; Gong, D.; Wang, W.; Miao, H.; Mao, R. Extreme drought event of 2009/2010 over southwestern China. Meteorol. Atmos. Phys. 2011, 115, 173–184. [Google Scholar] [CrossRef]
  13. Ju, J.; Lu, J.; Xie, G.; Huang, Z. Studies on the influences of persistent anomalies of MJO and AO on drought appeared in Yunnan. Arid Meteorol. 2011, 29, 401–406. (In Chinese) [Google Scholar]
  14. Huang, R.; Liu, Y.; Wang, L. Analyses of the causes of severe drought occurring in Southwest China from the Fall of 2009 to the Spring of 2010. Chin. J. Atmos. Sci. 2012, 36, 443–457. (In Chinese) [Google Scholar]
  15. Song, J.; Yang, H.; Li, C. A further study of causes of the severe drought in Yunnan Province during the 2009/2010 Winter. Chin. J. Atmos. Sci. 2011, 35, 1009–1019. (In Chinese) [Google Scholar]
  16. Xu, H.; Li, J.; Feng, J.; Mao, J. The asymmetric relationship between the winter NAO and the precipitation in Southwest China. Acta Meteorol. Sin. 2012, 70, 1276–1291. (In Chinese) [Google Scholar]
  17. Feng, L.; Li, T.; Yu, W. Cause of severe droughts in Southwest China during 1951–2010. Clim. Dyn. 2014, 43, 2033–2042. [Google Scholar] [CrossRef]
  18. Yan, H.; Li, Q.; Sun, C.; Yuan, Y.; Li, D. Criterion for determining the onset and end of the rainy season in Southwest China. Chin. J. Atmos. Sci. 2013, 37, 1111–1128. (In Chinese) [Google Scholar]
  19. Wang, L.; Chen, W. Characteristics of multi-timescale variabilities of the drought over last 100 Years in Southwest China. Adv. Meteorol. Sci. Technol. 2012, 2, 21–26. (In Chinese) [Google Scholar]
  20. Dong, X.; Duan, X. Climatic characteristics and variation tendency of precipitation in the southwest region of China. Sci. Meteorol. Sin. 1998, 18, 239–247. (In Chinese) [Google Scholar]
  21. Li, G.; Li, C.; Zhou, W.; Wen, B. Climatic characteristics of rainfall over Southwest China during spring and spring months. Clim. Environ. Res. 2020, 25, 575–587. [Google Scholar]
  22. Chen, Y.; Ding, Y.; Xiao, Z.; Yan, H. The impact of water vapor transport on the summer monsoon onset and abnormal rainfall over Yunnan Province in May. Chin. J. Atmos. Sci. 2006, 30, 25–37. (In Chinese) [Google Scholar]
  23. Sun, H.; Shi, W.; Xiao, Z.; Zhu, K. The relationship between Somali jet and rainfall in May over Southwest China and its decadal variability. Clim. Enviro. Res. 2017, 22, 405–417. (In Chinese) [Google Scholar]
  24. He, Y.; Yang, R.; Wen, J.; Cao, J. Influences of snow cover of the Northern Hemisphere on precipitation of Yunnan province in May. Plateau Meteorol. 2013, 32, 1712–1719. (In Chinese) [Google Scholar]
  25. Li, Y.; Lu, C.; Xu, H.; Cheng, B. Anomalies of sea surface temperature in Pacific- Indian Ocean and effects on drought/flood in summer over eastern of Southwest China. J. Trop. Meteorol. 2012, 28, 145–156. (In Chinese) [Google Scholar]
  26. Li, Y.J.; Ren, F.M.; Li, Y.P.; Wang, P.; Yan, H. Characteristics of the Regional Meteorological Drought Events in Southwest China During 1960–2010. J. Meteorol. Res. 2014, 28, 381–392. [Google Scholar] [CrossRef]
  27. Yu, J.; Zhang, W.; Zhang, Y. Effect of equatorial Pacific SSTA on interannual variations of rainfall over the Southwestern China during Spring. J. Trop. Meteorol. 2015, 31, 11–20. (In Chinese) [Google Scholar]
  28. Kalnay, E. NCEP/NCAR 40-year reanalysis project. Bull. Amer. Meteorol. Soc. 1996, 77, 437–472. [Google Scholar] [CrossRef] [Green Version]
  29. Smith, T.M.; Reynolds, R.W.; Peterson, T.C.; Lawrimore, J.H. Improvements to NOAA’s historical merged land–ocean surface temperature analysis. J. Clim. 2008, 21, 2283–2296. [Google Scholar] [CrossRef]
  30. Huang, B.; Banzon, V.F.; Freeman, E.; Lawrimore, J.; Liu, W.; Peterson, T.; Smith, T.M.; Thorne, P.W.; Woodruff, S.D.; Zhang, H.M. Extended reconstructed sea surface temperature version 4 (ERSST.v4). Part I: Upgrades and intercomparisons. J. Clim. 2015, 28, 911–930. [Google Scholar] [CrossRef] [Green Version]
  31. Liu, W.; Huang, B.; Thorne, P.W.; Banzon, V.F.; Zhang, H.M.; Freeman, E.; Lawrimore, J.; Peterson, T.; Smith, T.M.; Woodruff, S.D. Extended reconstructed sea surface temperature version 4 (ERSST.v4): Part II. parametric and structural uncertainty estimations. J. Clim. 2013, 28, 931–951. [Google Scholar] [CrossRef]
  32. Storch, H.V.; Zwiers, F.W. Statistical Analysis in Climate Research; Cambridge University Press: Cambridge, UK, 1999. [Google Scholar]
  33. Takaya, K.; Nakamura, H. A formulation of a phase-independent wave-activity flux for stationary and migratory quasigeostrophic eddies on a zonally varying basic flow. J. Atmos. Sci. 2001, 58, 608–627. [Google Scholar] [CrossRef]
  34. Jing, H.; Sun, J.; Yu, S.; Hua, W. Decadal variability in the relationship between May rainfall over Southwest China and the Arabian Sea Monsoon. Chin. J. Atmos Sci. 2021, 45, 1087–1098. (In Chinese) [Google Scholar]
  35. Pang, Y.; Qin, N.; Wang, C.; Luo, Y. Analysis on the Impact of ENSO Events Seasonal Evolution on Summer Rainfall Anomalies in Southwest China. Plateau Meteorol. 2020, 39, 581–593. [Google Scholar]
  36. Zou, M.; Qiao, S.; Chao, L.; Chen, D.; Hu, C.; Li, Q.; Feng, G. Investigating the interannual variability of the boreal summer water vapor source and sink over the tropical eastern Indian ocean-western pacific. Atmosphere 2020, 11, 758. [Google Scholar] [CrossRef]
  37. Hu, C.; Chen, D.; Huang, G.; Yang, S. Dipole types of autumn precipitation variability over the subtropical East Asia-western Pacific modulated by shifting ENSO. Geophys. Res. Lett. 2018, 45, 9123–9130. [Google Scholar] [CrossRef] [Green Version]
  38. Wu, G.; Meng, W. Gearing between the Indo-monsoon Circulation and the Pacific-Walker Circulation and the ENSO. Part I: Data Analyses. Chin. J. Atmos. Sci. 1998, 22, 470–480. (In Chinese) [Google Scholar]
  39. Gill, A.E. Some simple solutions for heat-induced tropical circulation. Quart. J. R. Meteorol. Soc. 1980, 106, 447–462. [Google Scholar] [CrossRef]
  40. Li, J.; Yu, R.; Zhou, T. Teleconnection between NAO and Climate Downstream of the Tibetan Plateau. J. Clim. 2008, 21, 4680–4690. [Google Scholar] [CrossRef]
  41. Zhang, C.; Jiang, Y.; Yang, S.; Hu, C.; Zhang, T.; Deng, K. Characteristics analysis of preceding sea surface temperature signals of May rainfall in Southern China. Meteorol. Environ. Sci. 2015, 38, 29–35. (In Chinese) [Google Scholar]
Figure 1. Location distribution of meteorological stations in Southwest China.
Atmosphere 13 00735 g001
Figure 2. (a) Regressed anomalies of interannual components of rainfall anomaly (shaded, unit: mm) onto the interannual component of the PC1 corresponding to EOF1 of normalized rainfall anomaly in late spring in Southwest China during 1960–2018. (b) As in (a), but for PC2. (c,d) PC1 and PC2 time series correspond to EOF1 and EOF2, respectively. Stippling in (a,b) denotes rainfall anomalies that have exceeded the 95% confidence level.
Atmosphere 13 00735 g002
Figure 3. (a) Regressed anomalies of interannual components of the integral water vapor flux (vectors, unit: kg m−1 s−1) and vapor flux divergence (shading, unit: 10−6 kg m−2 s−1) of the whole layer (1000–300 hPa) in late spring onto the interannual components of the PC1 for the period of 1960 to 2018. (b) As in (a), but for PC2. The bold arrows denote that the U or V component of the wind anomalies have exceeded the 95% confidence level.
Atmosphere 13 00735 g003
Figure 4. Regressed anomalies of interannual components of (a) 500 hPa omega (unit: 10−3 Pas1), (c) 700 hPa vorticity (unit: 10−7 s−1) and (e) 200 hPa divergence (unit: 10−7 s−1) in late spring onto the interannual components of the PC1 for the period of 1960 to 2018. (b) As in (a), but for PC2; (d) As in (c), but for 850 hPa vorticity and PC2; (f) As in (e), but for PC2. The black spots denote the values have passed the 95% confidence level.
Atmosphere 13 00735 g004
Figure 5. (a) Regressed anomalies of the interannual component of 700 hPa wind (vector, unit: ms−1) onto the interannual components of the PC1 for the period of 1960 to 2018. (b) As in (a), but for PC2. The bold arrows denote the U or V components of wind anomalies have passed the 95% confidence level.
Atmosphere 13 00735 g005
Figure 6. (a) Regressed anomalies of the interannual component of 500 hPa geopotential height (shaded, unit: gpm) and wind (vector, unit: ms−1) onto the interannual components of the PC1 for the period of 1960 to 2018. (b) As in (a), but for PC2. The black spots denote the values have passed the 95% confidence level; the black squares represent the Southwest China (21°–33° N, 97°–110° E).
Atmosphere 13 00735 g006
Figure 7. (ae) Regressed anomalies of the interannual components of SST from January to May (shaded, unit: 10−2 °C) onto the interannual components of PC1 for the period of 1960 to 2018. (fj) As in (ae), but for PC2. The white spots denote the values that have passed the 95% confidence level; the black squares represent the Southwest China (21°–33° N, 97°–110° E).
Atmosphere 13 00735 g007
Figure 8. (a) Lead–lag correlations of the interannual components of anomalous SST indexes identified in the Niño3.4 region with the interannual components of the PC1 for the period of 1960 to 2018. (b) As in (a), but for western Pacific warm pool (16°–18° N, 141°–149° E) and PC2. The red dotted-long and dotted lines, respectively, represent the 95% and 99% confidence level.
Atmosphere 13 00735 g008
Figure 9. (a) Regressed anomalies of the longitude-height cross-section of the interannual component of the vertical velocity (shaded; 10−3 Pas−1), wind (vector; meridional component, ms−1, multiplied by 10; vertical component, Pas−1, multiplied by −100) averaged over 5° S–5° N onto the interannual component of PC1 for the period of 1960 to 2018. (b) As in (a), but for the latitude-height cross-section and averaged over 90°−105° E. The black spots denote the values have passed the 95% confidence level.
Atmosphere 13 00735 g009
Figure 10. (a) Regressed anomalies of interannual components of wave activity flux (vectors, unit: m2s−2) and stream function (shaded, unit: 106 m) at 500 hPa in late spring onto the interannual components of the PC1 for the period of 1960 to 2018. (b) As in (a), but for PC2. The black skew squares denote the values that have passed the 95% confidence level. The black squares represent the Southwest China (21°–33° N, 97°–110° E).
Atmosphere 13 00735 g010
Publisher’s Note: MDPI stays neutral with regard to jurisdictional claims in published maps and institutional affiliations.

