Article

Experimental Investigation of the Near-Surface Flow Dynamics in Downburst-like Impinging Jets Immersed in ABL-like Winds

by
Federico Canepa
1,2,*,
Massimiliano Burlando
1,
Horia Hangan
2,3 and
Djordje Romanic
2,4
1
Department of Civil, Chemical and Environmental Engineering (DICCA), Polytechnic School, University of Genoa, Via Montallegro 1, 16145 Genoa, Italy
2
Wind Engineering, Energy and Environment (WindEEE) Research Institute, Western University, 2535 Advanced Avenue, London, ON N6M 0E2, Canada
3
Faculty of Engineering and Applied Science, Ontario Tech University, 2000 Simcoe Street North, Oshawa, ON L1G 0C5, Canada
4
Department of Atmospheric and Oceanic Sciences, Faculty of Science, McGill University, Burnside Hall, 805 Sherbrook Street West, Montreal, QC H3A 0B9, Canada
*
Author to whom correspondence should be addressed.
Atmosphere 2022, 13(4), 621; https://doi.org/10.3390/atmos13040621
Submission received: 16 February 2022 / Revised: 28 March 2022 / Accepted: 10 April 2022 / Published: 13 April 2022

Abstract

:
Downburst winds are strong downdrafts of cold air that embed into the atmospheric boundary layer (ABL) and produce intense horizontal outflow upon impingement on the ground. They are highly transient and three-dimensional extreme wind phenomena with a limited spatiotemporal structure that often makes the anemometric measurements in nature inadequate for reconstructing their complex flow fields. In the framework of the project THUNDERR, an experimental campaign on downburst outflows has been carried out at the WindEEE Dome at Western University, Canada. The present study analyzes the three-dimensional interaction between downburst (DB) outflows produced as large-scale impinging jets and ABL winds. Most experimental, numerical and analytical models in the literature neglect this flow interplay or treat it in an oversimplistic manner through a vector superposition. We found that the generated near-surface outflow is asymmetric, and a high-intensity wind zone develops at the interface between DB and ABL winds. The time variability of the leading edge of the outflow was investigated by synchronizing all wind measurements across the testing chamber. The three-dimensional flow structure was studied using a refined grid of Cobra probes that sampled the flow at high frequencies. The passage of the primary vortex produced a significant decrease in the height of maximum radial wind speed, predominantly in the ABL-streamwise direction. The turbulence intensity was the highest in the region where DB propagates into oppositely directed ABL winds.

1. Introduction

Downbursts are negatively buoyant downdrafts that emerge from cumulonimbus clouds and diverge radially upon hitting the ground. These strong outflows can have a negative impact on low- and mid-rise structures [1]. Downburst outflows are non-stationary phenomena associated with convective storms and their spatiotemporal scales are a few kilometers and tens of minutes. However, their space and time characteristics are also highly susceptible to atmospheric conditions and depend on the specific characteristics of different climate regions around the globe [2]. These are only some of the reasons their codification in wind-loading recommendations is challenging and steered numerous discussions inside the wind engineering community over the last few decades. In most cases, design codes for all wind types, including downbursts, are still based on the Davenport chain developed to determine the wind loading and response of structures subjected to large-scale cyclones [3,4].
While anemometers installed on a meteorological tower can capture the time evolution of the phenomenon at a fixed location, these measurements are insufficient to reconstruct the spatial structure of downburst outflows. The transient and dominant feature of a typical downburst record, i.e., the signal’s peak, is usually well-defined and represents the passage of the so-called primary vortex (PV) over or near the measuring instrument. Vortical structures form at the base of the parent thunderstorm cloud, triggered by the strong instability, namely the Kelvin–Helmholtz instability, between the cold and dense buoyancy-driven downdraft and the surrounding environment. The formed vortical structures are thus convected one after the other towards the ground at the contour edge of the downdraft. The entrainment of ambient air into the PV that leads the downdraft front, increases its size and negative buoyancy. The following vortical structures, named ‘trailing vortices’ in wind engineering terms, partly lose the contribution of entrainment of ambient air and are thus weaker. Upon reaching the surface, the vortical structure changes its travelling direction from vertical to horizontal and propagates radially. The strong vorticity inherent in the PV core produces the well-known nose-shaped profile with maximum horizontal velocities underneath the vortex, in the range of 50–120 m AGL, and decreasing velocities above [5,6]. Given the complexity of the flow, point measurements completely miss providing information on the physical interactions in the flow. Therefore, the spatial evolution of the outflow can be addressed only by integrating such measurements with advanced measuring techniques, such as new generation doppler radars or LiDAR profilers and scanners, which can provide a picture of the generated transient outflow field. However, the poor time resolution of measurements and technical issues that, for instance, prevent the instrument from acquiring useful information in rainy conditions [7] often limit the related investigations. The project THUNDERR [8] aims at tackling these shortcomings by means of advanced physical and numerical investigations that rely on a very large database of downburst measurements, mostly acquired in the context of the two European projects “Wind and Ports” (WP, 2009–2012) [9] and “Wind, Ports and Sea” (WPS, 2013–2015) [10].
Over the last years, several laboratories have emerged with the goal of reproducing the transient dynamics of downburst winds [11,12,13]. To date, the largest geometric scales to replicate downburst-like winds are achieved at the WindEEE Dome simulator at Western University in Canada [14]. The present experiments use the impinging jet (IJ) technique, widely adopted in the research community due to the simple mechanism of downburst-like flow generation, suitability to produce high wind speeds, easy scalability and capability to accurately replicate the vortex structures of real downbursts [12,13,15,16,17,18,19,20]. Nevertheless, the impinging jet approach cannot capture the buoyancy-driven nature of the phenomenon and thus partially misses the full physical representation of it. In this paper, however, the focus is on the characterization of the flow field in the first layers (order of hundred meters) of the atmospheric boundary layer (ABL) and, thus, the thermodynamic generated downdraft is reproduced mechanically to produce the mean and fluctuating components of the velocity field.
Thunderstorm winds are a non-linear superposition of processes at various scales, mainly described by three components: the DB wind, the background ABL flow, and the parent cloud translation. Little research has been conducted so far on how to properly account for these interactions. The non-linear interplay of the three effects is often neglected in literature or treated as the vector superposition in either analytical or numerical models [21,22,23,24]. The translation velocity of the thunderstorm cloud affects the intensity and direction of surface winds. Consequently, the resulting outflow assumes an elliptical shape with the intensification of the wind speed vectors on the downwind side and weakening on the upwind side [25,26]. Furthermore, the translating downburst system is always released into the already developed ABL flow characterized by pronounced wind shear and directional change with height, favorable for the development of thunderstorms [27].
The literature provides many studies on impinging jets through crossflows, but only very few apply to downburst winds [20]. The embedding of impinging jets in crossflows gives rise to three different flow regions: (1) The potential core zone, which is the closest area to the nozzle where the interaction between the two flows is only minor; (2) The zone of maximum deflection, characterized by high flow shear; and (3) the wall-jet zone, where the flow is far from the source and dissipates horizontally onto the surface. Under high jet-to-crossflow velocity ratios V j / U 0 and jet heights above the surface, typical of thermal and thermodynamic applications, a number of studies (e.g., [28,29,30]) have found that the interaction between the wall jet and the crossflow results in the formation of a ground vortex which wraps around the jet like a scarf and is highly dependent on V j / U 0 . The flow here resembles the horseshoe structure observed due to the deflection of a boundary layer by a solid obstacle despite its main origin being the upstream wall jet and not the crossflow. However, all these studies consider a jet-to-crossflow velocity ratio in the range V j / U 0 = 20 50 , which is much larger than what is experienced during a downburst event.
The interaction between impinging jet and crossflow has been addressed recently in relation to the superposition between DB and ABL winds. Mason et al. [31] numerically simulated stationary, tilted, and translating downdrafts in a calm environment and embedded in background winds, and used a sub-cloud model and a simplified cooling source to approximate the evaporative processes that trigger the formation of the phenomenon. The asymmetric outflow and the presence of environmental winds broke the formation and development of the secondary vortex (SV), which typically forms ahead of the PV and is observed in the case of the spatially stationary isolated downburst, and thus the associated lifting of a high wind-speed area at the boundary between inner and outer outflow regions [32].
Physical experiments on the interaction between downburst gust-fronts and ABL-like winds were recently performed by Richter et al. [33], who conducted experiments at the Laboratory of Building and Environmental Aerodynamics at the Karlsruhe Institute of Technology, Germany. The authors used both continuous (steady) and pulsed (non-steady) jets to simulate a down-gust immersed in ABL flow and impinging on a street canyon model. They found horizontal velocities aligned with the background flow exceeding those orthogonal to it by up to 77%. In the case of a pulsed jet, a ring vortex is formed ahead of the outflow, which, during its passage, produces peak velocities up to three times higher than those of the steady case. However, due to the nature of their experiments, the measured flow field was highly affected by the presence of the buildings and the orientation of the street canyon. Moreover, the small geometric scales involved in the study made the flow fields more representative of small-scale gusts rather than of downburst winds.
In this regard, the WindEEE Dome can also produce straight, and steady flows, such as ABL flows, that are representative of synoptic winds in nature. One of the advanced modes of WindEEE enables the simultaneous generation of DB-like impinging jets and ABL-like straight flows at large geometric scales, various Reynolds numbers, and momentum ratios of the two flows [20]. Romanic and Hangan [34,35] demonstrated that the simple superposition of flow fields as either vector or algebraic sum is physically wrong. Their study showed that the interaction between the two flows highly depends on the position in the outflow. For instance, analogous to the findings of Richter et al. [33], the combined DB and ABL outflow is stronger than the pure DB (without ABL wind) at the azimuth angle of 180° measured from the incoming ABL wind. In addition, at the front between DB and ABL and close to the undisturbed downdraft touchdown, the same sign vorticity between the primary vortex and ABL wind intensifies the wind in the upper regions of the vortex, which, in turn, are brought down following the vortex circulation. It follows that the associated radial velocities increase as well. The concordant vorticity between the counter-directed flows also elevates the vortex above the ground and, consequently, extends the high-velocity region below the vortex itself. This, in turn, returns quite clear nose-shaped velocity profiles. However, their roundness is more pronounced for the undisturbed downburst. The authors investigated only four radial positions, and they could not provide a detailed representation of the flow interaction at the interface between DB and ABL. This region is of major importance in wind engineering terms. The severe interaction between the two flows produces high flow-mixing and strong non-linearity of the wind field. Therefore, it is at least challenging to investigate and model the flow in this area with the perspective of characterizing the behavior of structures affected by the passage of the DB–ABL front. The present study attempts to answer these crucial points as it was never done before experimentally, and to describe the non-linear superposition of the two flows in the region subjected to their mutual interaction. The number of radial positions is here extended to 10, as well as the number of simultaneous along-height measurements, facing both the outflow and ABL directions, by deploying a larger number of Cobra probes. The evolution of the front between the two wind systems is here analyzed in detail and compared to the case of isolated DB discussed in Canepa [32]. One of the novel features of the WindEEE laboratory is the possibility to record the time of opening and closing of the bell mouth installed on the ceiling of the testing chamber or, in other words, the instant of jet releasement. Based on this, all signals across the chamber are synchronized to draw a detailed investigation of the spatial and temporal development of the phenomenon. This allows, on the one hand, to study the ensemble averages and variability of the test repetitions in a deterministic manner and, on the other hand, to eventually inspect the time scales of the experimentally produced downbursts, for instance, in terms of travelling time of the primary vortex leading the DB outflow. Furthermore, the abrupt changes in the flow features of wind profiles and turbulence fluctuations concurrently with the embedment of the DB into the ABL flow can be addressed in detail.
The rest of this manuscript develops in the following manner: Section 2 describes the WindEEE Dome, with a focus on the simultaneous generation of impinging jets and ABL flows, along with the experimental setup. The results of this study and their discussion are presented in Section 3. The transition of the outflow vertical profiles due to the combination of DB and ABL winds, as well as the evolution of the front between the two systems, are interpreted in terms of mean wind speed and turbulence intensity. The main findings of this research, along with the future steps to be presented in upcoming studies, are outlined in Section 4.

2. Experiment Setup

As mentioned in Section 1, in the framework of the project THUNDERR, a large experimental campaign was conducted at the WindEEE Dome, at Western University in Canada. The detailed description of the facility and the capability to produce large-scale non-stationary three-dimensional wind fields, such as downburst winds and tornadoes, are provided in [14], whereas Romanic et al. [20] previously analyzed a few combinations of DB-like impinging jets in ABL-like flows when produced simultaneously at the laboratory.
In the current study, the flow was analyzed with the use of high-sampling-rate sensors, i.e., Cobra probes, deployed in a three-dimensional grid of measurement positions (Section 2.2). This allowed for high spatial and temporal resolution in the near-surface region.

2.1. DB in ABL Mode and Flow Intensities

The impinging jet was created by running the six large upper-plenum fans of nominal power 220   kW . The upper plenum communicates with the main testing chamber through a bell mouth. In the first stage, the upper room is pressurized by keeping the louvers at the bell mouth in the closed position. Upon the sudden opening of the louvers, the pressure differential between the upper and testing chambers produces a dynamic impinging jet that travels downward and, upon hitting the chamber floor, expands radially. The diameter of the bell mouth, i.e., jet diameter, was D = 3.2   m in the current study. The WindEEE simulator can produce DB-like winds at large scales in the range of 1:100 to 1:500 [19,20,36] and different H / D ratios ( H = 3.8   m is the testing chamber height). In our experiments H / D = 1.2 for which the confinement effects in impinging jet applications are proven to be negligible [12,37]. Junayed et al. [19] tested different H / D ratios and demonstrated that the primary vortex leading the downburst outflow fully develops for H / D > 1 ; the corresponding vertical profiles have a pronounced “nose” shape and, overall, show better comparison with existing full-scale measurements.
In the present experiments, the DB wind was always embedded into the already developed ABL-like flow. This latter was produced by the 60 fans displaced in a matrix of four rows and 15 columns on one of the six peripheral walls of the hexagonal testing chamber, i.e., the “60-fan wall”. Conversely to classical boundary layer wind tunnels, where the ABL-like profile is naturally developed over the length of the tunnel, the WindEEE Dome mechanically reproduced the shape of the profile by differentially controlling the rpm configuration of the 60 fans. Figure 1 shows the schematic of the downburst in ABL wind mode at the WindEEE Dome. The different “flow intensities” are given in terms of the percentage of the nominal power per minute (% rpm) of the respective fans. With this nomenclature, the intensity of the six upper fans generating the impinging jet was set to 30%, referred as to IJ30 (impinging-jet-30), whereas the two homogeneous intensities of the 60 ABL-related fans were 20% and 30%, referred as to SF20 and SF30 (straight-flow-20 and 30). This latter setup choice was adopted to replicate the ratio between the peak and mean wind speed of respectively downburst and ABL outflows ( v DB , max / v ¯ A B L ), which, in nature, is usually found in between 3 and 5 [1,27,38]. The corresponding centroid jet velocities at the exit of the bell mouth can be found in [20]; the inclusion of the background wind produced the centroid jet velocity (SF30) to decrease to 11.8 m s−1 from that in the absence of background wind, 12.4 m s−1. Such variation is due to the nature of the closed-circuit simulator, which produced a momentum deficit in both flows when produced simultaneously. Instead, the jet velocity in the lower-ABL case (SF20) is not reported in Romanic et al., (2019). However, as the mean wind speed of SF20 was much lower compared to the SF30 case, the centroid jet velocity was not expected to change significantly compared to the base case without straight flow. The mean wind speeds of the ABL-like flow 3   m downstream of the 60-fan wall, and at z = 25   cm are 2.5 m s−1 and 3.9 m s−1 for the SF20 and SF30 cases, respectively. The two jet-to-crossflow velocity ratios were V jet / U 0 = 5.0 for IJ30-SF20 and V jet / U 0 = 3.0 for IJ30-SF30, respectively. Consistently with the literature on impinging jets in crossflow, the two cases were named DBABL5.0 and DBABL3.0 accordingly. The characteristic wind speeds involved in the experiments are summarized in Table 1. The Reynolds numbers involved in the experiments are provided in Table 2. Xu and Hangan [12] observed that for a Reynolds number Re > 1 × 10⁶, the flow can be considered as “fully turbulent”. The flows involved in the current experiments, with the characterizing parameters reported in Table 2, presented Re in this flow regime or slightly lower.

2.2. Cobra Probes Setup

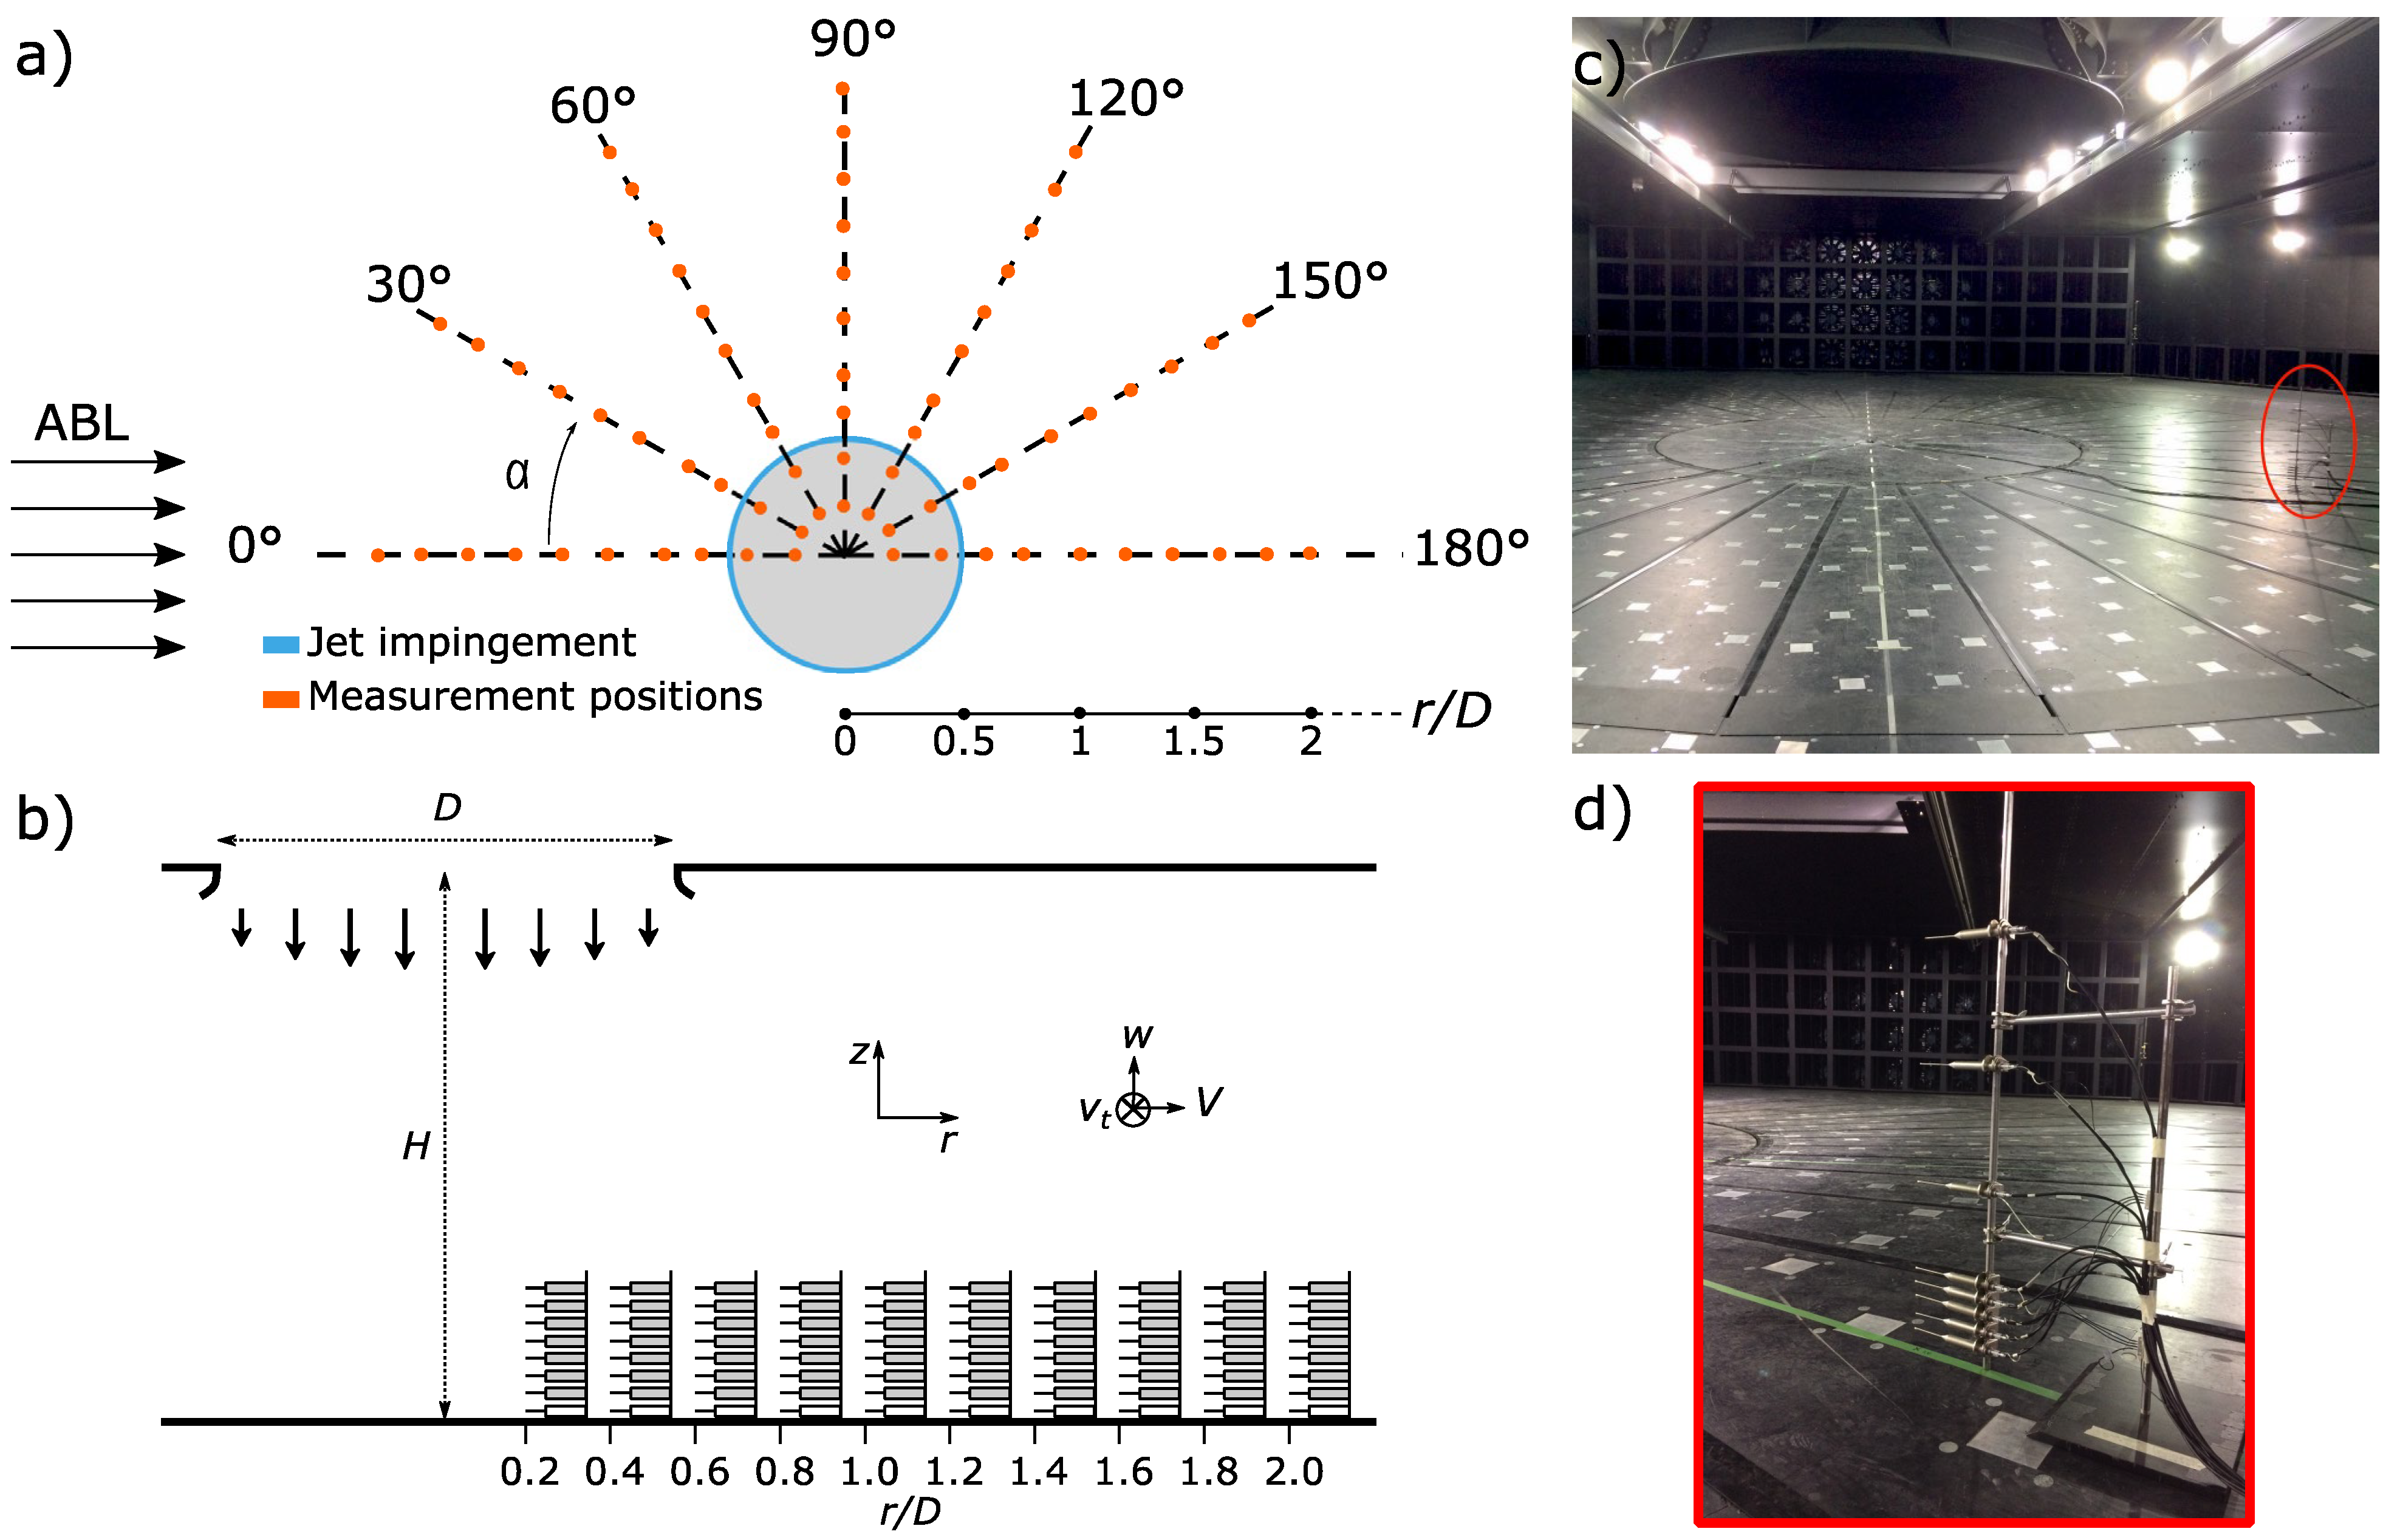
The flow field produced by the interaction between DB and ABL flows was measured at seven different azimuthal ( α ) and 10 radial ( r / D ) positions using Cobra probes mounted on a stiff mast that prevented vibrations of the instruments in the flow. Cobra probes are multi-hole pressure systems designed to resolve three components of velocity in real-time at a sampling frequency of f s = 2500   Hz . They acquire the incoming flow within a cone of ±45°. The reported accuracy of the probes is ±0.5 m s−1 and ±1° yaw and pitch angles up to approximately 30% of turbulence intensity. As shown in Section 3.6, only the peaks of turbulence intensity had a magnitude of about 30% for which the accuracy of velocity and inflow angle measurements may be slightly lower with respect to the values mentioned above. However, this did not have any remarkable impact on the reported results.
Measurement and instrumentation uncertainties are reported in Table 3. Due to their accuracy, all velocity measurements V < 1   m   s 1 were removed from the analyses. The α locations spanned a range from 0 ° , corresponding to the direction of the incoming background ABL flow, to 180 ° in a clockwise direction and with incremental steps Δ α = 30 ° . Due to the assumed symmetry of the flow, the results can be mirrored to the other half of the circle ( α = 180 ° ÷ 360 ° ). The radial measurement locations covered a range from 0.2 to 2.0 with increment Δ r / D = 0.2 ; r / D = 0 identifies the position of jet impingement at the ground. For the sake of precision, the radial location r / D = 0.8 was actually moved to r / D = 0.75 due to a small irregularity in the floor corresponding to the edge of the turntable, which coincides exactly with r / D = 0.8 , which did not allow for a proper positioning of the Cobra probe mast at that location.
For 30°   α 150°, eight Cobra probes were installed along the mast at heights z = 0.04 ,   0.07 ,   0.10 ,   0.125 ,   0.15 ,   0.30 ,   0.50 and 0. 70   m . Due to the tiny head (diameter 2.6 mm) of the Cobra probes deployed in the study and being 30 mm the minimum distance between two subsequent probes on the mast, the disturbance produced by the instrumentation itself on the recorded flow was negligible. Figure 2 shows the top (panel a) and side (panel b) view schematics of the experimental setup, along with a photograph of the testing chamber during the experiments at ( α = 0 ° , r / D = 1.4 ) (panel c) and a zoom-in on the Cobra probes’ mast (panel d). As highlighted in Figure 2b,d, in this configuration, all Cobra probes’ heads were oriented radially towards the downburst touchdown location identified by r / D = 0 . However, in addition to this and on the other side of the symmetry plane with respect to the direction of the incoming ABL wind, four Cobra probes (not shown here) were installed at heights of 0.04 ,   0.10 ,   0.30 and 0.50   m above the floor and pointed towards the 60-fan wall to measure the ABL component. For α = 0 ° and 180 ° , additional probes pointing to the DB touchdown were added at z = 0.20 and 0.40   m , as well as at z = 1.00   m for α = 180 ° . At this latter azimuthal location of measurement, all probes installed on the vertical mast also measured the ABL flow component, before the downburst-like onset, due to its coincident direction with the radial DB outflow. Conversely, no ABL flow measurements were taken at α = 0 ° where all probes faced the DB touchdown position r / D = 0 . Furthermore, at this location, the Cobra probe located at z = 0.50 m was removed from the analyses due to malfunctioning. In the following paragraphs, the results will be referred to radial and height locations normalized, respectively, by the diameter D = 3.2   m and z max = 0.10   m . This choice is convenient for comparing the outcomes of the present analyses with those for the isolated vertical-jet case [32]. For every ( α , r / D ) position, each experiment was repeated 10 times to inspect the repeatability of the tests and draw limited statistical analyses of the results. Therefore, the overall number of velocity records acquired in this set of experiments is 16,000 (2 velocity setups × 7 α   × 10 r / D × (9 to 12) probes × 10 repetitions).

2.3. ABL Vertical Profiles and DB–ABL Scaling Considerations

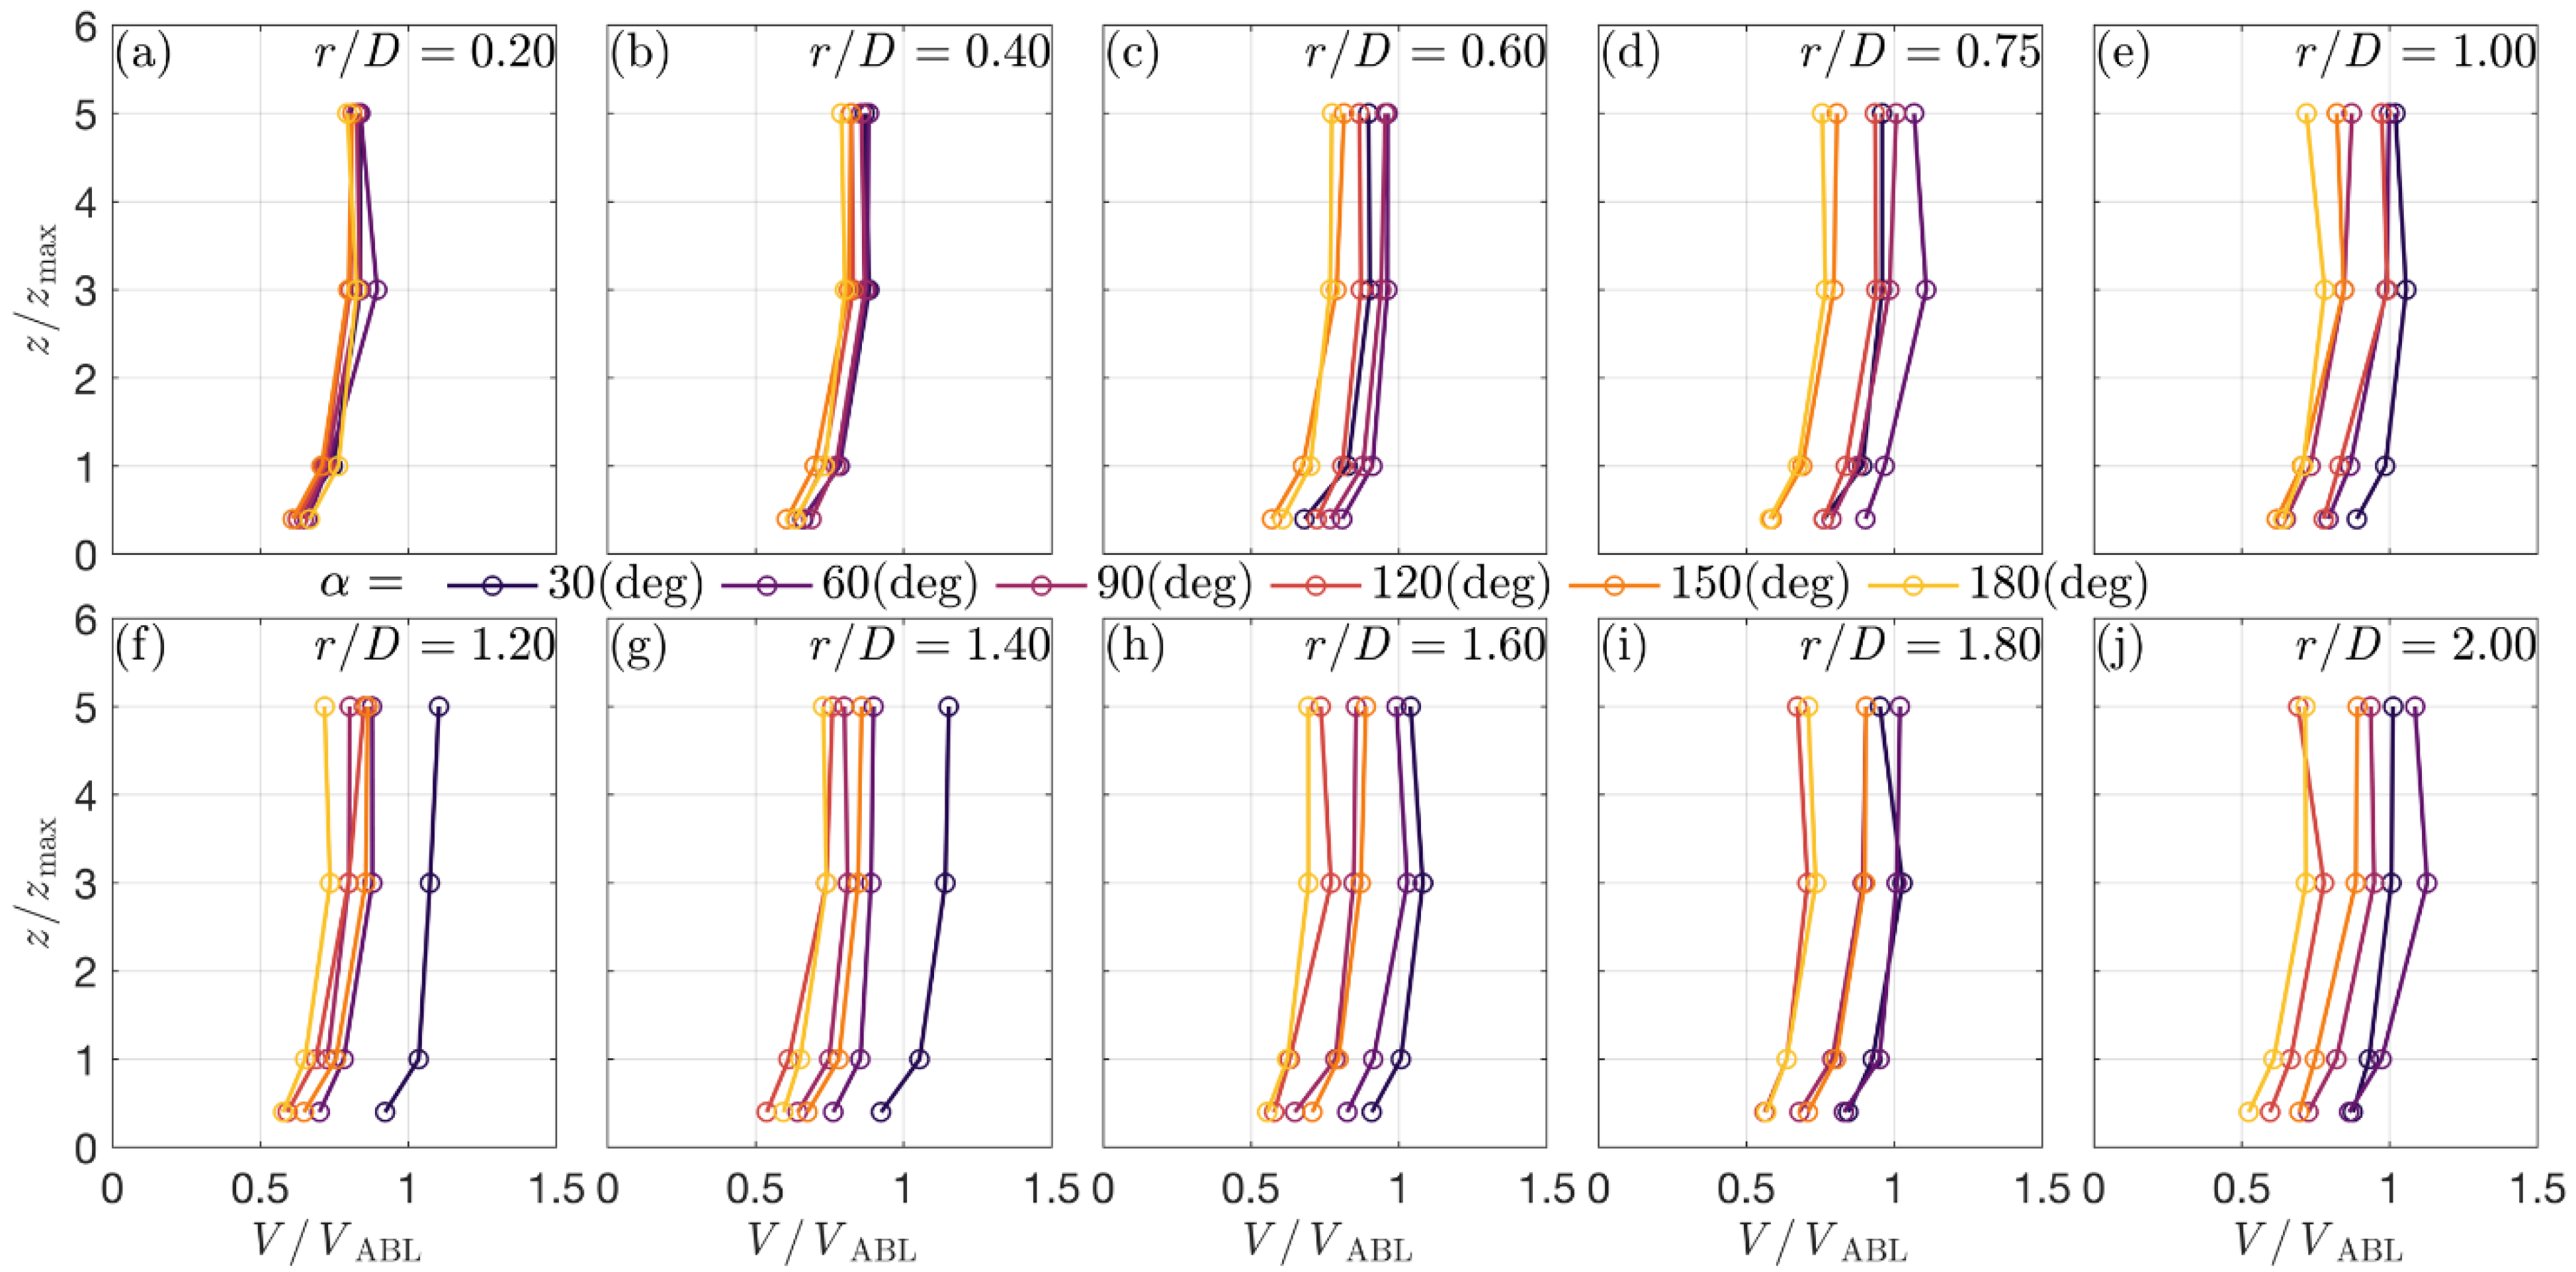
Figure 3 reports the vertical profile of the ABL-like wind speed at each measurement position in the horizontal plane (Figure 2). Here, the wind speed was averaged over the time interval preceding the release of the IJ corresponding to the ABL portion of the velocity signal. Differences are observed among the measured profiles; the wind speed tends to decrease by moving away from the outer section (60-fan wall) of the incoming ABL wind because of the loss of horizontal momentum of the flow itself and the widening of the chamber due to its hexagonal shape. The radial positions closer to the center of the jet impingement reasonably record similar wind speed profiles among the tested azimuth locations, while the deviation appears larger at further distances from the IJ touchdown because of the distance among the different azimuth lines increases.
Figure 3 shows that the ABL free-stream height z G , namely the top of the boundary layer, is reached approximately at z G , exp = 0.5 m or likely slightly above. In nature at full-scale (FS), z G , FS has the order of magnitude O (103) m. If we now consider the height of the primary vortex (PV) core as representative of the size of the downburst outflow, this is found to lay at z PV , exp = 0.6 0.8 m in the experimental measurements at WindEEE [19], while at z PV , FS = 700 1200 m in full-scale occurrences [6,39], which is again O (103) m. The respective surface layers related to the background ABL wind and to the downburst outflow thus appeared of comparable size both in nature and in their experimental modelling at the WindEEE Dome.

2.4. DB Vertical Profiles

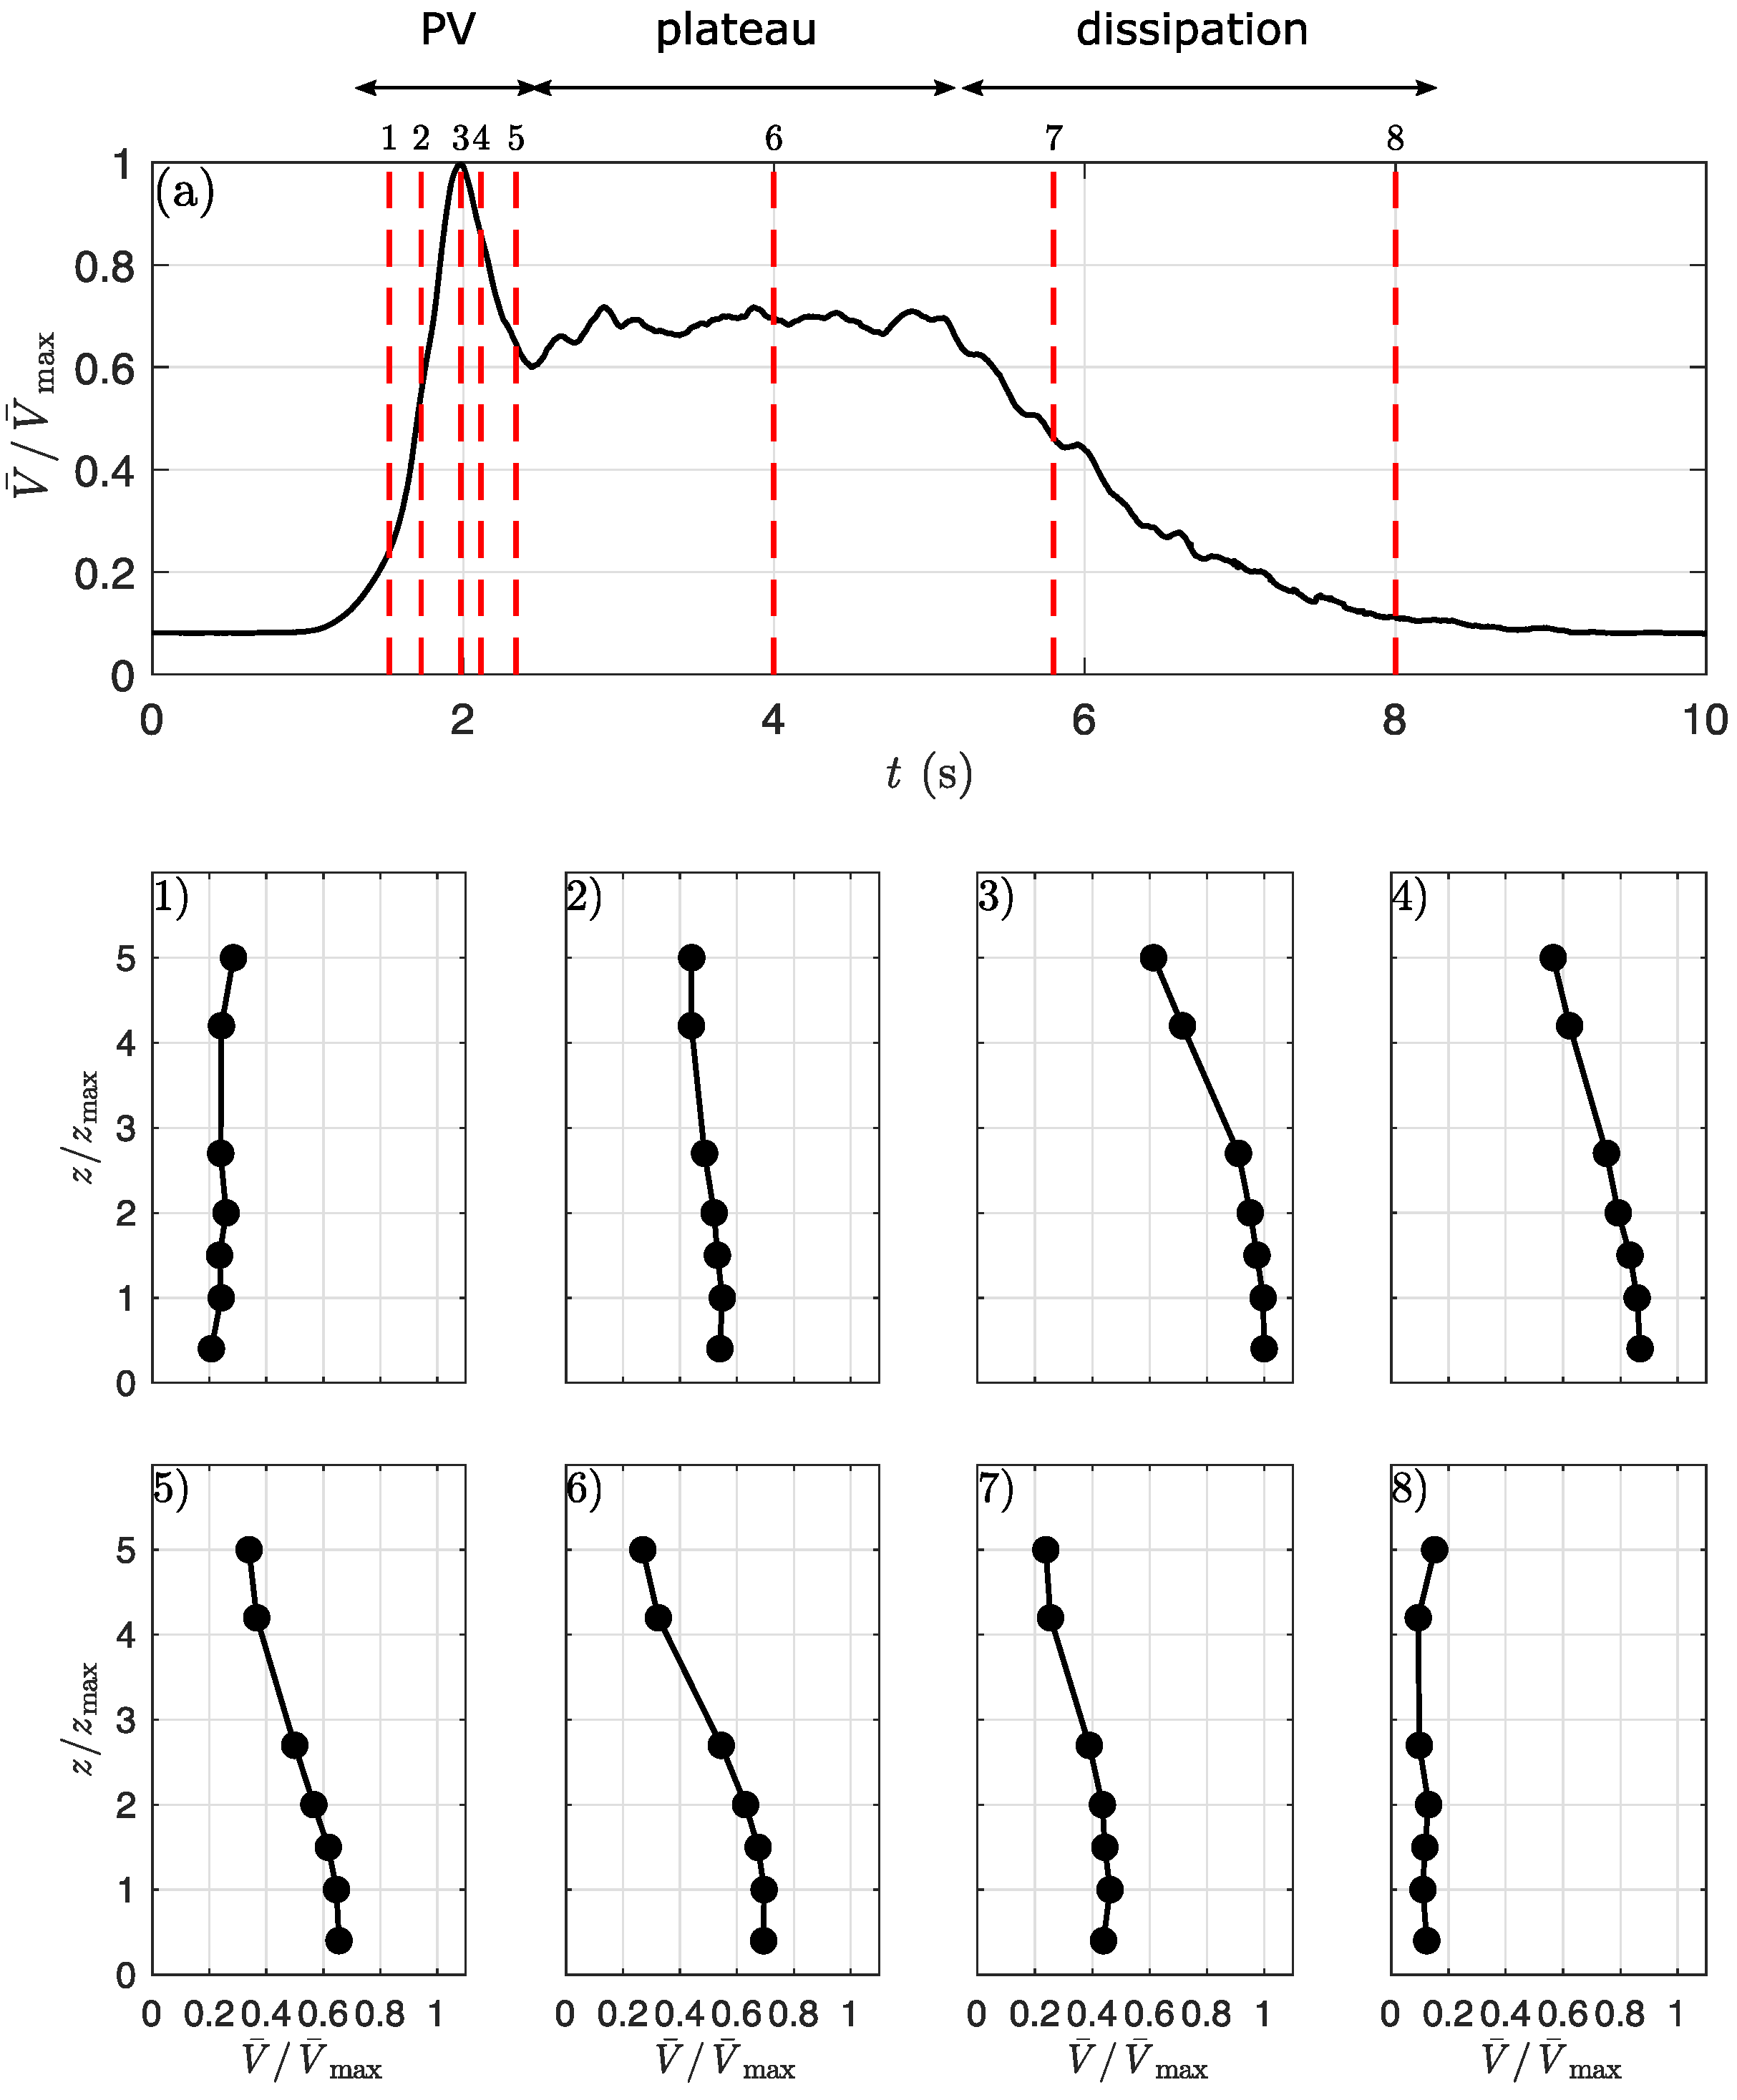
Figure 4 shows the slowly-varying mean wind speed (moving average window Δ t = 0.1 s) vertical profiles of the undisturbed DB-like wall jet, i.e., without the inclusion of ABL flow, at r / D = 1.0 and different time instants (see vertical dashed lines in Figure 4a). The data for the current analysis were extracted from a large dataset of velocity measurements on isolated DB-like impinging jets that were previously carried out at the WindEEE Dome [40]. Note that velocity measurements were taken only at α = 90 ° , assuming the radial symmetry of the horizontal outflow in the case of the undisturbed vertical impinging jet. Contrary to the ABL-like profiles (Figure 3), the DB profiles’ magnitudes appeared highly non-stationary during the time evolution of the phenomenon. The same holds for the profile shape, which varied quite largely from segment to segment of the velocity signal. During the ramp-up of the wind speed as the PV approached the instrument (time instants (1) and (2)), the profiles appeared rather straight in their vertical development with velocity magnitudes that varied little among the measurement heights. At the time of the peak and during the plateau segment of the wind speed (time instants (3) to (6)), the vertical profile assumed a clear, nose-like shape with maxima at the lowest heights due to the recording of the PV and following trailing vortices. When the phenomenon dissipated and wind speeds gradually returned to near-zero values (time instants (7) and (8)), the velocity profile again seemed to be more uniform along the vertical.

3. Results and Discussion

This section analyzes the effects of the interaction between the produced DB and ABL winds. Upon the bell mouth opening, the descending jet embedded into the background flow (Section 2.1), which deflected the jet and distorted the natural radial expansion of the outflow generated upon the impingement. Section 3.1 focuses on the wind-speed time histories recorded at different measurement positions in the flow field by the Cobra probes. Section 3.2 reconstructs the resulting downburst outflows on both the horizontal and vertical plane. The spatiotemporal evolution of the front between the two flows is analyzed with regard to the Cobra probe measurements in Section 3.3. The propagation of PV in the radial and the azimuthal plane is investigated in Section 3.4 by tracking its convective velocity thanks to the new synchronization system at the WindEEE Dome. Section 3.5 analyzes the rapid transition of the outflow vertical profiles and the effects produced by their embedding into the background wind. Finally, Section 3.6 discusses the main turbulence properties of the reproduced DB outflows, their time correlation with the evolution of the wind speed and variation along the vertical profile.
For the sake of simplicity, the results presented in this paper will be mainly referred to two spatial areas corresponding to the frontal region ( α = 0 ° : 90 ° ) and to the rear region ( α = 90 ° : 180 ° ), following the frontal and rear interaction between the ABL and the DB and characterized by opposite and equally directed DB and ABL winds, respectively. Unless otherwise specified, the analyses reported hereafter will refer to the radial component of the wind speed V (Figure 2b).

3.1. Wind Speed Time Histories

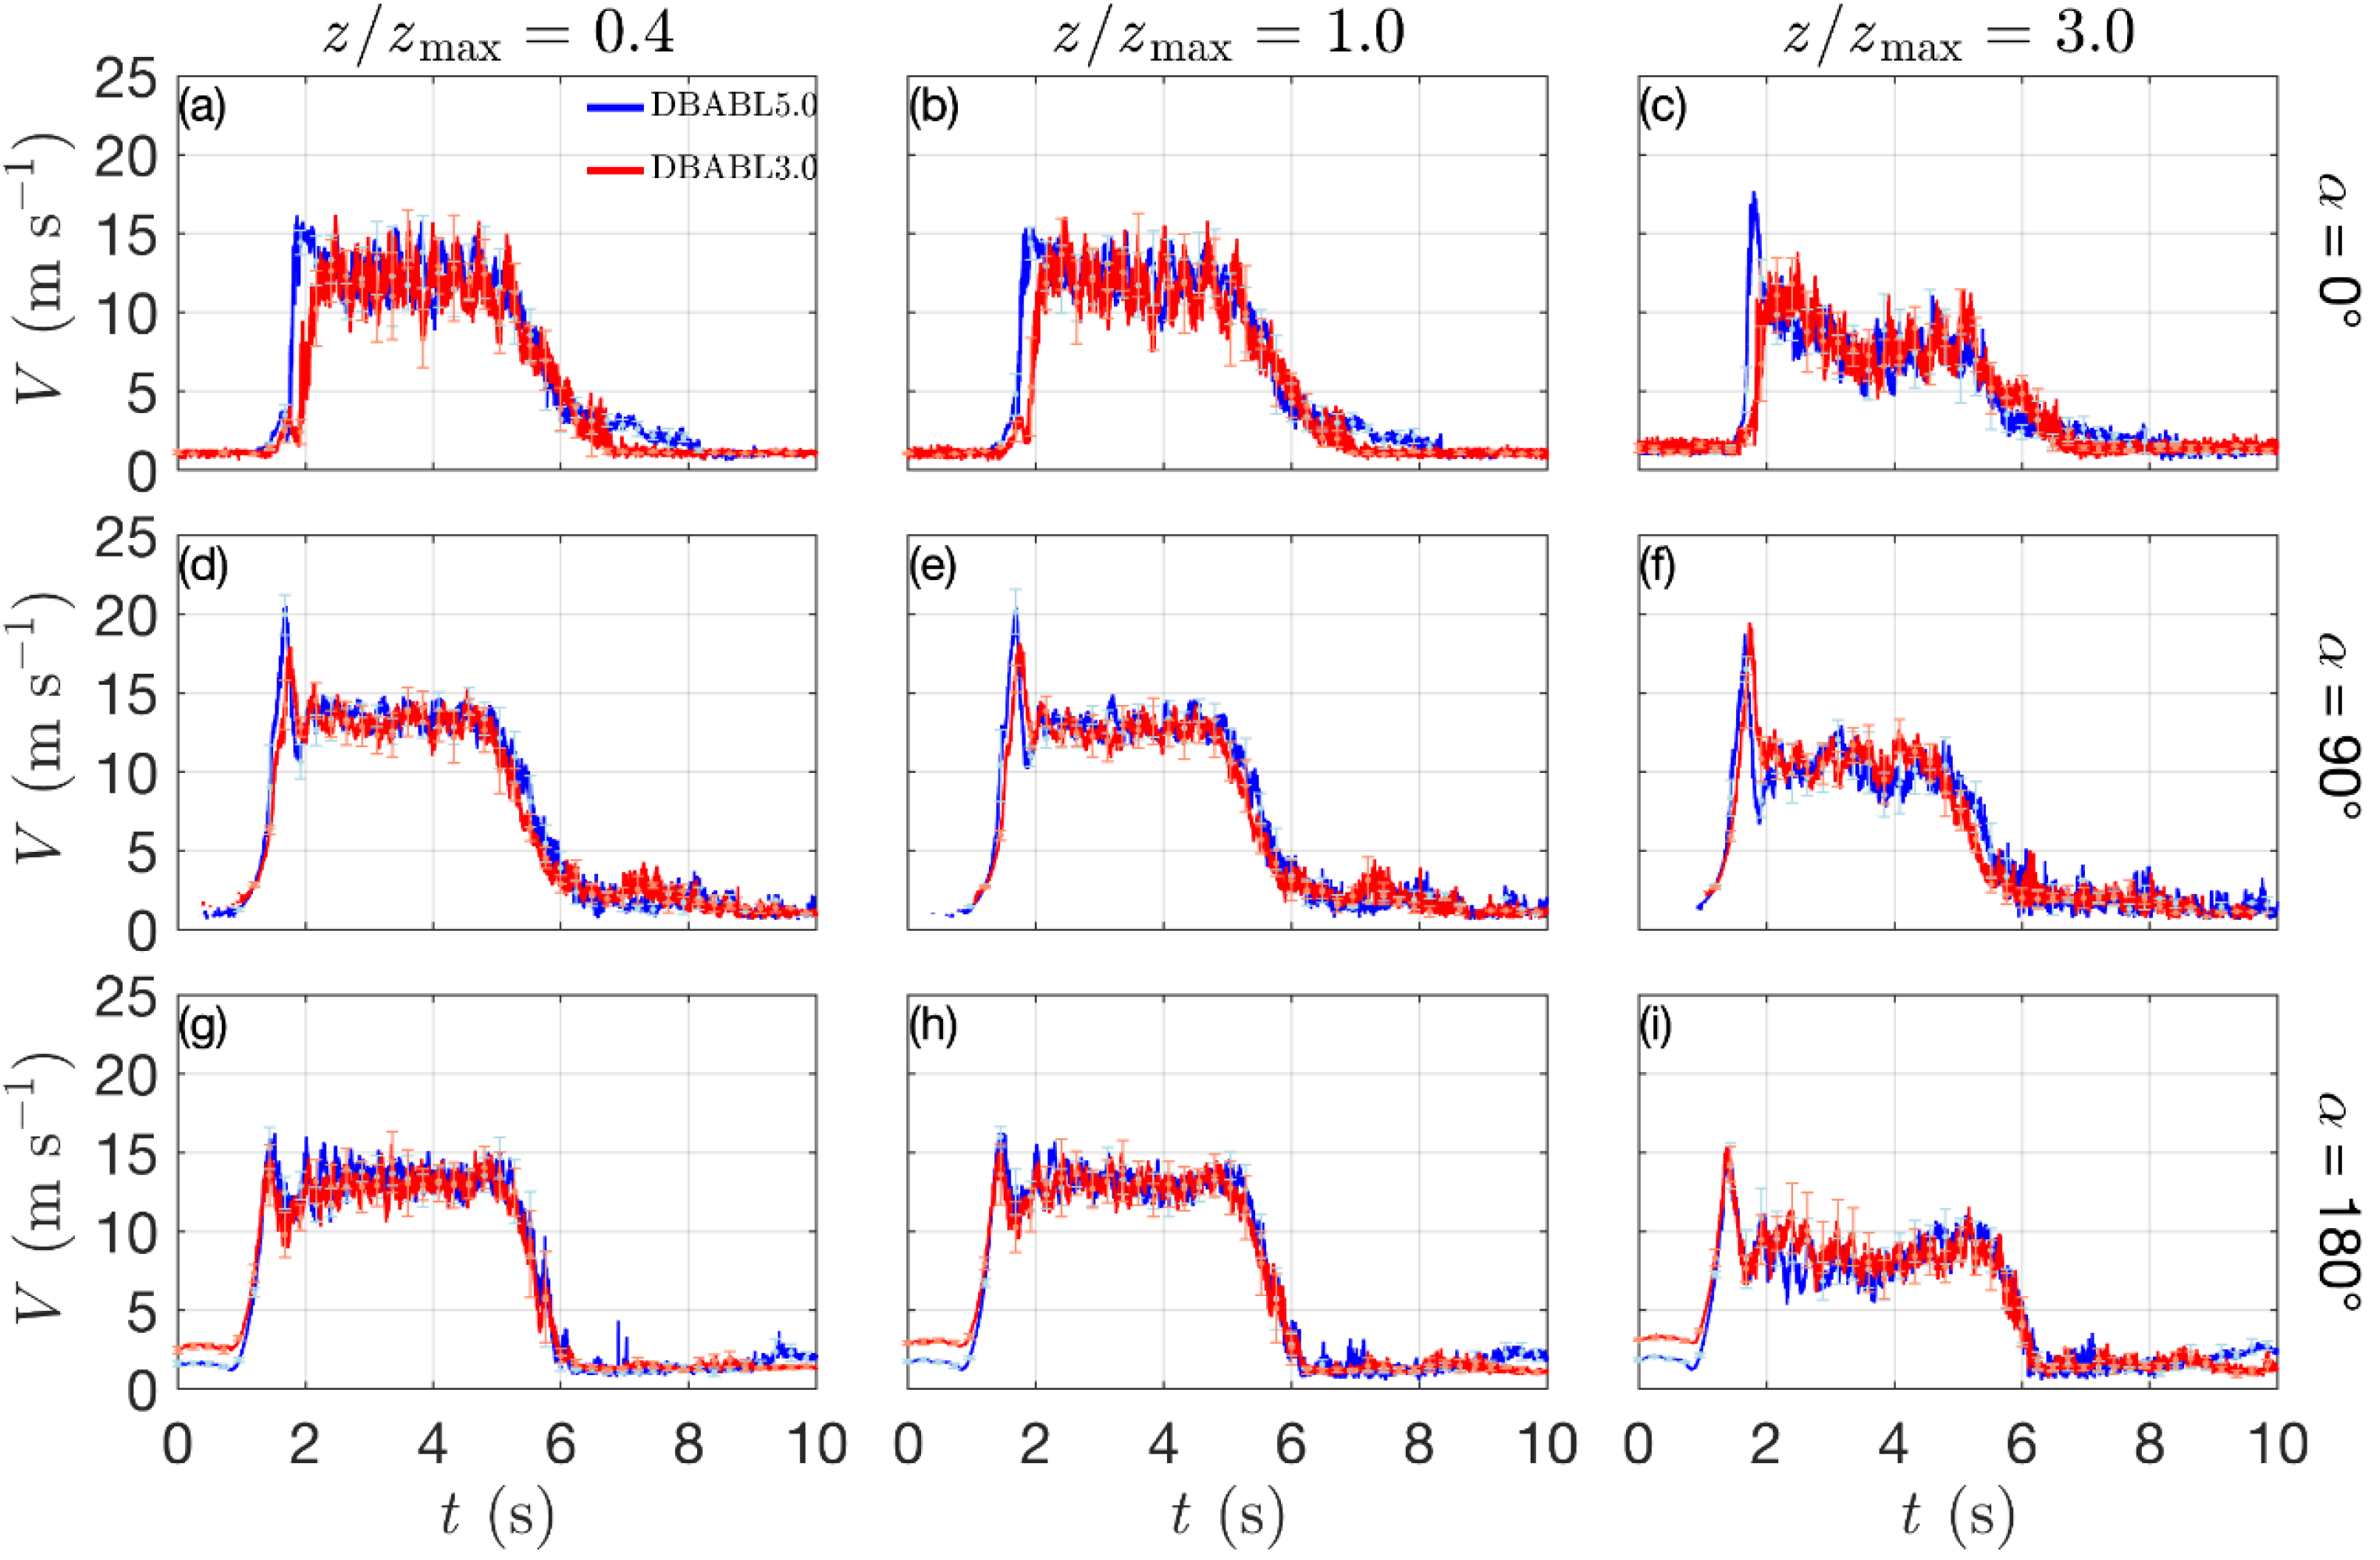
Figure 5 shows the radial wind speed V time series at r / D = 1.0 , three different z / z max as well as α measurement positions. The diagrams are shown in terms of ensemble means (thick lines) and variability (error bars) of the related 10 repetitions. The number of experimental repetitions performed may not be sufficient to thoroughly describe the standard deviation of the experiments, whereas the mean part of the wind speed signals seems well modeled, and the deterministic features of the downburst outflows are depicted. However, an extension of repetition numbers would have overly increased the costs and duration of the experimental campaign.
The maximum wind speeds are observed close to the surface at z / z max = 0.4 and 1.0 with no significant differences, while a relevant wind speed decrease occurs above at z / z max = 3.0 . This confirms what was observed in other experiments (see, for instance, [19,32,35]) and resembles the nose-like shape profile typical of full-scale downburst events [5,6,7,41]. The tip of the nose-shaped profile, namely the vertical region where maximum wind speeds are observed, appears to extend up to at least z / z max = 1.0 . As widely discussed later in this paper, the PV, during its passage over the measuring instrument, squeezed the flow underneath its structure, causing its intensification at the boundary between the vortex’s lower end and the surface. At the higher measurement elevations that were inside the vortical structure, the flow did not benefit from the same speed-up effect. This flow pattern gave rise to the well-known nose-like shape of the downburst vertical profile. When the DB was simulated without the inclusion of the ABL flow, Canepa [32] showed that each experimental DB-like signal contained three different time phases (Figure 4a) in analogy to what is observed in real downburst events (e.g., [2,21,27]): (1) PV phase, associated with the passage of the primary vortex PV by the Cobra probe and, in turn, containing (1.1) the velocity ramp-up–PV approaching the instrument, (1.2) the velocity peak–PV just passed over the instrument [6,19,42], and (1.3) the ramp-down of the wind speed–PV moves away from the Cobra probe; (2) plateau phase, namely a steady-state condition of the wind speed signal characterized by ensemble velocities rather constant in time; (3) dissipation stage, corresponding to when the downburst system moves away from the instrument or dissipates, and wind speeds gradually return to near-zero values. However, the three different stages were not clearly detectable anywhere in the spatial field when the DB outflow was embedded in the ABL flow. The azimuth location α = 90 ° (panels d–f) was perpendicular to the direction of the incoming background flow, and the wind speed records here are those apparently less affected by the interaction between the two flows. Consequently, the three phases of the DB-like outflow were well retained, and the variability of the repetitions seemed rather limited. The wind speeds here were of comparable magnitude among the three heights, with the exception of the velocity plateau stage at z / z max = 3.0 , weaker because of the flattening of the vertical profiles at those heights [32]. Furthermore, the peak wind speeds here were clearly higher with respect to the other two azimuth locations. At α = 0 ° (frontal region; panels a–c), the head-on collision between the two flows provoked high mixing. Consequently, the peak stage of the wind speed did not appear as pronounced as in the pure DB-like environment but rather more time-shifted to smoothly merge in the plateau phase. Indeed, the wind speed slowdown after the peak was practically absent. This is clearly visible in the case of DBABL3.0 and even enhanced by the comparison with DBABL5.0, where the weaker background flow did not affect the outflow in same proportions. This suggests that the DB front in the case of DBABL3.0 was stopped by the opposite approaching ABL-like wind around r / D = 1.0 , which is closer to the DB touchdown with respect to DBABL5.0, corroborating the observations provided by Romanic and Hangan [35]. However, in their study, the authors adopted a weaker jet velocity, and thus a lower jet-to-crossflow velocity ratio that corresponds approximately to DBABL2.2 in our notation. Interestingly, the case of DBABL5.0 shows at z / z max = 3.0 an ensemble peak wind speed of about 2   m   s 1 higher than that at the lower two heights. Similar behavior is observed at α = 90 ° for the case of DBABL3.0. This suggests that the vortex was lifted up by the counter-directed ABL wind in this region [35], provoking maximum velocities still underneath the PV structure but at higher heights; the next sections will discuss this aspect in detail.
At α = 180 ° (rear region; panels g–i) where the DB-like outflow and background ABL wind pointed in the same direction, the wind speed peak was of comparable magnitude to that of the plateau stage. At the higher heights, in fact, the ABL-like flow did not collide against the counter-propagating low-level downburst outflow in the frontal region, but it rather hit the descending jet, causing its deflection in the rear region towards α = 180 ° , as explained in the following sections. The stretching and deepening of the outflow in the rear region was already observed in the numerical simulations by Mason et al. [31] and in the experiments by Romanic and Hangan [35]. Consequently, the development of the PV and the related wind speed peaks were somehow only appreciable starting from r / D = 1.2 (not shown here). However, the steady-state wind speed in the plateau stage does not show any relevant change with respect to that at α = 90 ° . This manuscript will later interpret the influence of the ABL on the produced DB-like outflow based on the mutual direction of the two flows.

3.2. Spatial Reconstruction of the Wind Field

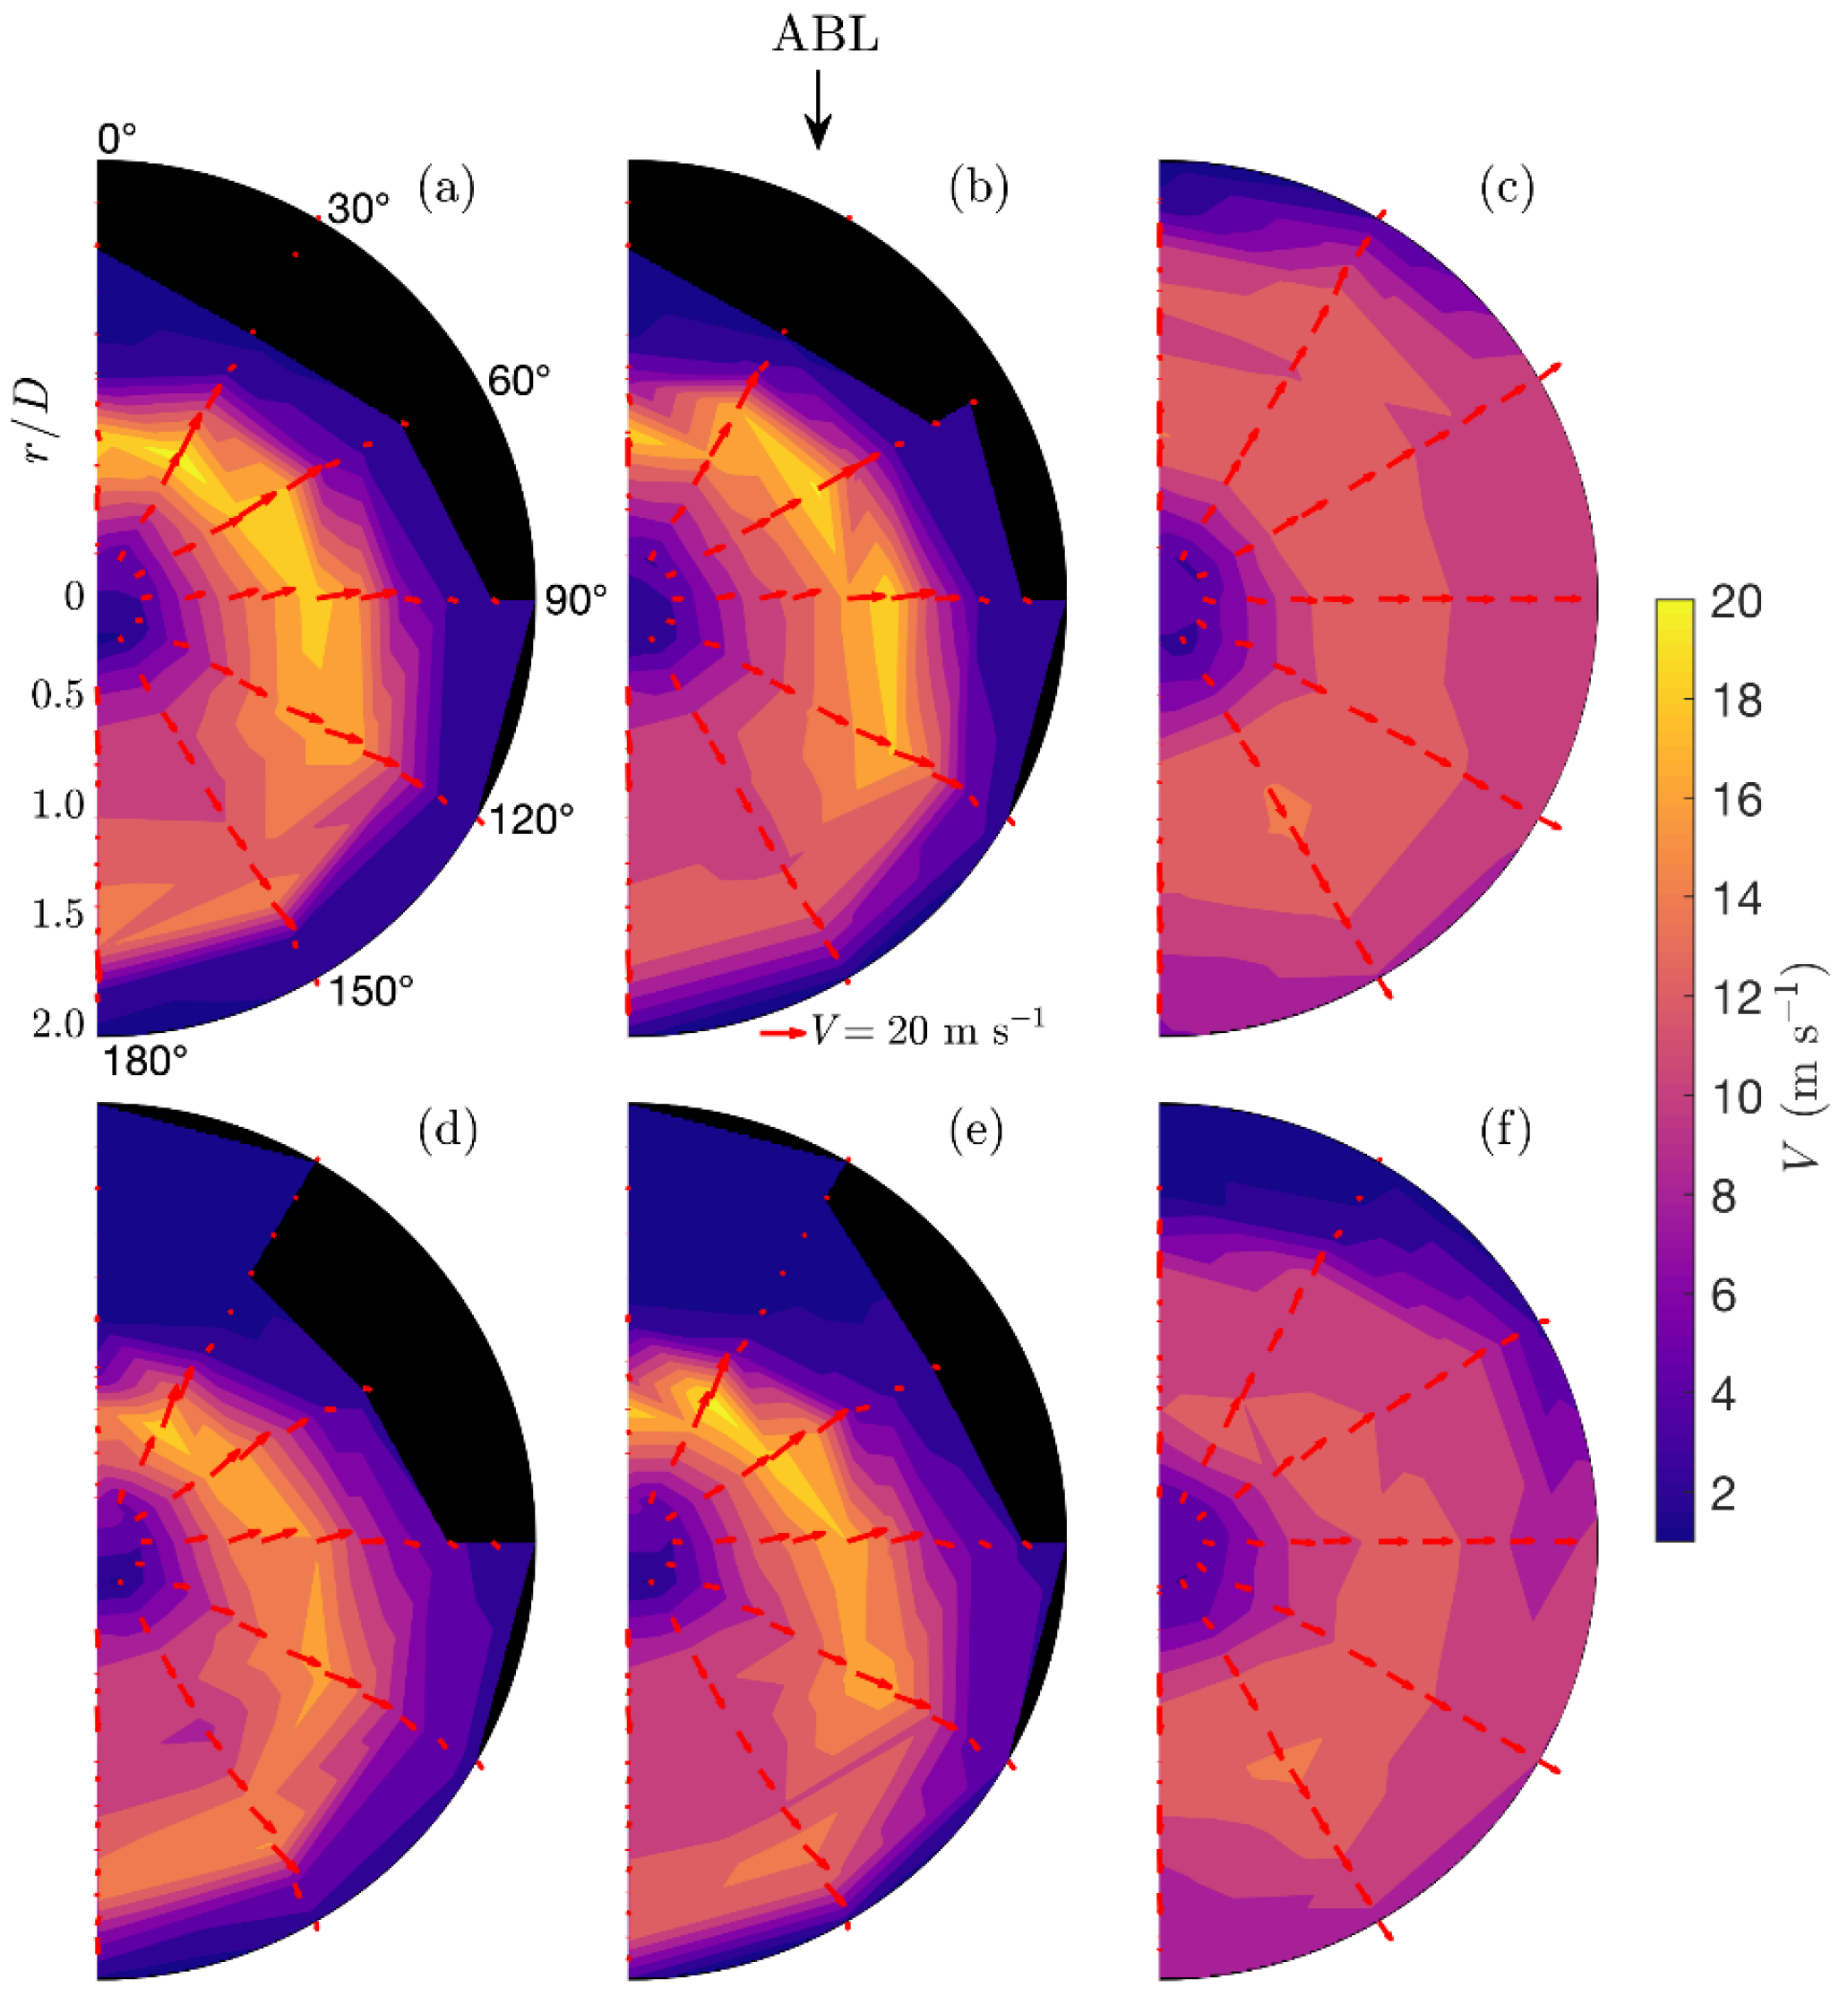
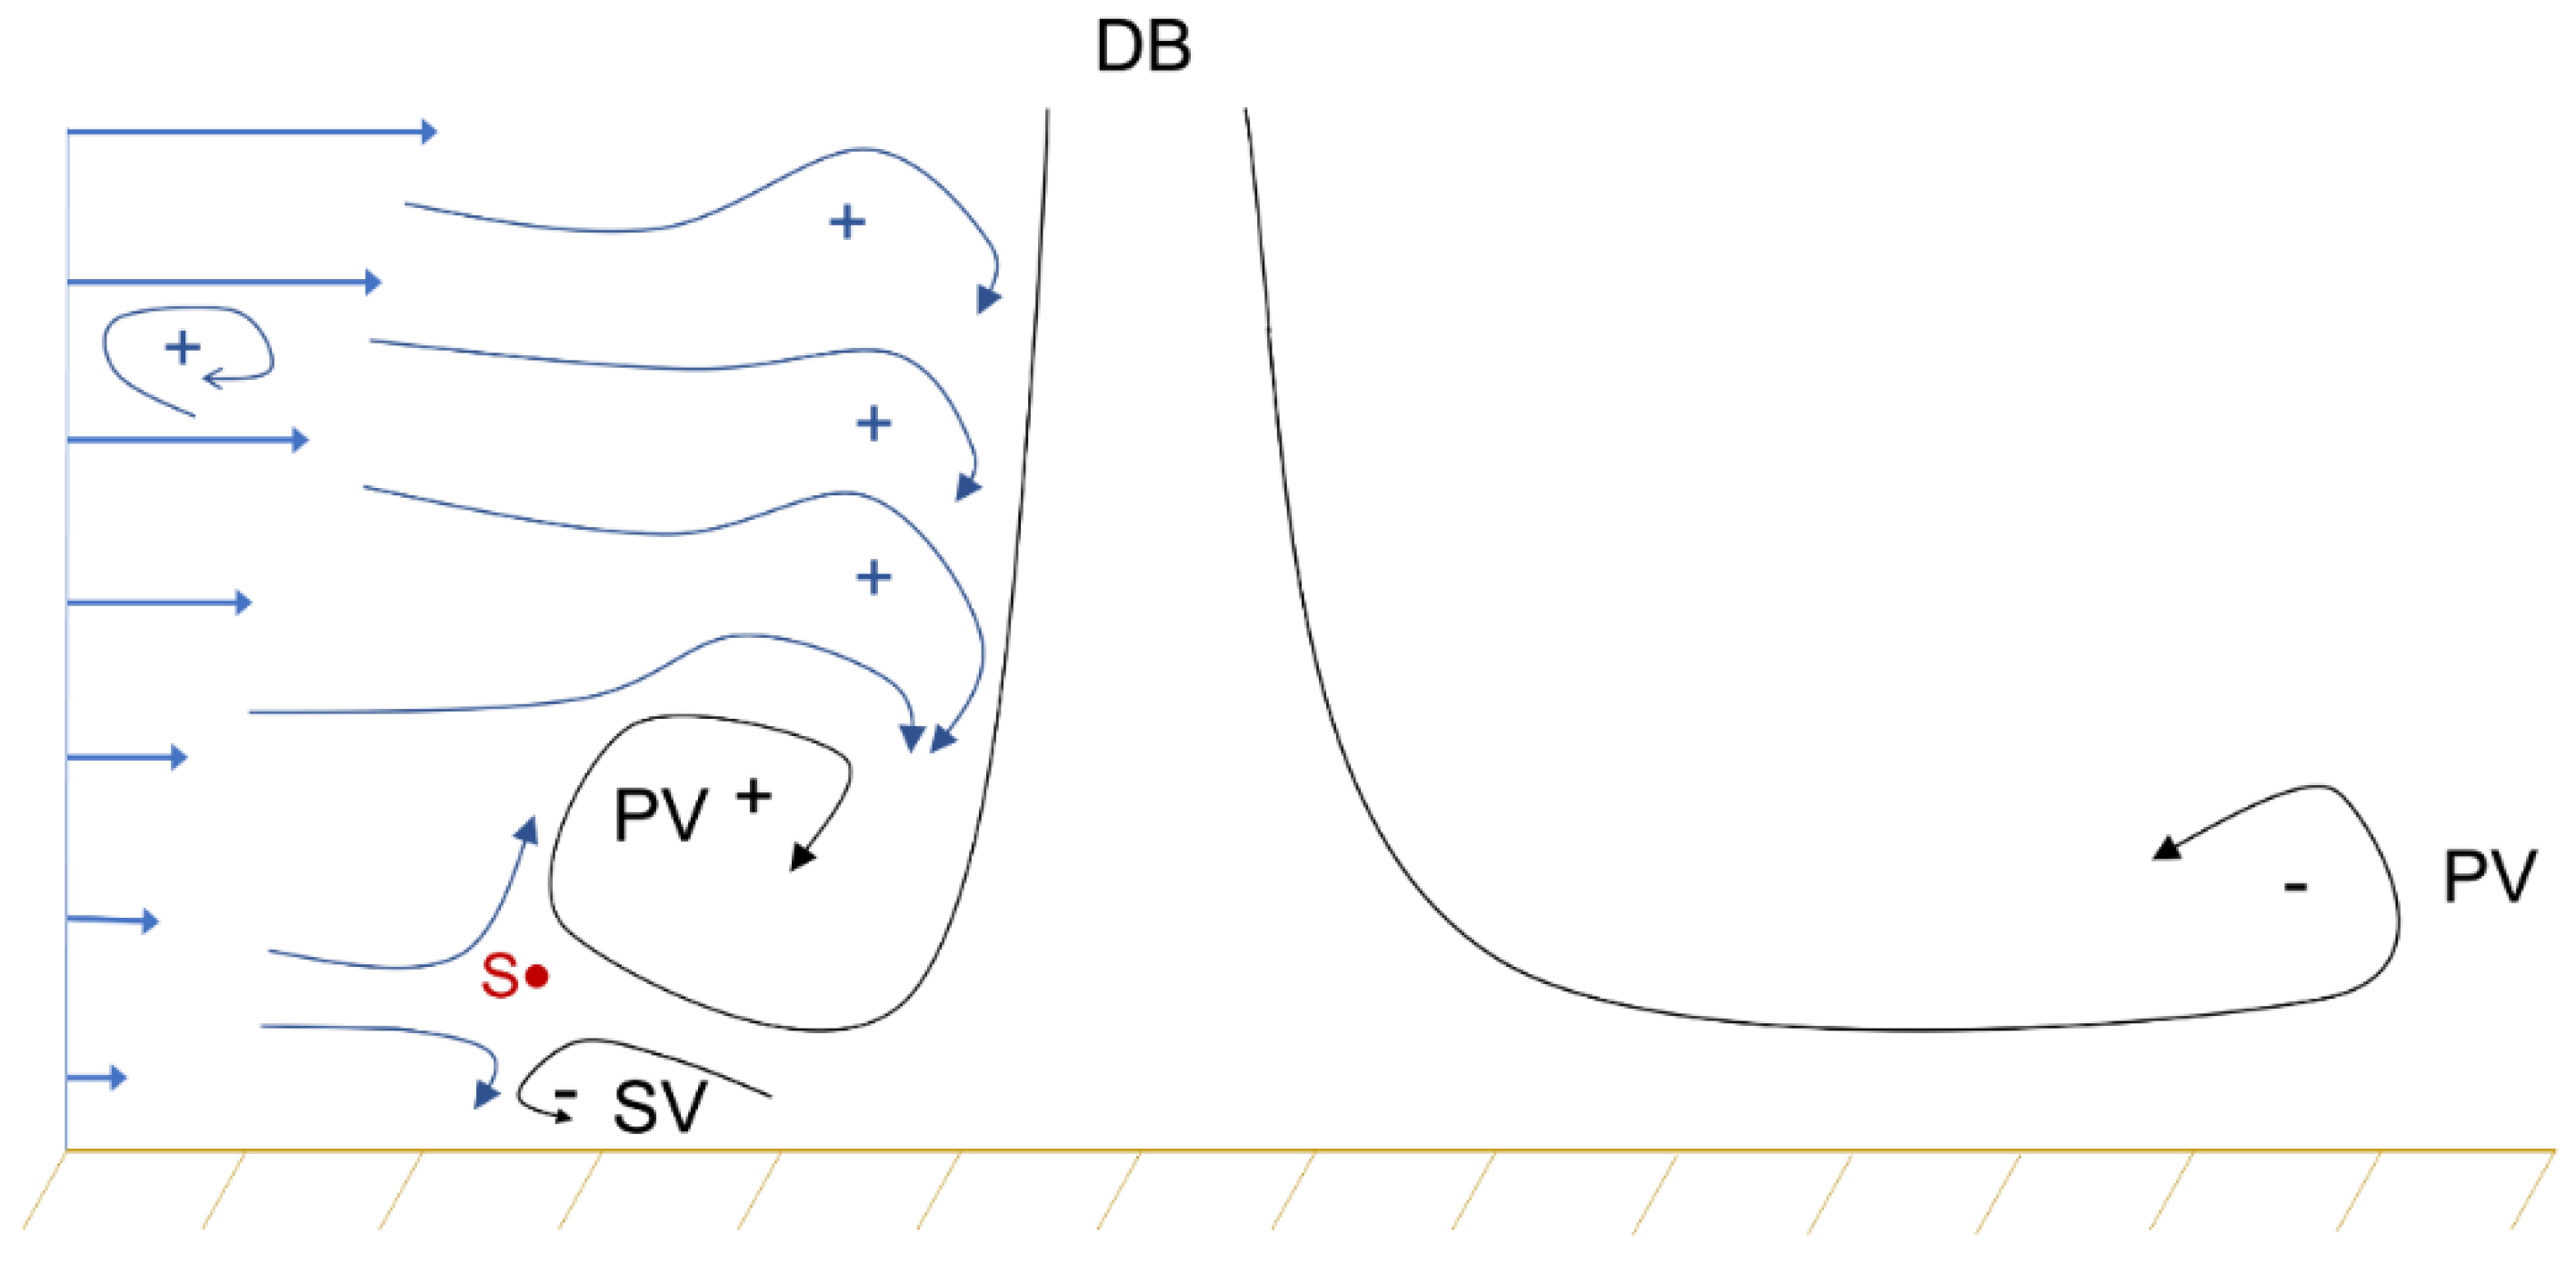
Figure 6 shows the downburst outflow field at z / z max = 1.0 and three different time frames on the horizontal plane r α : (1) t = 1.67   s (Figure 6a,d)—namely the time occurrence of the absolute maximum of the slowly-varying mean wind speed V ¯ max among all α and r / D positions in the case of DBABL5.0; (2) t = 1.74   s (Figure 6b,e)—same as (1) but in the case of DBABL3.0; (3) t = 2.88   s (Figure 6c,f)—generic time during the plateau phase. t = 0   s corresponded to the instant of the opening of the nozzle releasing the jet. The radial symmetry, characteristic of the isolated DB flow [32], appears here distorted. This is very clear in the two scenarios shortly after the jet impingement (panels a,d and b,e), where the outflow results hindered by the opposite directed ABL-like flow in the frontal region, while it expanded further in the rear region, where the two flows pointed in the same direction. In terms of wind speed, both cases showed the occurrence of V ¯ max at α = 30 ° and r / D = 0.75 with very similar magnitudes of 21.2 m s−1 for DBABL5.0 and 21.0 m s−1 for DBABL3.0. Also supported by recent and parallel CFD simulations reproducing the same experimental conditions at the WindEEE Dome, as well as by the recent study of Romanic and Hangan [35], we believe that the occurrence of the wind speed maxima in the region where the incoming ABL wind opposed the downburst outflow may be explained as schematically outlined in Figure 7: due to the same relative circulation (i.e., same vorticity sign) in the frontal region, the radially-outgoing downburst PV entrains the counter-directed ABL wind. Figure 7 shows that the ABL winds are ingested into the PV. This intensifies the flow in the PV and the winds near the surface [35], as schematized in Figure 7. The augmented velocity in the PV produces an intensification of the maximum radial wind speeds in the lower regions of the vortex. We speculate that the lower part of the ABL wind clashes with the counter-directed DB outflow underneath the PV and a critical point S forms (Figure 7). The SV, which forms ahead of the radially advancing PV and has an opposite circulation, may form underneath this point and is squeezed to the ground under the leading edge of the outgoing PV. For this reason, it has limited interaction with the counter-directed ABL. However, Mason et al. [31] inferred that the asymmetric outflow and the presence of background ABL wind may break the formation of the SV.
The PV structure appears deteriorated for r / D > 1.0 and so the related maximum in the wind speed time histories. It follows that the PV likely remains in a “locked-in” regime around r / D = 1.0 , which explains the maximum radial wind speeds experienced at r / D = 0.75 , behind the actual vortex location, as found by Hjelmfelt [6] and Junayed et al. [19]. Despite V ¯ max occurs at the same location for the two cases, a short time delay ( Δ t = 0.07   s ) between them is noticed. Accordingly, the comparison between panel (a) and (d) as well as panel (b) and (e) shows a radial shift Δ r / D between the location reached by the primary vortex when opposed by two different-intensity ABL flows. Analogous but reverse reasoning can be addressed to the rear region of measurements, where at both times (panels a,d and b,e) the outflow reached further radial locations in the case DBABL3.0. This is due to the stronger ABL flow causing a shift of the touchdown center beyond r / D = 0 and of the overall radial outflow in the direction of α = 180 ° [29,30]. Panel (f) shows that the radial symmetry is also not yet achieved during the plateau segment of the wind speed.
Figure 8 shows the flow vortex dynamics in the r z plane. The flow field is shown only at time t = 1.74   s (Figure 6b,e) and at the three different azimuths α = 0 ° ,   90 ° and 180 ° . Similar to what was observed in Figure 6, the outflow reaches radially outwards by moving from the frontal to the rear region, i.e., from α = 0 ° to 180 ° . To summarize the overall DB–ABL wind interaction, the PV was compressed at the front between the two flows (frontal region), while it was elongated in the rear region where the two flows had same direction. At α = 90 ° the flow presents similar features to the isolated vertical DB.
The wind speed vectors in Figure 8, identifying the Cobra probe measurement locations, clearly depict the descending jet and the passage of the PV. In fact, we observed the respective downward and upward components of the annular vortex right before and after the recording of the maximum radial wind speed [7,32]. This was only partly observed at α = 180 ° where the reverse flow component above the vortex does not overcome the presence of ABL-like wind [31], particularly in the case of stronger ABL-like wind DBABL3.0. Ahead of the outflow front, where the vortex had not yet passed, the flow had near-zero velocities or was slightly positive due to the air being pushed outwards by the expanding outflow.

3.3. Gust Front Evolution

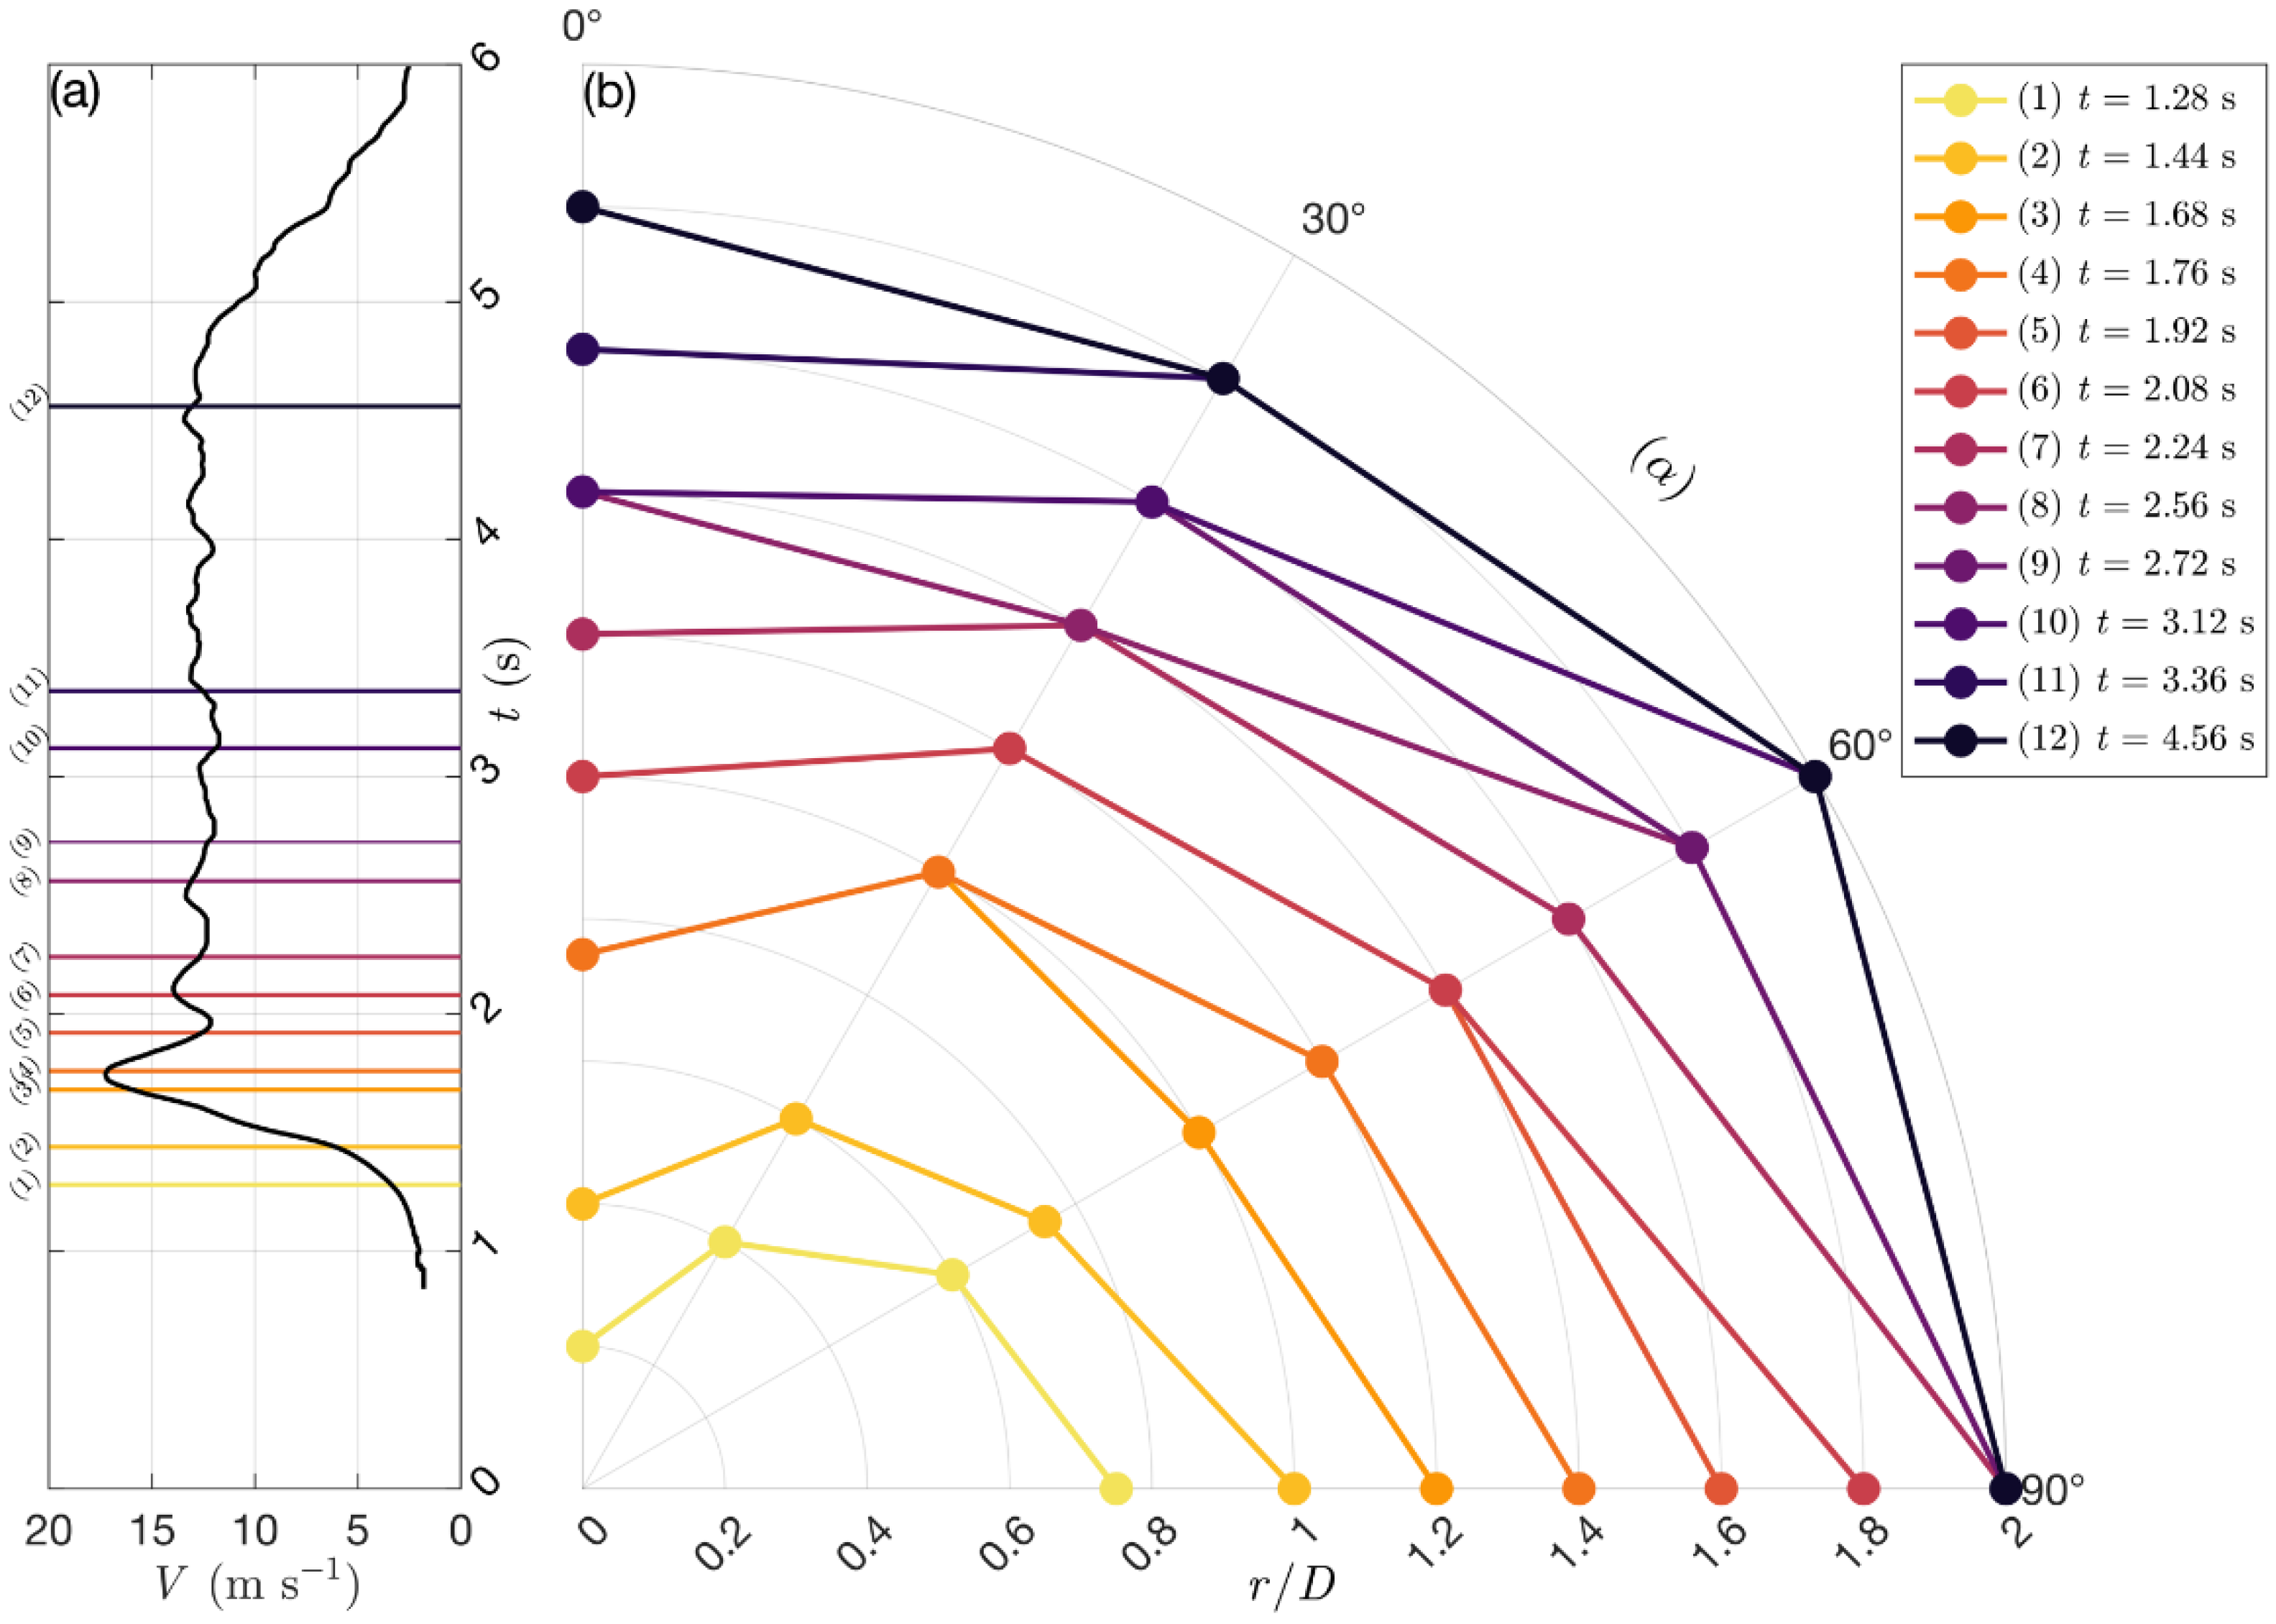
Figure 9b depicts the frontal region of the outflow at z / z max = 1.0 , namely the region subjected to the front between DB and ABL flows. Each colored line in panel (b) refers to a specific instant in time (see panel a) and is based on four observations, one per azimuthal location. Each observation identifies the first radial position r / D (from r / D = 0.2 ) at which the wind speed decreased 30% or more with respect to the wind speed at the previous α and the same r / D . If the DB outflow was not confined by the oppositely directed ABL, the wind speed at a given time and r / D would be identical across the α locations, which implies a radial symmetric outflow. At the front DB–ABL, the momentum of the two flows changed from horizontal to vertical, and the radial wind speed V decreased accordingly. The analysis is developed in a counterclockwise direction starting from α = 90 ° , which is the azimuthal reference location where the outflow is ideally perpendicular to ABL and hence not relevantly affected by it. The threshold of 30% was chosen arbitrarily based on the subjective judgment that this percentual reduction of wind speed may be indicative of the onset of the front DB–ABL. Therefore, Figure 9 highlights the 2D time-evolving asymmetric nature of the DB outflow when produced in combination with the ABL flow.
The interaction appears to weaken as we move forward in time. During the PV segment (corresponding to t = 1.68, 1.76 s), the curves show a change with respect to the radial symmetry. The decrease of wind speed for 30% or more between subsequent azimuthal locations occurs radially closer and closer to the ideal touchdown position r / D = 0 by moving counterclockwise towards α = 0 ° , in analogy to what was observed in Figure 6. During the plateau of the wind speed signal and spatially far from the touchdown position, the 30% wind speed decrease often occurs at the same radial location between subsequent azimuths. This implies that during the plateau, the radial symmetry is retrieved as the outflow has mostly overcome the influence of the opposed ABL flow and can expand.
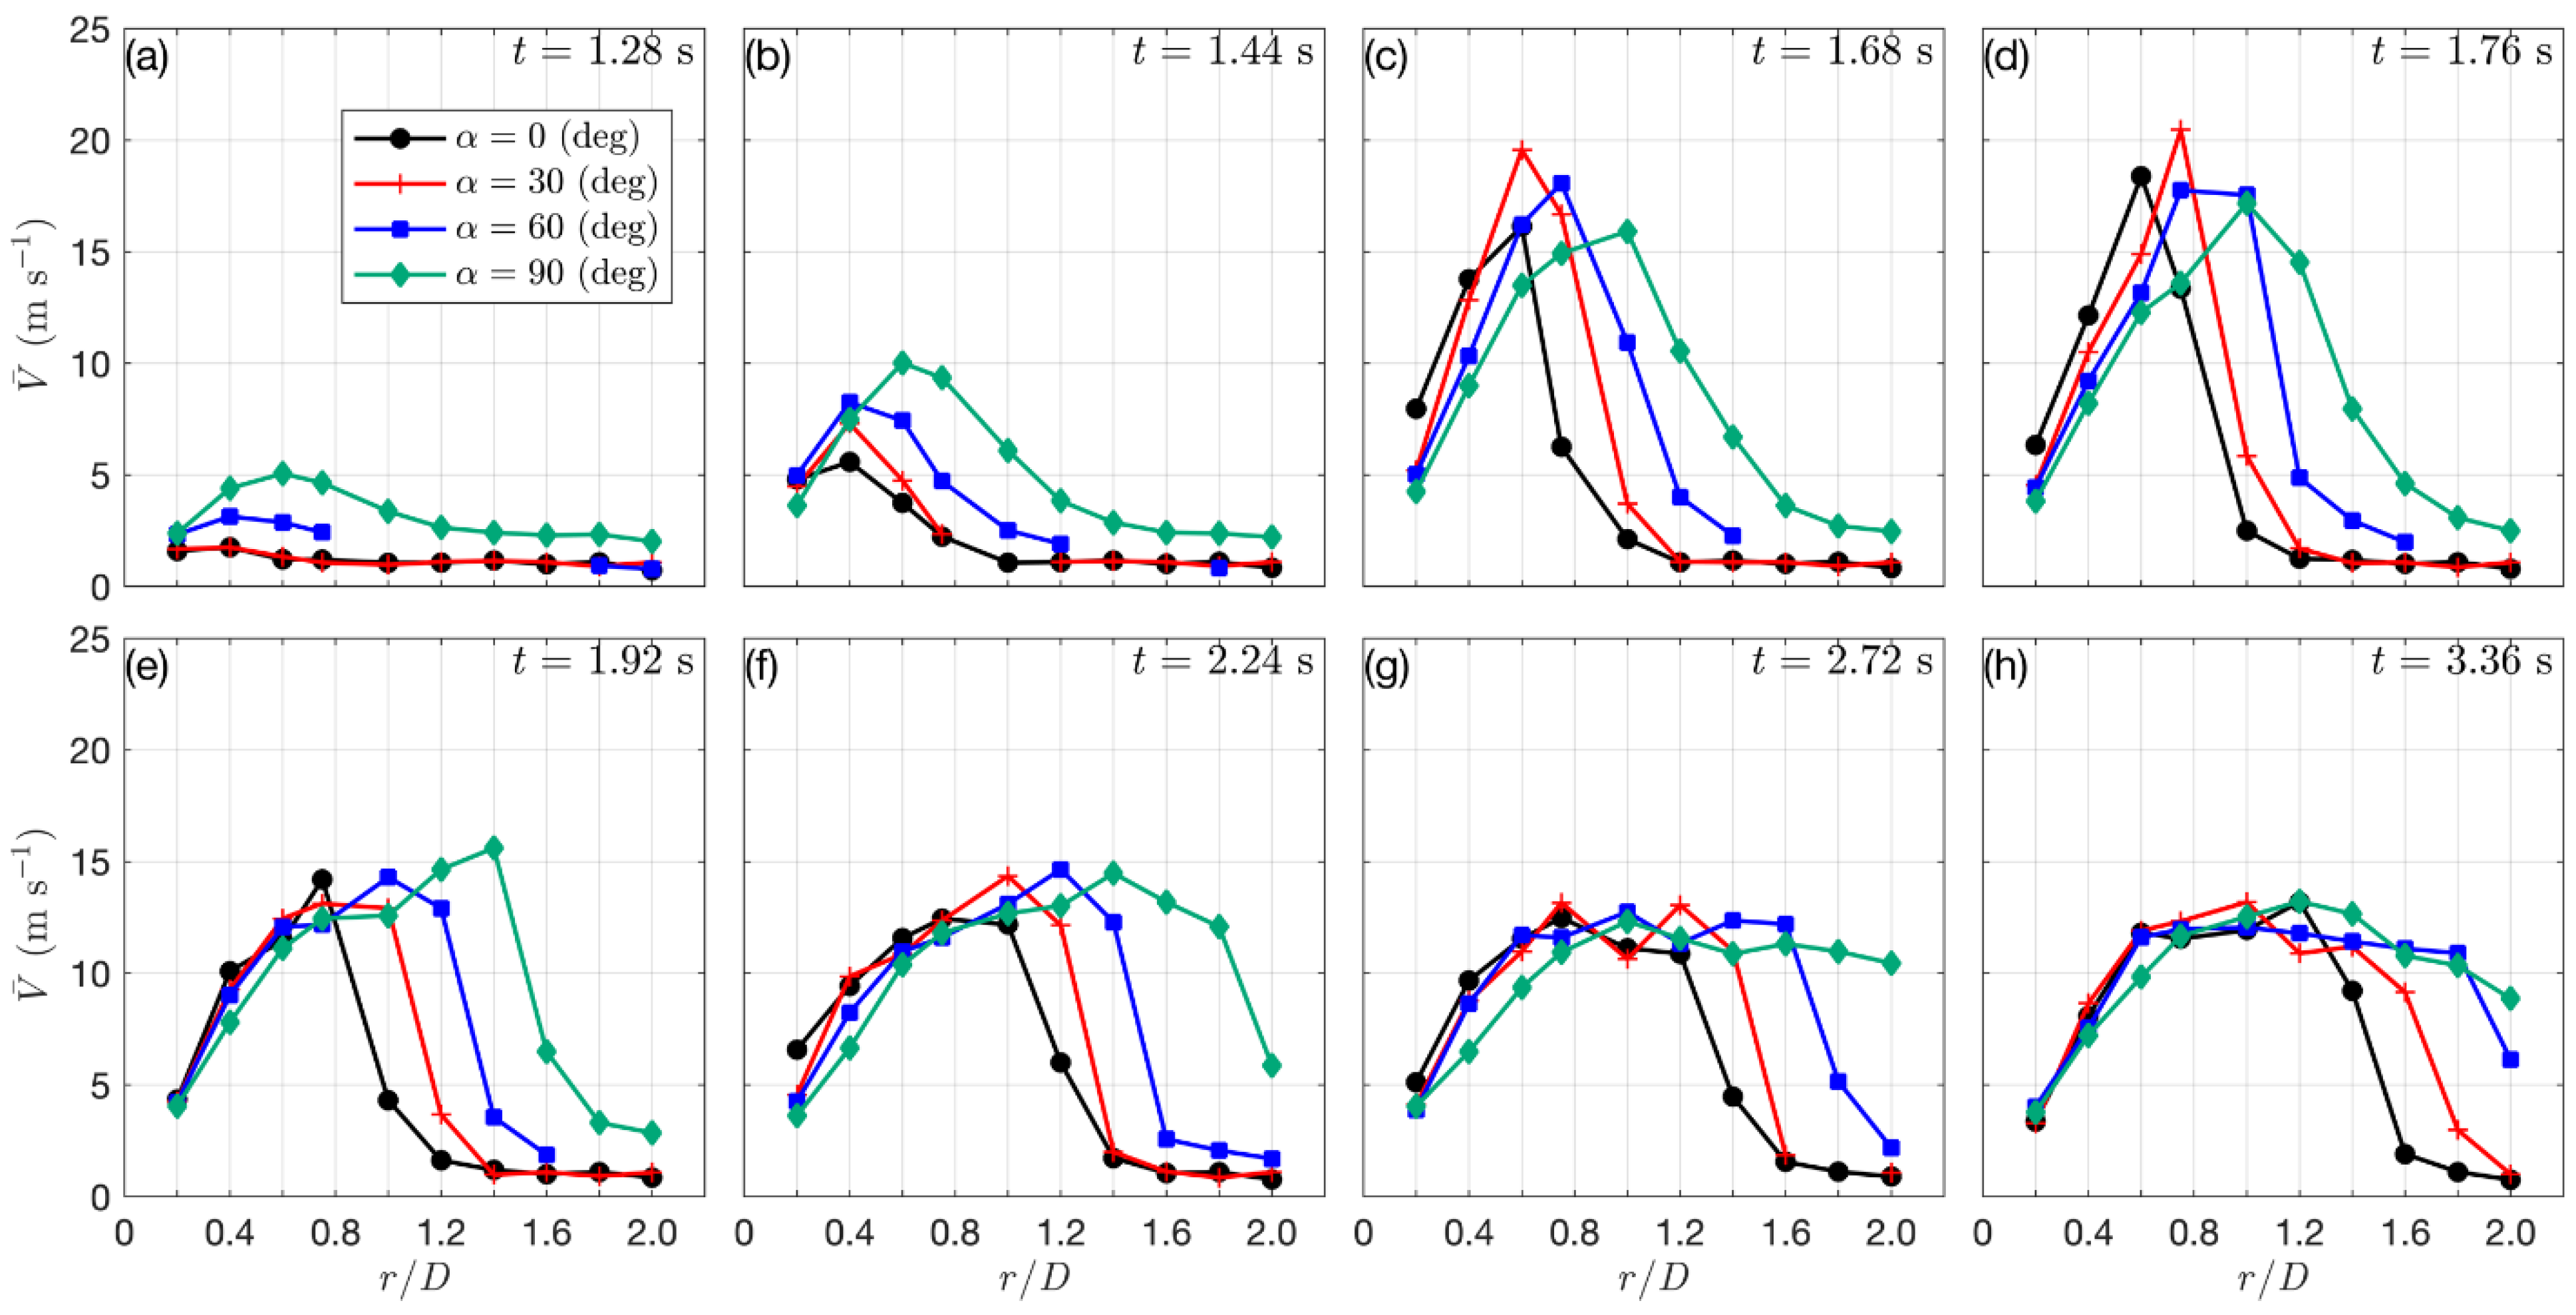
Figure 10 shows the DB slowly-varying mean wind speed as a function of r / D , captured at different time instants (with reference to Figure 9) in the frontal region. From a different perspective, it shows the time evolution of the DB outflow at the front with the counter-directed ABL flow. The drastic drop in the DB wind speed can be considered representative of the location of the dynamic stagnation point that characterized the collision between PV and ABL wind. A common trend, at least in the PV phase, is highlighted up to t = 1.92   s (panels a–e): the wind speed increases up to a certain radial location where, upon reaching its maximum value, is followed by an abrupt decrease of magnitude. Indeed, the recording of the passage of PV over the generic radial location r / D i produced: peak wind speed at r / D i ; ramp-up signature of the wind speed at locations r / D < r / D i where PV has already passed through; wind speed slowdown at locations r / D > r / D i where PV has not reached yet. The shift Δ r / D in the radial occurrences of V ¯ max between the investigated α locations corroborated again the non-symmetric behavior of the outflow. At t = 1.44   s (panel b), the jet had just impinged down to the ground into the background flow, which prevented the outflow from spreading out freely. Here, the maximum radial velocities were confined within the ideal geometrical boundaries of the downdraft, i.e., r / D 0.5 , and were not due to the travelling PV, with the exception of α = 90 ° where the flow expanded further for the reasons mentioned above. Later on (panels c–d), the passage of PV were recorded at every α . However, Δ r / D V ¯ max was conserved with rather the same clockwise order: in terms of r / D , V ¯ max occurs first at α = 0 ° and last at α = 90 ° . In other terms, the more oppositely directed are DB and ABL flows and the closer to the jet touchdown ( r / D = 0 ) V ¯ max occurs. In the time frames shown in panel (e) and panel (f), PV lost its symmetric structure and thus the benefits of the entrainment of background air, while α = 90 ° records the wind speed maxima. During the plateau stage (panels g,h), the wind speed became steadier after the initial ramp-up in the touchdown region. Here, analogous wind speed magnitudes were recorded across the azimuthal locations for r / D > 0.5 and are produced by trailing vortices following the PV. Depending on α , however, such wind speed is reached at different r / D s following rather accurately the same pattern observed above. Analogously, after the plateau, the wind speed decreased starting from α = 0 ° and in clockwise order. Indeed, the wind speed at α = 90 ° did not decrease as drastically as for α < 90 ° , at least until the end of the radial domain of observations. After t = 3.36   s (not shown here), the plateau of the wind speed expanded radially further also for α = 0 ° and 30 ° . In other terms, the downburst outflow somehow overcame the opposite force induced by the ABL wind as time passed. However, at these azimuth locations, the radial symmetry was still not retrieved, as shown in Figure 9. During the dissipation segment of the wind speed record, i.e., t > 5   s approximately, the downburst outflow waned and the ABL flow pushed it back towards r / D = 0 . A reverse trend of the wind speed pattern along the azimuth and radial locations is expected by incrementing the observational time in this stage, with clearly lower magnitudes as downburst outflow had no more horizontal momentum in the radial outward direction.

3.4. Primary Vortex Propagation

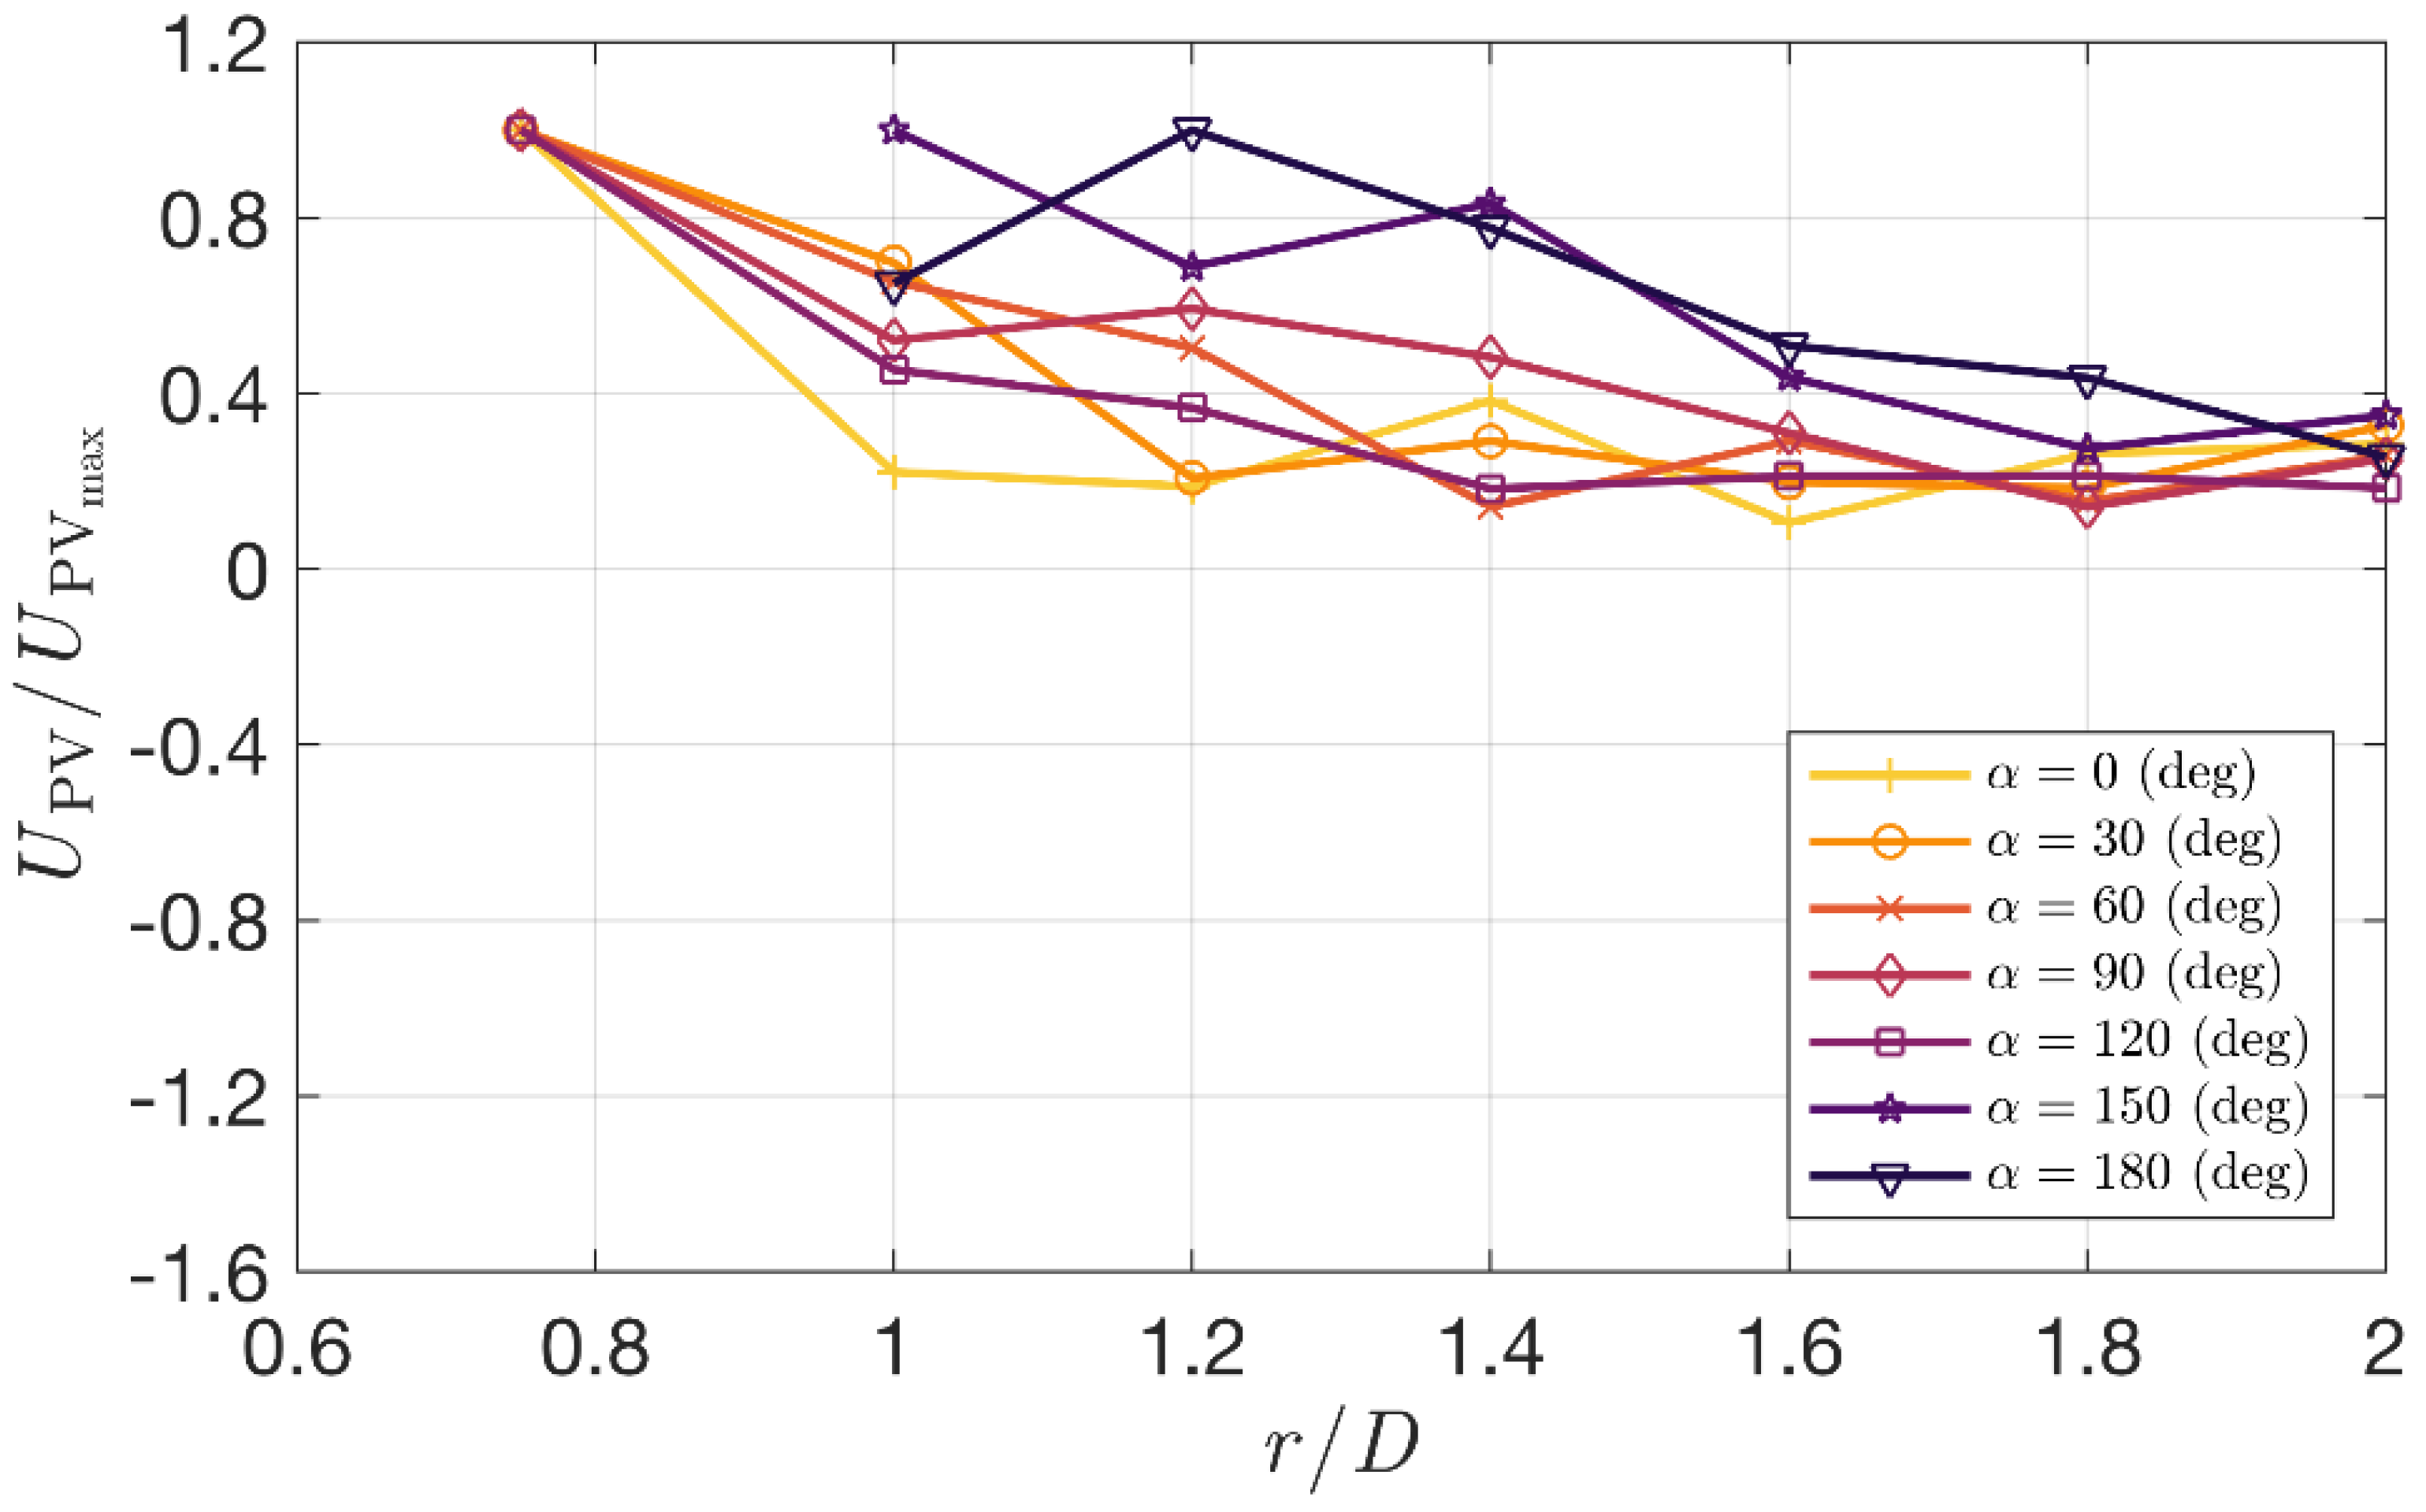
The synchronization of all signals across the chamber allowed for the evaluation of the convective velocity (or travelling time) of the primary vortex. To do so, at each r / D and α location, the first wind speed peak of the ensemble mean of all repetitions at z / z max = 1.0 was assumed to occur simultaneously with the passage of PV (Section 1). The calculation of the PV convective velocity is thus straightforward: the distance between two subsequent radial locations is known ( Δ r / D = 0.2 ) and by dividing this quantity by the time difference between the respective wind speed peak occurrences, we obtained U PV :
U PV = Δ r D × D t r D i t r D i 1
The procedure was applied starting from r / D = 0.6 , where the passage of PV was measurable. In the case of vertical isolated DB [32], the jet widened in the radial direction upon exiting the bell mouth and the radial positions up to r / D = 0.8 were thus still inside the downdraft area. In the case investigated here, however, the jet deflected towards α = 180 ° by the cross-ABL flow. The frontal boundary of the jet moved closer to r / D = 0 while, conversely, the rear part of the downdraft edge moved away from r / D = 0 in the direction of the ABL wind (i.e., α = 180 ° ). This is clearly portrayed in Figure 11, which shows the variation of U PV across the radial positions r / D s as a function of the azimuth angle α in the case of DBABL5.0. Note that the velocities here are normalized by the maximum convective velocity U PV max at each azimuthal location to draw a better comparison of the PV evolution along the radial direction. The PV in the frontal region exhibited maximum translational speeds again at r / D = 0.75 . Indeed, the maximum wind speed is the result of the superposition of advection velocity and PV circulation relative to the PV center [32]. Moving to the rear region, U PV max occurred further away from the jet touchdown position.
In the frontal region, upon the occurrence of U PV max at r / D = 0.75 the downburst front is observed to slow down considerably, which suggests that the two wind systems were “competing” against each other and PV was in a sort of “locked-in” position.
At the rear region, the location of U PV max appears to shift to higher radii due to the jet impingement that shifted beyond r / D = 0 in the downwind direction. Here, despite the PV may not be fully formed, the velocity of the front was maintained to be rather high due to the vertical squeezing and consequent speed-up effect. Here, the ABL flow gained downward momentum from the DB flow and thus acted as a downward force on the expanding outflow.

3.5. Vertical Profiles of Radial Wind Speed

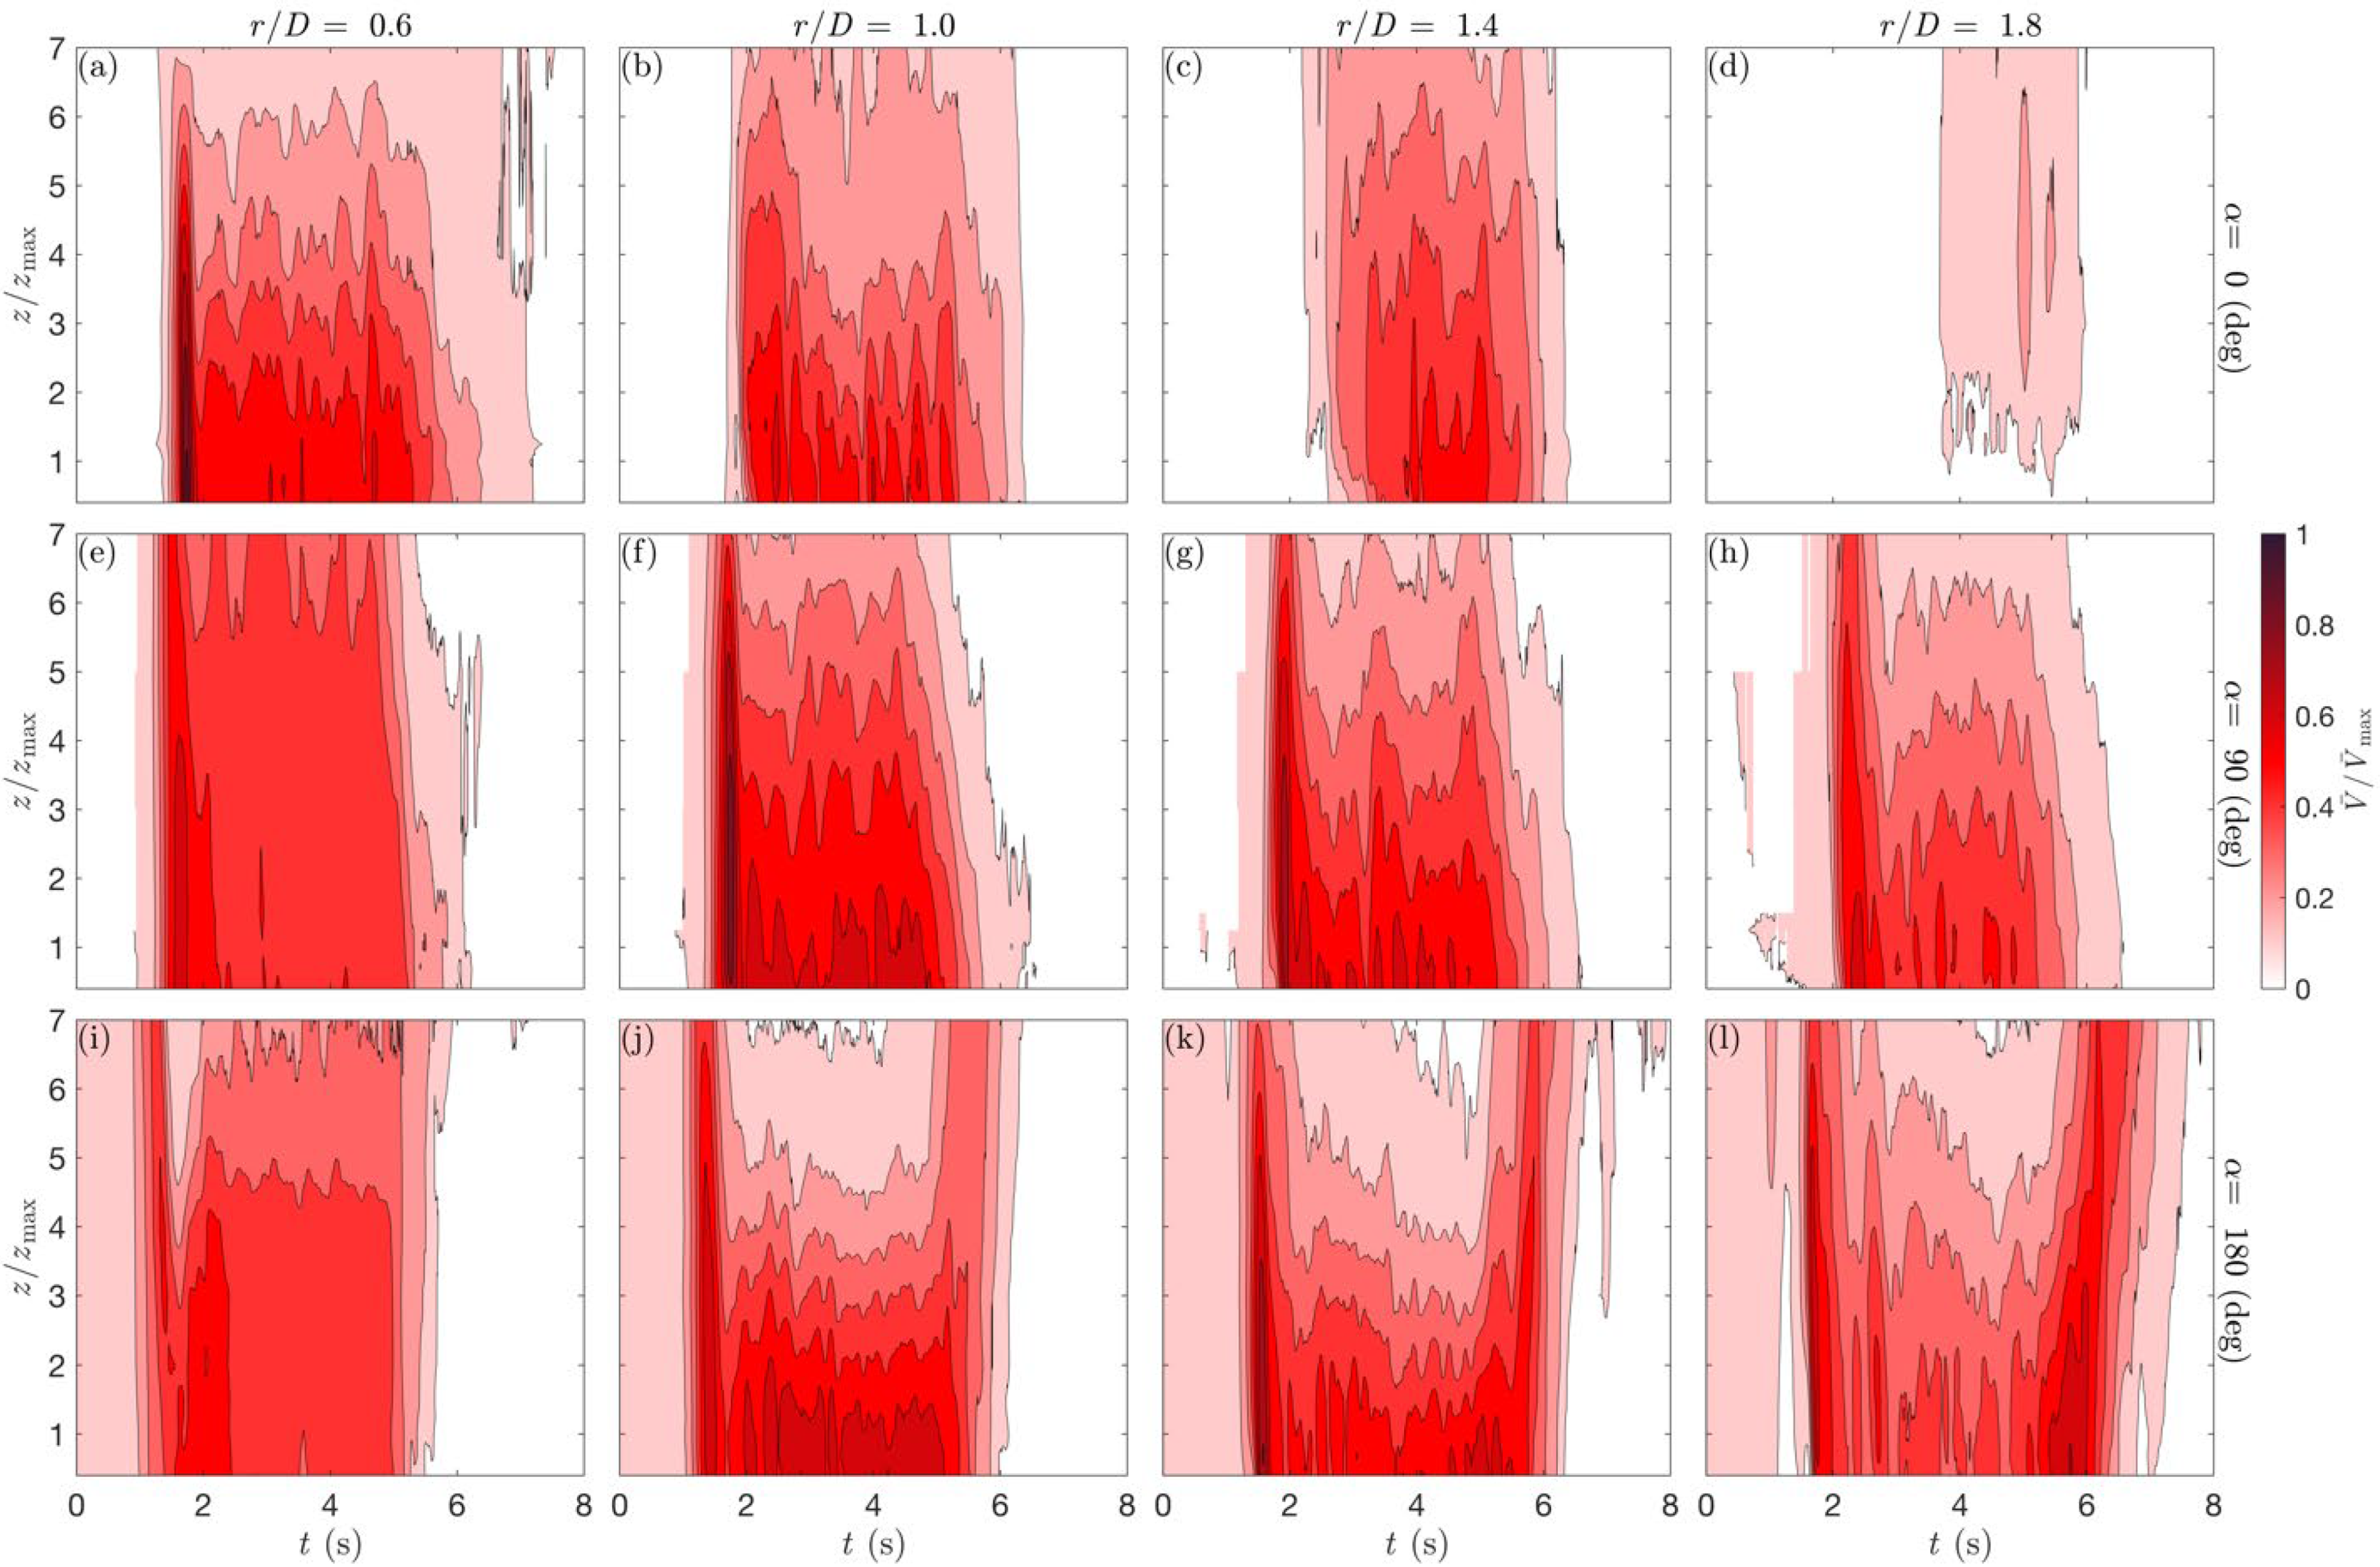
Figure 12 provides a characterization of the slowly-varying mean wind speed field V ¯ = V ¯ α , r , z , t evaluated as V ¯ = V ¯ z , t at α = 0 ° , 90 ° ,   180 ° and r / D = 0.6 ,   1.0 ,   1.4 ,   1.8 . The analysis is shown only for DBABL3.0 and the remaining spatial positions of measurement are omitted for briefness. By moving from the frontal to the rear region, i.e., from α = 0 ° to 180 ° , the interaction between the DB and ABL flows changed drastically, as reported above. The stagnation condition at the front between the two wind systems led to maximum wind speeds for r / D < 1.0 ; conversely, the same direction of propagation of DB and ABL outflows in the rear region of the domain shifted the region of absolute maximum wind speeds at r / D > 1.0 . At α = 90 ° , where DB and ABL were directed perpendicularly to each other and the ABL seemed to have the least influence on the DB outflow, the wind speed vertical profiles were observed to resemble the case of isolated DB [32] to a very good extent. Here, the maximum wind speeds were still observed around r / D = 1.0 , as widely found in the literature in the case of axisymmetric jet [13,16,23].
Furthermore, the time at which the Cobra probes started to record non-zero wind speed values changes according to the mutual interaction DB–ABL: the DB outflow reached first the rear region and later the frontal region. This was very evident at the location α , r / D = 0 ° , 1.8 where the signature of the passage of the DB outflow was basically absent. Throughout the evolution of the event, and outside of the downdraft region, the DB vertical profile remained nose-shaped in agreement with the observations of Canepa [32] on the isolated DB case: at the time of the passage of PV, the vertical extension of the area of V ¯ max was quite high, while during the plateau segment of the wind speed records, where the outflow was dominated by smaller trailing vortices following PV, the nose of the vertical profile was more constrained to the ground. The spikes in the vertical profiles of V ¯ were inherently related to the frequency of the vortex detachments from the nozzle [32]. The large values of V ¯ at α = 180 ° during the dissipation stage of the wind speed were due to the asymmetrical closing of the bell mouth and thus not related to any meaningful physical interpretation.
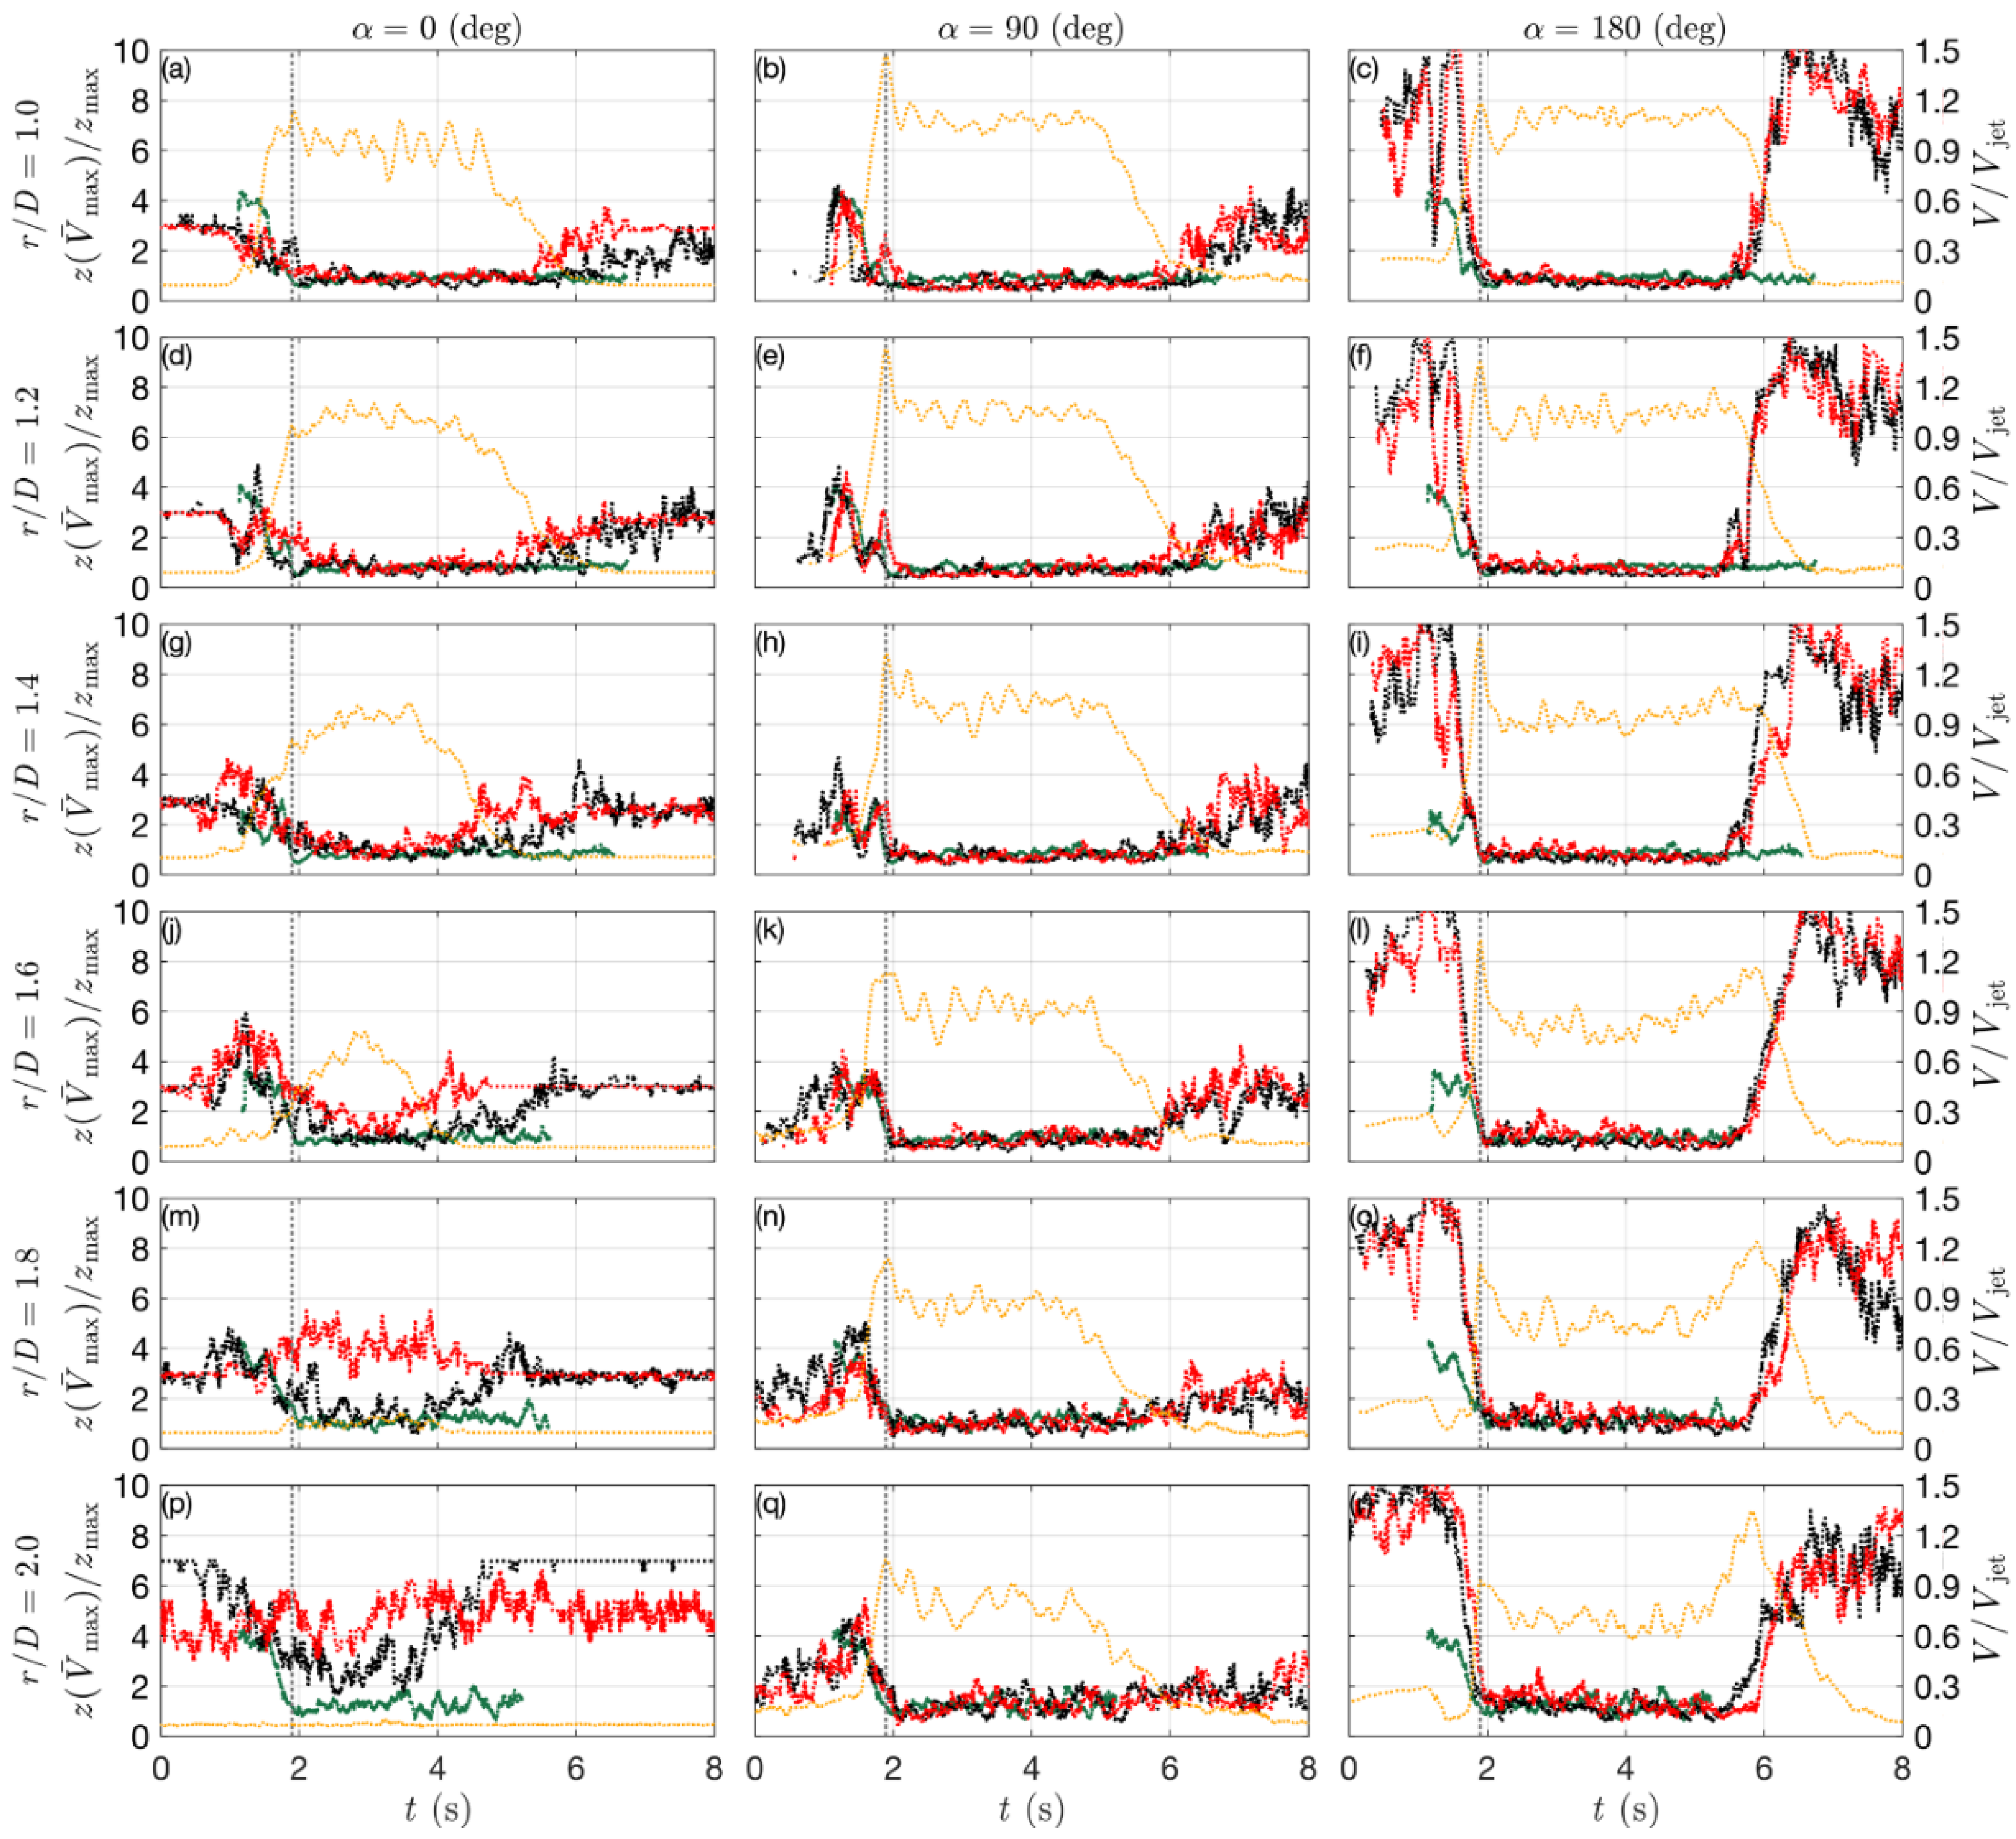
Figure 13 reports the time variation of the height of maximum slowly-varying mean speed, z V ¯ max , at α = 0 ° ,   90 ° and 180 ° . All wind speed signals were first synchronized based on the time occurrence of the absolute maximum wind speed along with the vertical profile, for each repetition. Hence, the ensemble average of z V ¯ max was calculated as the mean across all 10 repetitions at each azimuth angle and each radial position r / D 1 . The comparison with the case of vertical DB (green dots) [32], clearly highlights the role played by ABL on the DB outflow. Figure 13 shows that at α = 0 ° the decrease of z V ¯ max related to the passage of the PV is generally not as pronounced as for the other two azimuths. This is due to PV being lifted up by the entrainment of ABL wind (Figure 7). Beyond r / D = 1.6 , the interaction between DB and ABL flows produced a decrease in radial wind speeds towards zero and the related values of z V ¯ max lost significance. At α = 90 ° , the evolution of z V ¯ max resembled, to a good extent, that of the case without the inclusion of background wind. For α = 180 ° , very high z V ¯ max were observed close to the top measurement height, before and after the embedding of the DB into the developed ABL wind, in agreement with the ABL logarithmic-like profile. Here, therefore, the transition of z V ¯ max appears much more remarked. However, the height of maximum wind speed matches well with that of the isolated DB for the plateau segment. This suggests that the height of the vortex core, which lost its symmetric and coherent structure due to the presence of ABL wind, did not increase due to the downward force exerted by the ABL flow.

3.6. Turbulence Properties

In wind engineering terms, turbulence intensity is defined as I V = σ V / V ¯ where σ V is the time-dependent standard deviation of the instantaneous velocity V with respect to its slowly-varying mean value V ¯ . The reliability of the I V values obtained in our experimental campaign is assured by the high sampling frequency of the Cobra probe measurements, i.e., 2500 Hz.
Canepa [32] analyzed a large set of experimentally produced downburst outflows and found that the usual hypothesis adopted in literature, i.e., turbulence intensity assumed constant in time I V = I ¯ V (where I ¯ V is the temporal mean of the slowly-varying turbulence intensity I V ), loses validity in controlled conditions. However, this was also noticed in the full-scale environment by several authors [1,7,43,44], who found an asymmetry of the parameter μ t = I V t / I ¯ V in correspondence to the peak wind speed or, in other words, concurrently with the passage of PV by the measuring instrument. Specifically, μ showed a local maximum and minimum, respectively, before and after the recording of the maximum wind speed. The three orders of magnitude or so lower Reynolds numbers R e involved in the experiments at the WindEEE Dome returned a much smoother environment compared to full-scale conditions and thus, the off-mean values of the turbulence intensity were overall magnified. The current study shows that the overall time evolution pattern of the turbulence intensity, particularly in the neighborhood of the wind speed maximum (grey dotted line in Figure 14), is often analogous to that of the isolated jet case [32]. Turbulence intensity is here still defined from the radial wind speed component and is named I V accordingly. Figure 14, however, shows that μ generally assumes values below 1 at the beginning of the wind speed signal. The embedding of the DB wind actually contributed to adding turbulence to the ABL-like environment. In this situation, μ generally increases rapidly and assumes the maximum value slightly before the occurrence of the maximum wind speed, t V ¯ max . This is followed by a local minimum few instants later than t V ¯ max and by a plateau of roughly constant μ = 1 during the plateau segment of the wind speed.
At α = 0 ° , the strong flow mixing between ABL and DB outflows causes the parameter μ to fluctuate significantly. Here, the maximum values are observed aloft at z / z max = 7.0 for r / D < 1.4 , likely due to the embedding of the ABL air into the vortex structure at this elevation. At α = 90 ° , where the outflow fairly conserved the radial symmetry, the asymmetric behavior of μ was highlighted near the surface where the maximum wind speeds during the passage of PV were recorded, in analogy to what was found by Canepa [32]. Starting from r / D = 1.6 , the maximum of μ was observed earlier in the time history; the time occurrence suggests its correlation with the detachment of the boundary layer from the surface and consequent formation of the SV [7,45,46]. Here, the interaction and friction between PV and SV increased the turbulence level significantly. At α = 180 ° , the passage of the front was only evident from r / D = 1.2 due to the deflection of the jet at the ground. Here, the spike of μ is observed slightly after, rather than before, that associated with V likely due to the PV being elongated and deteriorated by the action of the ABL flow. This effect slowly vanished with the possible near-surface onset of the SV beyond r / D = 1.4 and the trend of μ appears thus retrieved.
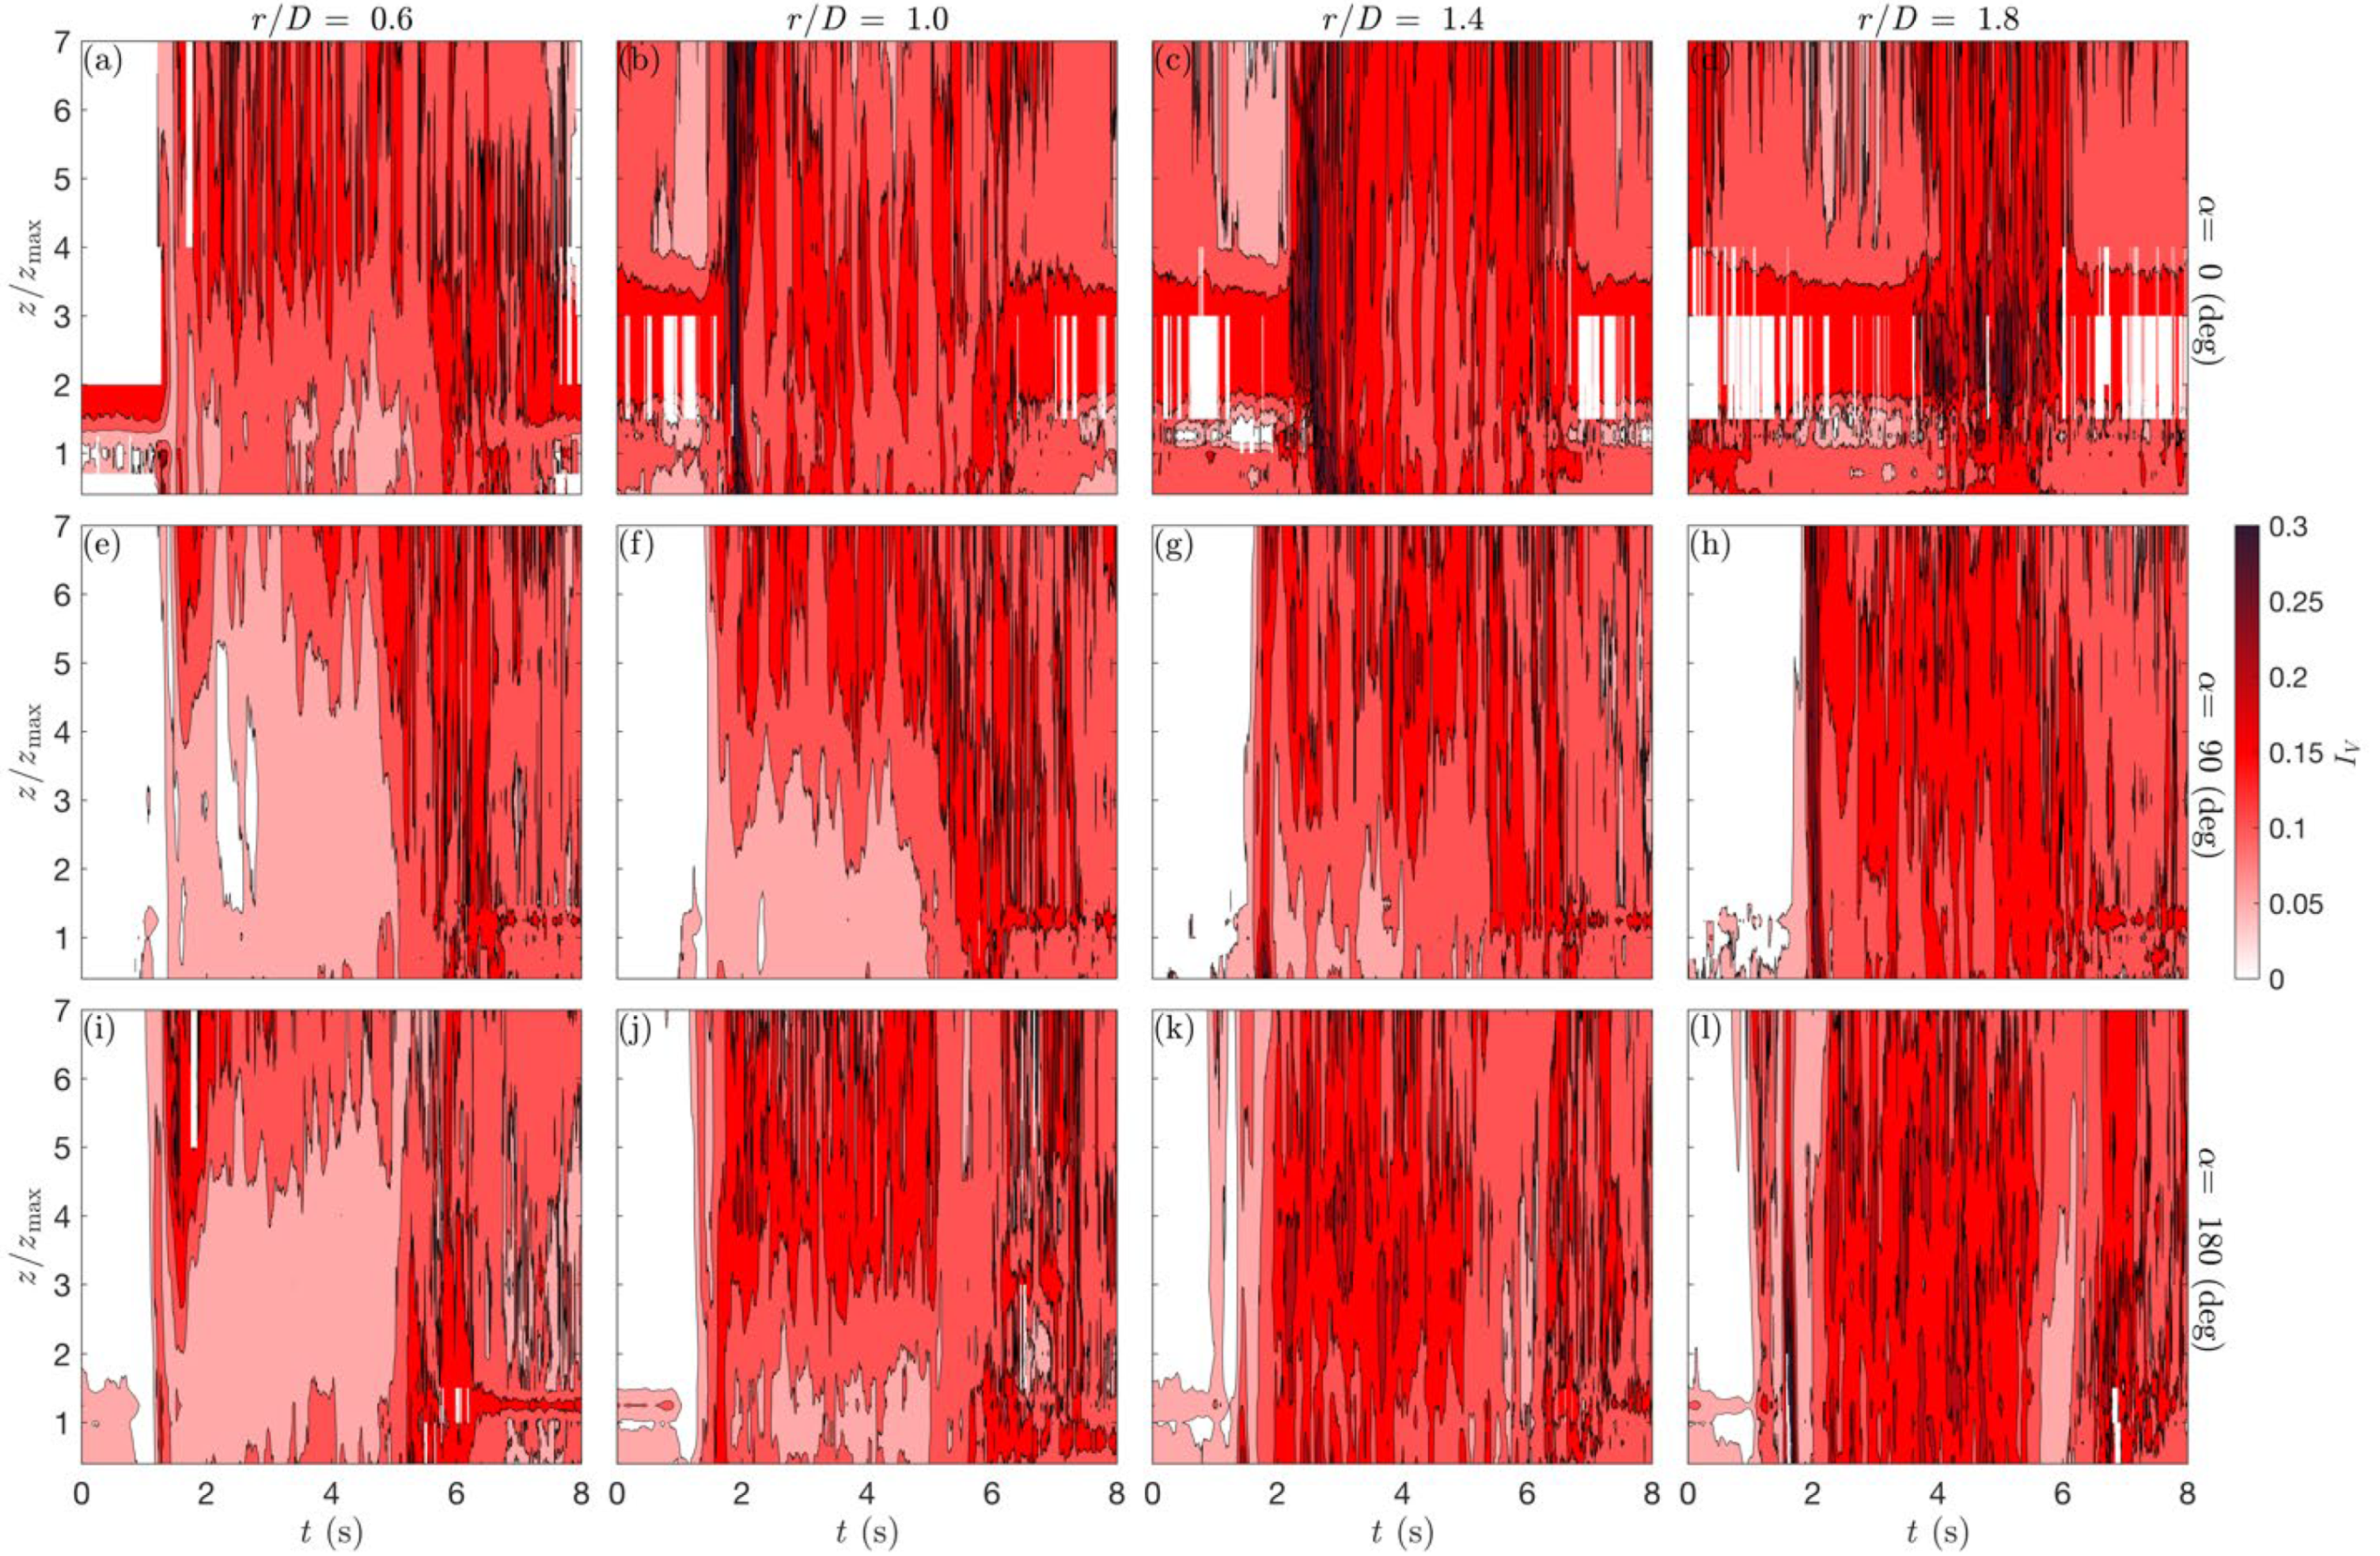
Figure 15 shows distributions of the slowly-varying turbulence intensity I V = I V α , r , z , t in the case of DBABL3.0 at the same measurement locations shown in Figure 12. The maximum values were found at the front between DB and ABL flows as a consequence of the high flow mixing that developed from their interaction. Due to the modulation of the mean wind speed and to its large values at the lower elevations (see Figure 12), I V showed lower values compared to the rest of the vertical profile.
Figure 16 shows the time evolution of the height of maximum turbulence intensity at the different ( α ,   r / D ) locations, in analogy to Figure 13, for both DBABL3.0 and DBABL5.0 cases with respect to the case of isolated vertical DB. In agreement with the observations of Canepa [32], the rapid shift of z I V max concurrently with the passage of the PV appeared from the lower to the higher heights. At α = 0 ° , however, this is only slightly noted for r / D 1.4 due to the outflow being deteriorated by the opposed ABL flow at further radial locations. At α = 90 ° and 180 ° , the change of z I V max was much more remarked and followed the observations pointed out in Canepa [32]. At α = 180 ° , the higher heights of occurrence of I V max before the wind speed ramp-up are likely due to the shear between the ABL and the approaching outflow and, starting from r / D = 1.4 , to the onset of the SV. The higher values of z I V max in the last part of the velocity plateau are related to the mechanical asymmetric closing of the bell mouth louvers, which cause the wind speed and the turbulence intensity to increase at these azimuths and at the higher heights.
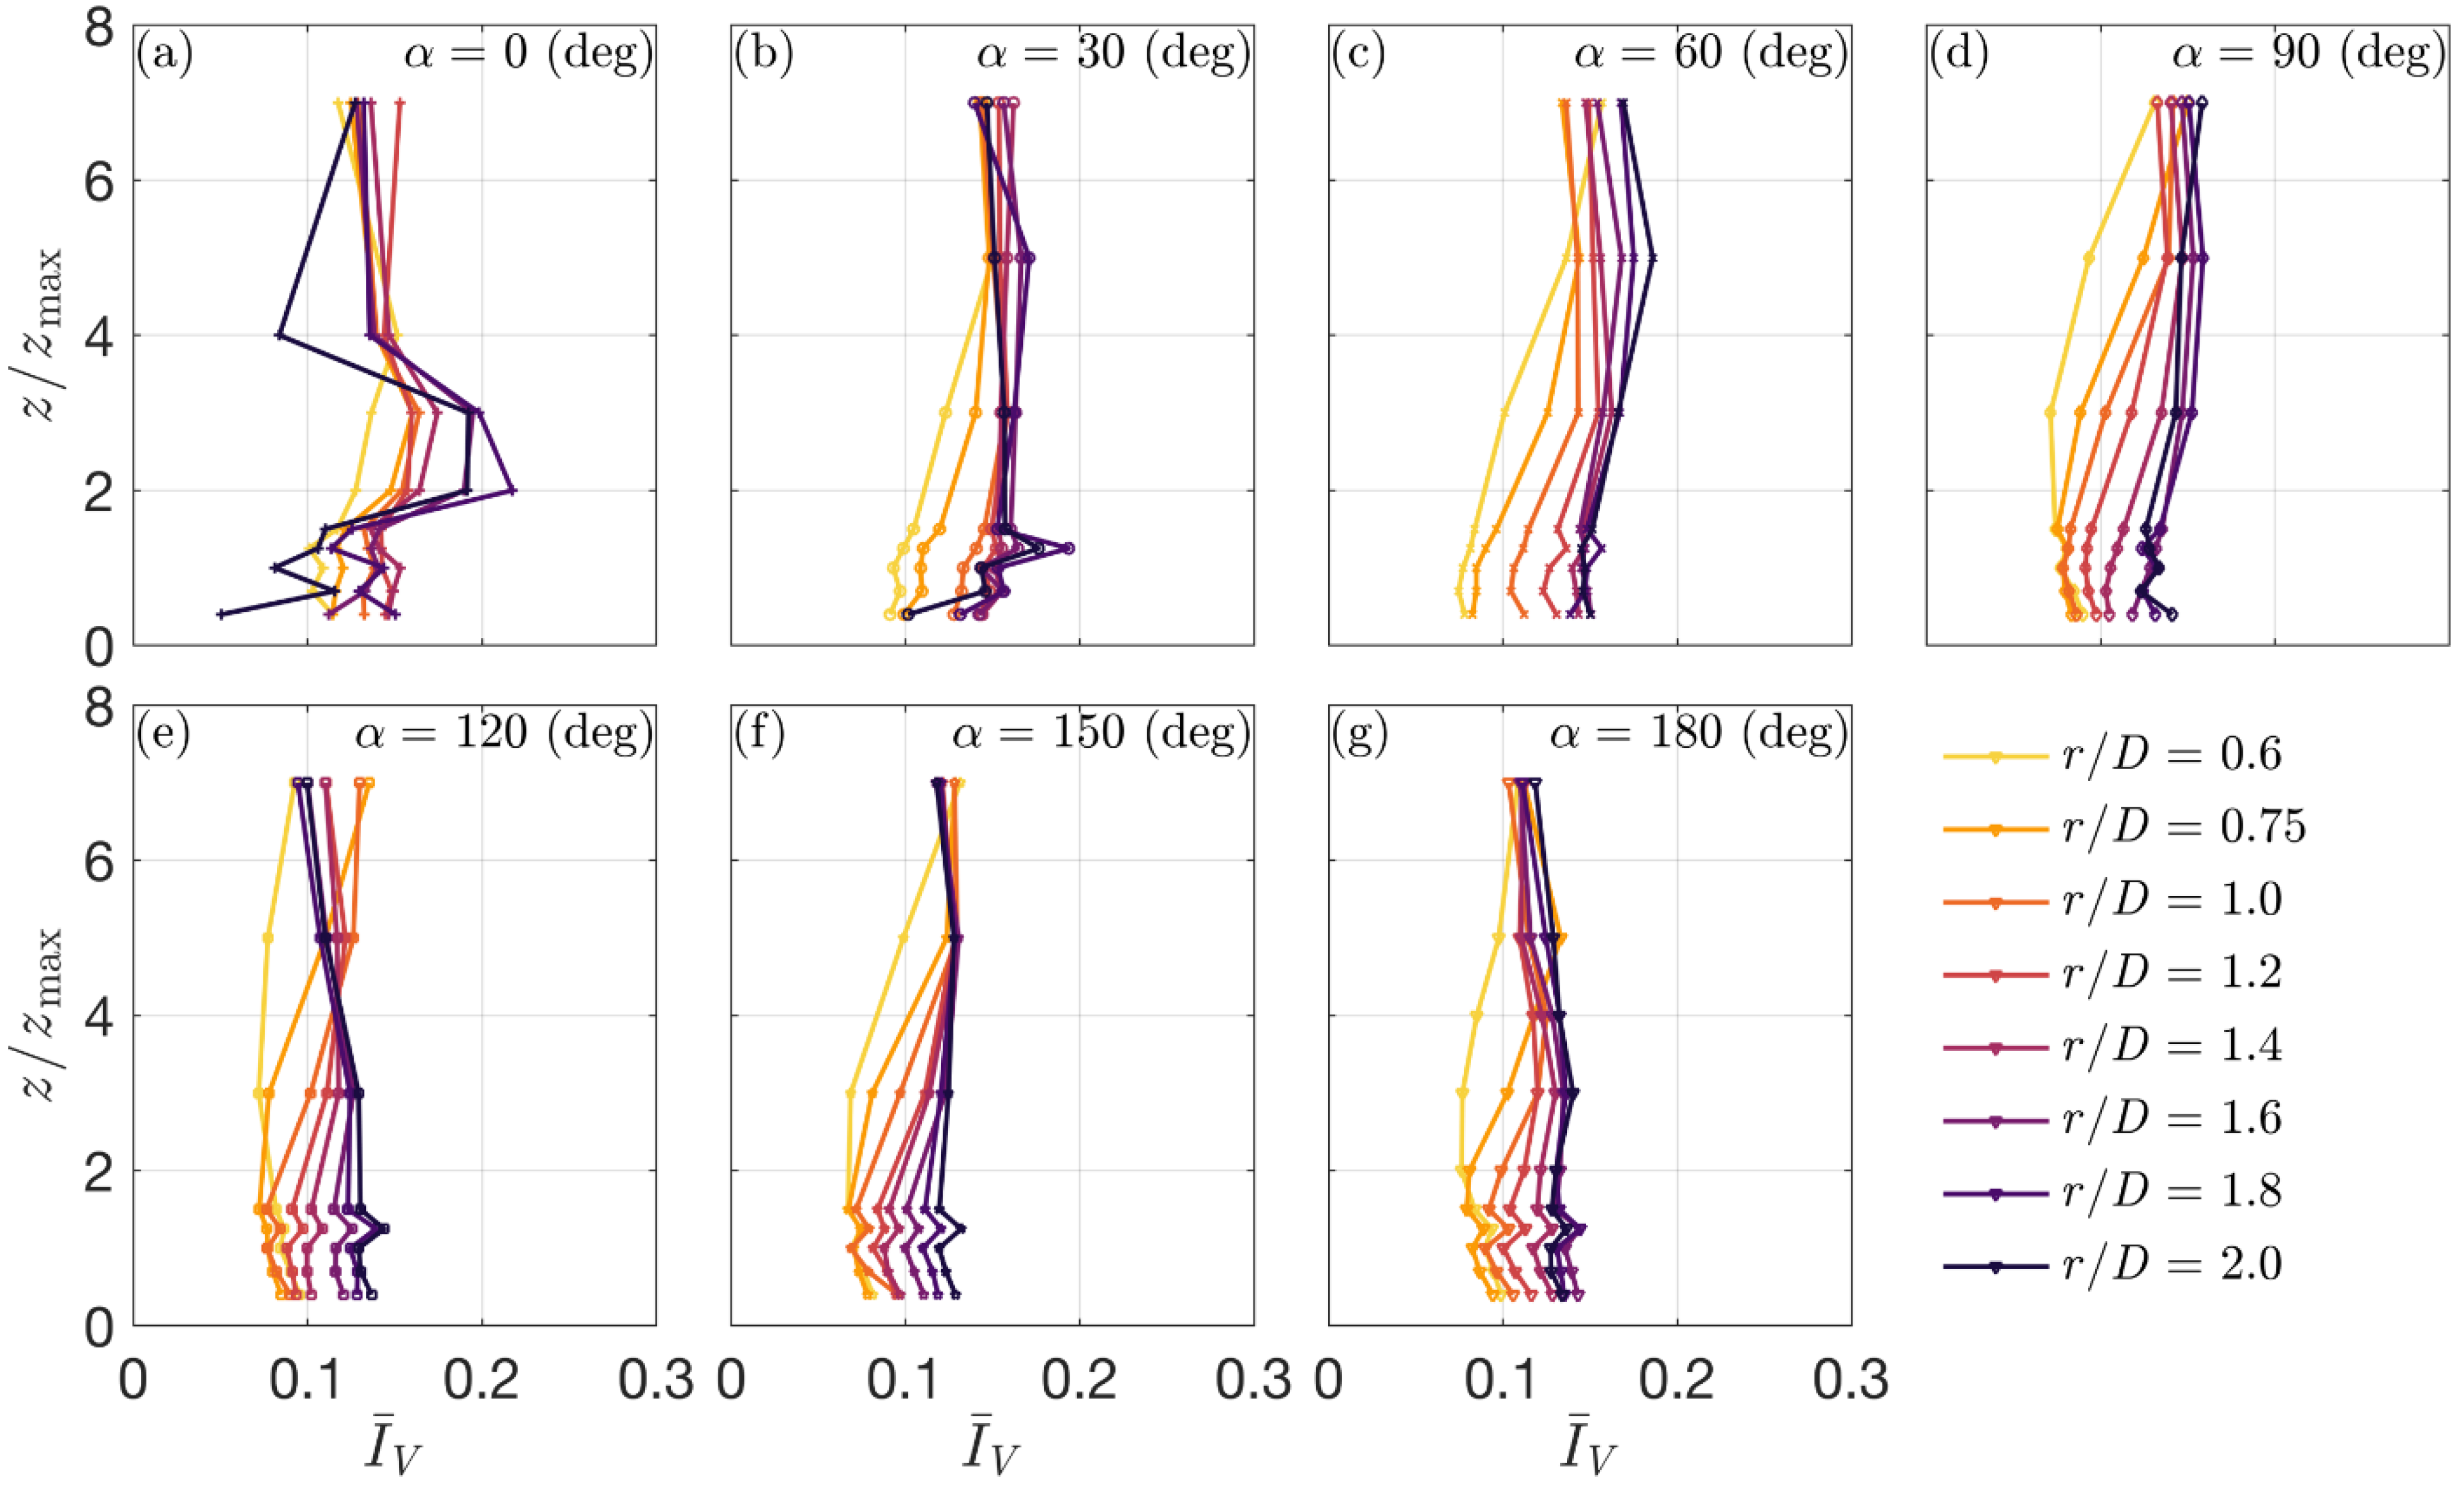
Figure 17 shows the azimuth and radial ( r / D 0.6 ) development of the vertical profiles of I ¯ V in the case of DBABL3.0. I ¯ V is evaluated as the mean over the duration of the DB-like flow, i.e., from opening to closing of the bell mouth releasing the jet. The magnitude of I ¯ V is observed to generally increase along with the first few radial locations and to remain approximately constant beyond. In the area 120 ° α 180 ° (panels e–g), I ¯ V decreased along the vertical profile starting from approximately z / z max = 3.0 for higher r / D values. In addition, at r / D = 2.0   I ¯ V was generally found to be lower at the higher heights compared to the previous radii. At α = 0 ° (panel a) and for r / D > 1.4 , the vertical profiles of I ¯ V showed the clear off-mean maximum values at z / z max = 2.0 , which are again unphysical due to the deterioration of the DB outflow and PV at those measurement locations. However, a weaker spike in the vertical profile of I ¯ V was also observed and located at z / z max = 1.25 for the remaining α positions. This is likely to be produced by the interaction PV–SV. The overall values of I ¯ V appear higher in the frontal region (panels a–d), with values between 0.1 and 0.2, while they decrease even below 0.1 in the rear region (panels e–g), for the reasons mentioned above. Finally, the I ¯ V values were in good overall agreement with those evaluated for large sets of downburst records from ultrasonic measurements [1,43,44] and also in relation to the vertical profiles recorded by means of LiDAR profilers [7], as well as to the experimental investigation of Canepa [32].
The statistical properties of the reduced turbulent fluctuation V ˜ t = V t / σ V t , being V t the residual fluctuation ( V t = V t V ¯ t ) and σ V t its mobile standard deviation, confirm that this quantity can be reasonably treated as a stationary random process with zero mean and unit standard deviation, as widely proved by literature. In accordance with the experimental investigation on vertical isolated impinging-jet downbursts [32], the power spectral density (PSD) of V ˜ (not shown here) follows the law n 5 3 (where n is the frequency) in analogy to full-scale synoptic-scale ABL winds and also to real downburst occurrences [1,21,27].

4. Conclusions and Prospects

This paper presents a comprehensive analysis of a large and unique set of experiments performed at the WindEEE Dome at Western University in Canada on the interaction between downburst (DB) and background ABL winds. The interplay between the two flows has only recently been addressed in literature where, however, the superposition is usually dealt with through a simple vector summation. Our findings confirm what was already concluded by Romanic and Hangan [34,35] on the unfeasibility of this hypothesis and discuss in detail the evolution of this interaction. In our experimental study, wind speed measurements were recorded on a refined spatial and temporal grid in order to reconstruct the detailed flow field dynamics. There are no experimental studies in the literature that describe in either qualitative (flow pattern) or quantitative (wind speed values) manner the evolution of the front between DB and ABL flows. This region is proved by our investigation to be of crucial importance in terms of enhanced wind speed magnitudes due to the flow speed-up effect and heavy non-linearity produced by the interaction.
The new integrated system installed at the WindEEE Dome enabled the recording of the time of opening and closing of the nozzle, releasing the jet into the testing chamber. This allowed for the synchronization of all signals across the chamber to reconstruct the time evolution of the front between DB and ABL flows. The maximum radial wind speeds are found at the front between the colliding flows where the radially advancing vortex, upon the jet impingement on the ground, entrains the counter-directed ABL air taking advantage of the same sign of horizontal vorticity (Figure 7). This causes the vortex to increase its momentum and vorticity and the horizontal flow constrained underneath the vortex structure to accelerate accordingly. Overall, the interaction between the two flows triggers a highly asymmetric behavior of the expanding outflow. In the frontal region, where the two fronts collide against each other, the DB outflow is slowed down by the ABL flow up to an azimuth angle approximately equal to α = 60 ° with respect to the ABL incoming direction ( α = 0 ° ). In the rear region, the background ABL impacts the embedded vertical downdraft provoking an inclination of its axis with respect to the vertical. This causes the jet touchdown position to shift further downstream. Overall, this results in a “locked-in” outflow at the front between DB and ABL systems, while the development of the PV and the DB outflow is speeded-up in the rear region compared to the pure DB mode analyzed in Canepa [32]. The DB outflow is therefore shifted in time and along the radial coordinate based on the mutual interaction between DB and ABL, which in turn depends on the azimuth location of observation.
The time variation of the height of maximum wind speed was observed to change abruptly at the passage of the primary vortex (PV). The entrainment of ABL flow into the PV structure in the frontal region raised the vortex up above the surface. This might explain the more gradual drop of z V ¯ max at the time of the PV passage with respect to the other azimuths. At α = 90 ° , where the DB outflow was less influenced by the ABL wind, z V ¯ max showed a spike at the beginning of the velocity ramp-up, which is an indicator of the formation of the SV due to the detachment–reattachment of the surface layer at the surface. The maximum wind speeds occurred at the boundary between the inner and outer layers of the outflow. The same spike was not observed at the front between the two flows where the ABL may break the formation of the secondary vortex (SV). The decrease of z V ¯ max was much more pronounced in the ABL-streamwise direction due to the wind speed vertical profile that switched from the ABL logarithmic-like shape to the DB nose-like shape.
The turbulence characteristics of the flow were found to be in good agreement with those evaluated for large datasets of real thunderstorm events [1,43,44] and also with reference to their vertical profiles [7]. We found higher turbulence at the front between DB and ABL due to the high flow mix generated by the collision. The temporal evolution of the turbulence intensity showed a maximum right prior to the maxima of the wind speed. The maxima of the turbulence intensity generally occur at lower heights and are associated with the passage of the PV and likely with its interaction with the inner layer dominated by the secondary vortex. Overall, the embedment of the downburst wind into the already developed ABL caused an augmentation of the turbulence intensity.
Analogous observations are reported in the analysis of full-scale events by Zhang et al. [43,44] and Canepa et al. [7], as well as in controlled conditions [32]. The assumption I V = I ¯ V usually adopted in literature, namely turbulence intensity invariant with time, is invalidated by the present study with wind–structure interaction implications.
Despite the high-density grid of Cobra probes used in this study to track the dynamics of the downburst phenomenon, the complexity of the DBABL flow interaction possibly makes the space reconstruction somehow lacking. To this end, the point measurements here presented and analyzed will be integrated with “continuous” 3D investigation by deploying large-scale PIV measurements. The upcoming study will aim at describing the DB–ABL front evolution at three different heights above the chamber floor. A decisive support in this sense will also come from ongoing numerical simulations modeling the experimental downburst scenario at the WindEEE Dome that was discussed in the current study. As described in Section 1, numerical studies on the DB–ABL interaction have already been performed in recent years (e.g., [31]) and give important insights into vortical structure dynamics, also taking advantage of the Lagrangian vortex method [47,48]. The meshless approach by means of Large Eddy Simulation (LES), for instance, appears very promising in reconstructing the spatial evolution of such a complex flow interaction, where the experimental grid of measurement locations assessed in this study still seems coarse for this purpose.
Furthermore, in terms of experimental activities at the WindEEE Dome, the possibility to release the jet at non-vertical angles will provide a qualitative and quantitative measure of the effect of thunderstorm cloud translation during the event.
The outcome of this thorough investigation will allow us to build an experimental model to describe the structural behavior of downburst winds.

Author Contributions

Conceptualization: M.B. and D.R.; Methodology: M.B. and D.R.; Experiments: F.C. and D.R.; Software: F.C. and D.R.; Validation: F.C.; Formal Analysis: F.C.; Investigation: F.C. and M.B.; Resources: M.B. and H.H.; Data Curation: F.C.; Writing—Original Draft Preparation: F.C.; Writing—Review & Editing: F.C., M.B. and H.H.; Project Administration: M.B. and H.H.; Funding Acquisition: M.B. and H.H.; Supervision: M.B. and H.H. All authors have read and agreed to the published version of the manuscript.

Funding

This research is funded by the European Research Council (ERC) under the European Union’s Horizon 2020 research and innovation program (grant agreement No. 741273) for the project THUNDERR—Detection, simulation, modelling and loading of thunderstorm outflows to design wind-safer and cost-efficient structures—awarded with an Advanced Grant 2016, as well as by the Canada Foundation for Innovation (CFI) WindEEE Dome Grant (No. X2281B38).

Acknowledgments

The authors are deeply grateful to Giovanni Solari for his essential contributions to the conceptualization, supervision and funding of this research. Thanks to Gerry Dafoe for his valuable technical contribution to perform the experiments at the WindEEE Dome.

Conflicts of Interest

The authors declare no conflict of interest.

References

  1. Solari, G.; Burlando, M.; De Gaetano, P.; Repetto, M.P. Characteristics of Thunderstorms Relevant to the Wind Loading of Structures. Wind Struct. 2015, 20, 763–791. [Google Scholar] [CrossRef]
  2. Burlando, M.; Zhang, S.; Solari, G. Monitoring, Cataloguing, and Weather Scenarios of Thunderstorm Outflows in the Northern Mediterranean. Nat. Hazards Earth Syst. Sci. 2018, 18, 2309–2330. [Google Scholar] [CrossRef] [Green Version]
  3. Davenport, A.G. The Application of Statistical Concepts to the Wind Loading of Structures. Proc. Inst. Civ. Eng. 1961, 19, 449–472. [Google Scholar] [CrossRef]
  4. Davenport, A.G. Gust Loading Factors. J. Struct. Div. 1967, 93, 11–34. [Google Scholar] [CrossRef]
  5. Goff, R.C. Vertical Structure of Thunderstorm Outflows. Mon. Weather Rev. 1976, 104. [Google Scholar]
  6. Hjelmfelt, M.R. Structure and Life Cycle of Microburst Outflows Observed in Colorado. J. Appl. Meteorol. 1988, 27, 900–927. [Google Scholar] [CrossRef]
  7. Canepa, F.; Burlando, M.; Solari, G. Vertical Profile Characteristics of Thunderstorm Outflows. J. Wind Eng. Ind. Aerodyn. 2020, 206, 104332. [Google Scholar] [CrossRef]
  8. Solari, G.; Burlando, M.; Repetto, M.P. Detection, Simulation, Modelling and Loading of Thunderstorm Outflows to Design Wind-Safer and Cost-Efficient Structures. J. Wind Eng. Ind. Aerodyn. 2020, 200, 104142. [Google Scholar] [CrossRef]
  9. Solari, G.; Repetto, M.P.; Burlando, M.; De Gaetano, P.; Pizzo, M.; Tizzi, M.; Parodi, M. The Wind Forecast for Safety Management of Port Areas. J. Wind Eng. Ind. Aerodyn. 2012, 104–106, 266–277. [Google Scholar] [CrossRef]
  10. Repetto, M.P.; Burlando, M.; Solari, G.; De Gaetano, P.; Pizzo, M.; Tizzi, M. A Web-Based GIS Platform for the Safe Management and Risk Assessment of Complex Structural and Infrastructural Systems Exposed to Wind. Adv. Eng. Softw. 2018, 117, 29–45. [Google Scholar] [CrossRef]
  11. Letchford, C.W.; Chay, M.T. Pressure Distributions on a Cube in a Simulated Thunderstorm Downburst. Part B: Moving Downburst Observations. J. Wind Eng. Ind. Aerodyn. 2002, 90, 733–753. [Google Scholar] [CrossRef]
  12. Xu, Z.; Hangan, H. Scale, Boundary and Inlet Condition Effects on Impinging Jets. J. Wind Eng. Ind. Aerodyn. 2008, 96, 2383–2402. [Google Scholar] [CrossRef]
  13. McConville, A.C.; Sterling, M.; Baker, C.J. The Physical Simulation of Thunderstorm Downbursts Using an Impinging Jet. Wind Struct. 2009, 12, 133–149. [Google Scholar] [CrossRef] [Green Version]
  14. Hangan, H.; Refan, M.; Jubayer, C.; Romanic, D.; Parvu, D.; LoTufo, J.; Costache, A. Novel Techniques in Wind Engineering. J. Wind Eng. Ind. Aerodyn. 2017, 171, 12–33. [Google Scholar] [CrossRef]
  15. Wood, G.S.; Kwok, K.C.S.; Motteram, N.A.; Fletcher, D.F. Physical and Numerical Modelling of Thunderstorm Downbursts. J. Wind Eng. Ind. Aerodyn. 2001, 89, 535–552. [Google Scholar] [CrossRef]
  16. Chay, M.T.; Letchford, C.W. Pressure Distributions on a Cube in a Simulated Thunderstorm Downburst—Part A: Stationary Downburst Observations. J. Wind Eng. Ind. Aerodyn. 2002, 90, 711–732. [Google Scholar] [CrossRef]
  17. Sengupta, A.; Sarkar, P.P. Experimental Measurement and Numerical Simulation of an Impinging Jet with Application to Thunderstorm Microburst Winds. J. Wind Eng. Ind. Aerodyn. 2008, 96, 345–365. [Google Scholar] [CrossRef]
  18. Mason, M.S.; James, D.L.; Letchford, C.W. Wind Pressure Measurements on a Cube Subjected to Pulsed Impinging Jet Flow. Wind Struct. 2009, 12, 77–88. [Google Scholar] [CrossRef]
  19. Junayed, C.; Jubayer, C.; Parvu, D.; Romanic, D.; Hangan, H. Flow Field Dynamics of Large-Scale Experimentally Produced Downburst Flows. J. Wind Eng. Ind. Aerodyn. 2019, 188, 61–79. [Google Scholar] [CrossRef]
  20. Romanic, D.; LoTufo, J.; Hangan, H. Transient Behavior in Impinging Jets in Crossflow with Application to Downburst Flows. J. Wind Eng. Ind. Aerodyn. 2019, 184, 209–227. [Google Scholar] [CrossRef]
  21. Holmes, J.D.; Hangan, H.M.; Schroeder, J.L.; Letchford, C.W.; Orwig, K.D. A Forensic Study of the Lubbock-Reese Downdraft of 2002. Wind Struct. 2008, 11, 137–152. [Google Scholar] [CrossRef]
  22. Chay, M.T.; Albermani, F.; Wilson, R. Numerical and Analytical Simulation of Downburst Wind Loads. Eng. Struct. 2006, 28, 240–254. [Google Scholar] [CrossRef] [Green Version]
  23. Kim, J.; Hangan, H. Numerical Simulations of Impinging Jets with Application to Downbursts. J. Wind Eng. Ind. Aerodyn. 2007, 95, 279–298. [Google Scholar] [CrossRef]
  24. Abd-Elaal, E.-S.; Mills, J.E.; Ma, X. Empirical Models for Predicting Unsteady-State Downburst Wind Speeds. J. Wind Eng. Ind. Aerodyn. 2014, 129, 49–63. [Google Scholar] [CrossRef]
  25. Fujita, T.T. Tornadoes and Downbursts in the Context of Generalized Planetary Scales. J. Atmospheric Sci. 1981, 38, 1511–1534. [Google Scholar] [CrossRef] [Green Version]
  26. Fujita, T.T. The Downburst—Microburst and Macroburst—Report of Projects NIMROD and JAWS; Satellite and Mesometereology Research Project, Dept. of the Geophysical Sciences, University of Chicago, 1985. Available online: http://pi.lib.uchicago.edu/1001/cat/bib/684175 (accessed on 6 January 2020).
  27. Burlando, M.; Romanić, D.; Solari, G.; Hangan, H.; Zhang, S. Field Data Analysis and Weather Scenario of a Downburst Event in Livorno, Italy, on 1 October 2012. Mon. Weather Rev. 2017, 145, 3507–3527. [Google Scholar] [CrossRef]
  28. Bray, D.; Knowles, K. Numerical Modeling of an Impinging Jet in Cross-Flow. In Proceedings of the 26th Joint Propulsion Conference, Orlando, FL, USA, 16–18 July 1990. [Google Scholar]
  29. Barata, J.M.M.; Durào, D.F.G.; Heitor, M.V.; McGuirk, J.J. The Turbulence Characteristics of a Single Impinging Jet through a Crossflow. Exp. Therm. Fluid Sci. 1992, 5, 487–498. [Google Scholar] [CrossRef]
  30. Barata, J.M.M.; Durão, D.F.G. Laser-Doppler Measurements of Impinging Jet Flows through a Crossflow. Exp. Fluids 2004, 36, 665–674. [Google Scholar] [CrossRef]
  31. Mason, M.S.; Fletcher, D.F.; Wood, G.S. Numerical Simulation of Idealised Three-Dimensional Downburst Wind Fields. Eng. Struct. 2010, 32, 3558–3570. [Google Scholar] [CrossRef]
  32. Canepa, F. Physical Investigation of Downburst Winds and Applicability to Full Scale Events. Doctoral Thesis, University of Genoa, Genoa, Italy, Western University, London, ON, Canada, 2022. [Google Scholar]
  33. Richter, A.; Ruck, B.; Mohr, S.; Kunz, M. Interaction of Severe Convective Gusts with a Street Canyon. Urban Clim. 2018, 23, 71–90. [Google Scholar] [CrossRef]
  34. Romanic, D.; Hangan, H. The Interplay Between Background Atmospheric Boundary Layer Winds and Downburst Outflows. A First Physical Experiment. In Proceedings of the XV Conference of the Italian Association for Wind Engineering; Ricciardelli, F., Avossa, A.M., Eds.; Springer International Publishing: Cham, Switzerland, 2019; Volume 27, pp. 652–664. ISBN 978-3-030-12814-2. [Google Scholar]
  35. Romanic, D.; Hangan, H. Experimental Investigation of the Interaction between Near-Surface Atmospheric Boundary Layer Winds and Downburst Outflows. J. Wind Eng. Ind. Aerodyn. 2020, 205, 104323. [Google Scholar] [CrossRef]
  36. Romanic, D.; Nicolini, E.; Hangan, H.; Burlando, M.; Solari, G. A Novel Approach to Scaling Experimentally Produced Downburst-like Impinging Jet Outflows. J. Wind Eng. Ind. Aerodyn. 2020, 196, 104025. [Google Scholar] [CrossRef]
  37. Behnia, M.; Parneix, S.; Shabany, Y.; Durbin, P.A. Numerical Study of Turbulent Heat Transfer in Confined and Unconfined Impinging Jets. Int. J. Heat Fluid Flow 1999, 20, 1–9. [Google Scholar] [CrossRef]
  38. Romanic, D.; Chowdhury, J.; Chowdhury, J.; Hangan, H. Investigation of the Transient Nature of Thunderstorm Winds from Europe, the United States, and Australia Using a New Method for Detection of Changepoints in Wind Speed Records. Mon. Weather Rev. 2020, 148, 3747–3771. [Google Scholar] [CrossRef]
  39. Wakimoto, R.M. The Life Cycle of Thunderstorm Gust Fronts as Viewed with Doppler Radar and Rawinsonde Data. Mon. Weather Rev. 1982, 110, 1060–1082. [Google Scholar] [CrossRef] [Green Version]
  40. Canepa, F.; Burlando, M.; Romanic, D.; Solari, G.; Hangan, H. Downburst-like Experimental Measurements of Two Vertical-Axis Impinging Jets at the WindEEE Dome. PANGAEA 2021. [Google Scholar] [CrossRef]
  41. Lombardo, F.T.; Smith, D.A.; Schroeder, J.L.; Mehta, K.C. Thunderstorm Characteristics of Importance to Wind Engineering. J. Wind Eng. Ind. Aerodyn. 2014, 125, 121–132. [Google Scholar] [CrossRef]
  42. Alahyari, A.; Longmire, E.K. Dynamics of Experimentally Simulated Microbursts. AIAA J. 1995, 33, 2128–2136. [Google Scholar] [CrossRef]
  43. Zhang, S.; Solari, G.; De Gaetano, P.; Burlando, M.; Repetto, M.P. A Refined Analysis of Thunderstorm Outflow Characteristics Relevant to the Wind Loading of Structures. Probabilistic Eng. Mech. 2018, 54, 9–24. [Google Scholar] [CrossRef]
  44. Zhang, S.; Solari, G.; Burlando, M.; Yang, Q. Directional Decomposition and Properties of Thunderstorm Outflows. J. Wind Eng. Ind. Aerodyn. 2019, 189, 71–90. [Google Scholar] [CrossRef]
  45. Gauntner, J.W.; Livingood, J.N.B.; Hrycak, P. Survey of Literature on Flow Characteristics of a Single Turbulent Jet Impinging on a Flat Plate; NASA Lewis Research Center: Cleveland, OH, USA, 1970; p. 46. [Google Scholar]
  46. Gogineni, S.; Shih, C. Experimental Investigation of the Unsteady Structure of a Transitional Plane Wall Jet. Exp. Fluids 1997, 23, 121–129. [Google Scholar] [CrossRef]
  47. Alcântara Pereira, L.A.; de Oliveira, M.A.; de Moraes, P.G.; Bimbato, A.M. Numerical Experiments of the Flow around a Bluff Body with and without Roughness Model near a Moving Wall. J. Braz. Soc. Mech. Sci. Eng. 2020, 42, 129. [Google Scholar] [CrossRef]
  48. Mimeau, C.; Mortazavi, I. A Review of Vortex Methods and Their Applications: From Creation to Recent Advances. Fluids 2021, 6, 68. [Google Scholar] [CrossRef]
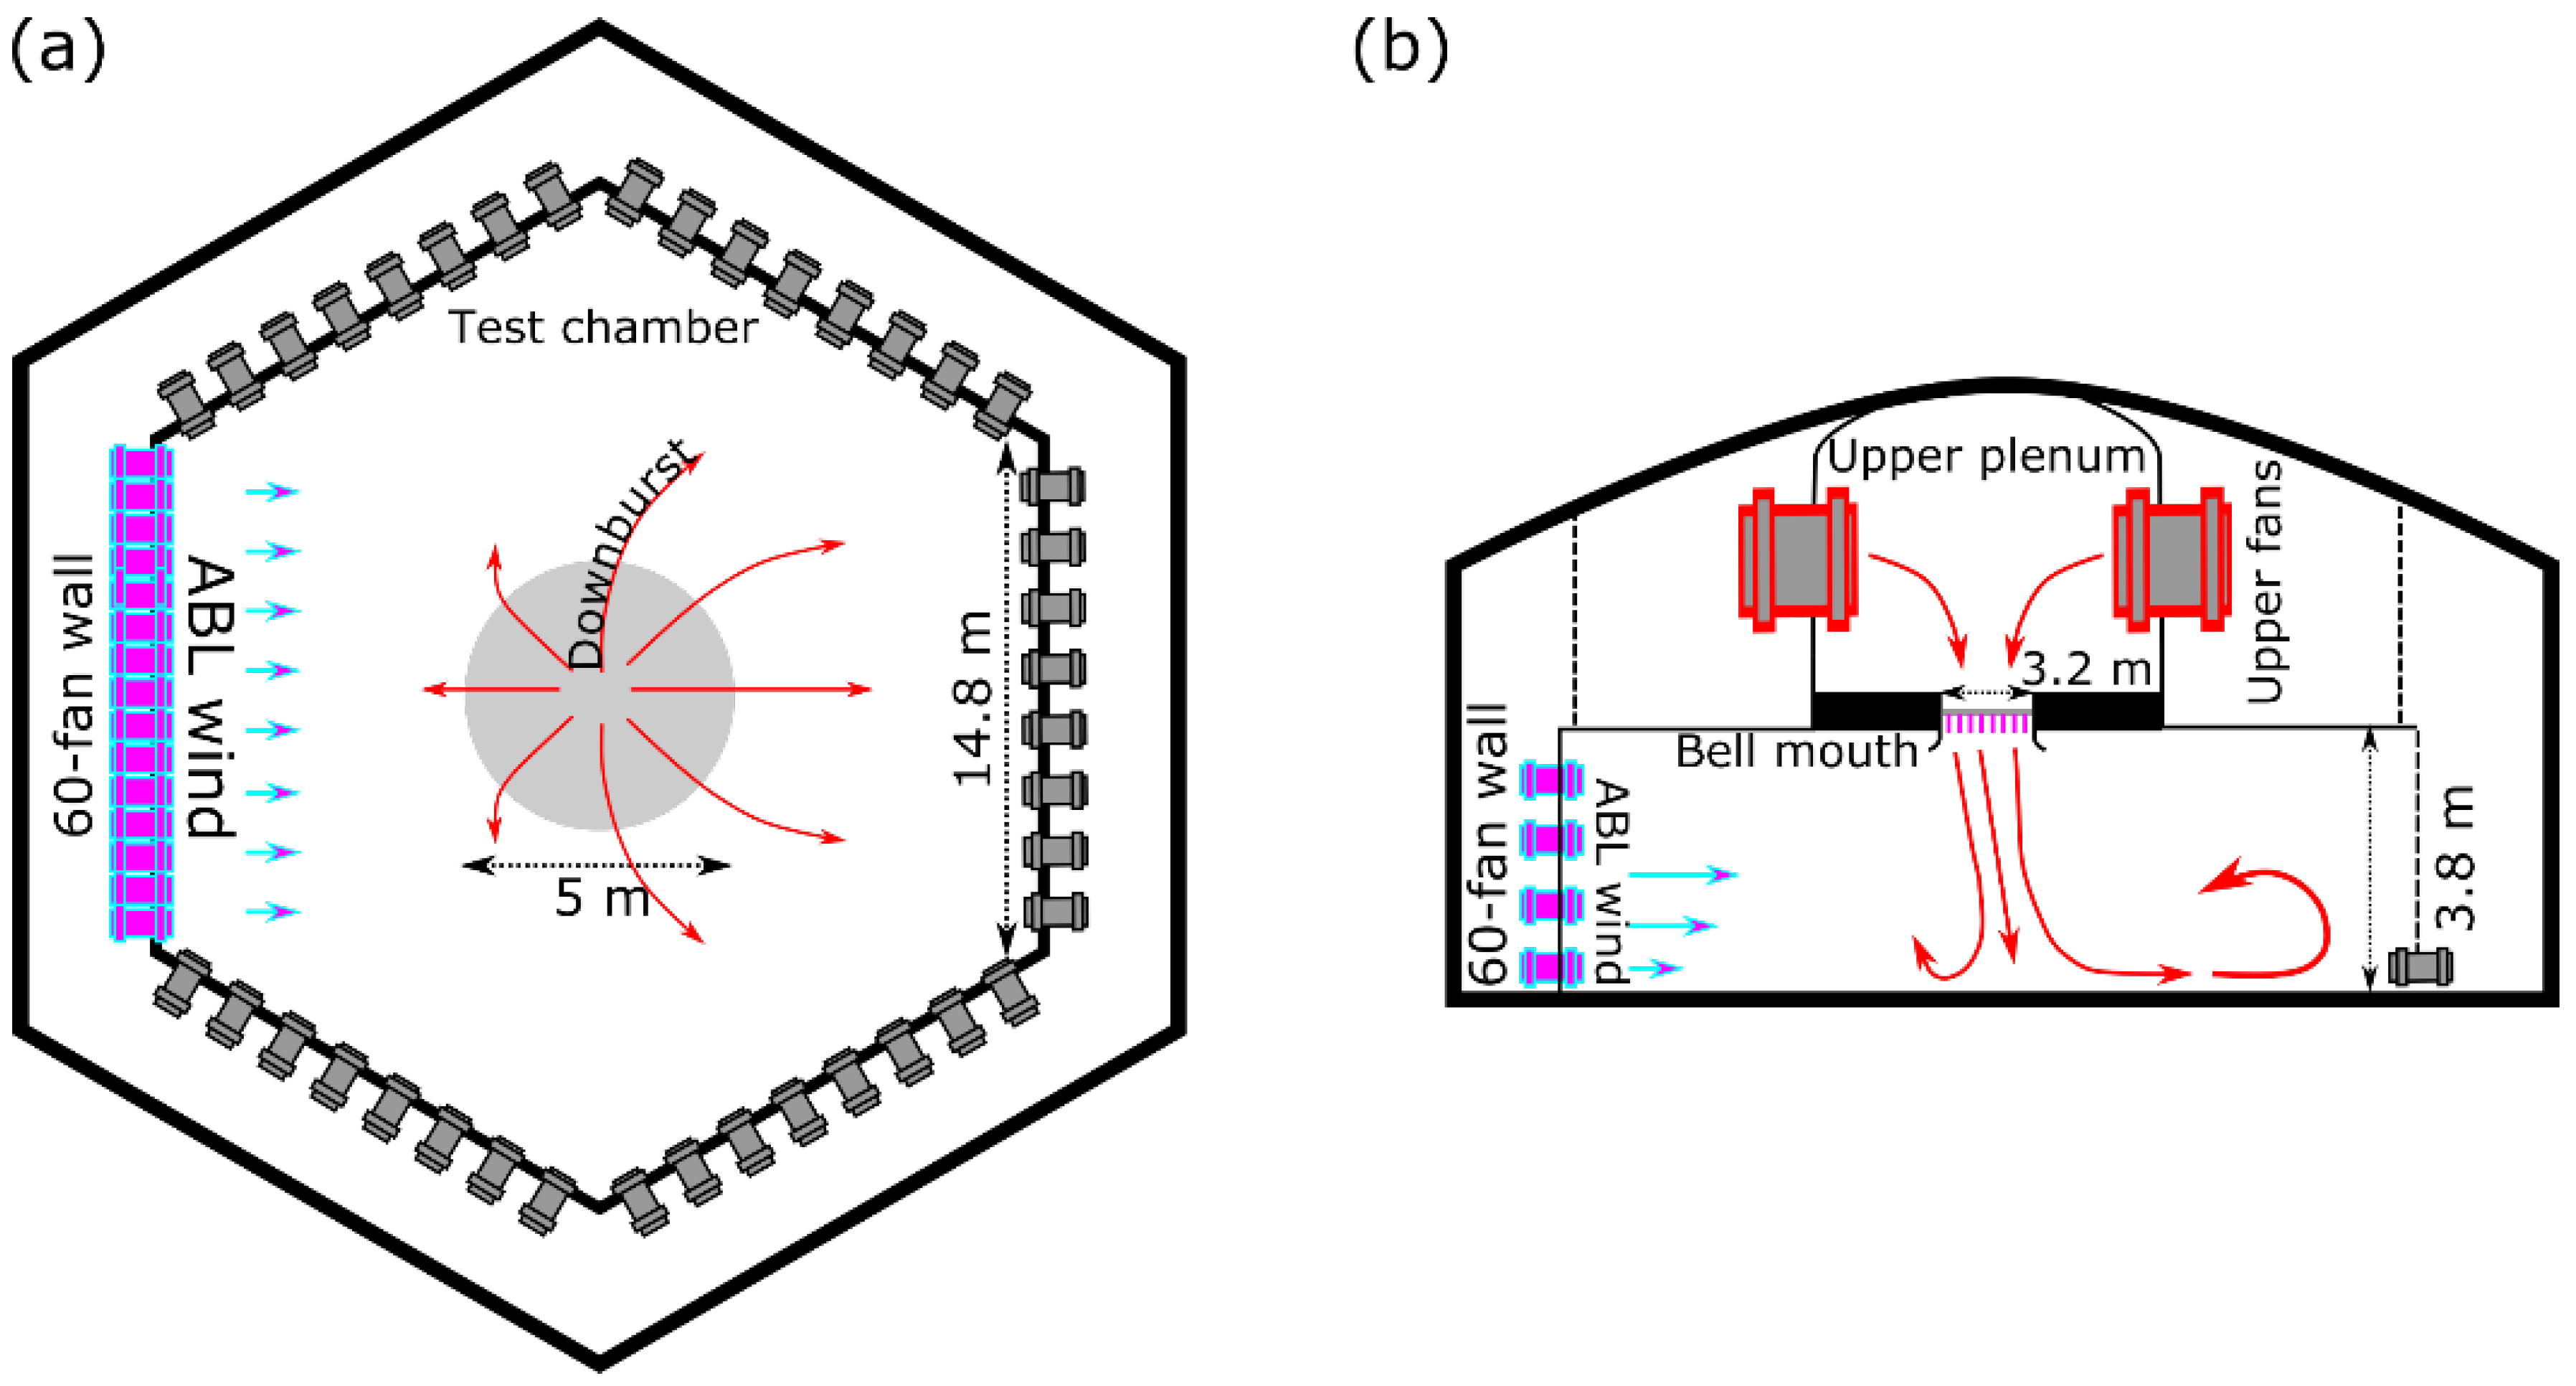
Figure 1. DB in ABL wind mode in the WindEEE Dome: (a) Top and (b) side views.
Atmosphere 13 00621 g001
Figure 2. (a) Top- and (b) side-view schematics of the experimental setup with an indication of the positive direction of the three-wind speed components; (c) WindEEE testing chamber during recording at position ( α = 120 ° , r / D = 1.4 ) with measuring Cobra probes’ mast in red circle; (d) zoom-in on the Cobra probes’ mast.
Atmosphere 13 00621 g002
Figure 3. ABL-like wind speed vertical profiles at each azimuth and radial position of measurement (aj) for the case of DABL3.0. Wind speed is normalized by V ABL (Table 1) while height is normalized by z max = 0.10   m .
Atmosphere 13 00621 g003
Figure 4. Ten-repetition ensemble mean of (a) DB-like slowly-varying mean wind speed time series and (18) vertical profiles at r / D = 1.0 . Slowly-varying mean wind speed V ¯ is normalized by its maximum value V ¯ max , while height is normalized by z max = 0.10   m .
Atmosphere 13 00621 g004
Figure 5. Wind speed time series of the DB-like outflow for DBABL5.0 (blue) and DBABL3.0 (red) cases at r / D = 1.0 , z / z max = 0.4 ,   1.0 ,   3.0 and α = 0 ° ,   90 ° , 180 ° . Thick lines and error bars represent the ensemble mean and standard deviation of the 10 repetitions, respectively.
Atmosphere 13 00621 g005
Figure 6. Downburst outflow field at z / z max = 1.0 (horizontal plane r α ) and t = 1.67   s (a,d), 1.74   s (b,e) and 2.88   s (c,f) for DBABL5.0 (ac) and DBABL3.0 (df) cases. Black spots identify regions where wind speed is below 1   m   s 1 (not considered due to accuracy of probes). Red vectors represent the actual punctual measurements of Cobra probes.
Atmosphere 13 00621 g006
Figure 7. Schematics of the DB–ABL interaction and entrainment of ABL flow into the PV (vertical plane as seen from α = 270°). +/− indicate the sign of vorticity. S is the saddle point where the flow possibly diverges and the SV onsets.
Atmosphere 13 00621 g007
Figure 8. Same as Figure 6, but in the vertical plane r z only at t = 1.74   s and for α = 0 ° (a,d), 90 ° (b,e) and 180 ° (c,f).
Atmosphere 13 00621 g008
Figure 9. Case DBABL3.0: (a) Time history of the slowly-varying mean wind speed at α = 90 ° , r / D = z / z max = 1.0 ; (b) gust front between downburst and ABL outflows (colored lines): for each α , position r / D where wind speed decreases by 30% or more compared to the same r / D at the previous α (counterclockwise). ABL is here directed from the top.
Atmosphere 13 00621 g009
Figure 10. Downburst outflow wind speeds as a function of r / D at α = 0 ° ,   30 ° ,   60 ° , 90 ° , t = 1.28   s ,   1.44   s ,   1.68   s ,   1.76   s ,   1.92   s ,   2.24   s ,   2.72   s ,   3.36   s (ah) and z / z max = 1.0 for DBABL3.0 case.
Atmosphere 13 00621 g010
Figure 11. Primary vortex (PV) convective velocity, normalized to U PV max at each azimuthal location α , in the case of DBABL5.0 and z / z max = 1.0 .
Atmosphere 13 00621 g011
Figure 12. Profiles of V ¯ z , t at α = 0 ° ,   90 ° , 180 ° and r / D = 0.6 ,   1.0 ,   1.4 ,   1.8 for DBABL3.0. V ¯ is normalized by the maximum wind speed over the entire flow V ¯ max .
Atmosphere 13 00621 g012
Figure 13. Ensemble averages of 10 time series (experiment repetitions) of the height of maximum wind speed z V ¯ max , normalized by z max = 0.1   m , at α = 0 ° ,   90 ° and 18 0 ° and r / D 1 for DBABL5.0 (black dotted line), DBABL3.0 (red dotted line) and isolated vertical DB (green dotted line) cases. Orange dotted lines show the ensemble average of the 10 slowly-varying mean wind speed repetitions at z / z max = 1.0 in the case of DBABL3.0. Vertical gray dotted lines show t V ¯ max .
Atmosphere 13 00621 g013
Figure 14. Ensemble averages of 10 time series (experiment repetitions) of μ at α = 0 ° ,   90 ° and 1080 ° , r / D 1 and z / z max = 0.7 ,     1.5 ,     3.0 and 7.0 for the DBABL3.0 case. Orange dotted lines show the ensemble average of the 10 mean wind speed repetitions at z / z max = 1.0 in the case of DBABL3.0. Vertical gray dotted lines show t V ¯ max .
Atmosphere 13 00621 g014
Figure 15. Profiles of I V z , t at α = 0 ° ,   90 ° , 180 ° and r / D = 0.6 ,   1.0 ,   1.4 ,   1.8 for DBABL3.0.
Atmosphere 13 00621 g015
Figure 16. Ensemble averages of 10 time series (experiment repetitions) of the height of maximum turbulence intensity z I V max , normalized by z max = 0.1   m , at α = 0 ° ,   90 ° and 18 0 ° and r / D 1 for DBABL5.0 (black dotted line), DBABL3.0 (red dotted line) and isolated vertical DB (green dotted line) cases. Orange dotted lines show the ensemble average of the 10 mean wind speed repetitions at z / z max = 1.0 in the case of DBABL3.0. Vertical gray dotted lines show t V ¯ max .
Atmosphere 13 00621 g016
Figure 17. DBABL3.0 case: Vertical profiles of the mean slowly-varying turbulence intensity I ¯ V at the seven azimuthal α locations and for r / D 0.6 .
Atmosphere 13 00621 g017
Table 1. Experiment setups: Case name; Jet diameter ( D ); Jet velocity ( V jet ); Straight flow velocity ( V ABL ); Azimuthal locations ( α ); Radial locations ( r / D ); Cobra probe heights ( z / z max ); Repetitions per experiment (Reps). The ditto mark (“) indicates that Cobra probe heights are to be considered the same as the case above. IJ identifies the probes facing jet touchdown, and SF identifies those facing incoming ABL direction.
CaseD
[m]
Vjet
[m s−1]
VABL
[m s−1]
α
[°]
r/D
[/]
z/zmax
[m]
Reps
DBABL5.03.212.42.50:30:1800.2:0.2:2 30 °   α 180 ° :
0.4, 0.7, 1.0, 1.25, 1.5, 3.0, 5.0, 7.0 (IJ)
0.4, 1.0, 3.0, 5.0 (SF)
α = 0 ° :
0.4, 0.7, 1.0, 1.25, 1.5, 2.0, 3.0, 4.0, 7.0 (IJ)
α = 180 ° :
0.4, 0.7, 1.0, 1.25, 1.5, 2.0, 3.0, 4.0, 5.0, 7.0, 10.0 (IJ)
10
DBABL3.03.211.83.90:30:180 0.2:0.2:210
Table 2. Reynolds numbers of DB- and ABL-like flows.
Case R e = V   L ν   *  
DBABL5.0 (DB-like flow)2.7 × 10⁶
DBABL5.0 (ABL-like flow)6.4 × 10⁵
DBABL3.0 (DB-like flow)2.6 × 10⁶
DBABL3.0 (ABL-like flow)1.0 × 10⁶
DBABL3.0 (DBABL-like flow)1.4 × 10⁵
* V = Vjet and L = D for DB-like flow; V = V ABL and L = H for ABL-like flow; V = V max (maximum slowly-varying mean wind speed over the entire flow) and L = z max for DBABL-like flow; ν = 1.48 × 10⁻⁵ m2 s−1 is the kinematic viscosity.
Table 3. Cobra probe instrument settings and uncertainties of measurements.
Acquisition frequency2500 Hz
Cut-off frequency factor0.5
Cut-off frequency250 Hz
Accuracy of velocity measurements± 0.5 m s−1 *
Accuracy of yaw and pitch angles± 1° *
Measurement cone of incoming flow± 45° **
* up to 30% turbulence intensity, ** with respect to the Cobra probes’ main axis.
Publisher’s Note: MDPI stays neutral with regard to jurisdictional claims in published maps and institutional affiliations.