Article

A Numerical Study for Tropical Cyclone Atsani (2020) Past Offshore of Southern Taiwan under Topographic Influences

1
Department of Atmospheric Sciences, National Central University, Taoyuan City 320317, Taiwan
2
Department of Atmospheric Sciences, National Taiwan University, Taipei 10617, Taiwan
3
Research and Development Center, Central Weather Bureau, Taipei 100006, Taiwan
4
GPS Science and Application Research Center, National Central University, Taoyuan City 320317, Taiwan
*
Author to whom correspondence should be addressed.
Atmosphere 2022, 13(4), 618; https://doi.org/10.3390/atmos13040618
Submission received: 2 March 2022 / Revised: 29 March 2022 / Accepted: 6 April 2022 / Published: 12 April 2022
(This article belongs to the Special Issue Typhoon/Hurricane Dynamics and Prediction)

Abstract

:
Tropical Cyclone Atsani occurred in late October 2020 and moved westward offshore south of Taiwan. During its offshore passage, the cyclone deflects northward as it closes to the southern end of Taiwan. A global model MPAS at a multi-resolution of 60-15-3-km is applied to explore the track responses of Atsani and identify the topographic effects of the Central Mountain Range (CMR) on the cyclone circulation and the associated track deflection. With a 3-km resolution targeted at the Taiwan area, the cyclone track deflection can be reasonably simulated, with more sensitivity to physics schemes and dynamic vortex initialization and less sensitivity to initial environmental perturbations. When the Taiwan terrain is removed, the cyclone indeed deflects more northward earlier, in particular for simulations with a stronger cyclone that tends to generate stronger east-west wind asymmetry in the absence of the terrain. Idealized simulations with a regional model WRF at 3-km resolution are also utilized to contrast the track deflection of different departing cyclones, similar to the real case. It was found that northward deflection will be induced near south of the CMR-like terrain for both stronger and weaker westbound cyclones departing at different latitudes south of the terrain. We have explained why a further northward track at earlier stages is induced in the absence of the terrain effects in regard to model initial states. In both real and idealized cases, the track deflection of the cyclone moving around the terrain is dominated by the wavenumber-one horizontal potential vorticity (PV) advection that is somewhat offset by both vertical PV advection and differential diabatic heating.

1. Introduction

The topographic effects of the Central Mountain Range (CMR) in Taiwan on impinging typhoons have been highlighted in the past. The CMR peaks at 3.5 km and stretches about 300 km long and 100 km wide, roughly in a north-south orientation. These effects, as summarized by a review article by Wu and Kuo [1], have been emphasized on the track changes, in addition to the topographic rainfall that can be enhanced during the passage of approaching typhoons with or without a landfall. Analysis of historical typhoon tracks near the Taiwan area in 1951–2015 shows a great variety of the paths that are somewhat modulated by the CMR, although not significantly [2]. According to the observational statistics, the rainfall amounts associated with the typhoons impinging on Taiwan are greatly related to both the tracks and moving speeds of the typhoons ([3]). Understanding of the variability of the typhoon tracks near the CMR, however, remains quite limited in terms of observational information. A number of numerical studies have been devoted to investigating the track variations associated with approaching typhoons in response to the topographic effects of the CMR or similar idealized terrain (e.g., [4,5,6,7,8,9,10,11,12,13,14,15,16,17,18,19,20,21]). Based on horizontal resolution of 60 km, Chang [4] first identified the cyclonic curvature path of the westbound cyclone past the central portion of a CMR-like terrain, leading to a northward turn before landfall. Such a northward track has been well explored in other idealized simulations at 45-km horizontal resolution for similar departing tropical cyclones (e.g., [6]). The approaching westbound cyclones may still deflect slightly northward at upstream, but can be significantly southward near landfall at the central-northern portion of the CMR or idealized CMR-like terrain when higher horizontal resolution down to 10 km or smaller is applied (e.g., [8,15,17,19,21]). The southward turning of a westbound cyclone can be attributed to the channeling effects of northerly flow ahead of the mountain base in combination with the mid-tropospheric flow acceleration over the terrain ([16,19]).
For westbound cyclones past a mesoscale mountain range, the upstream track deflection is found to be controlled by the dominant factor R/Ly as the nondimensional vortex size with Ly (the mountain length scale in the direction normal to the vortex movement) and R (the radius of maximum tangential wind of the initial vortex), which are among potential parameters including Lx (the mountain length scale in the direction of the vortex movement), h (the mountain height), U (the basic flow speed), Vmax (the maximum tangential wind of the initial vortex), and N (environmental stability frequency), based on systematic experiments ([10,11]). The basic-flow Froude number (U/Nh) was found to play no major role in the direction of track deflection, but significantly influenced the degree of the deflection (e.g., [11,19]). Due to the dominance of a small R/Ly, very intense westbound cyclones tend to deflect southward when closing to the central or southern portion of the idealized terrain based on simulations with 3-km resolution ([21]). When R/Ly becomes smaller, stronger terrain blocking tends to be induced ahead of the steep slope and thus leads to a southward deflection in response to the intense northerly wind west of the vortex center. However, the upstream track of such westbound or northwest-bound cyclones may get deflected northward ahead of the terrain as it closes towards the southern terrain when the cyclone intensity is not so intense (e.g., [18]).
As northwest-bound cyclones move offshore south of the Taiwan terrain, the track deflection is weaker when upstream of the southern terrain but becomes much stronger and northward when the cyclone moves closer to the south of the terrain (e.g., [18]). When the approaching point is closer to the southern end of Taiwan, the landfalling cyclone will tend to move northward after passing over the CMR. Such a track response as exhibited from idealized simulations has also been found in real-case simulations for the west-northwest-bound Nepartak (2016) that made landfall in southeastern Taiwan and then moved somewhat northward after passing over the southern CMR. These results indicate that such cyclones can move closer to or even over the southwestern plain of Taiwan, which could cause a warning of severe disasters for southern Taiwan.
Issuing such a warning for southern Taiwan may be better determined if the approaching cyclones will not deflect northward with clustered tracks, e.g., at a rather large departure distance of LD from the central terrain latitude. Thus, in addition to the factor R/Ly for westbound to northwest-bound typhoons toward the CMR, the meridional departure is also an important factor that affects the typhoon circulation as modulated by the topographic effects of the CMR. Such track behavior may be viewed as “terrain clustering of tracks” for favorable typhoons. There have been several illustrative observed examples with such downstream terrain clustering of the tracks, but only for westbound to northwest-bound cyclones toward the CMR. Tropical Cyclone Atsani (2020) is a great example that also exhibited an appreciable northward track deflection after passing offshore around the southern end of Taiwan. According to the historical observations, such a cyclone was rare and thus provides a unique opportunity to understand the track predictability and the involved vortex dynamics in interaction with the topographic effect of the CMR, presumably leading to a northward deflection southwest of Taiwan. As shown in Figure 1, there were no satisfactory operational forecasts in East Asia, including the Central Weather Bureau (CWB) official forecast, that captured the downwind northward track deflection even only one day before the closing to southern Taiwan. It is a relatively more challenging case to not provide a false alarm due to the ill-captured track. The rainfall intensity over southern Taiwan is closely related to the approximation of the deflected track.
In this study, we will apply a multi-resolution global model, the Model for Prediction Across Scales-Atmosphere (MPAS-A, hereafter MPAS), to simulate Atsani for understanding the track predictability of Atsani and identifying the factors that more affect the track deflection associated with the cyclone. An enhanced resolution zone of 3-km will be targeted in the vicinity of Taiwan for better resolving the terrain and the incoming cyclone, which has been successfully utilized to explore the track defection mechanism of Typhoon Nesat (2017) during landfall at northern Taiwan ([22]). We also apply a regional Advanced Research Weather Research and Forecasting (ARW-WRF, hereafter WRF) Model to compare the track deflection of tropic cyclones past the CMR-like terrain under similar basic flow conditions with a similarity to the real case of Atsani in this study. The idealized WRF simulations help to identify the track deflection mechanisms as explored by the global model simulations that involve a more complex environment [23].
The MPAS model will be briefly described in Section 2, together with the numerical experiments and the Atsani cyclone. For improving the model’s initial vortex structure and intensity from a global data set, dynamic vortex initialization (DVI) has been applied in the numerical experiments of both MPAS and WRF and is briefly described in this section. The simulation results of the experiments are presented and discussed in Section 3. Idealized WRF and a vortex setup will be briefly introduced in Section 3. The simulation results from idealized experiments are also provided in this section to aid in the interpretation of the track responses of Atsani obtained from the global model simulations. Finally, conclusions are given in Section 4.

2. The Model and Experimental Configurations

2.1. MPAS Model

We aim at use of the global model in this study that is MPAS-Atmosphere Version 6.1 ([24]). MPAS adopts an unstructured centroidal Voronoi mesh so that variable horizontal resolution that gradually increases in specific regions of interest can be applied to enhance resolved details of the flow as well as the topography. Use of a 60-15-3 km variable-resolution mesh for MPAS that gradually increases the horizontal resolution of 60 km at the outer region toward a targeted inner region of 3-km resolution [21] has been successfully applied to simulate northwest-bound typhoons passing Taiwan ([22,25]). The highest 3-km resolution region in that study, as shown in Figure 1 of Huang et al. [22], is centered over Taiwan and covers the entire paths of many impinging typhoons. For convenience in application, MPAS defaults have collected the following two suites of physics schemes: the mesoscale-reference suite and the convection-permitting suite (denoted as the M-suite and C-suite, respectively), and both suites have combined different physical parameterization schemes. Based on the simulation results for sixteen typhoons in 2015–2020, the M-suite has somewhat outperformed the C-suite in track prediction ([26]).
For all the experiments in this study, the model initial conditions take the first guess from the National Center for Environmental Prediction (NCEP) Global Data Assimilation System (GDAS) Final (FNL) operational global analysis (0.25° × 0.25°). The MPAS has defaulted a total of 31 vertical levels with a model top at 1 hPa. The sea surface temperature (SST) obtained from the GDAS dataset is kept unchanged during the MPAS forecasts.

2.2. Vortex Initialization

It is often required to reinitialize the model’s initial state obtained from a global data set such as GDAS to improve the intensity and structure of the initial typhoon vortex, which is usually relatively weaker than that from the best track data. We have developed a dynamic vortex initialization (DVI) scheme that takes continuously cycled integration of 1-h in cycle runs that match the intensity of the model typhoon vortex with the best track data, either on the central sea-level pressure (CSLP) or maximum wind speed of the vortex (hereafter Vmax), called P-match or V-match, respectively ([26]). After each cycle, only the 1-h forecasted vortex within a radius of 600-km from the vortex center at the arrival position is reallocated to the best track position, which is the departure position of the vortex at the initial time, and then replaces the original departing vortex. It is more complicated to relocate the arrival vortex and replace the departing vortex over the unstructured grids of MPAS than over the uniform grids of WRF. For the methodology of the DVI, please refer to Huang et al. [26]. Application of the DVI has been shown to greatly improve both intensity and track forecasts of typhoons over the Western North Pacific (WNP) (e.g., [27,28,29,30]). In this study, we also intend to compare the relative performances of MPAS with and without the DVI in forecasts of Tropical Cyclone Atsani.

2.3. Atsani and Numerical Experiments

Atsani originated east of the northern Philippines over the WNP and was categorized as a Tropical Storm at 0800 UTC 29 October 2020 by the Japan Meteorological Agency (JMA). Atsani gradually moved northwestward offshore east of the northern Philippines, but suddenly turned westward to west-northwestward near the latitude of 20° N and then crossed over the Bashi Channel between Taiwan and the northern Philippines with slow intensification. During spin-up as a severe tropical storm, Atsani gradually turned west-northwestward on 4 November, and reached its strongest intensify with CSLP of 982 hPa and Vmax of 28 m s−1 on 5 November, which was regarded as a weak typhoon by CWB or a severe tropical cyclone by JTWC (the Joint Typhoon Warning Center). As shown in Figure 1, several operational forecasts fail to predict the northward track deflection of Atsani when it moves offshore near the southern end of Taiwan.
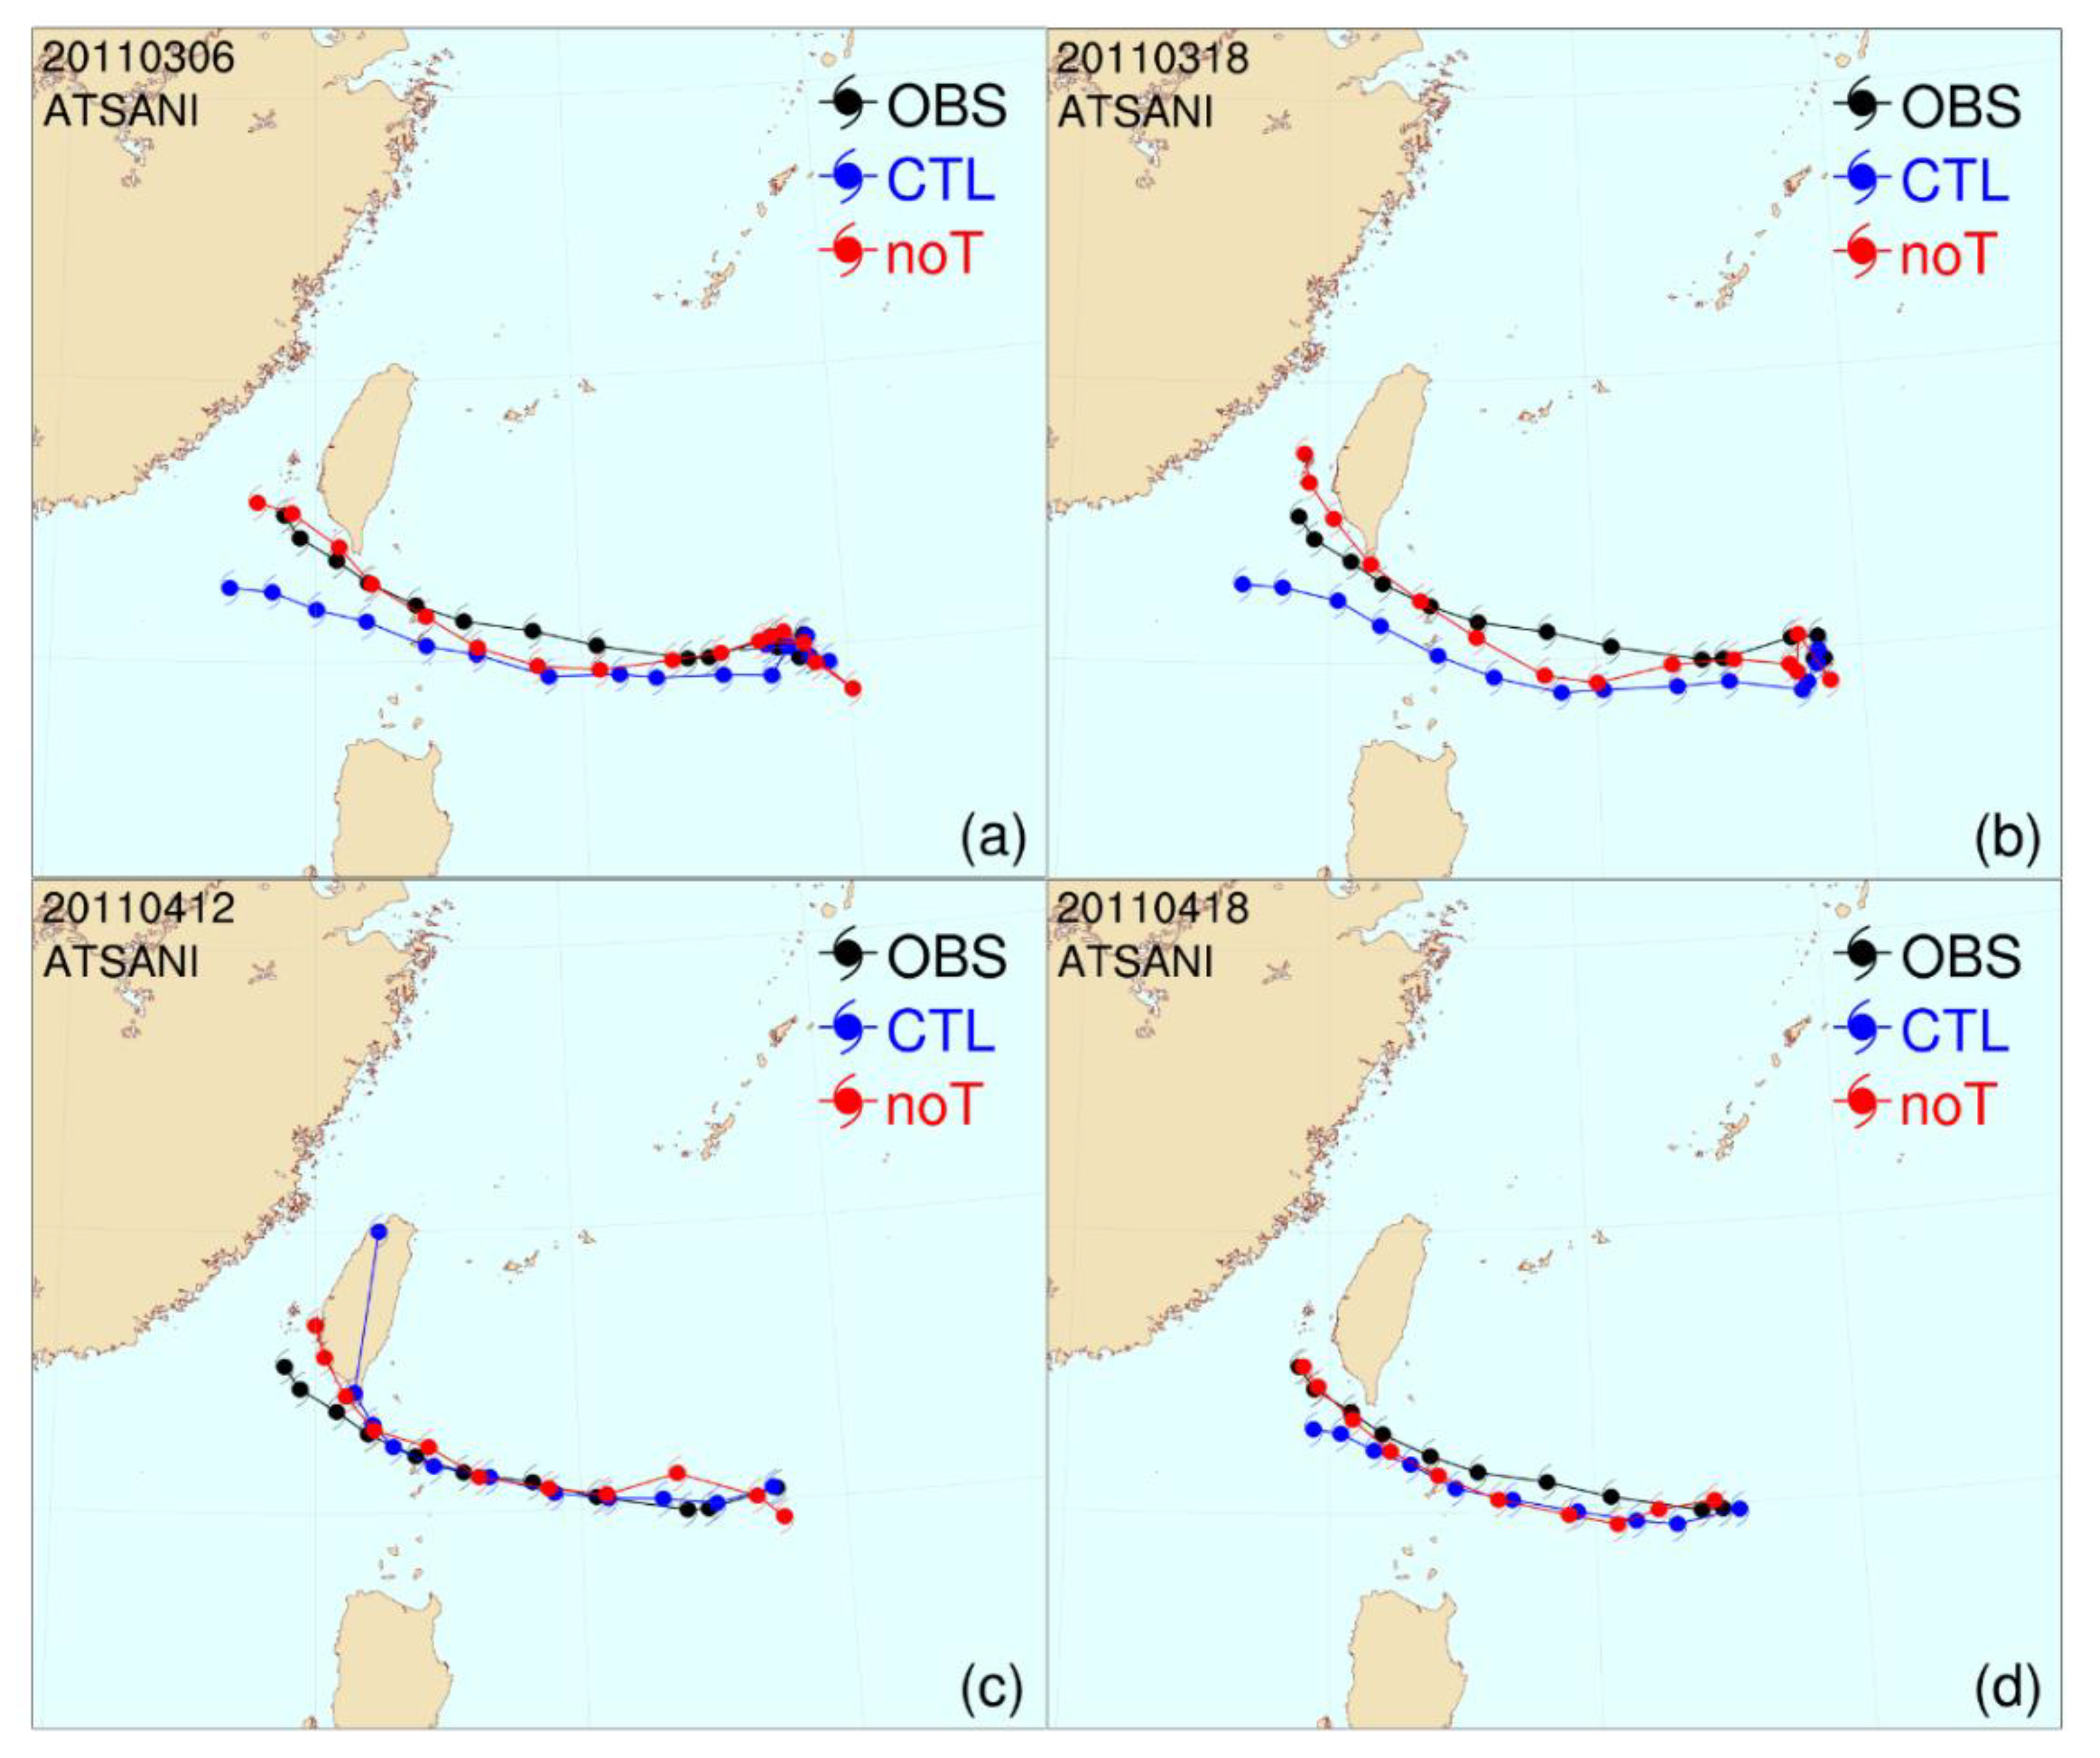
In addition to the CWB official release based on multi-model forecasts, a specially developed version of the WRF model denoted as TWRF (Typhoon WRF), specifically designed in 2010 for TC prediction ([31]), has been executed operationally. For forecast of Atsani, the TWRF experiments employ two nested domains at 15-km and 3-km horizontal resolution, respectively ([32]). The control experiment (CTL) uses the TWRF default settings and physics schemes (see [32]). The terrain-sensitivity experiment, noT, is the same as CTL, except that the entire Taiwan terrain is reset to ocean. Figure 2 shows the TWRF forecasted tracks at different initial times. Clearly, the observed northward track deflection is not well captured for CTL until 1200 UTC 4. It is noted that removal of the Taiwan terrain for noT has resulted in a more northward track deflection closer to Taiwan compared to CTL. At 1200 UTC 4, both cyclones for CTL and noT even landfall at southern Taiwan, but the former has jumped northward over the CMR. This situation is different from the other forecasts at 0600 UTC 3 and 1800 UT 3 associated with earlier splitting tracks between CTL and noT.
In this study, several experiments of MPAS with 60-15-3-km resolution were conducted for Atsani. The forecasts at the initial time of 1200 UTC 4 November are focused as most of the operational forecasts at this time still fail to capture the later track deflection of Atsani. The control experiment (CTL) uses the MPAS default settings but without use of the DVI, while the terrain-sensitivity test, noT, is the same as CTL, except that the entire height of Taiwan terrain is set to zero. Experiments with use of the DVI are conducted, and the name convention for Experiment C7_P indicates that the simulation uses the 7th cycle run in the DVI with P-match (i.e., the vortex intensity reaches the best track intensity on CSLP). For investigation into the sensitivity of model prediction to initial perturbations, the initial state is perturbed by the operational Grid Statistical Interpolation (GSI) system at CWB to provide 10 ensemble members for sensitivity experiments (see [25]). The generated initial ensemble perturbations in general follow Gaussian distributions on each grid point. These tests are intended for illustration of the track sensitivity to the initial perturbations. Experiment C7-5_P is same as C7_P but using the 5th member of the perturbations chosen from C7_P, and C7-5_P_noT is the same as in C7-5_P but without the Taiwan terrain. Sensitivity tests on physics schemes are also conducted and are denoted by their name conventions described in Table 1.

3. Simulation Results

3.1. Track and Intensity Simulations

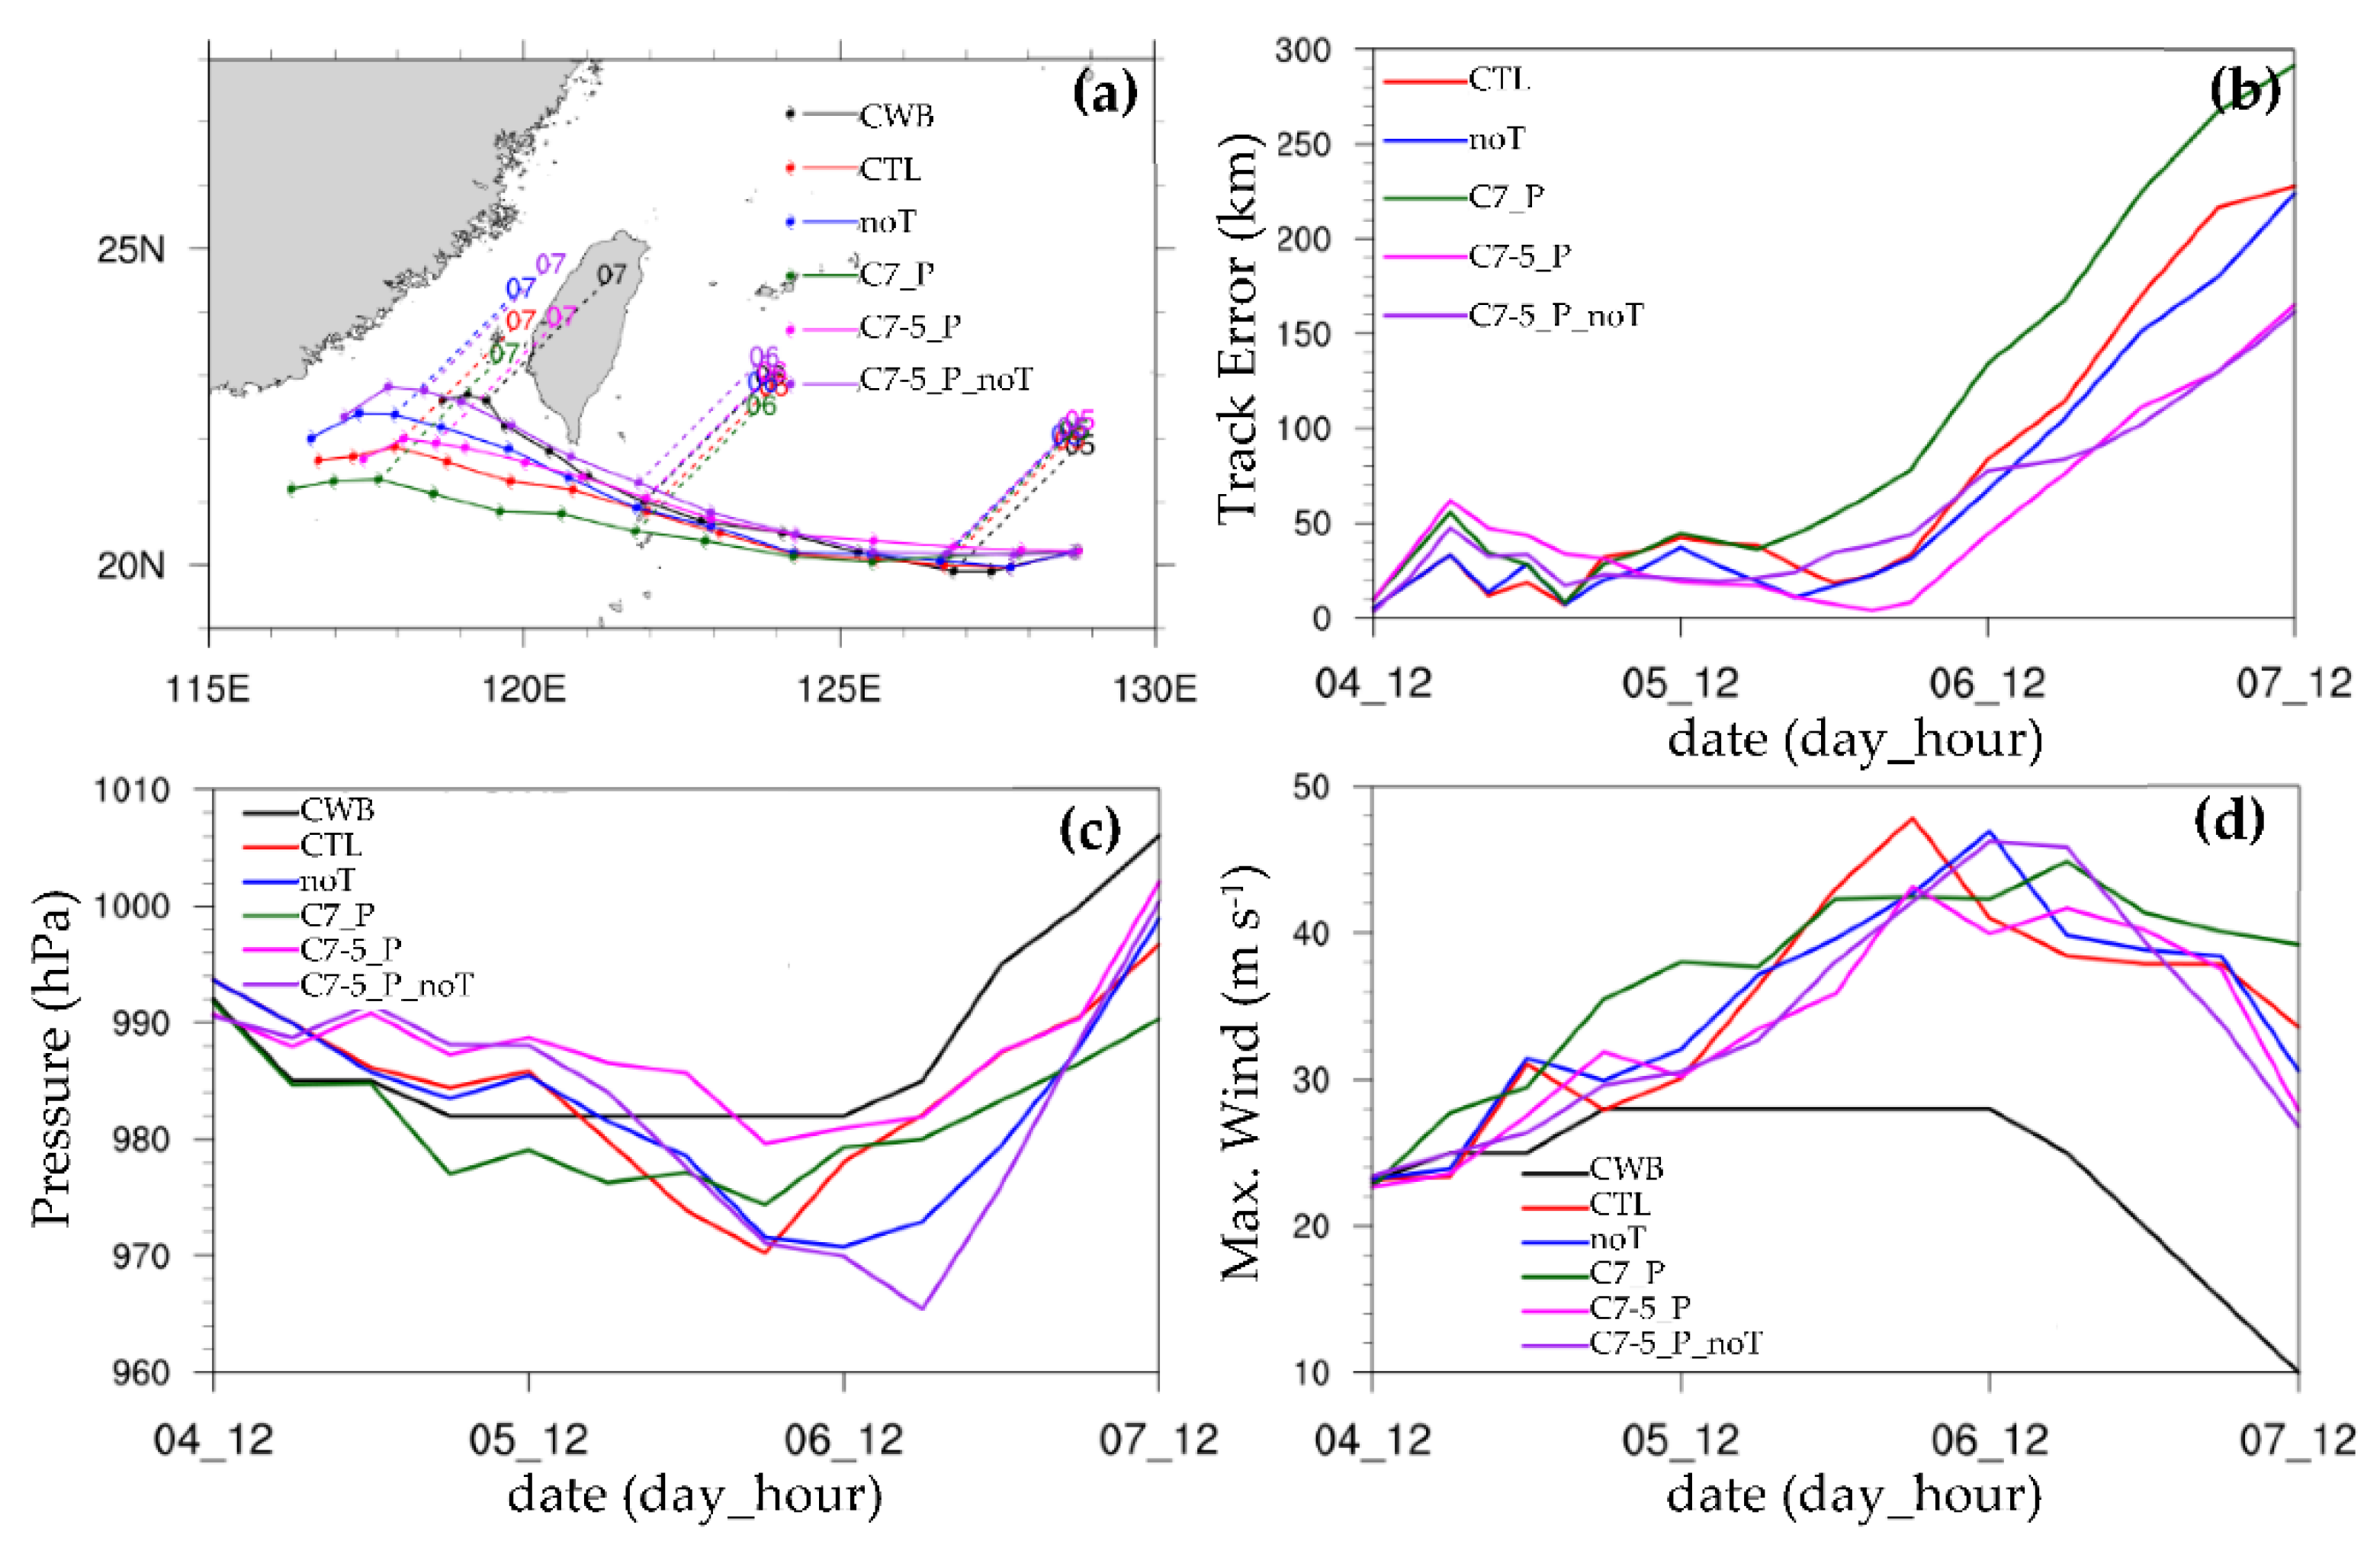
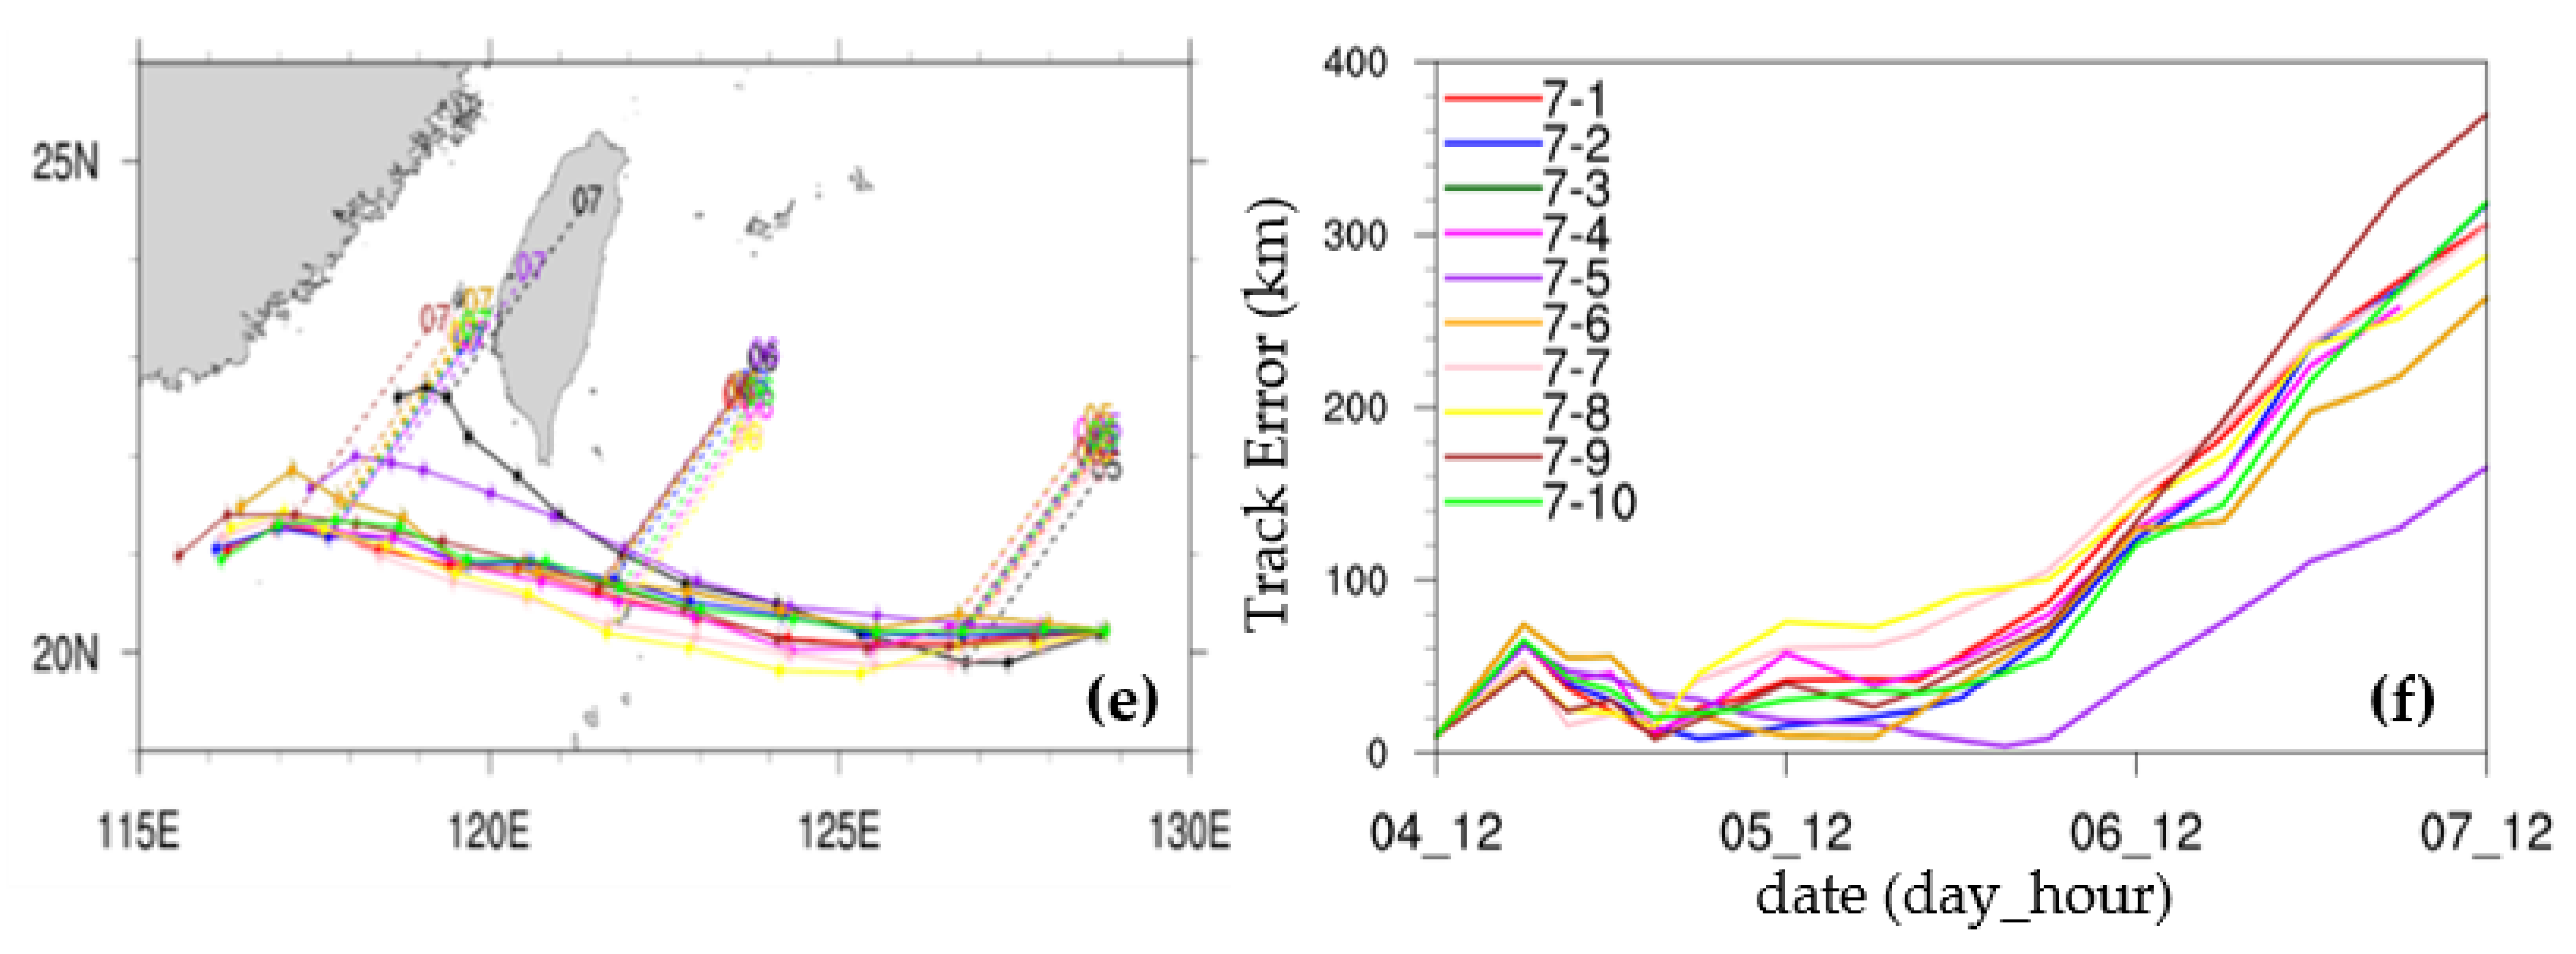
Figure 3a shows the simulated MPAS tracks of Atsani for several experiments. The track for CTL with the initial state without the DVI is quite consistent with the best track of CWB before 0000 UTC 6 November, but mainly west-northwestward afterward with less deflection compared to the observed northwestward track with a more northward deflection. Such a track deviation causes the track errors to increase rapidly to about 100 km at 1200 UTC 6 November when the observed cyclone is closest to the southern end of Taiwan (Figure 3b). Removal of the Taiwan terrain in noT has resulted in a more northward track than CTL from the early stage and gives a large difference of about 50 km at the critical time of 1200 UTC 6 November. Use of the 7th cycle run with P-match for Experiment C7_P leads to a more westward track with the largest deviation and least deflection than both CTL and noT. Experiment C7-5_P, which uses an initial perturbed state of C7_P, obtains a more consistent track with largely reduced errors. Note that both CSLP and Vmax between CTL and noT have intensified after only 6 h, which indicates that a flat surface type or an island-mountain type for Taiwan can have influential effects on the remote cyclone about 800 km away. The initial vortex intensity on CSLP and Vmax for all the experiments with the DVI is only slightly improved after seven cycle runs (Figure 3c,d), since the initial vortex for CTL is already quite close to the best track intensity. Without the Taiwan terrain, a northwestward track with a larger deflection is even simulated in C7-5_P_noT, which is closest to the best track in spite of a slightly faster movement. Thus, the simulated track for C7-5_P_noT is slightly degraded at later stages when compared to that with the terrain included (C7-5_P). All the experiments tend to over-predict the cyclone intensity on CSLP and Vmax (Figure 3c,d) owing to the less deflected vortex cores that are farther away from the topography than the observed. As in CTL and noT, the cyclone intensity for C7-5_P and C7-5_P_noT also starts to deviate from the very early stage. The simulated tracks are somewhat sensitive to the initial perturbations (Figure 3e). Except for the fifth member (C7-5_P) of the ensemble with the more consistent track tendency and smallest track errors by 1200 UTC 6, all the other nine members give similar clustered tracks that are more southward of the best track throughout the forecast (Figure 3e,f). After this time, the track for C7-5_P, however, is not further deflected northward as the observed. Evidently, the largest track errors after the first day have been produced by C7_P, which most over-predicts both CSLP and Vmax near 1200 UTC 5, a critical time for all the tracks to start to spread. According to the simulation results, we will choose C7-5_P and C7-5_P_noT to compare their dynamic responses to the topographic influence of the CMR, as C7-5_P shows a more consistent track deflection.
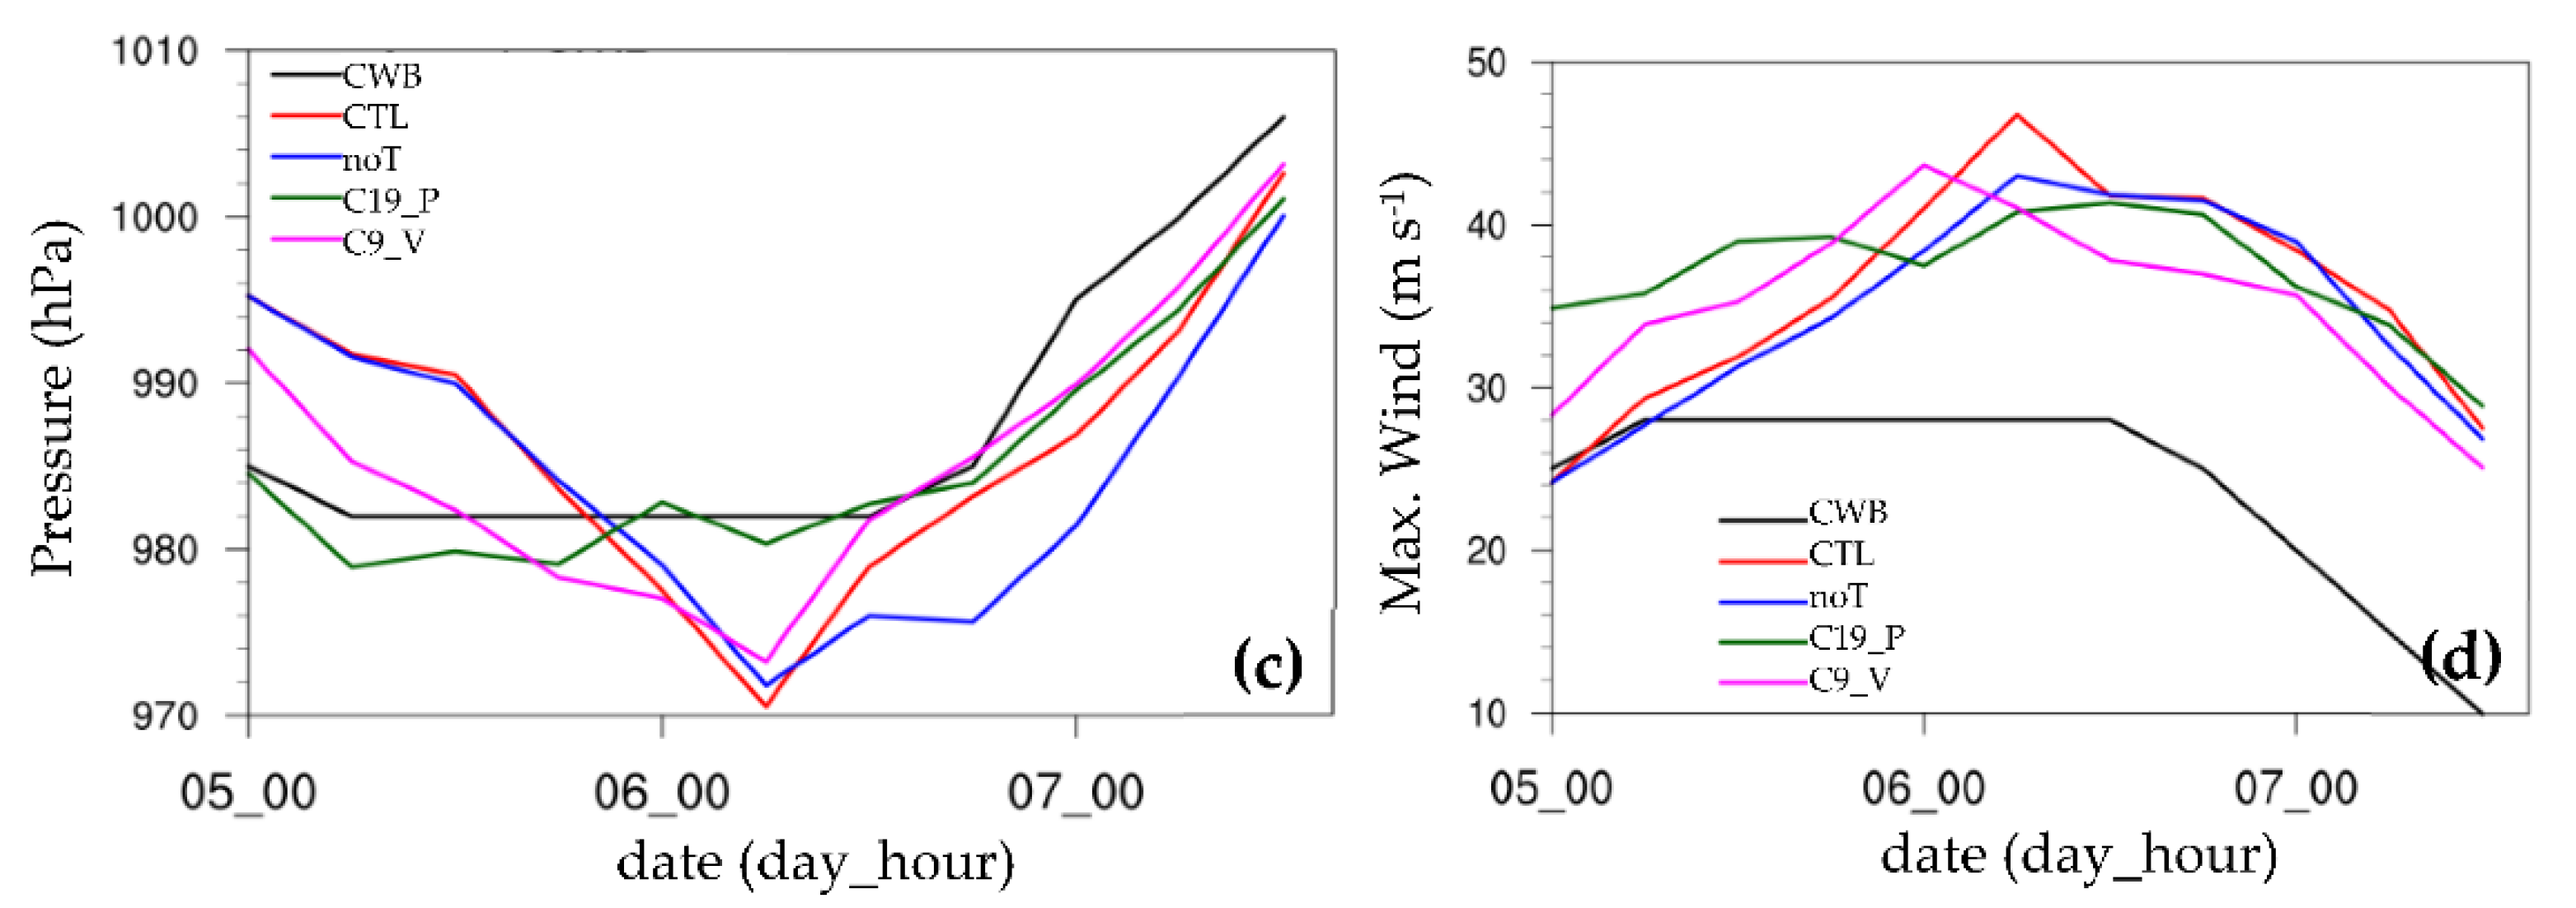
When the initial time of forecast is delayed by 12 h to 0000 UTC 5, the simulated tracks, CSLP, and Vmax for CTL, C9_V (using the ninth cycle run with V-match), and C19_P (using the 19th cycle run with P-match) are closer to the best track data, with stronger northward deflection as shown in Figure 4. Again, noT remains to give a more northward-shifted track compared to CTL. Note that noT gives the strongest CSLP after 36 h when the cyclone is near the right south of Taiwan but shows slightly larger track errors after 24 h. The simulated CSLP with P-match for C19_P better follows the best track data, but the associated Vmax is stronger throughout the forecast. This large deviation in wind intensity from the observed before 36 h is not due to the small track error since the simulated cyclones for both runs with the DVI move nearly along the best track. The performance of C9_V on track and intensity forecasts is similar to that of C19_P, except with the deepening at 0600 UTC 6 (Figure 4c,d). It appears that both matches give similar forecasts, and CTL indeed provides the best track forecast at the later stage. All the track errors begin to amplify near 0600 UTC 6, when both CSLP and Vmax are more over-predicted, which is similar to the forecasts at the initial time of 1200 UTC 4. The observed weakening in both CSLP and Vmax after 1200 UTC 6 is well captured in association with the track tendency consistent with the best track. Comparing Figure 3 and Figure 4, it appears that the forecast with a stronger vortex at the later initial time for both DVI runs has improved the later track deflection with a relatively lower over-predicted vortex intensity.
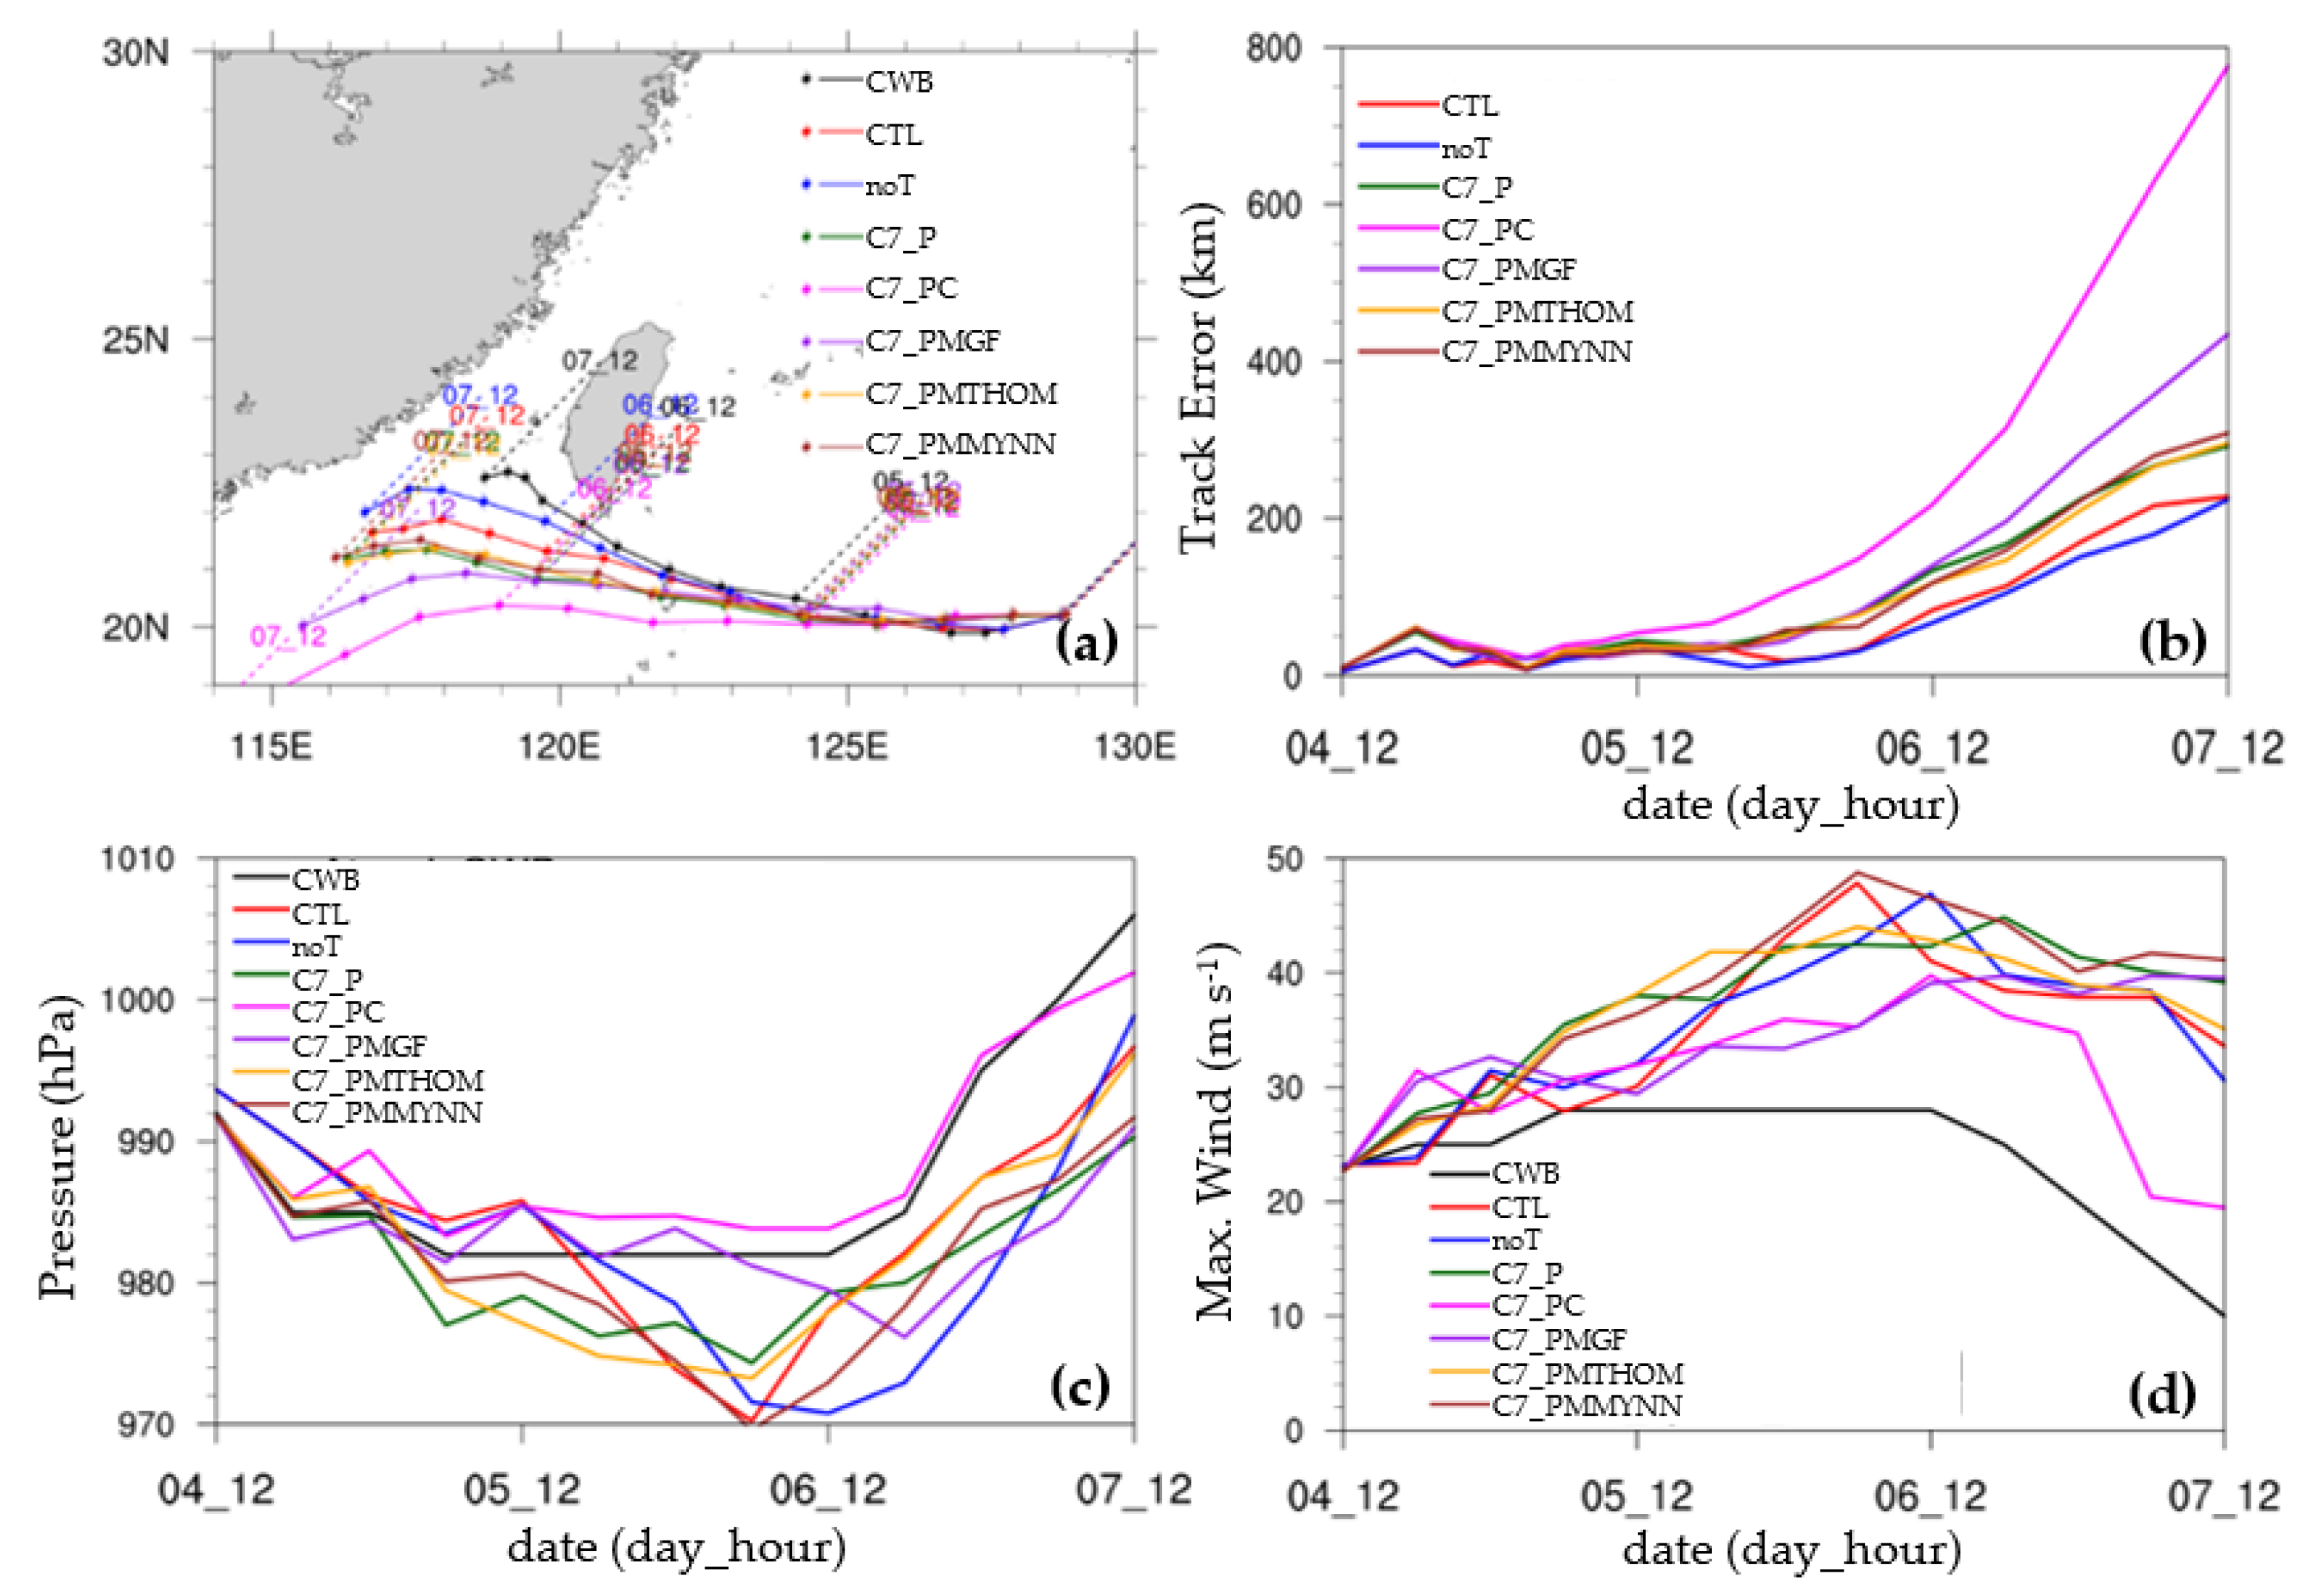
For understanding the track sensitivity to the use of physics schemes, the results for several sensitivity tests with different physical parameterizations are shown in Figure 5. The physics schemes and sensitivity experiments are described in Table 1 and Table 2. Note that all the physics-sensitivity experiments have used the 7th run in the DVI with P-match. The simulated tracks with other physics schemes are similar to or somewhat worse when compared to CTL and noT (Figure 5a), and all are associated with larger errors at later stages than noT (Figure 5b). All the simulated values of CSLP and Vmax for the physics-sensitivity experiments show a variety of evolutions after the first 12 h, and their growth rates are considerably stronger than the best track data (Figure 5c,d). With the DVI, consistent CSLP and Vmax are produced at earlier stages for all the physics-sensitivity experiments; however, they tend to be most over-predicted around 0600 UTC 6 (Figure 5c,d). In addition, their tracks tend to spread earlier near 0600 UTC 5 as the development rates of both CSLP and Vmax still keep intensifying afterward, in contrast to the observed level-off. Note that as seen in this figure, C7_PC (in pink) and C7_PMGF (in purple) obtain weaker but more consistent CSLP and Vmax in 1200 UTC 5–1200 UTC 6, but indeed associated with the weaker track deflection after 1200 UTC 5. For C7_PC, the vortex has a weaker CSLP than the observed and gives a westward track without deflection by 0000 UTC 7. The results tend to imply that stronger cyclones may deflect further northward toward the terrain than weaker cyclones in these experiments. Comparing Figure 3 and Figure 5, the larger over-prediction in both CSLP and Vmax in all the physics-sensitivity experiments, however, has produced less track deflection at later stages even though all the initial vortices have nearly the same best-track intensity. These forecast results also highlight that capturing the later track deflection is more challenging for MPAS, and it turns out that only C7-5_P has obtained a more satisfactory track deflection, but still less northward than the observed when the vortex moves closer to the southern end of Taiwan.

3.2. Rainfall Simulations

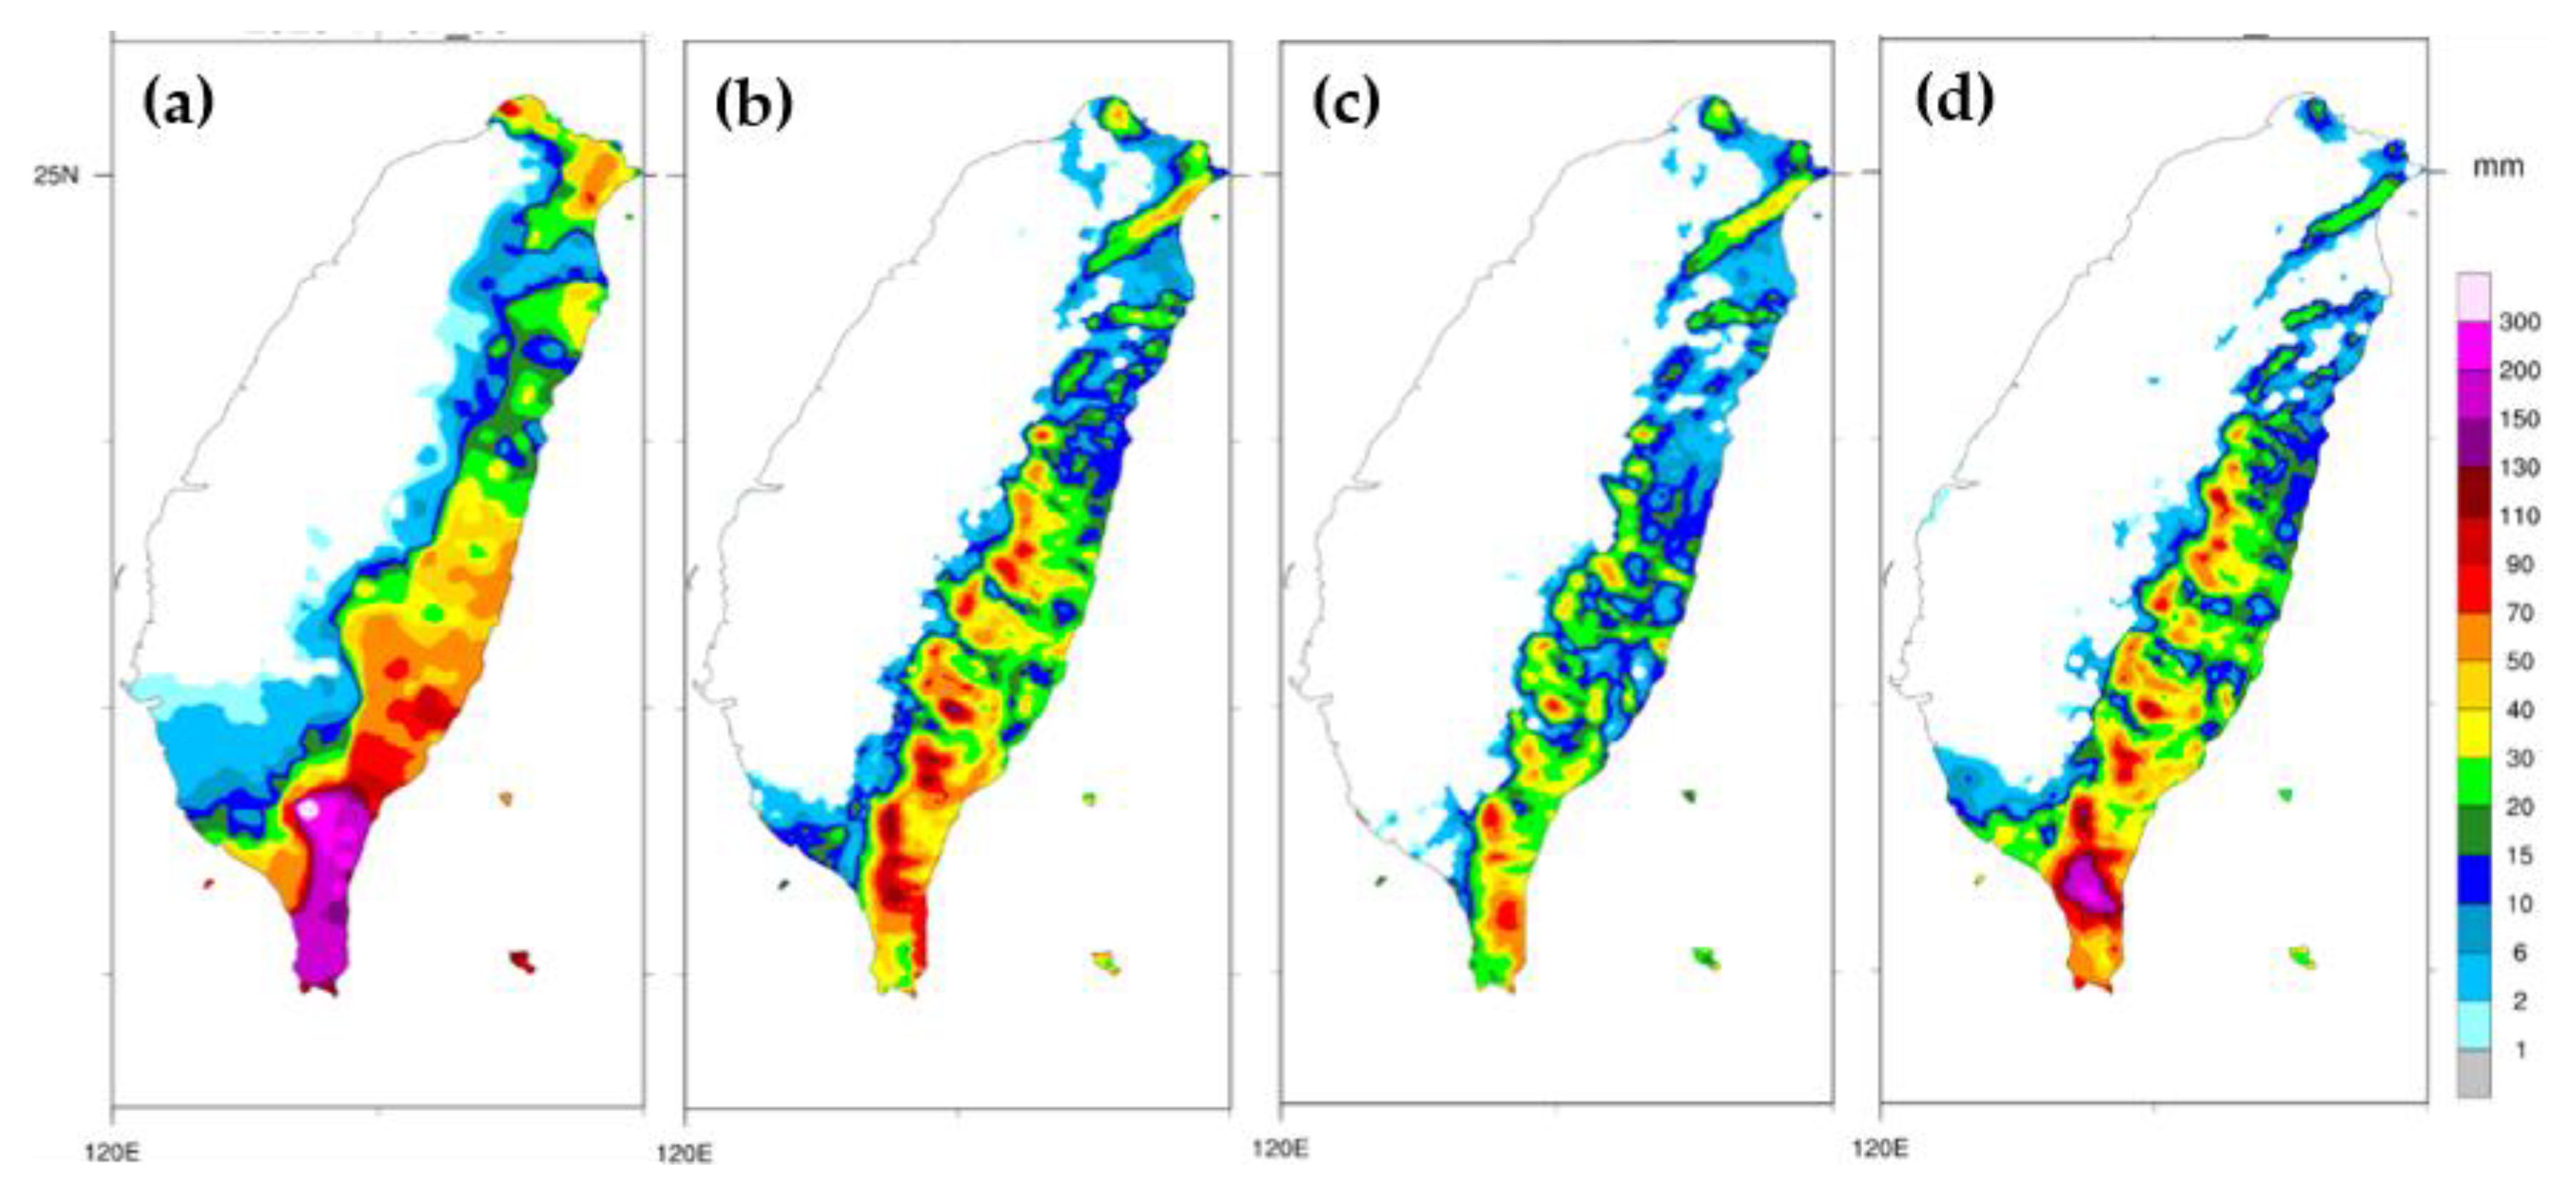
The different deflecting tracks have various impacts on the accumulated rainfall during the passage of Atsani near Taiwan. Figure 6 shows the 24-h accumulated rainfall from 0000 UTC 6 November to 0000 UTC 7 November for CWB observation, CTL, C7_P, and C7-5_P. The observed major rainfall occurs in the vicinity of southern Taiwan and the upslope region, i.e., east of the CMR (Figure 6a). The simulated rainfall for CTL shows major geometric distributions in agreement with the observed, but slightly more southward with the under-predicted maximum rainfall over the southern end of Taiwan (Figure 5b). For C7_P, the associated rainfall is even less since the track is further southward than CTL (Figure 6c). C7-5_P shows similar rainfall distributions compared to CTL, but the maximum rainfall over southern Taiwan is more intense (over 200 mm) than CTL and closer to the observed intensity because its track is more northward than CTL and closer to the best track (Figure 6d). The largest track deviations at later stages of C7_P result in the largest difference from the observed rainfall, indicating the importance of a better capture of the deflecting track for reducing the forecast errors of accumulated rainfall.
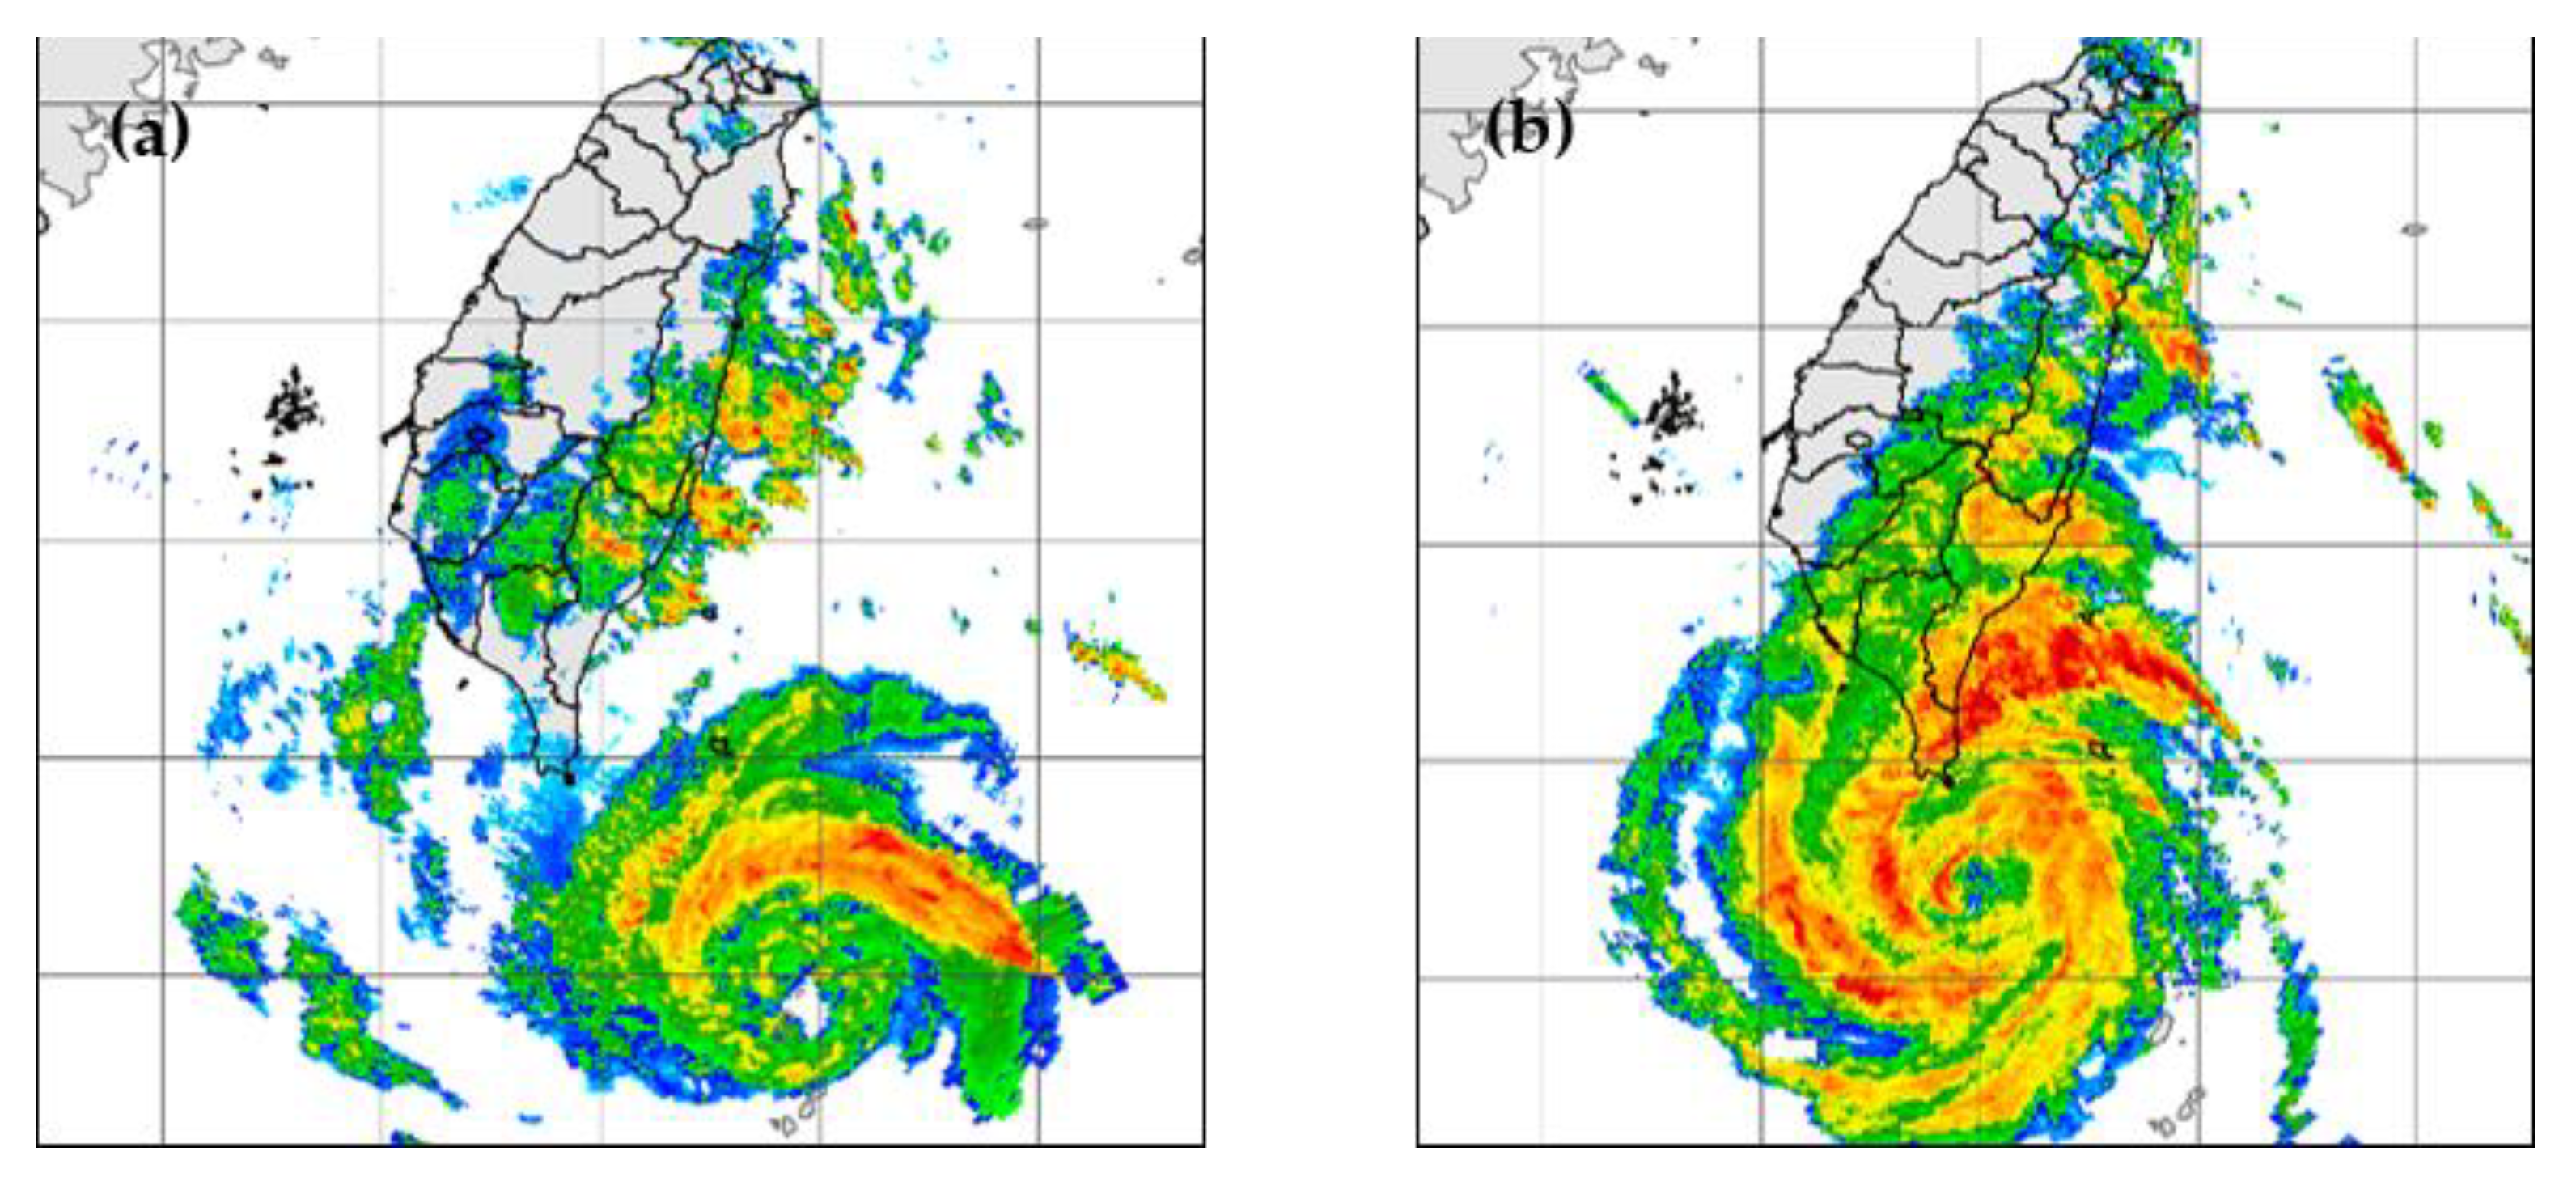
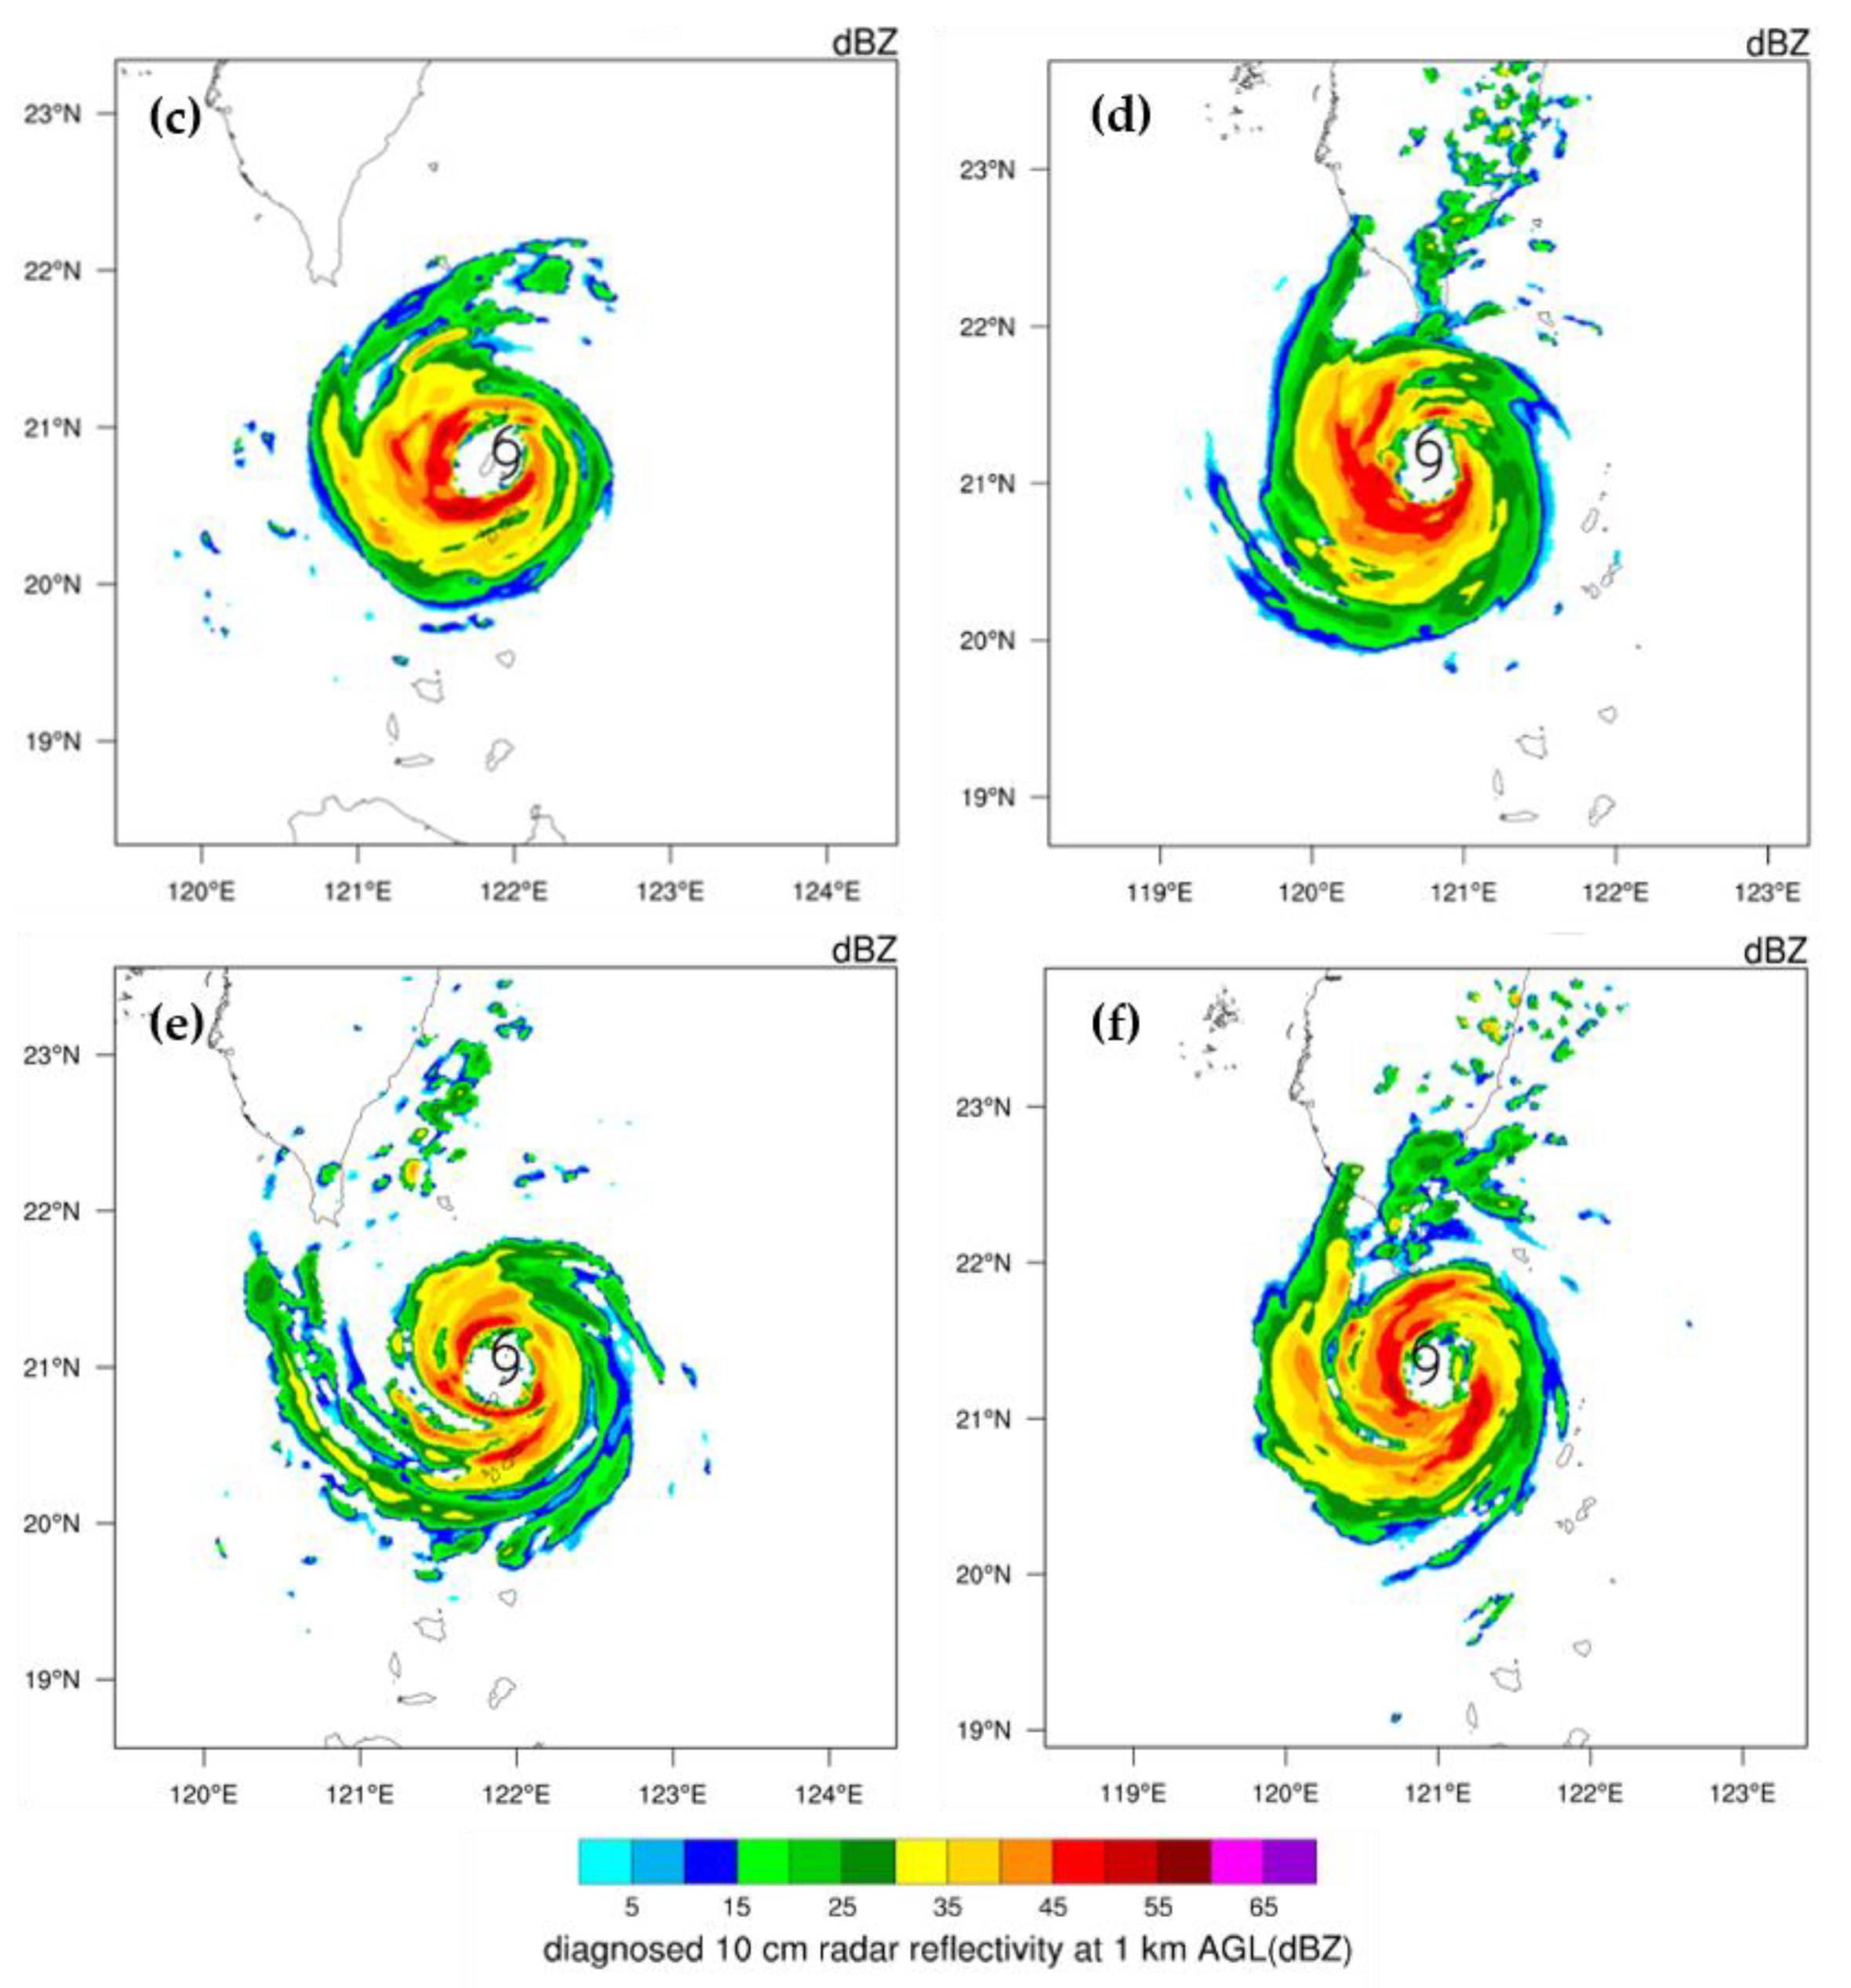
Figure 7 shows the radar reflectivity at 0000 and 0600 UTC 6 November 2020 for the CWB observations, CTL and C7-5_P. For CTL, stronger rainbands occur around the inner vortex at 0000 UTC 6 November, except in the northeastern quadrant of the cyclone. The simulated convection is intensified around the inner cyclone with a spiral band tailing from east to southwest six hours later when it closes to the southern end of Taiwan. Some reflectivity echoes also appear along eastern Taiwan when the cyclonic inflow is upslope of the CMR. However, CTL shows major rainbands west and south of the cyclone center at both times, displaying somewhat more southward than the observed. At 3-km resolution, the MPAS simulations can well capture the inner intense convection around the eye at a radius of about 30 km, but at a larger size than the observed. The more intense convection to the north at 0000 UTC and to the southeast at 0060 UTC is better simulated in C7-5_P. Intense radar echoes near the southern end of Taiwan are also captured in C7-5_P but lack the observed feature covering southeastern Taiwan, which can be partially attributed to the track deviations.

3.3. Cyclone Circulation

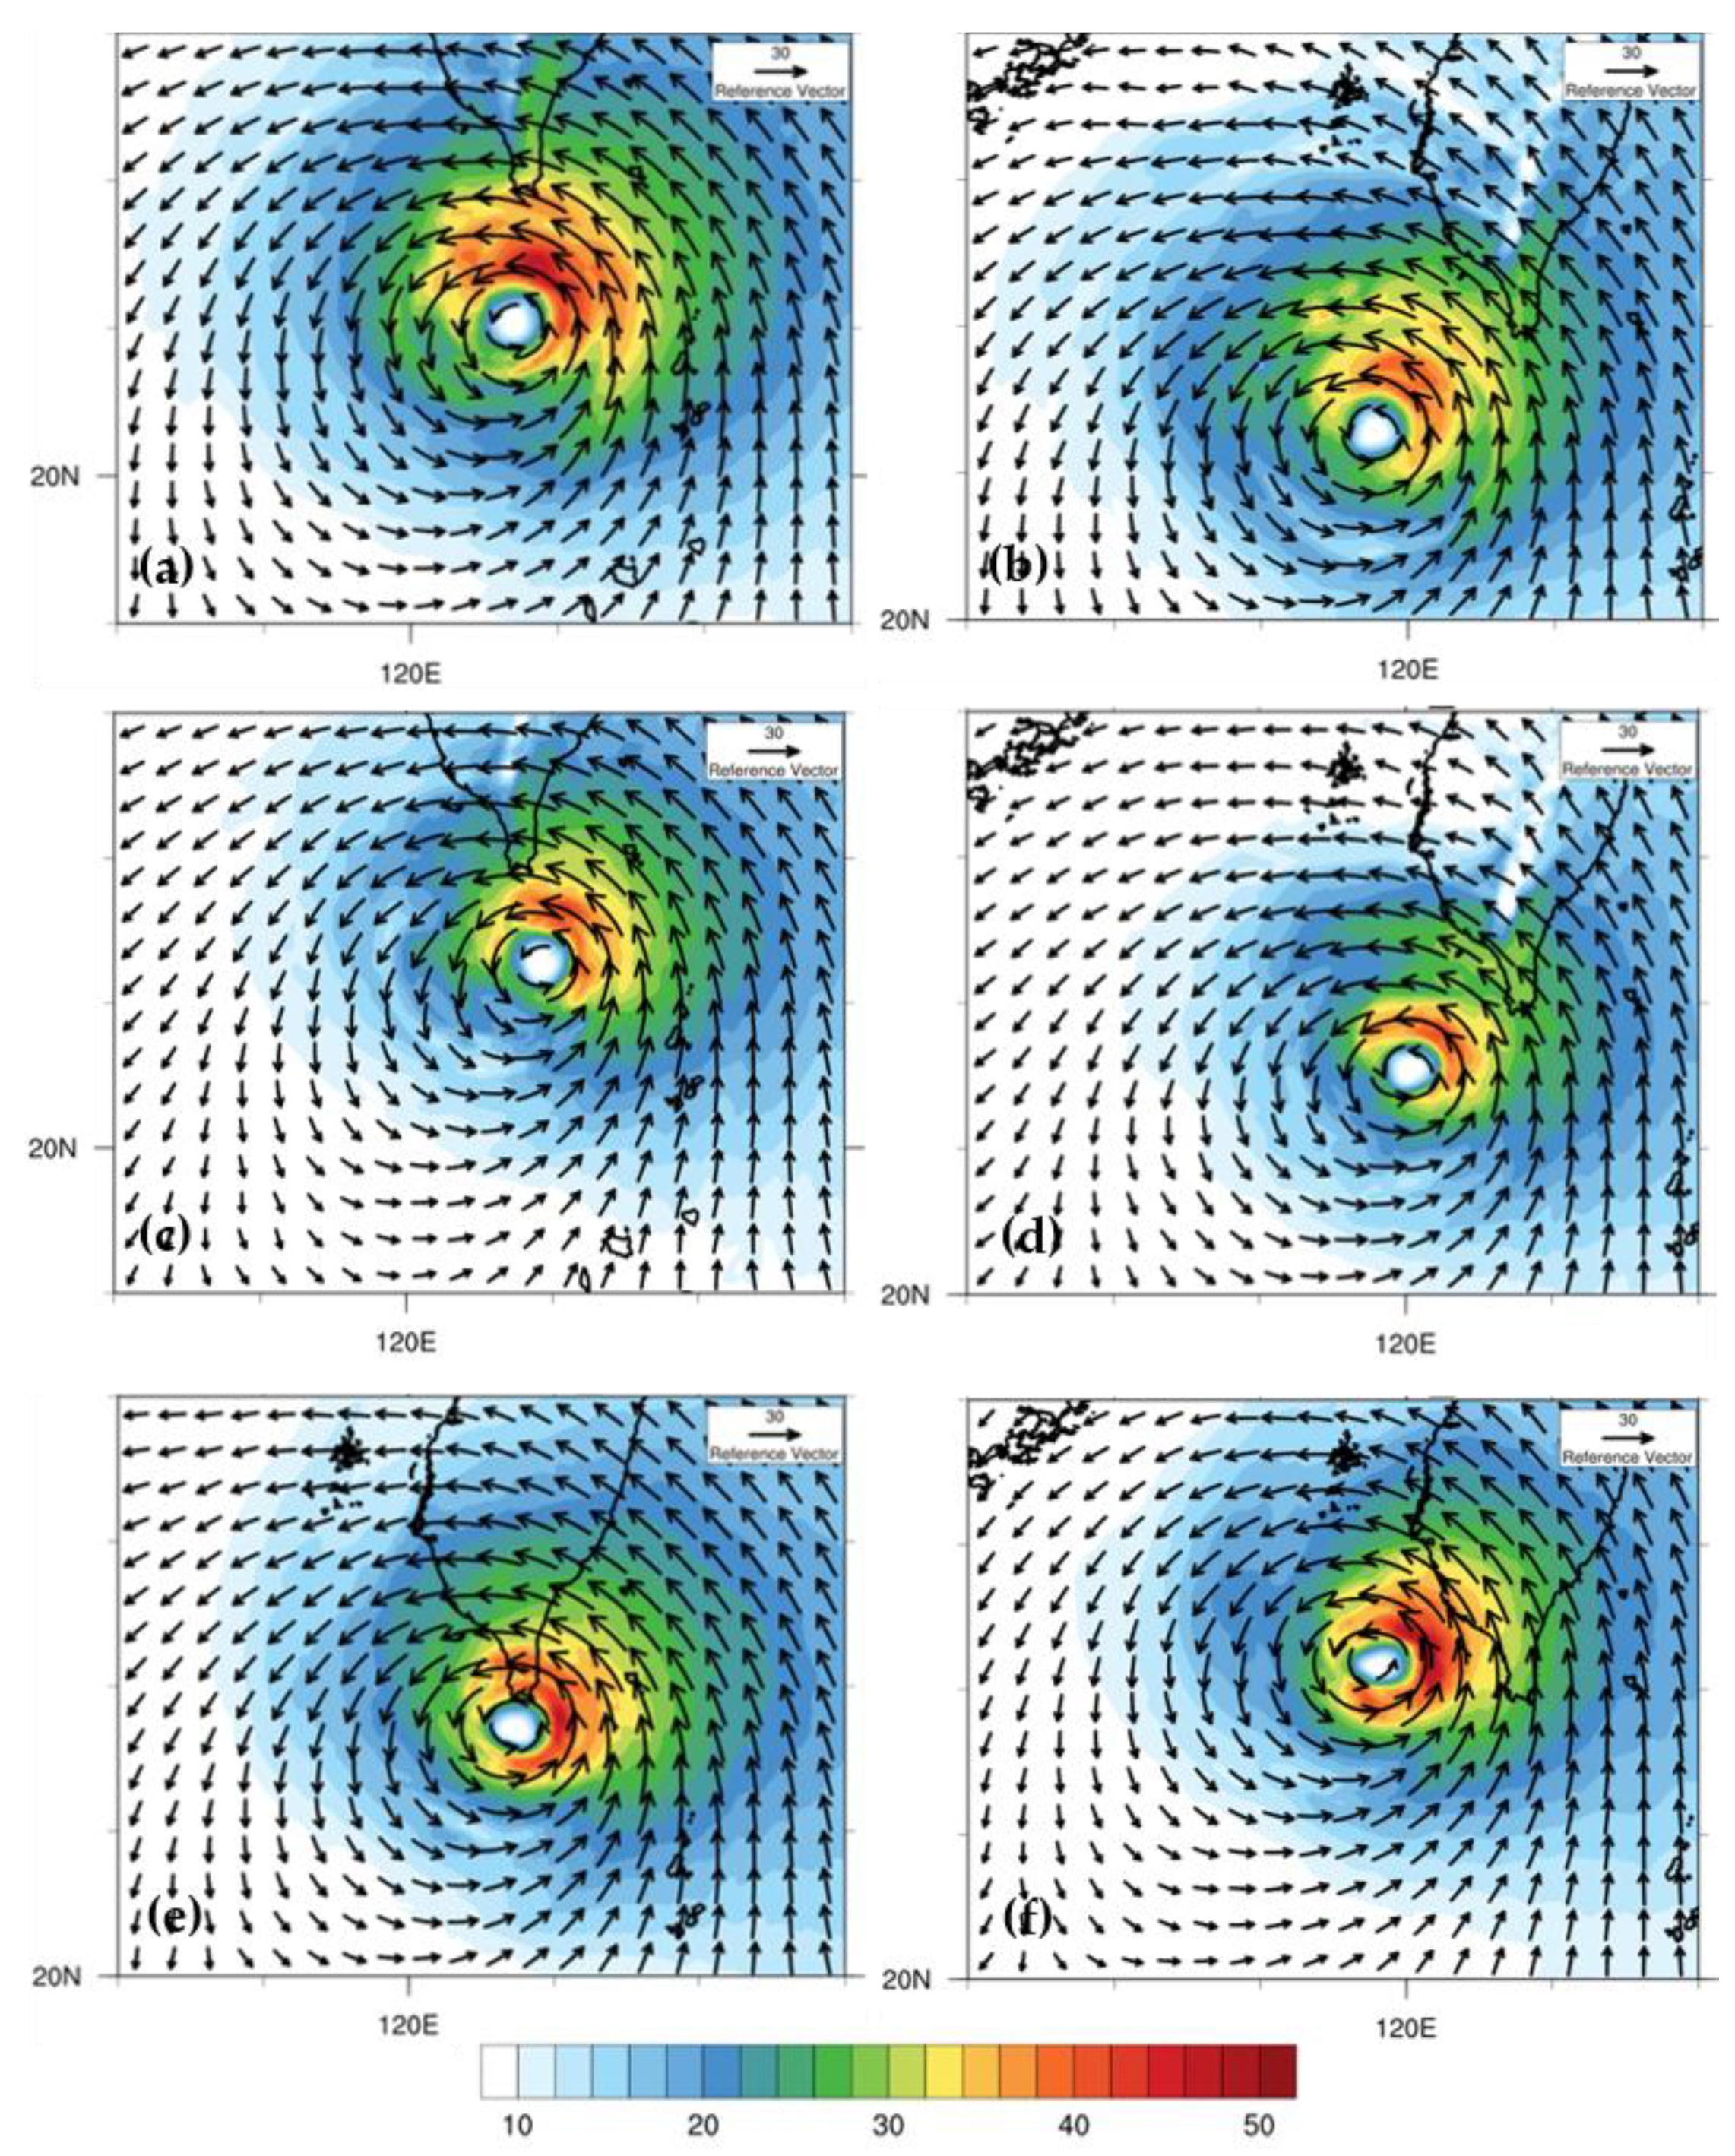
We use the previous three experiments to illustrate the characteristic flow differences in the simulated cyclones with different track deflections. Figure 8 shows the simulated horizontal wind for CTL, C7-5_P, and C7-5_P_noT at 500 hPa at 1200 UTC 4 and 5 November 2020. At the initial time of 1200 UTC 4 when the cyclone is not close to the Taiwan terrain, these three simulations provide similar flow patterns outside the inner core where stronger wind occurs at the western and northeastern flanks of the cyclone for CTL, but mainly at the northeast for both C7-5_P and C7-5_P_noT (Figure 8a,c,e). It is evident that the eye is narrower for both runs with the DVI and the differences in the initial wind field between both DVI runs are very small. Thus, the removal of the Taiwan terrain has not influenced the pronounced impact of the DVI on the initial spin-up of the vortex. One day later, the stronger wind is present to the northeast of the vortex center for CTL but mainly to the north for both DVI runs (Figure 8b,d,f). In the absence of the Taiwan terrain, the inner vortex flow in the northern quadrant of C7-5_P_noT appears to be slightly stronger than in C7-5_P.
When the cyclone moves close to the southern end of Taiwan at 0600 UTC 6 November 2020, the cyclonic circulation at 500 hPa for CTL becomes more intense (Figure 9a). The radius of vortex wind speeds exceeding 30 m s−1 is about 200 km in CTL but only 100 km in C7-5_P (Figure 9c). The vortex in CTL is also more east-west symmetric than in both C7-5_P and C7-5_P_noT. At this time, the vortex is moving more westward with a weaker northward deflection for CTL. The vortex for C7-5_P is closer to the Taiwan terrain and is more affected by the topographic effects; therefore, its intense core becomes smaller and weaker than CTL. In the absence of the Taiwan terrain, the vortex moves more northward, with the stronger wind mainly east of the vortex center in C7-5_P_noT (Figure 9e). Six hours later, the vortex for CTL becomes more asymmetric as it moves close to the southwest of the southern end of Taiwan (Figure 9b). A slightly stronger wind is still present to the northeast in order to support the west-northwestward movement of the CTL vortex. The vortex in C7-5_P has further weakened due to the terrain effect and keeps a west-northwestward movement as in CTL (Figure 9d). Such a weakening does not occur for the vortex of C7-5_P_noT without the impact of the terrain effect (Figure 9f). A more intense wind zone is produced mainly to the east of the vortex center in C7-5_P_noT, which is favorable for a more northward movement compared to C7-5_P and CTL. Note that the vortex intensification in C7-5_P_noT is not due to flow channeling ahead of the southwestern CMR since the Taiwan terrain has been removed.
Figure 10 shows the simulated wind averaged at 1–8 km in height at 1200 UTC 6 November 2020 for CTL, C7-5_P, and C7-5_P_noT. The deep-layer mean intense wind in the inner vortex has a larger size for CTL compared to C7-5_P (Figure 10a,b), but both give similar translation in speed and direction associated with similar stronger flow to the east of the vortex center. In the absence of the Taiwan terrain, C7-5_P_noT gives a stronger maximum 10-m wind (at a speed of 46.25 m s−1) than CTL (at a speed of 41.0 m s−1). The stronger wind zone to the east of the vortex center has extended further eastward for C7-5_P_noT, leading to a more northward track by this time (Figure 10c). Thus, the topographic effects of the Taiwan terrain appear to give a negative impact on the eastward extension of the asymmetric wind under the environmental steering flow, regardless of the size of the intense vortex core.
In short conclusions for this subsection, the less northward deflection at earlier stages for CTL could be attributed to the developing stronger vortex with a more east-west wind symmetry compared to C7-5_P. As the evolving vortex becomes weaker at later stages of C7-5_P (also see Figure 2), stronger east-west wind asymmetry is induced by the topographic effects of the CMR and leads to a more northward track deflection. In the absence of the topographic influences, the initial vortex in C7-5_P_noT evolves with its own interaction with the environment and takes an earlier, more northward track, which is not the same as in CTL and C7-5_P in the presence of the topographic influences.

3.4. Potential Vorticity (PV) Tendency Budget for Track Deflection

Based on the simulated results, we conducted the PV budget analysis to provide the dynamic explanation for the induced track deflection. This essentially follows the wavenumber-one PV budget as used by Wu and Wang [42], and the details of the methodology may also refer to Huang et al. [22]. The PV budget terms include horizontal PV advection, vertical PV advection, differential diabatic heating, and turbulent diffusion. For the vortex translation, the regression method can be applied to calculate the meridional and zonal translation speeds in response to different physical processes involved in the PV budget. The vortex is basically driven with the induced translation toward the maximum positive PV tendency. In this study, we use the PV budget averaged at 1–8 km in height and within 30 min of the analysis time as applied in Huang et al. [22].
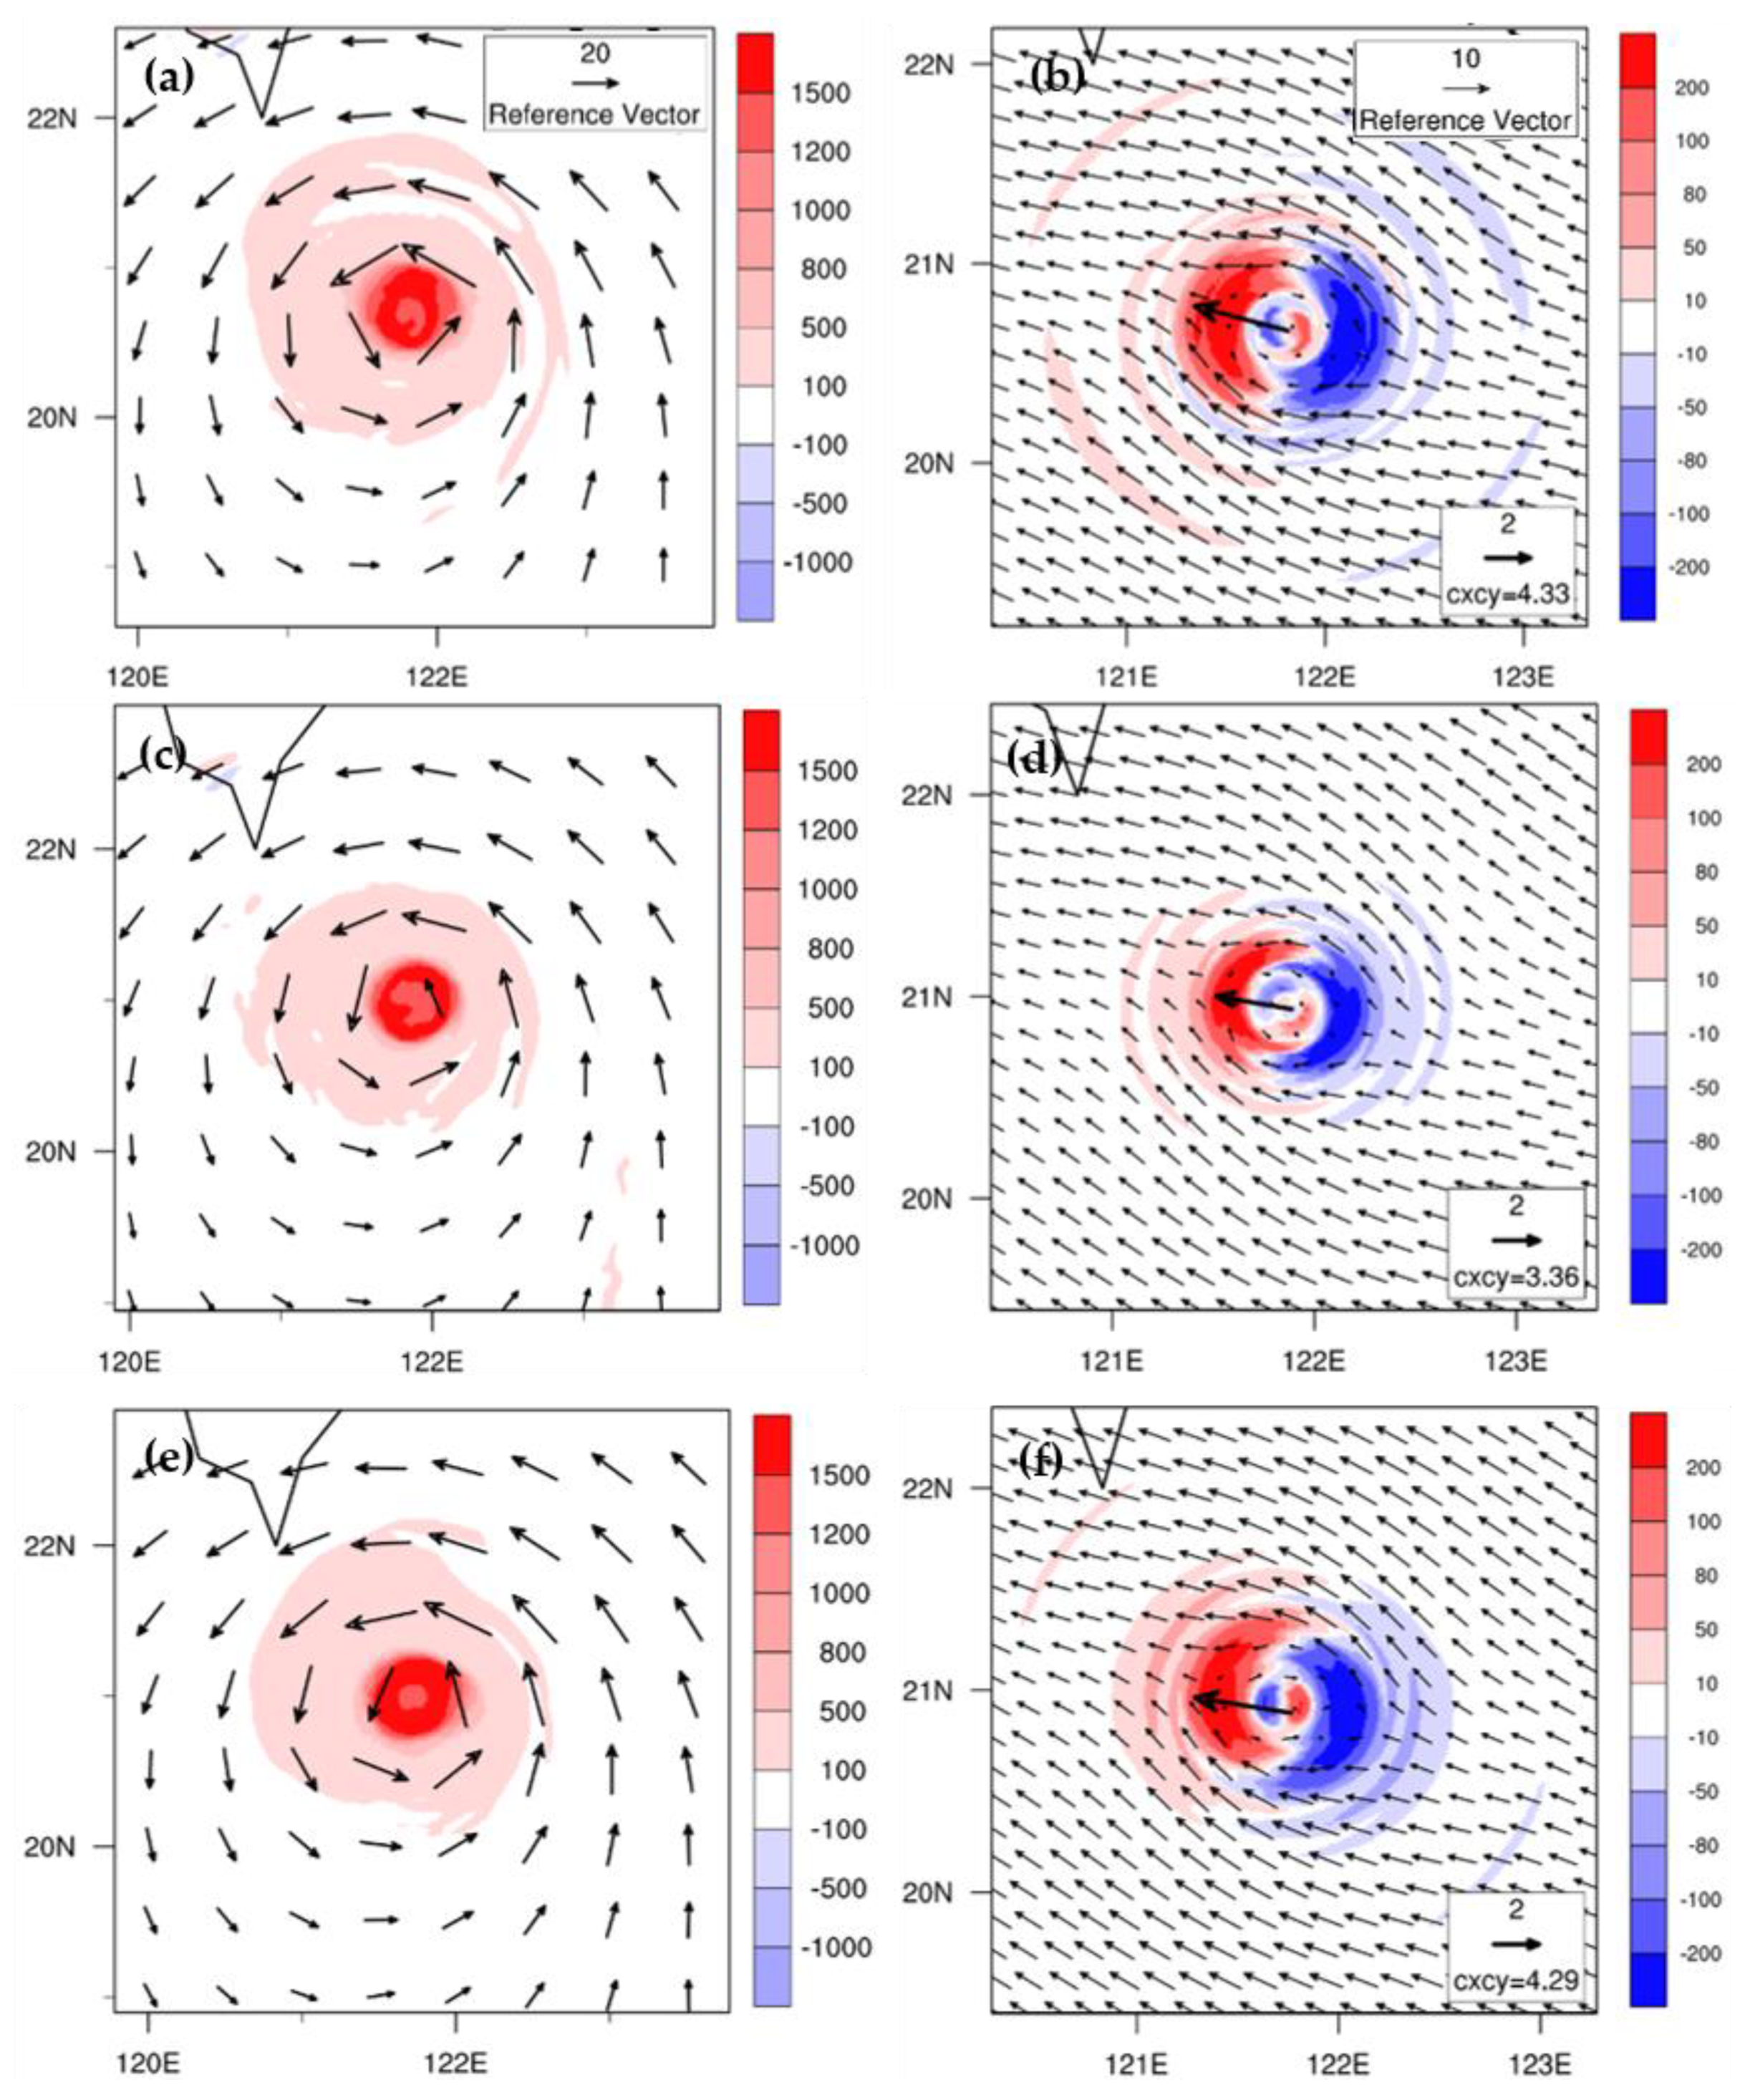
Figure 11 shows the simulated PV field and PV tendency (due to the net PV budget) at 0000 UTC 6 November 2020 for CTL, C7-5_P, and C7-5_P_noT. Here, the net PV budget has excluded turbulent diffusion. We focus on this time since the simulated tracks for the three experiments start to deviate more from 0000 UTC 6 November as shown in Figure 3. The PV scope of the vortex is slightly wider for CTL than for C7-5_P and C7-5_P_noT, even with very similar deep-layer mean vortex circulations. Faster translation speed (4.33 m s−1) is induced for CTL with the stronger PV in the inner vortex than C7-5_P (3.36 m s−1), but comparable to that (4.29 m s−1) for C7-5_P_noT. This larger translation speed is in response to the stronger positive and negative gyres of wavenumber-one net PV budget for CTL and C7-5_P_noT. The actual movement of the vortex is also faster for CTL and C7-5_P_noT than for C7-5_P, as seen in Figure 3.
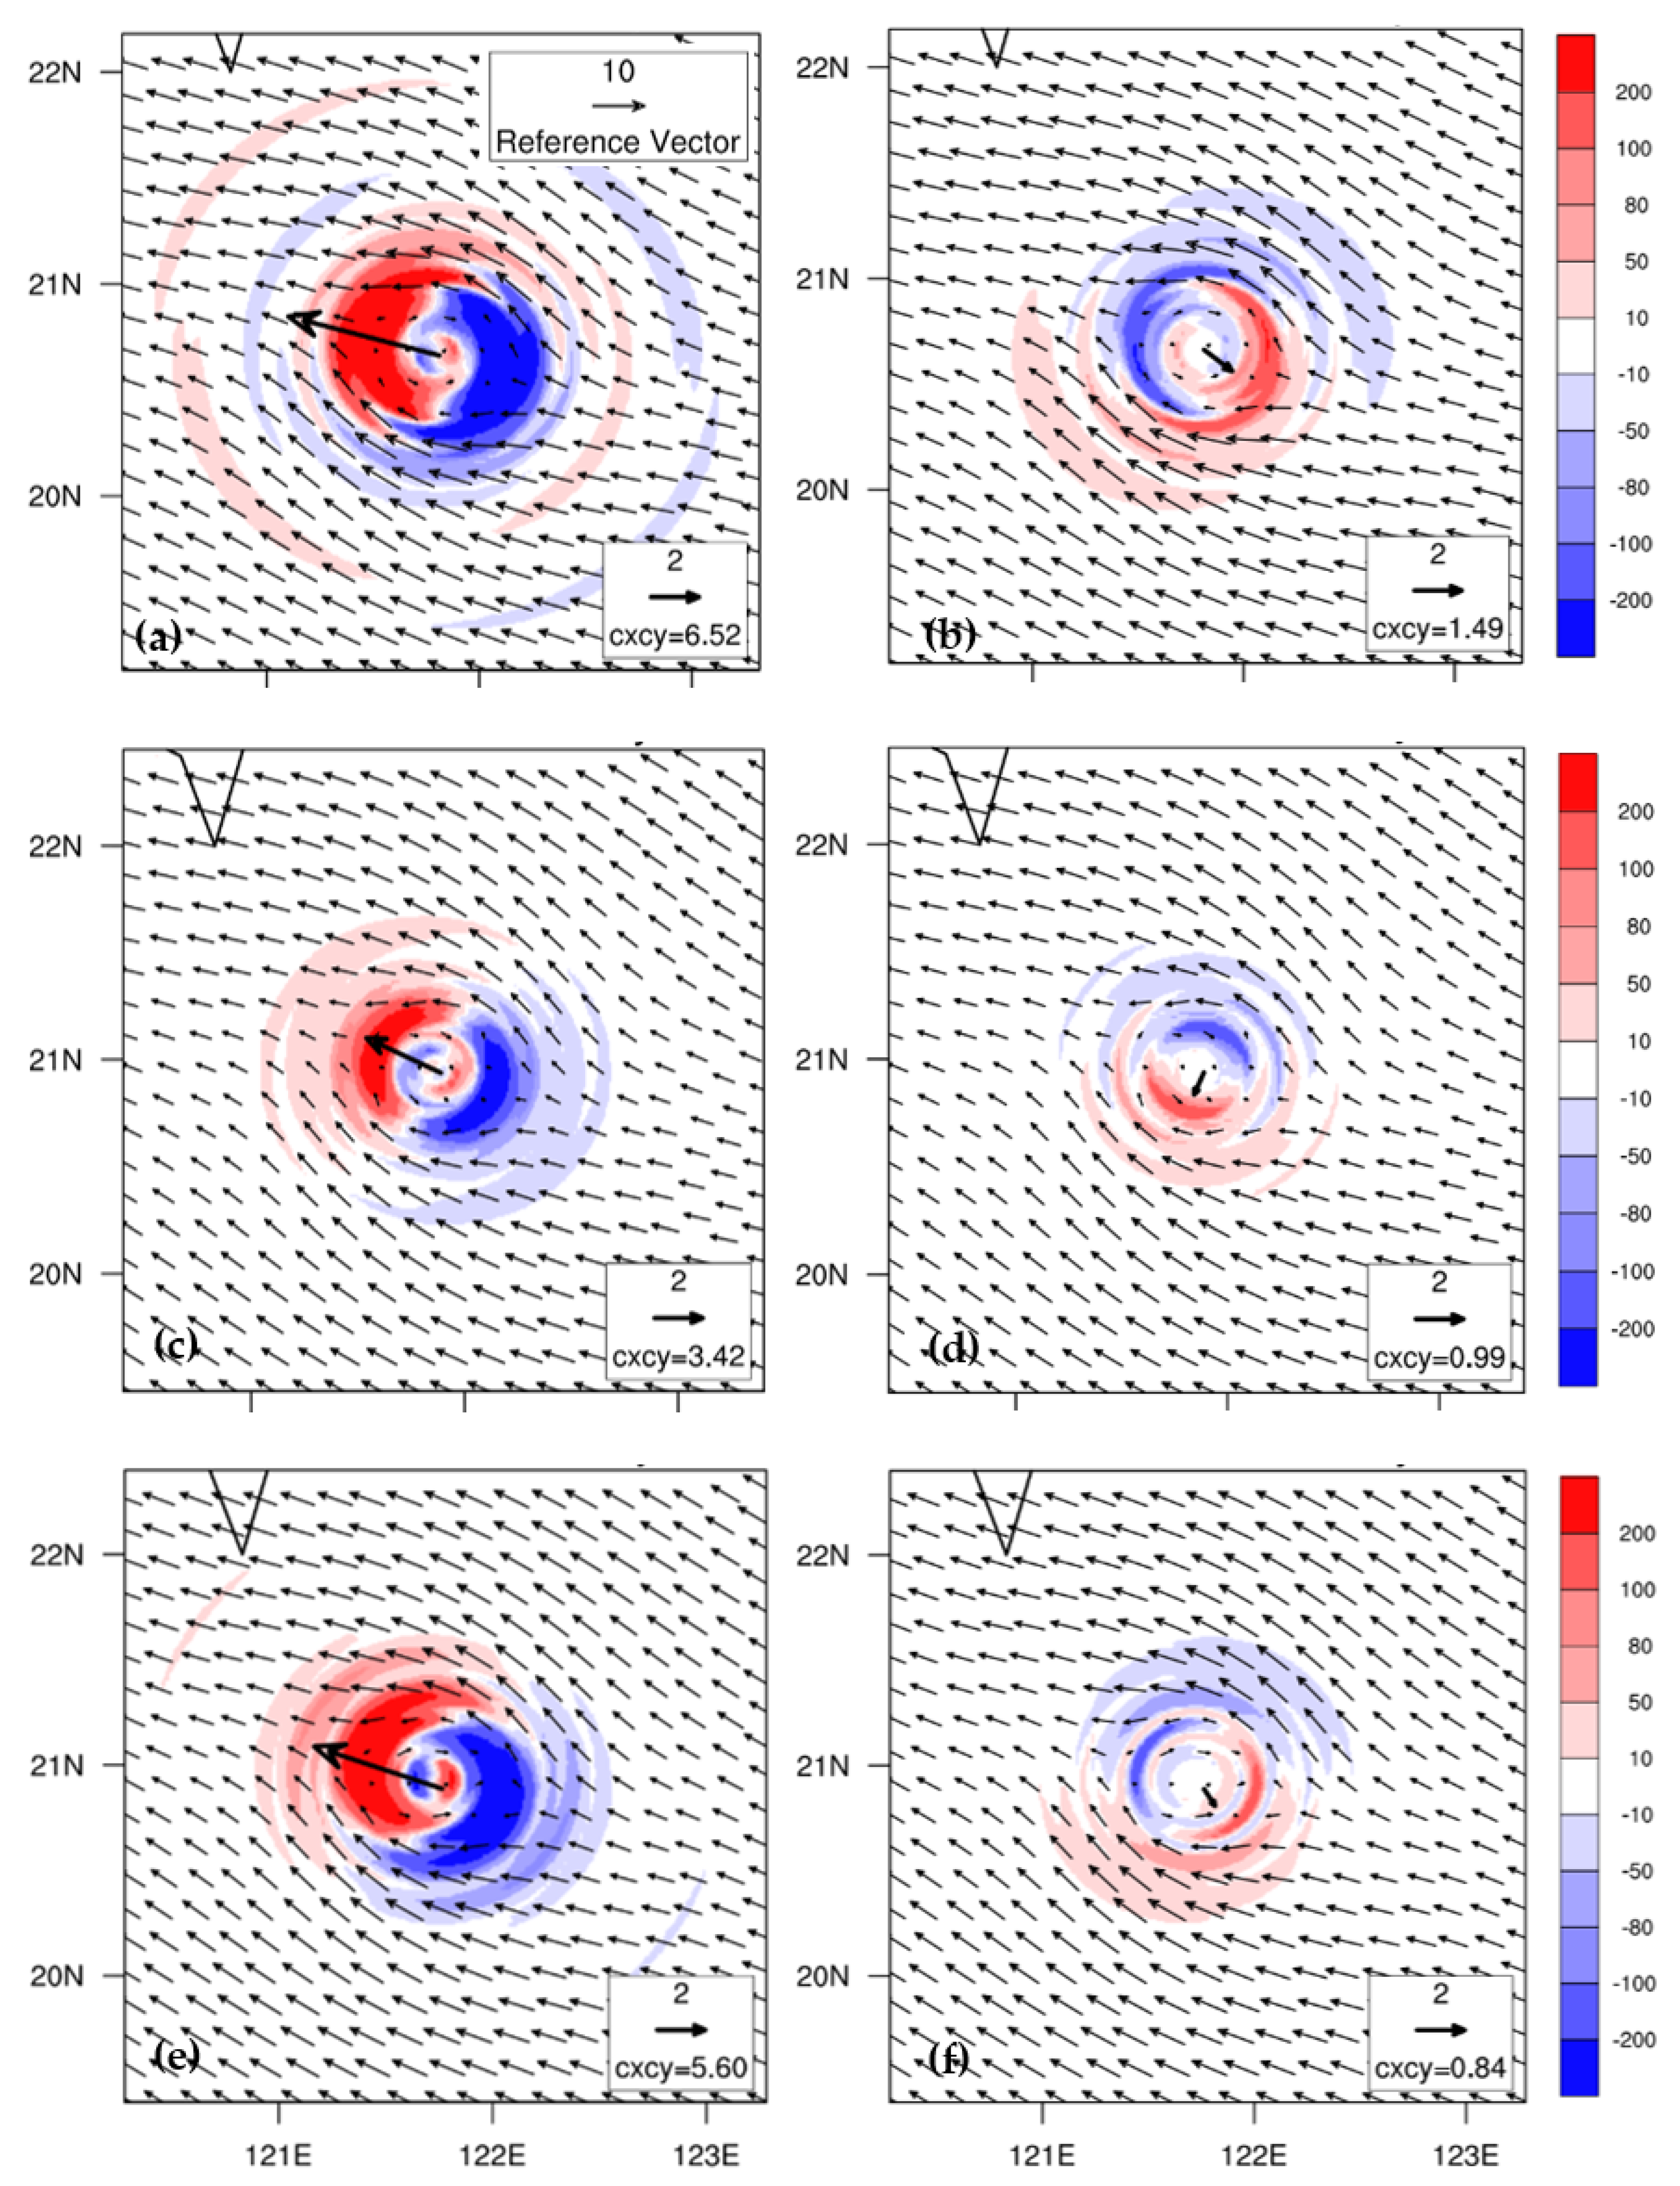
Figure 12 shows that the west-northwestward vortex translation at 0000 UTC 6 November 2020 is dominated by horizontal PV advection that is slightly offset by differential diabatic heating for the three experiments. Vertical PV advection is much smaller than horizontal PV advection and is not shown herein. The offset by the effect of differential diabatic heating is stronger for the CTL associated with the stronger convection as shown in Figure 7. Note that the overall wavenumber-one flow surrounding the inner vortex core generally possesses a weaker southerly component for CTL compared to both C7-5_P and C7-5_P_noT. As seen in Figure 3, the actual track of CTL indeed is more westward at later stages in response to the outer steering flow with a more westward component.
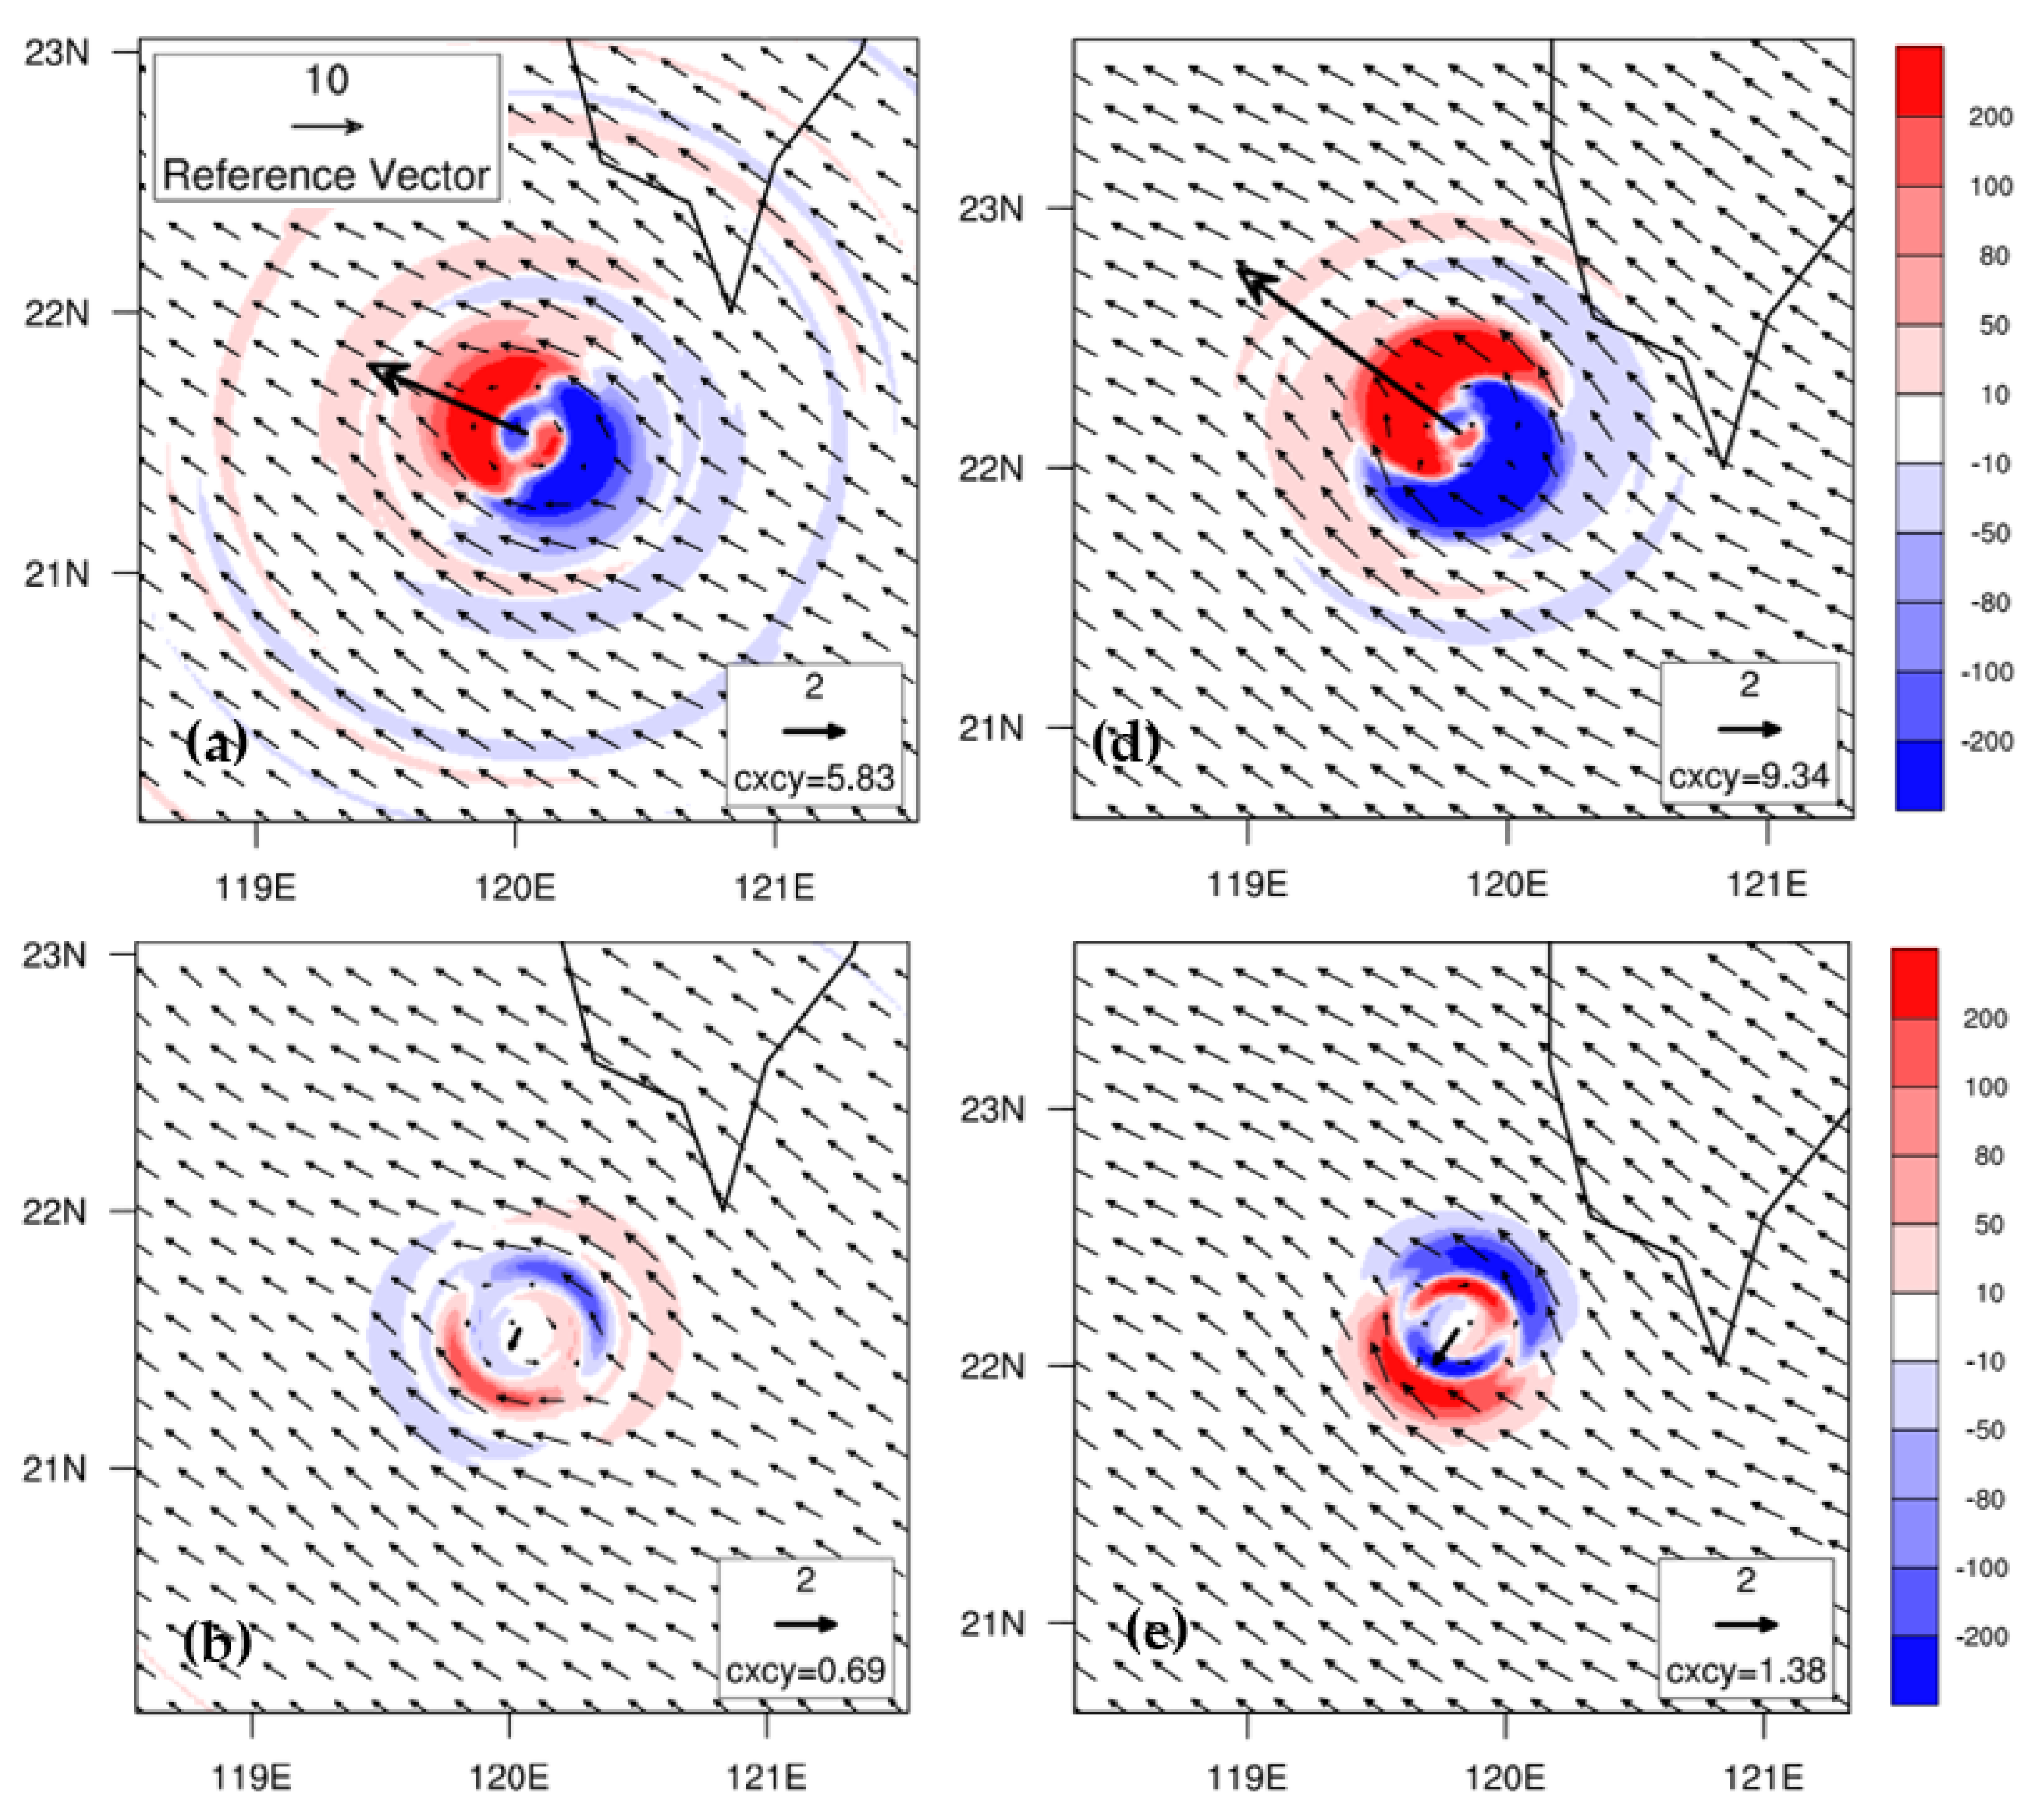
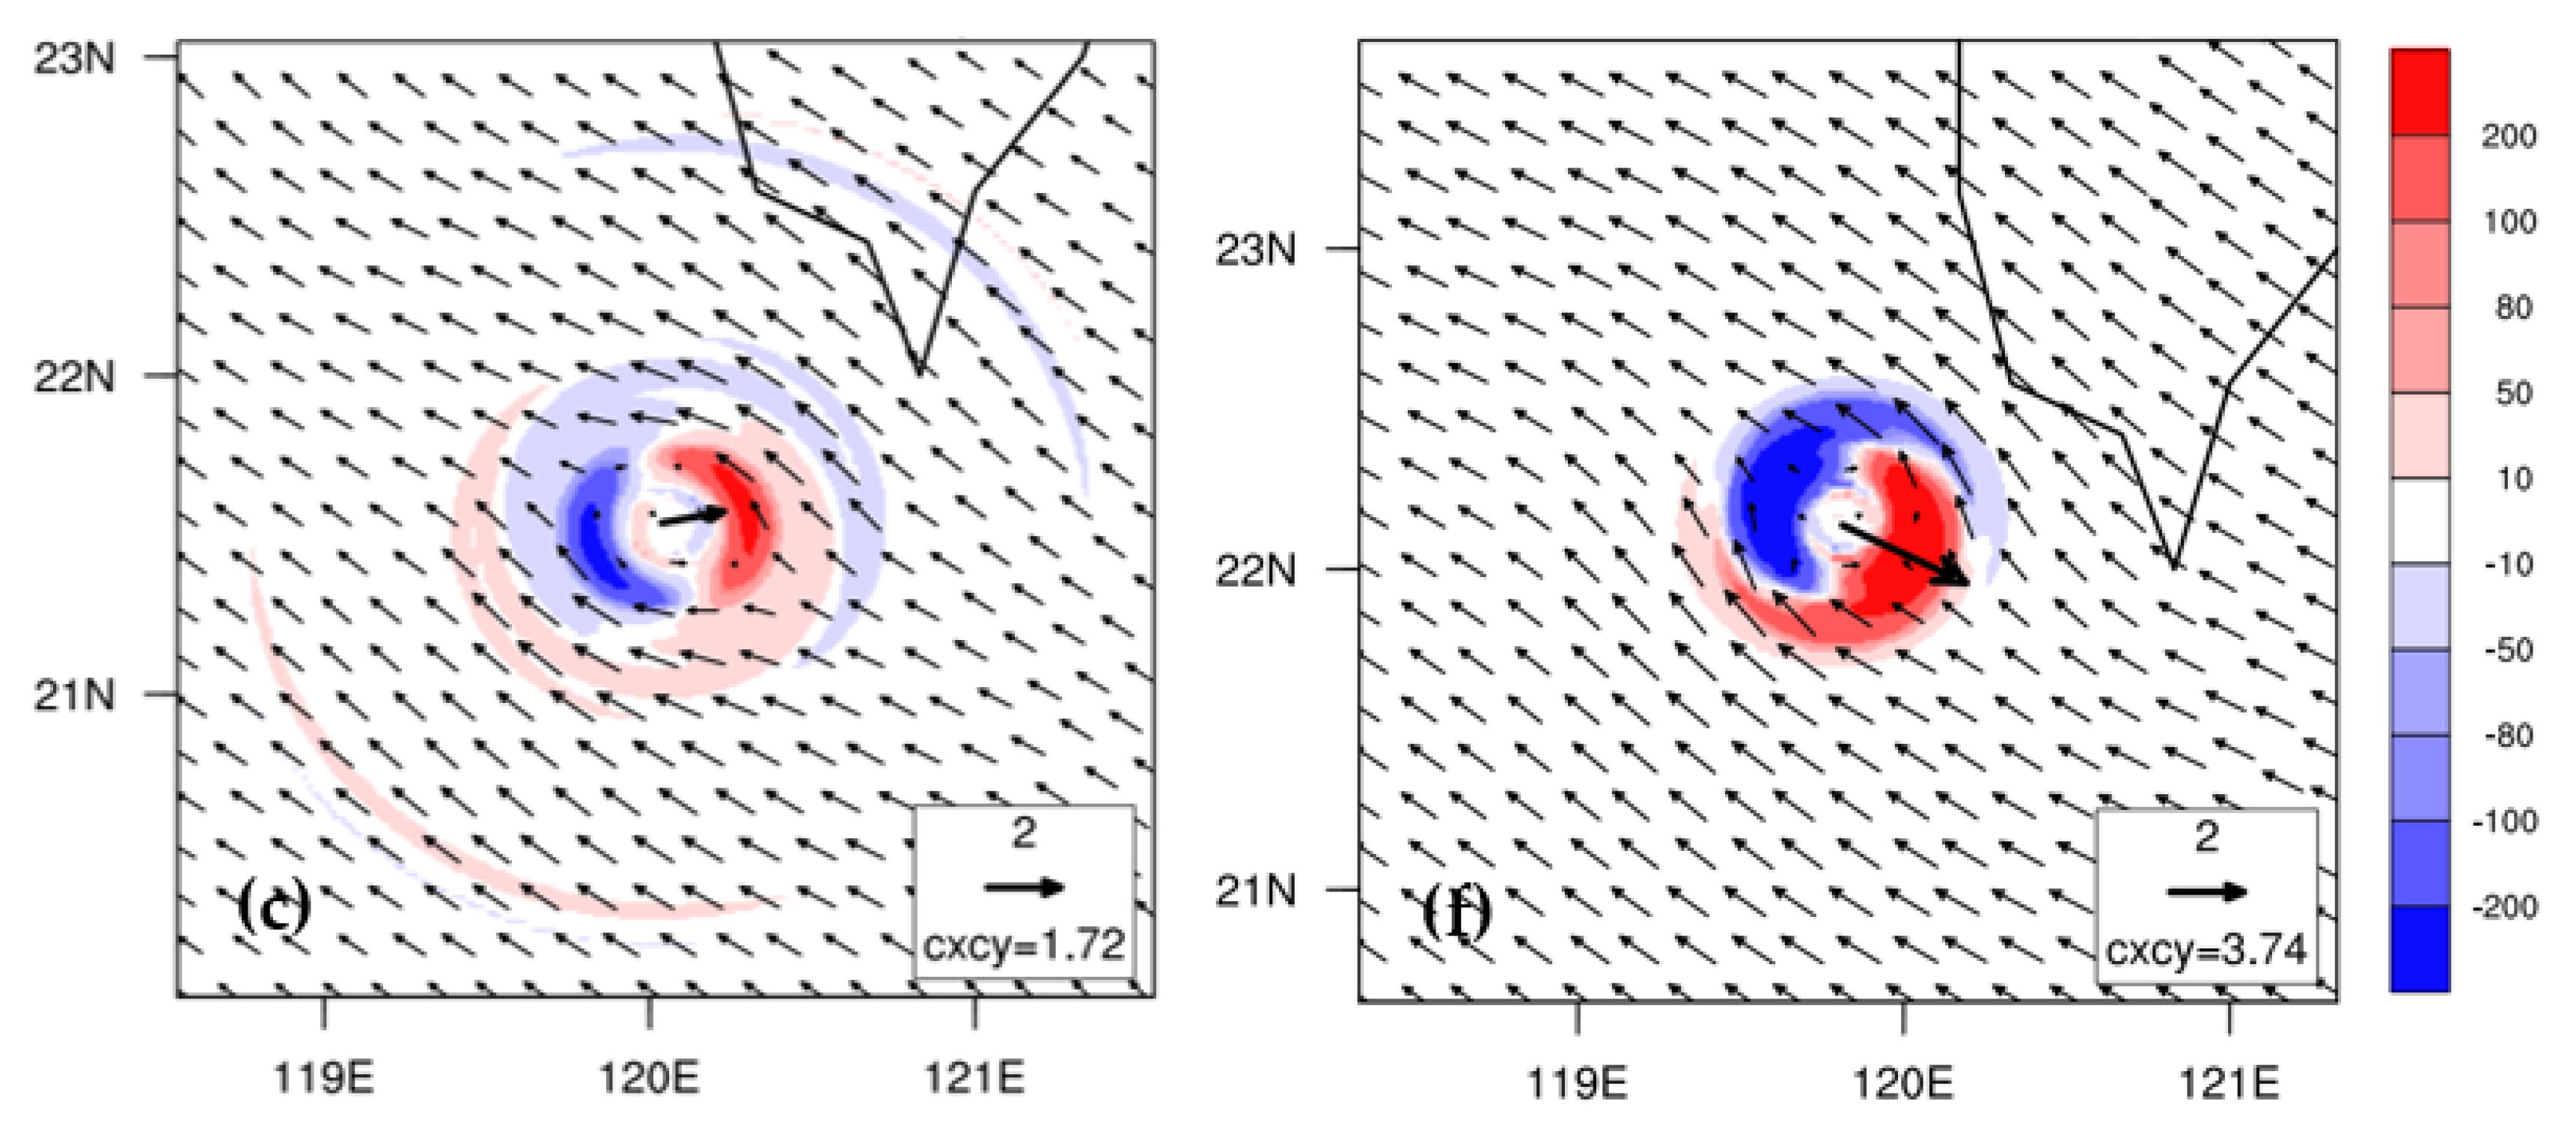
When the vortex moves close to the southwest of Taiwan at 1200 UTC 6 November, the west-northwestward vortex translation is also dominated by horizontal PV advection for C7-5_P and C7-5_P_noT compared to vertical PV advection and differential diabatic heating, as shown in Figure 13. The cyclone has been slowed down by the presence of the Taiwan terrain, which is also evident in the largely reduced translation by horizontal PV advection (Figure 13a vs. Figure 13d). The induced movement is also less northward when the Taiwan terrain is present. Vertical PV advection plays the weakest role, mainly producing a small southwestward translation for both experiments (Figure 13b,e). However, an eastward translation at 1.72 m s−1 is induced by the differential diabatic heating (Figure 13c), compared to the southeastward translation at 3.74 m s−1 without the terrain effect (Figure 13f). Such an inclined movement toward the terrain may be facilitated by the intense cloud formation over southeastern Taiwan (see Figure 7).

3.5. Results of Idealized Experiments

The real-case simulations have shown the sensitivity of the cyclone track to the vortex intensity and structure, with a more northward deflection in the absence of the Taiwan terrain. These results apply to the initial vortex when departing lower south of the Taiwan terrain. Indeed, such a departing cyclone at different sizes tends to be driven northward downwind of the CMR to the left side, as found in some idealized simulations with WRF (e.g., [18]).
We have also utilized idealized WRF simulations to compare the track deflection for similar cyclones as performed in Huang et al. [23]. The initial vortex is at gradient-wind balance under a basic easterly flow of 4 m s−1 in idealized simulations. The details of the vortex initialization can be found in Huang et al. [23]. Two nested domains at horizontal resolution of 15 km and 3 km are employed, respectively, for the idealized simulations with the initial maximum wind speed of 30 m s−1 for the vortex. An idealized elliptical mountain range (EMR), as shown in Figure 14, similar to the CMR, is specified with a maximum mountain height of 3.5 km. The idealized EMR is enclosed by the coastline, similar to the Taiwan island. For the domain configurations of the idealized simulations, see Huang et al. [26]. In the presence of boundary-layer friction, the initial vortex takes some time to adjust to the balanced dynamics of Ekman-gradient wind with a moist spin-up in response to boundary-layer pumping. We have applied the same DVI process as in MPAS to the idealized vortex and have found that the adjusting vortex may approach a quasi-stationary intensity and inner core structure after a number of cycle runs.
Figure 14 shows the simulated intensity of two initial cyclones with time and the associated tracks with and without the DVI. Taking a different meridional departure toward the south of the terrain, both westbound cyclones may approach a similar quasi-stationary intensity (about 57–60 m s−1 for Vmax and 945 hPa for CSLP) after about 80 cycles, i.e., a cycled integration of 80 h (Figure 14a,b). The simulated tracks for CTL (without the DVI), noT (as CTL but resetting the terrain height to zero), and C100 (using the 100th cycle run in the DVI) show different track responses as the cyclones pass by the terrain (Figure 14c,e). All the cyclones moved straight westward at earlier stages, following the basic flow. In the presence of the terrain, the cyclones begin to deflect northward when moving close to the southeast of the terrain, and the deflection appears to be stronger for the initial stronger cyclone at both departures from the 150th north-south grid (Y150) and the 130th north-south grid (Y130) in the inner mesh. The configuration of the weaker cyclone departing from Y130 roughly mimics the condition of the observed Atsani. The cyclone is indeed driven toward the southwestern base of the terrain for Y130, and it can make landfall at the southwestern terrain when the meridional departure is higher at Y150. Note that the intensity evolution of the vortex between CTL and noT at Y130 or Y150 has increasingly deviated only after 6 h, which is similar to the real case. A noted rapid intensification in 10–20 h is induced for CTL, not for C100, owing to the larger impacts of the topographic influence on the initial weaker cyclone. In the absence of the terrain, the two westward-moving cyclones tend to gradually intensify with time. However, all the deflecting cyclones gradually weaken with time after about 45 h, as greatly impacted by the terrain blocking (Figure 14d,f).
The track deflection mechanism is similar to that given by Huang et al. [26]. In this example, the east-west wind asymmetry of the inner vortex is mainly produced by the flow recirculating southeast of the terrain to enhance the southerly component east of the vortex center, as well as by the flow blocked by the terrain to weaken the northerly component west of the vortex center. Regardless of the cyclone’s departure (relative to the terrain), the cyclone will be deflected northward by the topographic effects when closer to the terrain. The track of the weaker cyclone at the lower departure of Y130 is more similar to the observed track of Atsani. Compared to the track in the absence of the terrain, the track can be deflected severely by the terrain only after the vortex has moved close to the south of the terrain.
To illustrate the impact of the topographic effects on the vortex circulation, Figure 15 shows the simulated horizontal wind at 500 hPa at 0 h (the initial time), 24 h and 48 h for CTL and C100 with the initial cyclone departure from Y130. As shown in this figure, the initial cyclone in C100 is much stronger with a smaller eye compared to CTL, and both cyclones exhibit the east-west wind symmetry of the inner vortex (Figure 15a,d). Note that the weaker cyclone (without the DVI) in CTL is somewhat larger than the observed Atsani. The cyclone at 24 h for CTL has weakened from the peak intensity but without showing large wind asymmetry, while the outer wind is slightly stronger east of the vortex center and thus induces a slightly northward component of translation. At 850 hPa, stronger asymmetry is produced with the more intense wind to the east of the vortex center (not shown). The flow shading west of the terrain due to the blocking effect on the incoming cyclonic flow weakens the wind intensity west of the vortex center for both cyclones of CTL and C100. At 48 h, the flow asymmetry resulting from the flow shading west of the vortex center (southwest of the southern terrain) and the flow recirculating southeast of the vortex center becomes a salient feature of the cyclone circulation for C100, which has resulted in a pronounced northward cyclone movement. In contrast, the northward deflection for CTL is weaker in response to the quickly decaying flow of the weaker cyclone near the southern terrain. The rapid weakening of the two cyclones is also evidently found in the real case of Atsani as the cyclone moves close to the southwest of the southern end of Taiwan (see Figure 3). Since it is not handy to control the size and intensity of the evolving cyclone after dynamic adjustment, these idealized simulations are used to identify why northward deflection rather than southward deflection is typically induced for cyclones moving westward, similar to the real case of Atsani. The simulated track of Atsani with an increased northward deflection when close to the southwest of the Taiwan terrain is more similar to the idealized experiment CTL at Y130.
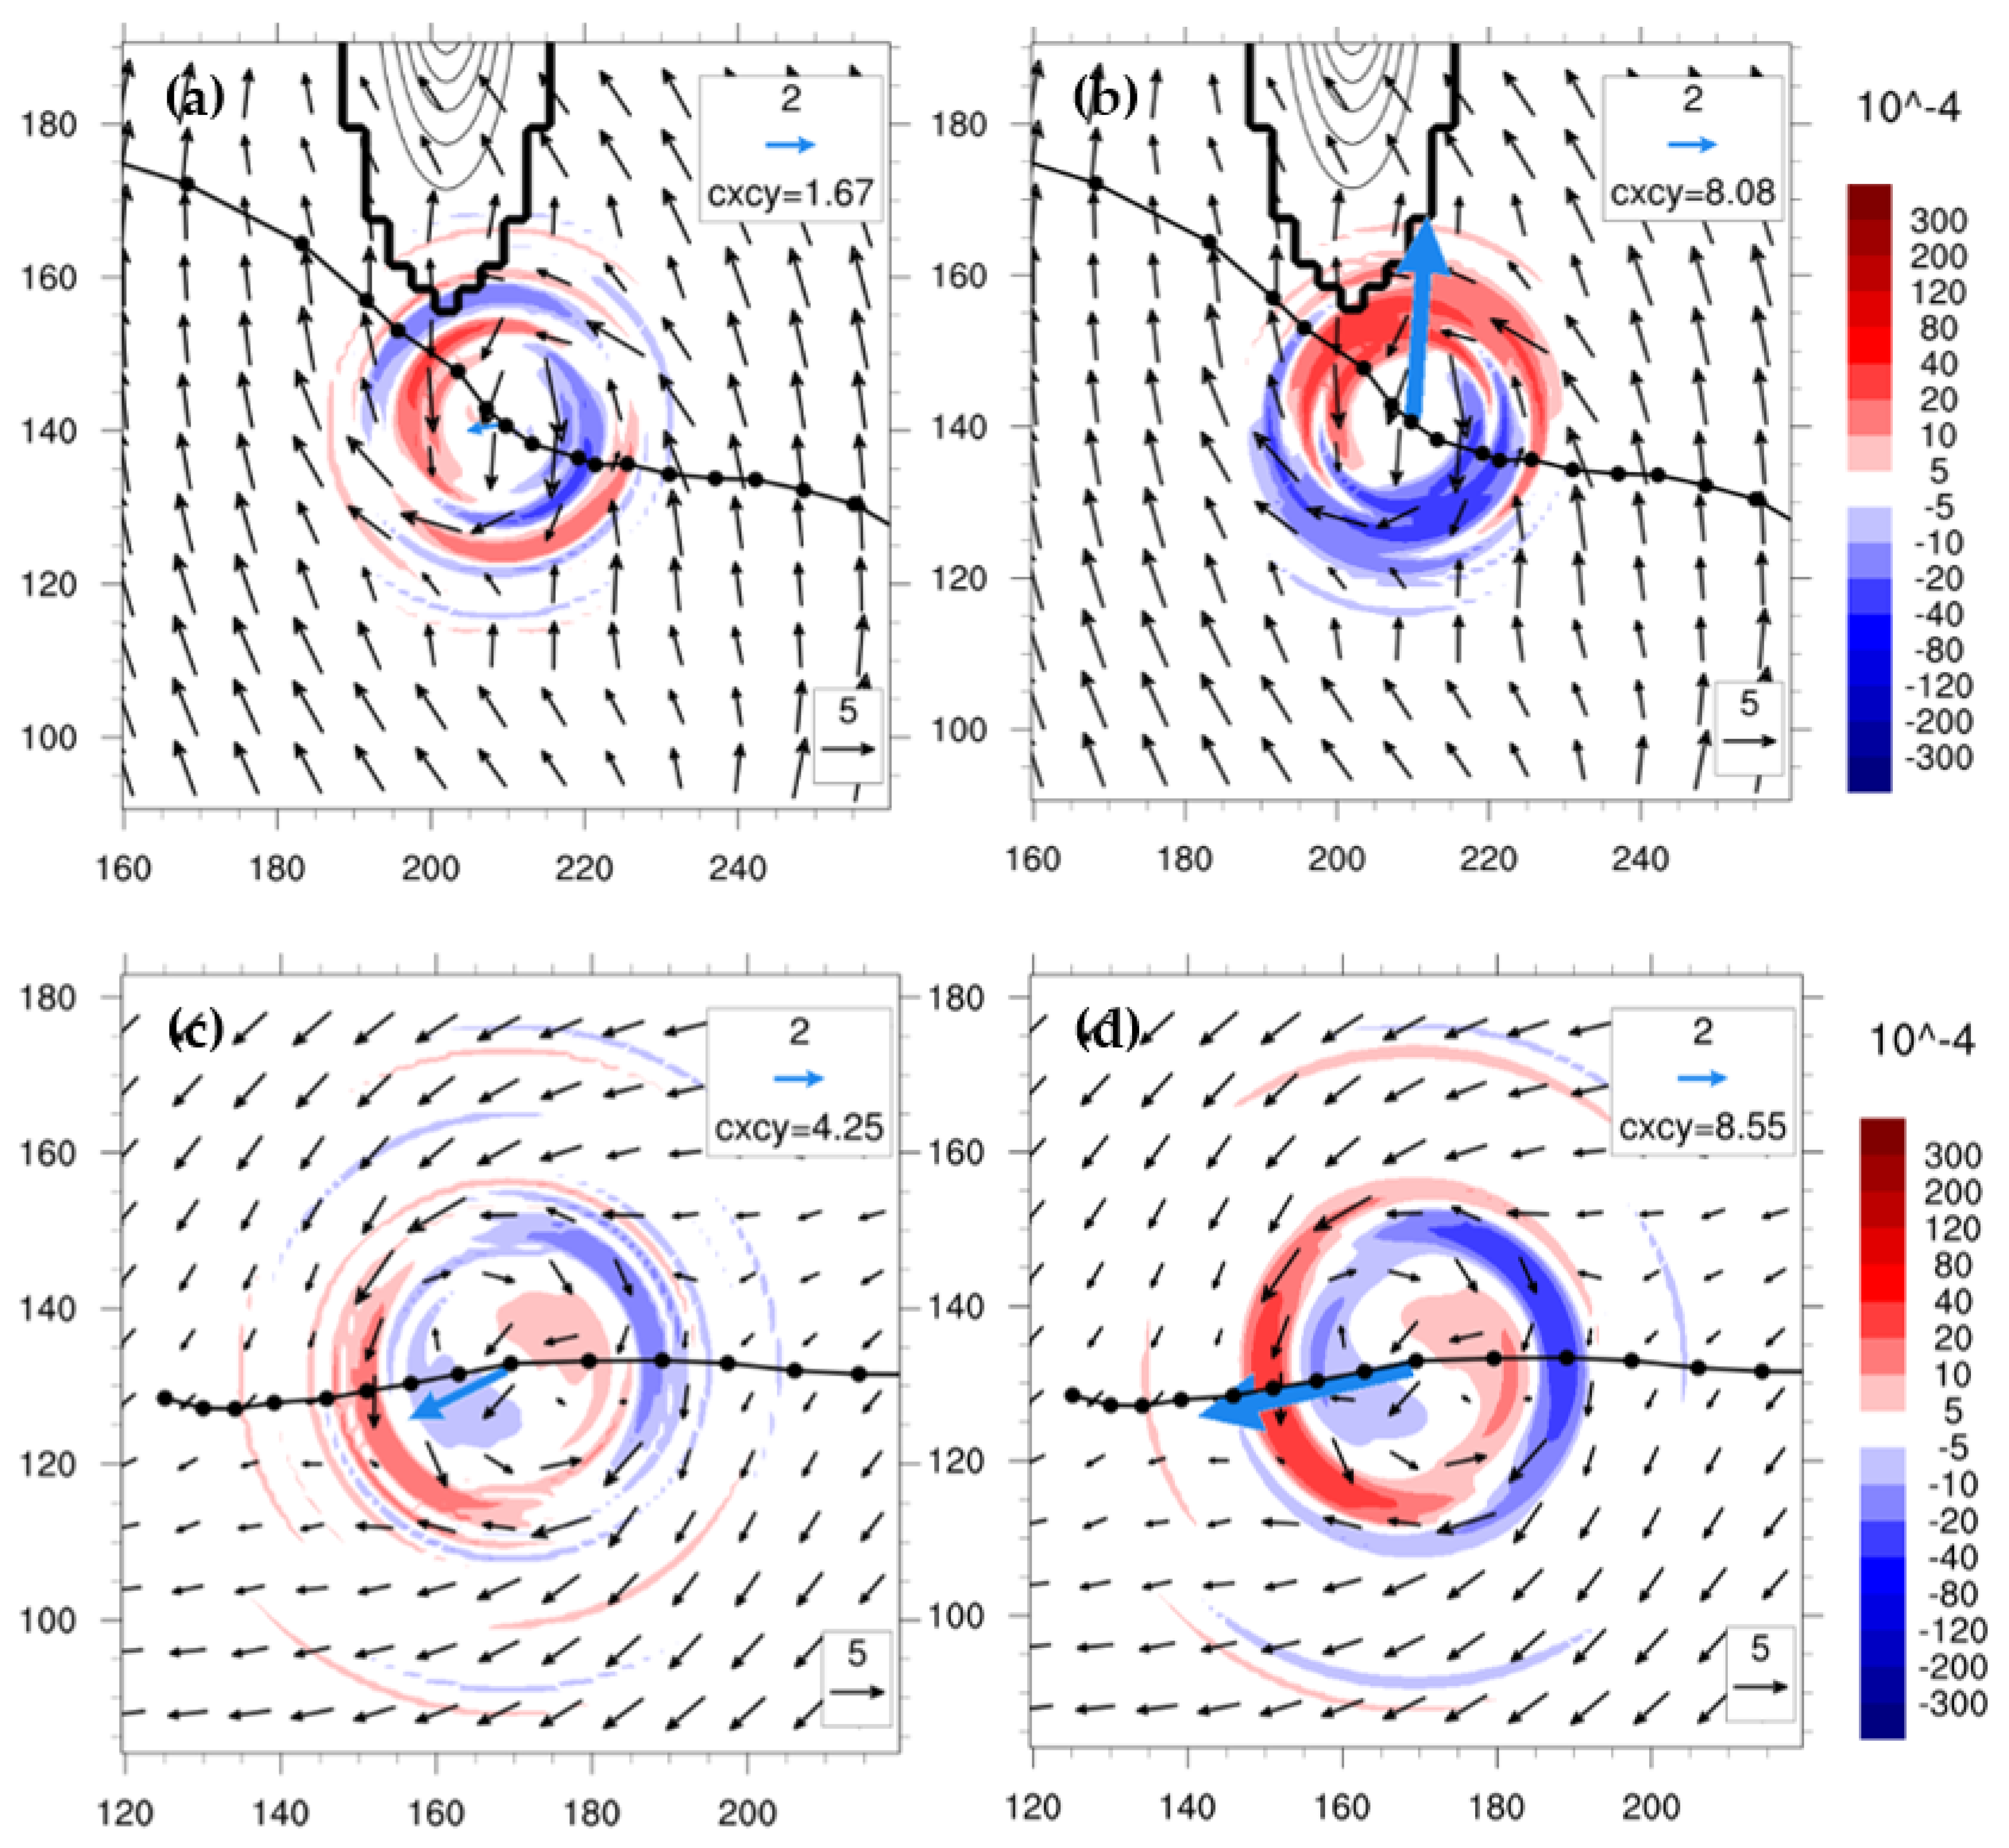
Figure 16 shows the simulated wavenumber-one wind and net PV budget terms averaged at about 1–8 km height over the surface at 45 h for C100 and noT. The wavenumber-one PV budget terms are calculated on the terrain following the coordinates of WRF. For C100, the wavenumber-one flow is mainly southerly to southeasterly around the inner vortex where a positive and negative net PV budget are induced to the northwest and southeast of the inner vortex core, respectively; the cyclone movement is essentially pointing to the maximum positive PV tendency at this time. As seen, this northward tendency is dominated by horizontal PV advection with an induced larger northward translation of 8.08 m s−1 (Figure 16b) than vertical PV advection (at 5.12 m s−1 toward southwest) and differential diabatic heating (at 5.24 m s−1 toward mainly southward) (figures not shown). In the absence of the topographic effect, the wavenumber-one flow in noT has shown a primarily westward component around the inner vortex core. Consequently, the vortex translation induced by the net PV budget (Figure 16c) points primarily westward in consistency with the actual movement. Similar to C100, such a westward movement is essentially controlled by the dominant horizontal PV advection with an induced large translation velocity of 8.55 m s−1 (Figure 16d) that is also counteracted by both vertical PV advection (at 3.53 m s−1 toward the southeast) and differential diabatic heating (at 2.88 m s−1 toward the northeast) (figures not shown).

4. Conclusions

Tropical Cyclone Atsani, occurring in early November 2020, the late autumn, passed west-northwestward through the Bashi Channel and took a northward-deflecting track offshore to the southwest of the CMR. Most of the operational forecasts at multi-agencies failed to predict such a northward deflection south of Taiwan, possibly due to the fact that use of relatively coarser horizontal resolution in operational models may not well resolve the topographic effects of the CMR. In this study, a global model MPAS at a multi-resolution of 60-15-3 km is utilized to explore the track responses of Atsani and identify the topographic effects of the CMR on the cyclone and the associated track deflection. The dynamic vortex initialization (DVI) employs a continuously cycled model integration of 1 h for a number of cycle runs until the integrated vortex has reached the observed best track intensity, either the central sea-level pressure (CSLP) or the maximum wind speed of the vortex (Vmax), denoted as P-match or V-match, respectively. In addition to the initial spin-up of the cyclone, the environmental conditions have also been slightly perturbed by GSI to obtain 10 ensemble members with the vortex using the P-match.
With a 3-km resolution targeted at the Taiwan area, the cyclone track deflection is reasonably simulated by MPAS, but shows more sensitivity to physics schemes and dynamic vortex initialization and less to environmental initial perturbations. Clustering of the simulated resemble tracks at later stages after passing offshore south of Taiwan tends to indicate the predictability of track deflection with regard to the initial uncertainties in the environmental analysis, even when the initial vortex has been dynamically adjusted to the best track intensity. On the other hand, the track deflection can be better captured by the stronger initial cyclone with the DVI but only slightly influenced by the P-match or V-match. When the northward track is better simulated, the observed rainfall over southern and eastern Taiwan is also better captured, despite some under-prediction due to the deviations in the simulated cyclone’s track and convection from the observed.
The simulated Atsani indeed deflects more northward earlier in the absence of the Taiwan terrain for both WRF and MPAS simulations. In particular, for some MPAS simulations, a stronger cyclone tends to generate a stronger east-west wind symmetry in the presence of the Taiwan terrain. However, this result of a more northward track in the absence of the Taiwan terrain is in contrast to some earlier idealized WRF simulations for similar west-northwest-bound cyclones passing south of Taiwan (e.g., [17,18]). Idealized WRF simulations at 3-km resolution are also utilized in this study to compare the track deflection of initial different departing cyclones that possess a maximum vortex wind speed Vmax of 30 m s−1 under the basic easterly flow of 4 m s−1, similar to the real case. The same DVI is also applied to the initial vortex to obtain a quasi-stationary state of the spin-up Ekman-gradient wind vortex after 100 cycle runs, which is much stronger with a Vmax of 57 m s−1 than the initial gradient-wind vortex with a Vmax of 33 m s−1. It was found that a northward deflection will be induced near the south of the CMR-like terrain for both stronger and weaker cyclones departing at different latitudes, which is in agreement with other idealized studies (e.g., [17,18,26]). For stronger and larger cyclones, the flow shading west of the terrain that weakens the northerly component west of the vortex center as well as the flow recirculating southeast of the terrain that enhances the southerly component east of the vortex center will tend to aid a larger east-west wind asymmetry of the inner vortex, thus resulting in a more northward deflection, as in the idealized simulations for northwest-bound cyclones past the CMR-like terrain ([26]).
For the real-case of Atsani, at a relatively smaller size and less intense Vmax, the topographic effects of the CMR have not produced significant impacts on the east-west wind asymmetry of the vortex moving offshore south of the terrain to induce a pronounced northward deflection as in the idealized simulations. In the absence of topographic influences, stronger east-west wind asymmetry occurs for the cyclone to deflect more northward earlier when moving close to the southeast of Taiwan. Such contrasting deflections, however, are more related to the natural development of the cyclone, rather than to the topographic effects of the CMR, which cause a different structural evolution at earlier stages to induce a favorable larger deflection. The real-case forecasts tend to gradually differ in the inner cyclone in response to the initial tiny differences in the model state in the absence of the Taiwan terrain and thus induce different tracks at later times. In both real and idealized cases, the track deflection of the offshore moving cyclone is essentially controlled by the dominant horizontal PV advection compared to both vertical PV advection and differential diabatic heating.

Author Contributions

Conceptualization, C.-Y.H.; Data curation, C.-Y.H.; Formal analysis, C.-Y.H., J.-Y.L., J.-S.H. and L.-F.H.; Funding acquisition, C.-Y.H.; Investigation, C.-Y.H. and D.-S.C.; Methodology, C.-Y.H.; Project administration, C.-Y.H.; Resources, C.-Y.H.; Software, C.-Y.H. and J.-Y.L.; Writing—original draft, C.-Y.H., J.-Y.L. and S.-Y.C.; Writing—review & editing, C.-Y.H., H.-C.K., D.-S.C., J.-S.H., L.-F.H. and S.-Y.C. All authors have read and agreed to the published version of the manuscript.

Funding

This study was supported by the Ministry of Science and Technology (MOST) (grant No. MOST 110-2111-M-008-014) in Taiwan.

Institutional Review Board Statement

Not applicable.

Informed Consent Statement

Not applicable.

Data Availability Statement

The best track data are obtained from the CWB, and the model forecasts are available from the workstation of the typhoon laboratory at the Department of Atmospheric Sciences, National Central University from 140.115.35.103.

Acknowledgments

We appreciate D. Nolan for his idealized WRF codes for use. Thi-Chinh Nguyen helped on editing and proofreading the manuscript. We are thankful for National Center for High-performance Computing (NCHC) in Taiwan for providing computational and storage resources. This study was supported by the Ministry of Science and Technology (MOST) in Taiwan.

Conflicts of Interest

The authors declare no conflict of interest.

References

  1. Wu, C.-C.; Kuo, Y.-H. Typhoons affecting Taiwan: Current understanding and future challenges. Bull. Am. Meteorol. Soc. 1999, 80, 67–80. [Google Scholar] [CrossRef]
  2. Kim, H.-J.; Suh, S.-W. Improved hypothetical typhoon generation technique for storm surge frequency analyses on the Southwest Korean Coast. J. Coast. Res. 2018, 85, 516–520. [Google Scholar] [CrossRef]
  3. Hsu, L.-H.; Kuo, H.-C.; Fovell, R.G. On the geographic asymmetry of typhoon translation speed across the mountainous island of Taiwan. J. Atmos. Sci. 2013, 70, 1006–1022. [Google Scholar] [CrossRef]
  4. Wei-Jen Chang, S. The orographic effects induced by an island mountain range on propagating tropical cyclones. Mon. Weather Rev. 1982, 110, 1255–1270. [Google Scholar] [CrossRef] [Green Version]
  5. Bender, M.A.; Tuleya, R.E.; Kurihara, Y. A numerical study of the effect of island terrain on tropical cyclones. Mon. Weather Rev. 1987, 115, 130–155. [Google Scholar] [CrossRef] [Green Version]
  6. Yeh, T.-C.; Elsberry, R.L. Interaction of typhoons with the Taiwan orography. Part I: Upstream track deflections. Mon. Weather Rev. 1993, 121, 3193–3212. [Google Scholar] [CrossRef] [Green Version]
  7. Yeh, T.-C.; Elsberry, R.L. Interaction of typhoons with the Taiwan orography. Part II: Continuous and discontinuous tracks across the island. Mon. Weather Rev. 1993, 121, 3213–3233. [Google Scholar] [CrossRef] [Green Version]
  8. Lin, Y.-L.; Han, J.; Hamilton, D.W.; Huang, C.-Y. Orographic influence on a drifting cyclone. J. Atmos. Sci. 1999, 56, 534–562. [Google Scholar] [CrossRef]
  9. Kuo, H.-C.; Williams, R.; Chen, J.-H.; Chen, Y.-L. Topographic effects on barotropic vortex motion: No mean flow. J. Atmos. Sci. 2001, 58, 1310–1327. [Google Scholar] [CrossRef]
  10. Lin, Y.-L.; Ensley, D.B.; Chiao, S.; Huang, C.-Y. Orographic influences on rainfall and track deflection associated with the passage of a tropical cyclone. Mon. Weather Rev. 2002, 130, 2929–2950. [Google Scholar] [CrossRef] [Green Version]
  11. Lin, Y.-L.; Chen, S.-Y.; Hill, C.M.; Huang, C.-Y. Control parameters for the influence of a mesoscale mountain range on cyclone track continuity and deflection. J. Atmos. Sci. 2005, 62, 1849–1866. [Google Scholar] [CrossRef]
  12. Huang, C.-Y.; Lin, Y.-L. The influence of mesoscale mountains on vortex tracks: Shallow-water modeling study. Meteorol. Atmos. Phys. 2008, 101, 1–20. [Google Scholar] [CrossRef]
  13. Jian, G.-J.; Wu, C.-C. A numerical study of the track deflection of Supertyphoon Haitang (2005) prior to its landfall in Taiwan. Mon. Weather Rev. 2008, 136, 598–615. [Google Scholar] [CrossRef]
  14. Lin, Y.-L.; Savage, L.C., III. Effects of landfall location and the approach angle of a cyclone vortex encountering a mesoscale mountain range. J. Atmos. Sci. 2011, 68, 2095–2106. [Google Scholar] [CrossRef]
  15. Huang, Y.-H.; Wu, C.-C.; Wang, Y. The influence of island topography on typhoon track deflection. Mon. Weather Rev. 2011, 139, 1708–1727. [Google Scholar] [CrossRef]
  16. Wu, C.-C.; Li, T.-H.; Huang, Y.-H. Influence of mesoscale topography on tropical cyclone tracks: Further examination of the channeling effect. J. Atmos. Sci. 2015, 72, 3032–3050. [Google Scholar] [CrossRef]
  17. Tang, C.K.; Chan, J.C. Idealized simulations of the effect of Taiwan topography on the tracks of tropical cyclones with different sizes. Q. J. R. Meteorol. Soc. 2016, 142, 793–804. [Google Scholar] [CrossRef]
  18. Tang, C.K.; Chan, J.C. Idealized simulations of the effect of Taiwan topography on the tracks of tropical cyclones with different steering flow strengths. Q. J. R. Meteorol. Soc. 2016, 142, 3211–3221. [Google Scholar] [CrossRef]
  19. Huang, C.-Y.; Chen, C.-A.; Chen, S.-H.; Nolan, D.S. On the upstream track deflection of tropical cyclones past a mountain range: Idealized experiments. J. Atmos. Sci. 2016, 73, 3157–3180. [Google Scholar] [CrossRef] [Green Version]
  20. Hsu, L.-H.; Su, S.-H.; Fovell, R.G.; Kuo, H.-C. On typhoon track deflections near the east coast of Taiwan. Mon. Weather Rev. 2018, 146, 1495–1510. [Google Scholar] [CrossRef]
  21. Huang, K.-C.; Wu, C.-C. The impact of idealized terrain on upstream tropical cyclone track. J. Atmos. Sci. 2018, 75, 3887–3910. [Google Scholar] [CrossRef]
  22. Huang, C.-Y.; Huang, C.-H.; Skamarock, W.C. Track deflection of typhoon Nesat (2017) as realized by multiresolution simulations of a global model. Mon. Weather Rev. 2019, 147, 1593–1613. [Google Scholar] [CrossRef] [Green Version]
  23. Huang, C.-Y.; Chou, C.-W.; Chen, S.-H.; Xie, J.-H. Topographic rainfall of tropical cyclones past a mountain range as categorized by idealized simulations. Weather Forecast. 2020, 35, 25–49. [Google Scholar] [CrossRef]
  24. Skamarock, W.C.; Klemp, J.B.; Duda, M.G.; Fowler, L.D.; Park, S.-H.; Ringler, T.D. A multiscale nonhydrostatic atmospheric model using centroidal Voronoi tesselations and C-grid staggering. Mon. Weather Rev. 2012, 140, 3090–3105. [Google Scholar] [CrossRef] [Green Version]
  25. Chen, S.-Y.; Shih, C.-P.; Huang, C.-Y.; Teng, W.-H. An Impact Study of GNSS RO Data on the Prediction of Typhoon Nepartak (2016) Using a Multiresolution Global Model with 3D-Hybrid Data Assimilation. Weather Forecast. 2021, 36, 957–977. [Google Scholar]
  26. Huang, C.-Y.; Lin, J.-Y.; Skamarock, W.C.; Chen, S.-Y. Typhoon forecasts with dynamic vortex initialization using an unstructured mesh global model. Mon. Wea. Rev. 2022; submitted. [Google Scholar]
  27. Van Nguyen, H.; Chen, Y.-L. High-resolution initialization and simulations of Typhoon Morakot (2009). Mon. Weather Rev. 2011, 139, 1463–1491. [Google Scholar] [CrossRef]
  28. Cha, D.-H.; Wang, Y. A dynamical initialization scheme for real-time forecasts of tropical cyclones using the WRF model. Mon. Weather Rev. 2013, 141, 964–986. [Google Scholar] [CrossRef]
  29. Van Nguyen, H.; Chen, Y.-L. Improvements to a tropical cyclone initialization scheme and impacts on forecasts. Mon. Weather Rev. 2014, 142, 4340–4356. [Google Scholar] [CrossRef]
  30. Liu, H.-Y.; Wang, Y.; Xu, J.; Duan, Y. A dynamical initialization scheme for tropical cyclones under the influence of terrain. Weather Forecast. 2018, 33, 641–659. [Google Scholar] [CrossRef]
  31. Hsiao, L.-F.; Liou, C.-S.; Yeh, T.-C.; Guo, Y.-R.; Chen, D.-S.; Huang, K.-N.; Terng, C.-T.; Chen, J.-H. A vortex relocation scheme for tropical cyclone initialization in advanced research WRF. Mon. Weather Rev. 2010, 138, 3298–3315. [Google Scholar] [CrossRef]
  32. Hsiao, L.-F.; Chen, D.-S.; Hong, J.-S.; Yeh, T.-C.; Fong, C.-T. Improvement of the Numerical Tropical Cyclone Prediction System at the Central Weather Bureau of Taiwan: TWRF (Typhoon WRF). Atmosphere 2020, 11, 657. [Google Scholar] [CrossRef]
  33. Grell, G.A.; Freitas, S.R. A scale and aerosol aware stochastic convective parameterization for weather and air quality modeling. Atmos. Chem. Phys. 2014, 14, 5233–5250. [Google Scholar] [CrossRef] [Green Version]
  34. Zhang, C.; Wang, Y. Projected future changes of tropical cyclone activity over the western North and South Pacific in a 20-km-mesh regional climate model. J. Clim. 2017, 30, 5923–5941. [Google Scholar] [CrossRef]
  35. Thompson, G.; Field, P.R.; Rasmussen, R.M.; Hall, W.D. Explicit forecasts of winter precipitation using an improved bulk microphysics scheme. Part II: Implementation of a new snow parameterization. Mon. Weather Rev. 2008, 136, 5095–5115. [Google Scholar] [CrossRef]
  36. Niu, G.Y.; Yang, Z.L.; Mitchell, K.E.; Chen, F.; Ek, M.B.; Barlage, M.; Kumar, A.; Manning, K.; Niyogi, D.; Rosero, E. The community Noah land surface model with multiparameterization options (Noah-MP): 1. Model description and evaluation with local-scale measurements. J. Geophys. Res. Atmos. 2011, 116, D12. [Google Scholar] [CrossRef] [Green Version]
  37. Nakanishi, M.; Niino, H. Development of an improved turbulence closure model for the atmospheric boundary layer. J. Meteorol. Soc. Japan Ser. II 2009, 87, 895–912. [Google Scholar] [CrossRef] [Green Version]
  38. Hong, S.-Y.; Noh, Y.; Dudhia, J. A new vertical diffusion package with an explicit treatment of entrainment processes. Mon. Weather Rev. 2006, 134, 2318–2341. [Google Scholar] [CrossRef] [Green Version]
  39. Iacono, M.J.; Delamere, J.S.; Mlawer, E.J.; Shephard, M.W.; Clough, S.A.; Collins, W.D. Radiative forcing by long-lived greenhouse gases: Calculations with the AER radiative transfer models. J. Geophys. Res. Atmos. 2008, 113. [Google Scholar] [CrossRef]
  40. Xu, K.-M.; Randall, D.A. A semiempirical cloudiness parameterization for use in climate models. J. Atmos. Sci. 1996, 53, 3084–3102. [Google Scholar] [CrossRef] [Green Version]
  41. Hong, S.-Y.; Lim, J.-O.J. The WRF single-moment 6-class microphysics scheme (WSM6). Asia-Pac. J. Atmos. Sci. 2006, 42, 129–151. [Google Scholar]
  42. Wu, L.; Wang, B. A potential vorticity tendency diagnostic approach for tropical cyclone motion. Mon. Weather Rev. 2000, 128, 1899–1911. [Google Scholar] [CrossRef] [Green Version]
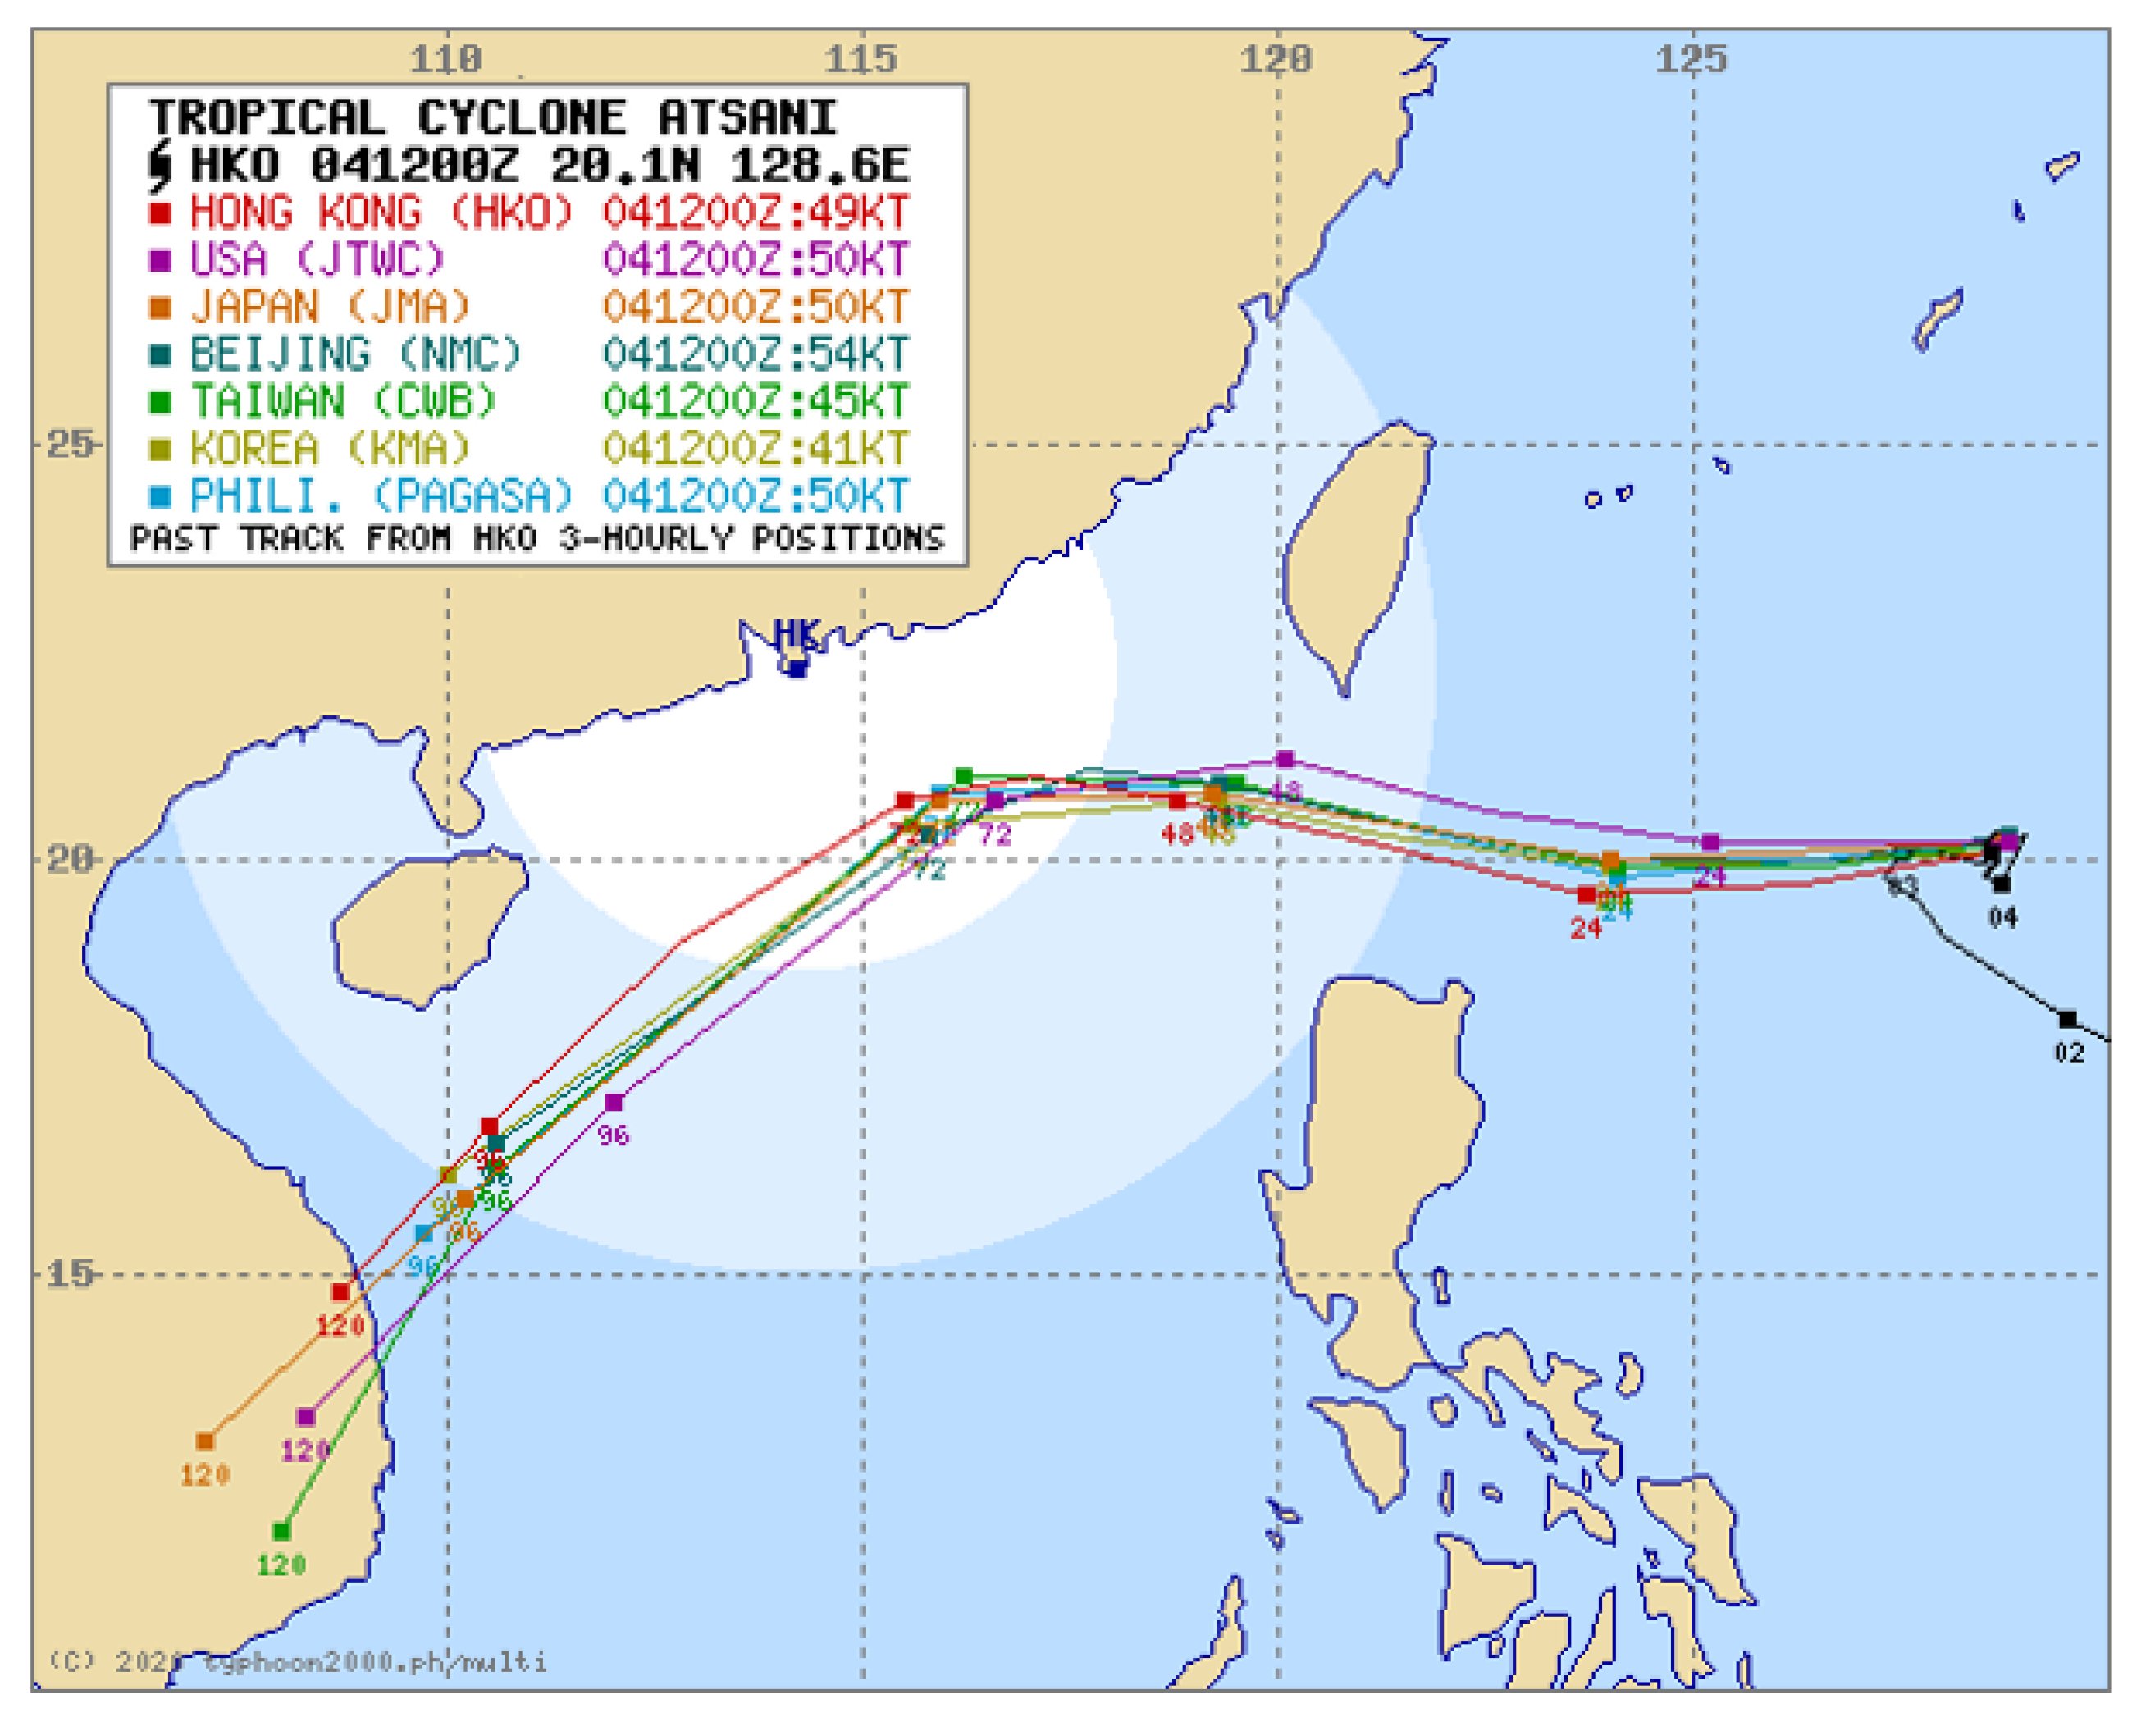
Figure 1. Track forecasts for Tropical Cyclone Atsani starting from 1200 UTC 4 November 2020 from several operational centers. (Available from http://www.typhoon2000.ph/multi/log.php?name=ATSANI_2020 accessed on 11 April 2022).
Atmosphere 13 00618 g001
Figure 2. Track forecasts for Tropical Cyclone Atsani (2020, November) from TWRF at CWB starting from (a) 0600 UTC 3, (b) 1800 UTC 3, (c) 1200 UTC 4, and (d) 1800 UTC 4 for the experiments CTL (in blue) and noT (as CTL but resetting the Taiwan terrain to ocean, in red) compared to the best track of CWB (OBS in black). All the tracks are overlapped with solid circles at an interval of 6 h.
Atmosphere 13 00618 g002
Figure 3. (a) The simulated tracks for Tropical Cyclone Atsani with MPAS for CTL (no DVI) in red, noT (as CTL but without the Taiwan terrain) in blue, C7-P (P-match at 7 cycles) in green, C7-5_P (the 5th member of initial ensemble perturbations from C7-P) in pink, C7-5_P_noT (as C7-5_P but without the Taiwan terrain) in purple, and the best track of CWB in black for forecasts starting from 1200 UTC 4 November 2020. (b) as in (a) but for the track errors with forecast time of 72 h, (c) as in (b) but for CSLP (hPa), and (d) as in (b) but for Vmax (m s−1). (e) The simulated tracks for the ten members with initial perturbations of C7-P and the best track of CWB in black, and (f) as in (e) but for the track errors with time. The legend for perturbation members (7-1 to 7-10) is indicated in (f) with 7-5 in purple (the same experiment as C7-5_P).
Atmosphere 13 00618 g003aAtmosphere 13 00618 g003b
Figure 4. (a) The simulated tracks by MPAS for Typhoon Atsani for CTL (no cycling) in red, noT (as CTL but without the Taiwan terrain) in blue, P-match (at 19 cycles) in green and V-match (at 9 cycles) in pink and the best track from CWB in black from 0000 UTC 5 November 2020. (b) The track errors with time for CTL, noT, V-match, and P-match. (c) as in (b) but for CSLP (hPa), and (d) as in (b) but for Vmax (m s−1). The mesoscale reference physics suite is employed in the experiments with the 60-15-3 km mesh.
Atmosphere 13 00618 g004aAtmosphere 13 00618 g004b
Figure 5. (a) The simulated tracks for Atsani with MPAS for CTL (no cycling) in red, noT (without the Taiwan terrain) in blue, C7_P (7 cycles with P match) in green, C7_PC (as C7_P but replace the M-suite to C-suite) in pink, C7_PMGF (as C7_P but replace the cumulus parameterization with Grell-Freitas scheme) in purple, PMTHOM (as C7_P but the replace microphysics parameterization with Thompson scheme) in orange, PMMTNN (as C7_P but replace the boundary layer parameterization with the MYNN scheme) in brown, and the best track of CWB in black from 1200 UTC 4 November 2020. (b) as in (a) but for the track errors with forecast time. (c) as in (b) but for CSLP (hPa), and (d) as in (b) but for Vmax (m s−1).
Atmosphere 13 00618 g005
Figure 6. The 24-h accumulated rainfall (shaded colors in mm with a reference bar to the right) for Atsani from 0000 UTC 6 to 0000 UTC 7 November 2020 for (a) the observation from the CWB, (b) CTL (no DVI), (c) C7_P, and (d) C7-5_P.
Atmosphere 13 00618 g006
Figure 7. (a) Observed radar reflectivity (shaded colors in dBZ with a reference bar at the bottom) from the CWB at 0000 UTC 6 November 2020, (b) as in (a) but at six hours later (0600 UTC 6 November 2020). (c,d) as in (a,b), respectively, but for the simulated radar reflectivity for CTL, (e,f) as in (a,b), respectively, but for C7-5_P.
Atmosphere 13 00618 g007aAtmosphere 13 00618 g007b
Figure 8. The simulated horizontal wind vector (m s−1) at 500 hPa at 1200 UTC 4 November 2020 (the initial time) for (a) CTL, (b) as in (a) but at 1200 UTC 5 November 2020, (c,d) as in (a,b), respectively, but for C7-5_P, (e,f) as in (a,b), respectively, but for C7-5_P_noT. Shaded colors represent horizontal wind speed (m s−1) with a reference bar at the bottom.
Atmosphere 13 00618 g008
Figure 9. (a) The simulated horizontal wind vector (m s−1) at 500 hPa at 0600 UTC 6 November 2020 for CTL. (b) as in (a) but at 1200 UTC 6 November 2020. (c,d) as in (a,b), respectively, but for C7-5_P; (e,f) as in (a,b), respectively, but for C7-5_P_noT. Shaded colors represent horizontal wind speed (m s−1) with a reference bar at the bottom.
Atmosphere 13 00618 g009
Figure 10. The simulated horizontal wind vector (m s−1) and wind averaged in 1–8 km height at 1200 UTC 6 November 2020 for (a) CTL. (b) as in (a) but for C7-5_P, and (c) as in (a) but for C7-5_P_noT. Shaded colors represent horizontal wind speed (m s−1) with a reference bar at the bottom. The simulated tracks are overlapped with the black solid cycles at an interval of 6 h.
Atmosphere 13 00618 g010
Figure 11. (a) The simulated horizontal wind vector and PV (shaded colors with a reference bar to the right) averaged within 30 min of 0000 UTC 6 November 2020 and in 1–8 km height for CTL. (b) as in (a) but for the net PV budget overlapped with the wavenumber-one flow; (c,d) as in (a,b), respectively, but for C7-5_P; (e,f) as in (a,b), respectively, but for C7-5_P_noT. PV is in units of 10−2 PVU (1 PVU = 10−6 K kg−1 m2 s−1), and PV budget is in units of 10−5 PVU s−1 (0.036 PVU h−1). The bold vector at the center of (b,d,f) indicates the induced translation velocity (m s−1) with the magnitude given at the lower right. A reference wind vector (m s−1) is given at the upper right in panels (a,b).
Atmosphere 13 00618 g011
Figure 12. (a) The simulated wavenumber-one horizontal wind vector and horizontal PV advection (shaded colors with a reference bar to the right) averaged within 30 min of 0000 UTC 6 November 2020 and in 1–8 km height for CTL. (b) as in (a) but for differential diabatic heating. (c,d) as in (a,b), respectively, but for C7-5_P; (e,f) as in (a,b), respectively, but for C7-5_P_noT. PV budget is in units of 10−5 PVU s−1 (0.036 PVU h−1). The bold vector at the center of each panel indicates the induced translation velocity (m s−1) with the magnitude given at the lower right. A reference wind vector (m s−1) is given at the upper right in (a).
Atmosphere 13 00618 g012
Figure 13. (a) The simulated wavenumber-one horizontal wind vector and horizontal PV advection (shaded colors with a reference bar to the right) averaged within 30 min of 1200 UTC 6 November 2020 and in 1–8 km height for C7-5_P. (b) as in (a) but for vertical PV advection, and (c) as in (a) but for differential diabatic heating. (df) as in (ac), respectively, but for C7-5_P_noT. PV budget is in units of 10−5 PVU s−1 (0.036 PVU h−1). The bold vector at the center of each panel indicates the induced translation velocity (m s−1) with the magnitude given at the lower right. A reference wind vector (m s−1) is given at the upper left in (a).
Atmosphere 13 00618 g013aAtmosphere 13 00618 g013b
Figure 14. (a) The evolution of sea level pressure (hPa) (in red) and Vmax (m s−1) (in blue) with cycle runs using the initial cyclone of CTL at Y130. (b) as in (a) but at Y150. (c) The simulated tracks for CTL at Y130 (in red), C100 (the initial cyclone at 100th cycles, in blue), and noT (as CTL but without the terrain, in green). (d) as in (c) but for the evolution of Vmax (m s−1) at 10-m height with forecast time (h). (e) as in (c) but at Y150, and (f) as in (d) but at Y150. In (c) and (e), the idealized elliptical mountain range is plotted by the solid contours at an interval of 500 m, enclosed by the coastline (in the bold line).
Atmosphere 13 00618 g014
Figure 15. The simulated horizontal wind vector (m s−1) at 500 hPa with the idealized WRF for (a) CTL (with the initial weaker cyclone at Y130) at the initial time. (b) as in (a) but at 24 h, and (c) as in (a) but at 48 h. (df) as in (ac), respectively, but for Experiment C100 (with the initial stronger cyclone at Y130). Shaded colors represent horizontal wind speed (m s−1) with a reference bar at the right. A reference wind vector (m s−1) is given at the lower right corner of each panel. The red curve in each panel denotes the simulated track with black dot points for every 24 h. The solid contour is the coastline.
Atmosphere 13 00618 g015
Figure 16. (a) The simulated wavenumber-one wind vector and net PV budget averaged in about 1–8 km height over the surface (shaped colors with a reference bar to the right) with the idealized WRF for Experiment C100 at 45 h. (b) as in (a) but for horizontal PV advection, (c,d) as in (a,b), respectively, but for Experiment noT. PV budget is in units of 10−5 PVU s−1 (0.036 PVU h−1). A reference wind vector (m s−1) is given at the lower right corner of each panel. The blue bold vector at the vortex center indicates the induced vortex translation velocity with the magnitude given at the upper right corner of each panel. In (a) and (b), the idealized elliptical mountain range is plotted by the solid contours at an interval of 500 m, enclosed by the coastline (in the bold line).
Atmosphere 13 00618 g016
Table 1. Numerical experiments of MPAS conducted at the initial time of 1200 UTC 4 November 2020 for Tropical Cyclone Atsani (2020). Physics suites (mesoscale reference suite and convection-permitting suite, denoted by M-suite and C-suite, respectively) are described in Table 2.
Experiment NamesPhysics SchemesDVIResetting Taiwan Terrain
CTLM-suiteNoNo
noTM-suiteNoYes
C7_PM-suiteP-matchNo
C7-5_PM-suiteFifth member with P-match No
C7-5_P_noTM-suiteFifth member with P-match Yes
C7_PCC-suiteP-matchNo
C7_PMGFM-suite, but using Grell-Freitas schemeP-match No
C7_PMTHOMM-suite, but using Thompson schemeP-matchNo
C7_PMMTNNM-suite, but using MYNN schemeP-matchNo
Table 2. Physical parameterization schemes contained in the two physics suites (mesoscale reference suite and convection-permitting suite) used in numerical experiments of MPAS.
Physical ParameterizationMesoscale Reference SuiteConvection-Permitting Suite
Cumulus convectionNew-TiedtkeGrell–Freitas
Cloud microphysicsWSM6Thompson
Land surfaceNoahNoah
Boundary layerYSUMYNN
Surface layerMonin–ObukhoviMYNN
Radiation LW/SWRRTMGRRTMG
Cloud fraction for radiationXu–RandallXu–Randall
Acronyms of he physics schemes:
Grell-FreitasGrell–Freitas convective cumulus parameterization ([33])
New-TiedtkeNew-Tiedtke convective cumulus parameterization ([34])
ThompsonCloud microphysics scheme with prognostic ice, snow, graupel processes and rain number concentration ([35])
NoahNoah land surface model ([36])
MYNNMellor–Yamada Nakanishi and Niino Level-3 PBL parameterization ([37])
YSUYonsei University (YSU) planetary boundary-layer parameterization ([38])
RRTMGRapid Radiative Transfer Model for General Circulation Models (RRTMG) longwave (LW) and shortwave (SW) scheme ([39])
Xu-RandallXu–Randall cloud fraction parameterization ([40])
WSM6Single-moment 6-class microphysics scheme of the WRF Model ([41])
Publisher’s Note: MDPI stays neutral with regard to jurisdictional claims in published maps and institutional affiliations.