Abstract
Quadrant analysis has been widely used to investigate the turbulent characteristics in the atmospheric boundary layer (ABL). Although quadrant analysis can identify turbulent structures that contribute significantly to turbulent fluxes, the approach to the hyperbolic hole and its parameter, referred to as hole size, remains uncertain and varies among different studies. This study discusses an improved quadrant analysis with an objective definition of the hole size for the isolation of large coherent structures from small-scale background fluctuations. Eddy covariance data collected 50 m above the grass canopy were used to analyze and evaluate the proposed method. This improved quadrant analysis ensures that the detected large coherent eddies play a dominant role in transporting fluxes, occupying 10% of the total time, with mean flux contributions ranging from 62% to 95% for momentum and 35–104% for scalars. The separated background small-scale eddies are isotropically characterized by a comparable time duration and flux contributions in each quadrant. It is observed that under an unstable atmosphere, large-scale ejections are more active than sweeps, while under stable conditions, they are equally important. Furthermore, mechanical-driven transport under near-neutral conditions only enhances ejection and sweep motions of momentum. In contrast, the buoyancy-driven scenarios under unstable conditions enhance the large-scale activities of sensible heat alone.
1. Introduction
Coherent structures, usually called ejection-sweep cycles or bursting, play a significant role in the turbulent transport of momentum, sensible heat, carbon dioxide, and water vapor in the ABL [1]. A better understanding of such significant motions in the turbulent flows is of great importance for the parametrizations of land-atmosphere exchanges or air pollutants dispersion in the numerical models. Inspired by the first demonstration of near-wall fluid motions by Kline et al. [2] and the visualization of ejections and sweeps by Corino and Brodkey [3], Willmarth and Lu [4] introduced a widely used quadrant analysis method to quantify the contributions of each quadrant to the Reynolds shear stress and the timescale signatures of ejections and sweeps. The threshold setting and conditional sampling for the streamwise and wall-normal velocity components of quadrant analysis have been modified over past few decades. Lu and Willmarth [5] introduced the hyperbolic threshold () and its factor to extract the large contributors in each quadrant, where size was decided by times the local root mean square values of streamwise and wall-normal signals. Raupach et al. [6] defined the parameter above which 50% of the flux transfer occurs, ranges from 1.7 to 2.7 multiplied by normalization covariance. Narasimha et al. [7] defined with the criterion that the flux contribution of small-scale events balanced each other, ranging from 1 to 1.5 multiplied by root mean square. Schmutz and Vogt [8] computed the when the flux fraction of down-gradient (ejection and sweep) dominated the flux transport comparing to counter-gradient motions, ranges from 4 to 9 multiplied by covariance. Other studies [9,10] used to multiply the root mean square of the flux. While some studies conducted quadrant analysis without using the hyperbolic hole [11,12]. Although using different or not using did not affect the dominant role of ejection and sweep, the existence of the hyperbolic threshold could identify significantly large contributor in the quadrant, 40–75% flux contribution with only 10% of averaging period [8]. To what extent did the small-scale events affect the observed imbalanced contributions of ejections and sweeps and asymmetry in the joint probability density function (JPDF) [13] of streamwise and vertical velocity fluctuations [14,15,16]. However, the different approaches of made it difficult to compare the results collected from various canopies in previous studies. This inspired us to dig deep into the connection between the hyperbolic threshold and isotropic feature of the small-scale event.
In the study of ejection and sweep, various applications of quadrant analysis have been extended to different studies of different canopies. The significant role of coherent turbulent motions to be responsible for a large fraction of momentum and scalar flux transport has been revealed over vegetation canopies [14,15,17,18,19,20], vineyards [12,21], lakes [12,16,22], and sea [23]. Many studies have also found that ejection and sweep events play an important role in urban canopies [8,24,25,26,27,28,29]. Under different stability regimes, turbulent flow characteristics are similar between other canopies [28]. In addition, many studies have investigated the reasons for momentum and scalar transport dissimilarity in different ecosystems, such as advection [30,31]; entrainment into the boundary layer [32,33]; atmospheric stability [8,12]; and differences in sources and sinks [26,34]. However, the quadrant data used to analyze the dissimilarity features contain small-scale motions [8,12,28]. Therefore, additional analyses are needed to investigate the behaviors of large-scale events in the dissimilarity transport of momentum and scalars and to understand their role in the ejection-sweep cycle under different stability conditions.
To better understand the dissimilarity of momentum and scalar transport, it is necessary to identify and extract large-scale motions from small-scale turbulence with a proper threshold. We introduce a isotropic threshold technique to improve the defining-hole-parameter process by determining the connection between the hyperbolic threshold and isotropic events. By using this method, the large-scale motions we extracted are more persuasive and efficient for turbulent flux transport. This study aims to discover the characteristics of small-scale isotropic events, the similarity in large-scale transport, and the dissimilarity between large-scale momentum and sensible heat motions. Long-term eddy covariance data observed at a suburban station of Zengcheng, Guangdong, was processed and analyzed to achieve these objectives.
2. Experimental Set-Up and Data Processing
The eddy-covariance data used in this study were collected from a 70-m tower in a suburban environment at Zengcheng National Benchmark Climate Station, Guangzhou, China (23° N, 113° E, altitude 30-m, Figure 1a,b). The station is located on a grass plane on the top of a small hill 4.5 km away from downtown. The instruments were mounted at 50 m, including a sonic anemometer (CSAT3, Campbell Scientific, Inc., Logan, UT, USA, 10 Hz) and an open path gas analyzer (LI-7500, LI-COR, Inc. Lincoln, NE, USA; 10 Hz). Three-dimensional wind velocity components (i.e., , , and ), sonic temperature, water vapor, and carbon dioxide concentration were measured and collected at a frequency of 10 Hz from 1 January 2017 to 31 December 2017.
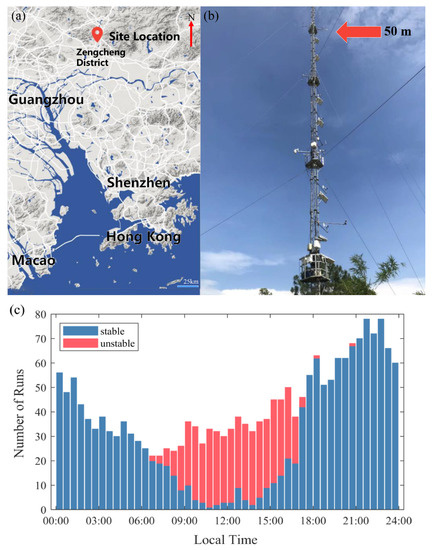
Figure 1.
(a) Topographic map of site spot (red spot) by Google Earth. (b) The flux tower with the measuring system on the 50 m height. (c) Diel plot of the number of unstable data (red) and stable data (blue).
Data processing procedures include removing spikes, linear detrending, double rotation for three-dimensional wind velocities [35], sonic temperature correction [20], and density correction [36]. The average Reynolds means and fluctuations of each 30-min run is calculated for quality flag check [37]. The run contains the unqualified momentum or the scalar fluxes flag (flag does not attain value 0) is removed. Owing to the 3D sonic anemometer facing south, the horizontal wind direction sector of every 30-min data are limited to [38]. The stability of ABL is defined using the Obukhov stability parameter , which is calculated based on the following relationship:
where is the local Obukhov length scale, and the height. The total 1813 30-min segments included 500 segments of unstable conditions (), mostly occurring during the day and 1313 segments of stable conditions (), mostly occurring during the night, as shown in Figure 1c. Because there are a small number of neutral condition runs () data, the neutral data are merged into the calculation of unstable or stable segments. Figure 2 displays wind roses of qualified unstable segments and stable segments.
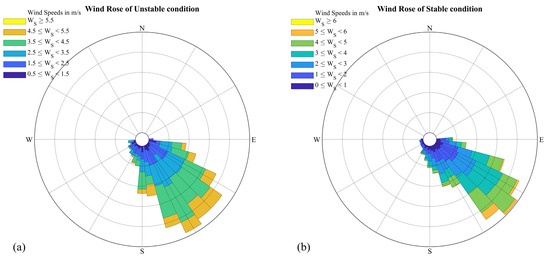
Figure 2.
Wind roses in (a) unstable conditions; (b) stable conditions.
As shown in Figure 2, the south-east directions are the most frequent in the analysis period, which is under the influence of South China Sea summer monsoon (March to October). The southeastern area of the observation site includes a large field of farmland, a river, and a national road. Hence, the characteristics of the dataset in this study are mainly associated with the turbulent flows in the suburbs.
We normalized the fluctuations to equally compare the flux intensity results between different fluxes. The normalized fluctuations are denoted as , where and is the standard deviation.
3. Methods
3.1. Quadrant Analysis
Quadrant analysis separates the instantaneous flux , where stands for momentum flux , sensible heat flux , carbon dioxide flux , and water vapor flux , into four quadrants in the plane according to the sign of the fluctuations as follows [8]:
Quadrant 1: , ejections when , outward interactions when
Quadrant 2: , ejections when , outward interactions when
Quadrant 3: , sweeps when , inward interactions when
Quadrant 4: , sweeps when , inward interactions when
The quadrants contributing to the same sign as the net flux are always labeled ejections and sweeps, while the motions contributing to the counter-gradient flux are labeled as inward and outward interactions. To characterize the flux contribution of each quadrant, the flux fraction () and time fraction () are calculated as:
where represents the quadrant number (), is the turbulent fluctuation component (), and is the average period length. The function of corresponds to the instantaneous flux
is the hole-size parameter of the hyperbolic hole (), which is a threshold of instantaneous flux. Many studies refer to the parameter as hole size [5,8]. However, this study focuses on the normalized value of the hyperbolic hole rather than its parameter . Therefore, the abbreviation is used here to distinguish from or hole size ().
The hyperbolic hole was first proposed by Lu and Willmarth [5], who defined the size of as the root mean square of the fluctuation and times a factor . In our research, the term of the equation changes to mean flux . Both definitions of the are commonly used in the relevant studies. Turbulent motions on the quadrant plane are separated into near isotropic small-scale events (i.e., ) and large-scale events (i.e., ). is the function of large-scale and small-scale motions,
The flux fraction and time fraction of the large-scale motions are calculated as:
where the subscript stands for large-scale. Small-scale flux fraction and time fraction can be computed in the similar way.
The hyperbolic threshold highlights the different scales of motion in the turbulent flow. For larger-scale, the outer area of the hyperbolic hole represents more important contributions to net transport. On the smaller scale, the center area of the hyperbolic hole is less important or relevant to the net flux transportation. Therefore, determining the size is critical for further studies on the large structures contributions and small-scale characteristics. However, the discussion about factor standards varies from different studies, resulting in a great impact on the identification of ejections and sweeps.
In Figure 3a, the original method to determine the size was first introduced by Lu and Willmarth [5], who found that the cumulative flux fraction of each quadrant changes with increasing factor to size. When factor became large, the ejection and sweep motions were the only contributions. Figure 3b,c demonstrates modified approaches to size by adding criteria to factor . In Narasimha et al.’s [7] study, small events in the hyperbolic hole were noise, in which the net contributions of small events in four quadrants balanced each other. The maximum to hold the equation in Figure 3b, , is the threshold size for the current run, where is the flux fraction of the small-scale events. Similarly, Schmutz and Vogt [8] studied the flux fraction within an area between two sizes. At a smaller size, the down-gradient and counter-gradient motions in the nearly isotropic area contributed equal amounts of flux transport. The determination point for factor is where the down-gradient is dominant, while the flux transport of counter-gradient motions has nearly vanished, as shown in Figure 3c . With this standard, the sizes for the momentum, heat, carbon dioxide, and water vapor were found to be larger under stable conditions than those under unstable conditions. In Figure 3d, the flow chart demonstrates our improved method to determine the in this study. Where is a time threshold, is the time fraction of the short-timescale events, and is the duration of event . Instead of using flux fraction features of near-isotropic event as criteria to factor , a time fraction feature of near-isotropic events in 4 quadrants is used as criteria 1 to determine the isotropic threshold , who divides the flux events into large-timescale events and short-timescale events by their event duration. Criteria 2 is a confidence interval for the instantaneous flux intensity range of short-timescale events, and the maximum value of the flux intensity range is the size. The change of perspective from flux fraction to time fraction in the quadrant analysis gives us interesting understanding of the small-scale motions in the turbulent structures and more representative large-scale events that account for most of the flux transport. More detail about this method will be illustrated in the Section 3.2.
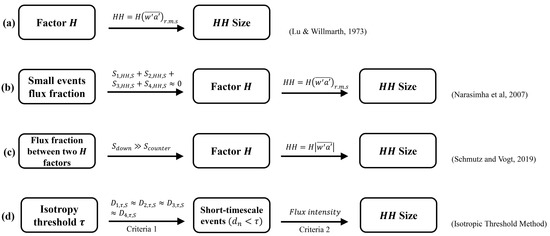
Figure 3.
Illustration of the flow chart of 4 different methods, including (a) Lu and Willmarth [5]; (b) Schmutz and Vogt [8]; (c) Narasimha et al. [7]; (d) isotropic threshold method in this study, approaching to factor and hyperbolic hole in the quadrant plane.
3.2. The Isotropic Threshold Technique
To identify and examine the large-scale turbulence motions responsible for the dominant flux transport of momentum, heat, carbon dioxide, and water vapor under different atmospheric stabilities, we set out to locate the short-timescale isotropic turbulence events with a newly introduced threshold . By characterizing the flux intensity feature of the isotropic event, we can determine the hyperbolic threshold and identify the large-scale structures in the covariance plane.
To illustrate the threshold in this technique, we first define the duration of each event by the time-interval between the zeros in time series, as in Figure 4d.
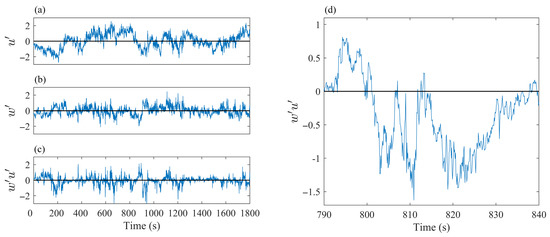
Figure 4.
Demonstration of (a) original series; (b) original series; (c) original series; and (d) the definition of duration of event (sample collected on 1 April (ID = 100), 16:30–17:00 local time).
The flux events in each run are separated by , a time threshold, as follows:
Short-timescale events with durations less than can be seen as independent near-isotropic events in the time series. Note that the short-timescale event is not the same with the small-scale event by their definitions. While, the short-timescale event is extracted by its event period, the small-scale event is identified by its flux intensity ().
The time fraction of short-timescale event is defined as,
where in is the abbreviation of the short-timescale. The time fraction result of each quadrant as a function of threshold is presented in Figure 4.
As shown in Figure 5a, when the value is relatively small (light green area), the time fractions of the small events of each quadrant are similar. Within a certain range of , the time fraction results roughly remain equal as follows:
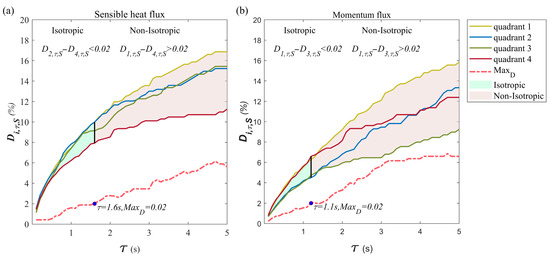
Figure 5.
Demonstration of (a) sensible heat flux and (b) momentum flux short-timescale events time fraction, (solid yellow), (solid blue), (solid green), (solid red), and the maximum difference (dashed pink) as function of isotropic threshold . (a) When , the light green area, the short-timescale events are seen as isotropic. As the reaches to 1.6 s, exceeds 0.02 (grey area), where the short-timescale events are not isotropic. (b) When , the light green area, the short-timescale events are seen as isotropic. As the reaches to 1.1 s, exceeds 0.02 (grey area), where the short-timescale events are not isotropic (sample collected on 1 April (ID = 100), 16:30–17:00 local time).
The statistical results indicate the number of scatter points of a short-timescale event in each quadrant is similar, which is an aspect of isotropy. As the value increases, the difference in the is bigger. In Figure 5a (grey area), the gap between time fraction of quadrant 1 and quadrant 4 is non-negligible. Therefore, the existence of an optimal value for the isotropic threshold to hold isotropic conditions in four quadrants is crucial in this technique. To accommodate deviations among each quadrant, a nature error is introduced here to determine the optimal value of each run.
where and are quadrant number . As shown in Figure 5a, (dashed pink line) grows as the value increases. In the sensitive test of , maintains a relatively small standard deviation for while keeps the total short-timescale flux contribution result near zero. Flux contribution from each quadrant’s short-timescale event cancel each other out, which is also an isotropic feature to confirm the isotropy and similarity of these selected events. As value exceeds the solid black line in Figure 5a, the statistical similarity between the quadrants is considered to be vanished. The optimal s value for the example will include more isotropic events, which will lead to more accurate range of the flux intensity of short-timescale event, and more representative . For momentum flux, in Figure 5b, the and are larger than the and when < 2 s, this corresponded with the report by Schmutz and Vogt [8] with stated that a smaller-scale momentum sweep dominates the vertical exchange under unstable conditions. With the existence of , the minor difference between time fraction results of quadrant 2 and quadrant 4 can be tolerate until exceeds 0.02 and an optimal s is acquired for the momentum flux event.
The isotropic characteristic of the short-timescale event can be found not only in statistics, but also in the spatial distribution in the quadrant plane. The joint probability density function (JPDF), is determined as follows [39]:
The short-timescale event data of momentum flux is plotted in the quadrant plane in Figure 6a. The original data are also shown in Figure 6b as a comparison to the technique.
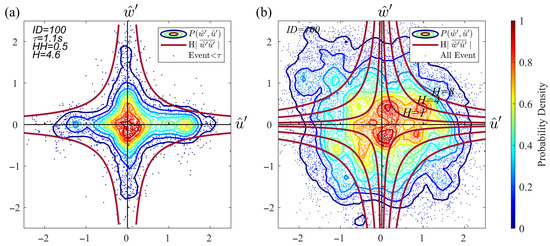
Figure 6.
(a) The scatter point of short-timescale events of momentum flux in the quadrant plane. The scatter points and contours are colored by , where red represent a denser area of scatter and blue represent a sparser area of scatter. The hyperbolic hole (rose red) is drawn to describe the isotropic flux intensity signatures. The isotropic threshold , the , and factor . (b) The scatter point of original events of momentum flux in the quadrant plane. The scatter points and contours are colored by , where red represent a denser area of scatter and blue represent a sparser area of scatter. The hyperbolic holes of three examples of factor (rose red) are drawn to demonstrate the asymmetrical distribution of scatter in the center area of hyperbolic holes (sample collected on 1 April (ID = 100), 16:30–17:00 local time).
As shown in Figure 6a, the scatter distribution of the short-timescale event is significantly different from the original data in Figure 6b. In Figure 6a, the symmetrical shape of the contours in all quadrants match the shape of the hyperbolic hole. Combining the near time fraction results with the symmetrical shape of the contour, the short-timescale event selected by matches the near-isotropic feature in all sense. The hyperbolic hole can be defined by describing the flux intensity of near-isotropic event. In Figure 6a, the probability density declines from center area to outer area as the flux intensity increases. Through a sensitive test between flux intensity range and hyperbolic hole , it is found that the top 5% of flux intensity heavily affects the result since the scatter density at this level of flux intensity is sparse and do not have the representation for the short-timescale event. Therefore, we ‘de-spiked’ the top 5% data and used the maximum flux intensity of the remaining 95% of flux information as the size. Note that the hyperbolic hole is the threshold for identifying large-scale events, while is the means to achieve it. Finding the connection between the near-isotropic event and the hyperbolic hole gives us more confident to extract the large-scale event with , since the small-scale event is in the range of isotropic flux intensity. In Appendix A, a similar symmetrical shape of JPDF contour can be found in momentum, sensible heat, carbon dioxide, and vapor flux in both unstable (Figure A1) and stable (Figure A2) conditions, which indicates the isotropic threshold could work with different fluxes in different atmospheric stabilities.
However, in Figure 6b, the contour shapes of are asymmetric from the middle area to the outer area. The contour shapes in the center area of three hyperbolic holes () do not match the shape of hyperbolic holes. In fact, there is no favorable value to discover the contour symmetry or spatial isotropy for this example by just using the flux intensity information. The limitation of the flux intensity () method is why we introduce the isotropic technique (). Integrating the time information with flux intensity data, we have found a profound connection between hyperbolic hole and isotropic turbulence. Knowing the small-scale motion features makes the large-scale events identified by more significant.
4. Results and Discussion
4.1. The Isotropic Characteristics of Small Events
Large-scale motions have been the focus of various studies. We aim to understand small isotropic events and large coherent structures in the atmospheric boundary layer. In addition, characterizing small events under different stabilities can provide a new perception of turbulence transport. The average JPDF of the momentum and scalars is shown in Figure 7.
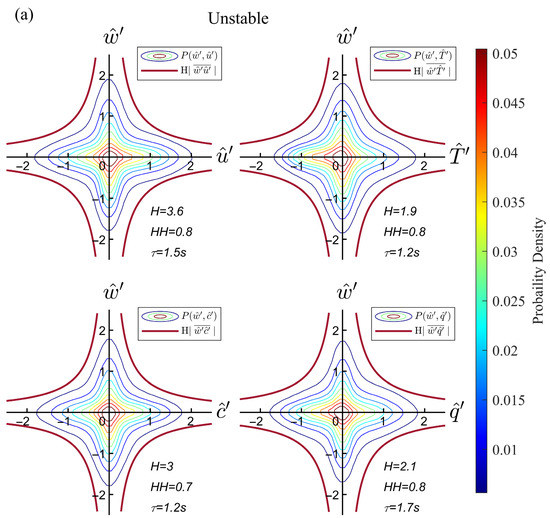
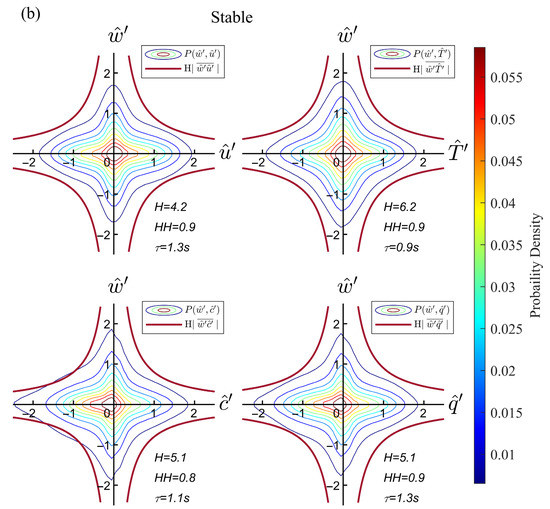
Figure 7.
The average JPDF contours of short-timescale events (multi-colored line) of momentum flux , sensible heat flux , carbon dioxide flux , and vapor flux with the average hyperbolas (rose red line) in the quadrant domain in unstable conditions (a) and stable conditions (b).
The average JPDF contours of the short-timescale events show excellent symmetry and are hyperbolic-like in the quadrant plane in both unstable and stable conditions. The density of the scatter regularly declines from the center outwards, invariant concerning rotations and reflections of the original system of coordinate axes [40]. In the Taylor frozen hypothesis, a certain number of independent locally isotropic events through the 3D anemometer were captured with threshold . The statistical average features of isotropic events are revealed with sufficient dataset length. As for the original data within the same hyperbolic hole, the average JPDF contour shapes are rhombus with four vertices on the coordinate axis, which are not hyperbolic. Therefore, merely discussing the factors and size cannot reveal the nature of the isotropic turbulence. By combining the time and flux information from the original data, we discovered a good resemblance between the contours of momentum, and thresholds, which resulted in different stabilities. The hyperbolic hole value is not sensitive to the stability changes, within a range of 0.7–0.8, while the factor varies from different stabilities. The covariances of momentum, sensible heat, carbon dioxide, and water vapor are different in previous studies [8,12], causing a difference in value. The similarity in values is a kind of isotropic feature shown in another way; that is, the range of the flux intensity of short-timescale events is the same for various stabilities and for all flux cases. The average values of momentum and are similar, while the sensible heat and fluxes’ are the same. The isotropic threshold range from 1.2–1.7 s in unstable conditions, 0.9–1.3 s in stable conditions. The timescales of isotropic events in unstable boundary layers are slightly larger, as Schmutz and Vogt [8] mentioned. However, the differences in stay within 1 s, which is sufficient to indicate that the results are near isotropy among the momentum and scalars with different stabilities. Because the short-timescale events match the isotropic features in many ways, this gives us strong confidence for the large-scale motion analysis in the next section.
4.2. The Dominant Turbulent Structures
This section identifies and analyses large-scale events with flux intensity stronger than the threshold to understand the ejection and sweep motions responsible for the turbulence transport of momentum and scalars. Compared with the count-gradient transport of inward and outward interactions, the down-gradient transport of ejections and sweeps is dominant for net transport. Figure 8 shows the flux fraction and time fraction of selected large-scale ejections and sweeps compared to the original data.
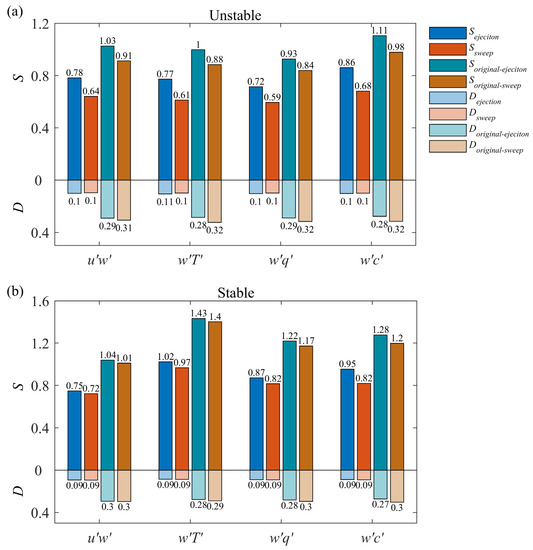
Figure 8.
The average flux fraction of large-scale ejection (blue), large-scale sweep (orange), original ejection (green) and original sweep (brown) with the time fraction of large-scale ejection (light blue), large-scale sweep (light orange), original ejection (light green), and original sweep (light brown) in (a) unstable conditions and (b) stable conditions.
In Figure 8, the original ejections and sweeps play a dominant role in flux transport across a wide range of atmospheric conditions. With a time fraction of 30%, the organized structures contribute significantly larger fluxes than the outward and inward interactions. By introducing a hyperbolic hole, the dominant roles of ejections and sweeps are emphasized. Using 33% of the original time fraction to transport 65–85% of the original flux fraction, the large-scale events represent the higher transport efficiency motions in the quadrant of ejections and sweeps for all variables. Half of the flux contributions of sweeps or ejections come from events when H is in the range of 5–10 [8,17,41]. As shown in Figure 7, our values, ranging from 2 to 6, are smaller than those in previous studies, resulting in a flux contribution larger than 50% of the original data. Using only 10% of the averaging period to contribute more than 50% flux fraction in most scenarios, the transport efficiencies of the organized structures are very high; for scalars, the flux fractions under stable conditions are significantly larger than those under unstable conditions, while the flux fractions for momentum are weaker under stable conditions. The more stable stratification at night with a weaker momentum gradient may cause the difference.
A significant distinction between ejections and sweeps under unstable conditions is that ejections are more important than sweeps in terms of flux contributions (Figure 8a). Under stable conditions, the sweeps become near-equally dominant as the ejections (Figure 8b). The different mixing conditions in the unstable and stable boundary layers are most likely to cause unequal flux contributions and time fractions of the ejections and sweeps. The stronger ejections compared to sweeps under unstable conditions is due to the enhancement of the upward motion caused by the shifting from hairpin vortices to buoyancy-driven thermal plumes [12,15,19,42]. Interestingly, as Schmutz and Vogt [28] mentioned, the small-scale sweep events shown in Figure 5b dominate the vertical exchange, a universal result for momentum in all stability conditions. However, the small-scale sweeps have nearly no influence on the all-scale results, as shown in Figure 8a. As such, the discussion about the interplay between ejections and sweeps should exclude small-scale scenarios. In previous studies, the sweep motions under stable conditions were more important in terms of the momentum and sensible heat flux transport within roughness sublayers, whereas ejections dominate over the canopies [17,18,19,28,43]. Our above-canopy results agree with previous findings. This is because carbon dioxide and water vapor sources are not as homogeneous as the sources of momentum and sensible heat flux. The weight of carbon dioxide and water vapor concentrations in the environment for turbulent transport is nonnegligible. Accordingly, when we compare momentum and scalars such as the ejection-sweep balance, the sensible heat flux in the three scalars is in the primary position to correspond with momentum flux results. The transitions from ejections and sweeps transport from ejection-dominated under unstable conditions to near-equal importance under stable conditions are similar for momentum and scalars. The atmospheric stability affects the ejection-sweep interplay of momentum and scalars similarly, while the dissimilarity of momentum and scalar transport under unstable conditions will be discussed later.
Under unstable conditions, the time fractions of ejections and sweeps differed for all variables, as shown in Figure 8a. With the original data, the time fractions of sweeps are larger than those of ejections, which is a known feature of many studies on different canopies and at different heights [8,12,15,28]. However, the time fractions of large-scale ejections are longer than those of sweeps, which implies that large-scale ejections are more active in the 30-min period. This is also explained by buoyancy-driven thermal plumes under unstable conditions. Under stable conditions, the time fractions of large-scale ejections and sweeps are equally active for momentum and scalar fluxes, at approximately 9%, which makes us wonder: are the large-scale motions transported simultaneously?
4.3. Influence of Atmospheric Stability on the Large-Scale Turbulent Transport
The discussion of transport dissimilarity primarily focuses on the difference between momentum and sensible heat fluxes [12,21]. Another objective of this study is to determinate the difference between the momentum and sensible heat fluxes activities with the change in stability regime. To characterize the effects of different stability conditions on momentum and sensible heat transport, the correlation coefficients between these fluxes as a function of atmospheric stability and the co-ejection/co-sweep time fraction are calculated as follows:
where the and are the standard deviations of and . Co-ejection and co-sweep represent the same large-scale motions that transport both the momentum and sensible heat fluxes. represents the time fraction of the time-series intersections of momentum ejections and sensible heat ejections. In addition, we investigated the proportion of co-ejection/co-sweep accounting for the ejection/sweep time of the flux transport, which refers to , , , and , respectively.
The change in mixing scenarios in the unstable and stable boundary layers affected the momentum-scalar correlations, as shown in Figure 9c,d. Under unstable conditions, the correlations between momentum and sensible heat flux (black line with squares) drop below −0.2 with increase in instability, and there is another drop in these correlations when approaching near-neutral conditions. Under stable conditions, the correlations diminished in near-neutral and very stable conditions. The low correlations in the stable or unstable conditions indicate that either the thermal plume or mechanical wind shear in those mixing conditions separate the joint transport of momentum and sensible heat fluxes. In contrast, high correlations imply that the fluxes are transported by the same motions.
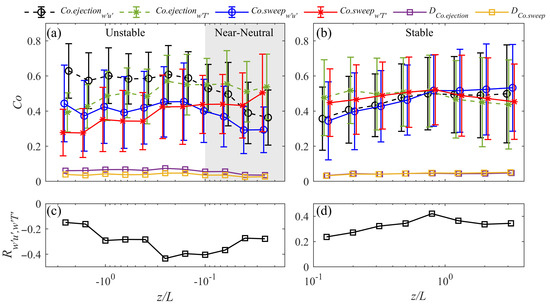
Figure 9.
The momentum and sensible heat fluxes co-ejection time fraction (solid purple line with squares), co-sweep time fraction (solid yellow line with squares), the proportion of co-ejection in the momentum ejection motions (dashed black line with circles), (dashed green line with circles), (solid blue line with stars), and (solid red line with stars) as a function of atmospheric stability in unstable and near-neutral conditions (a) and stable conditions (b). The correlation of momentum and sensible heat (solid black line with squares) in unstable and near-neutral conditions (c) and stable conditions (d). The grey area represents the stability range of near-neutral conditions.
To further investigate the behaviors of same-time transport of momentum-scalar dissimilarity, we introduced the time fraction (purple line with squares) and (yellow line with squares) of the total synchronous flux transport. Under both unstable conditions in Figure 9a, where is approximately 6.6% and is approximately 4.1%, the co-ejection motions are more active than co-sweep motions owing to the upswelling enhancement of thermal plumes. In the last section, we discovered that the time fractions of large-scale ejections are longer than those of the sweeps under unstable conditions. Because of the more frequent appearance of the large upswell motions, in general, the co-ejection results are larger than the co-sweep results by 2%. Under near-neural conditions, where turbulent fluxes are nearly constant with height [28], the co-ejection and co-sweep motions have similar proportions of approximately 2–3%, while the values increase to 4.3% for and 4.4% for under stable conditions. Although the lack of near-neutral data are discussed in Section 2, the additional 40 runs of qualified near-neutral data are added here to complete the trend variation between unstable and stable results (grey area in Figure 9a where ). According to Schmutz and Vogt [8], the equal importance of sweeps and ejections under near-neutral and stable conditions is also shown in the and results, which indicates that the joint flux transport depended on the behaviors of the large-scale motions under the buoyancy-driven or mechanical-driven or weak gradient atmosphere conditions. However, except for near-neutral conditions, the co-transport time does not seem to be sensitive to the increase in stability or instability. Thus, what are the effects of the increase or decrease of correlations between momentum and sensible heat fluxes in those scenarios?
By analyzing the co-transport time proportion in the large-scale transport, the effects of different stability conditions on the momentum and sensible heat flux transport are shown in Figure 9a. Under unstable conditions, the co-ejection time as a proportion of large-scale ejections of momentum (black line with circle) shows that momentum ejections are transported together with the sensible heat flux around 60% of the time, while the ratio drops to 40% when approaching near-neural conditions. The effect of the increasing stability on (blue line with circle) shows similar results, dropping from 42% to 31%. Compared to the proportion of sensible heat motions, (green line with stars) values increase from 39% to 51%, as stability increases, and a similar trend is observed for (red line with stars). The ejections and sweeps of the same variable have similar trends, while the ejections/sweeps of different fluxes exhibit dissimilar trends, which indicates that momentum and scalars perform differently under different atmospheric stability conditions.
Under very unstable conditions, where and are relatively low, the co-transport motions only take a small proportion of time, which indicates that a larger proportion of sensible heat flux activities take place under the effects of thermal plume development under highly unstable conditions. However, thermal plumes have no effect on large-scale momentum motions under highly unstable conditions. The majority of the large-scale momentum activities transport both fluxes simultaneously, which indicates that the development of momentum activities under these conditions is relatively small compared to that at sensible heat. Under buoyancy-generated scenarios, sensible heat flux transport develops more “independently” from the co-transport. As the stability increased, the buoyancy-driven plumes diminished, and co-transport gradually dominated the large-scale sensible heat flux activities. When the correlations of momentum and sensible heat fluxes reach the peak absolute value during the transition to near-neutral conditions, the co-transport proportions of both fluxes are relatively close. The ejections and sweeps of the momentum and sensible heat fluxes are evenly developed. Under near-neutral conditions, where the wind profile is logarithmic, the development of mechanical turbulence enhances the momentum activities considerably, resulting in a relatively low value. The sensible heat flux, by contrast, become more “cooperative” to the co-transport motions. results are around 55%, indicating that the rest of the sensible heat transport activities are suppressed by the dominant shift from thermal plumes to wind shear.
Under stable conditions in Figure 9b, where both mechanical-driven and buoyancy-driven turbulence are active, the process of thermal effects exerting an influence on large-scale motions is shown in Figure 9b. As stability increases, the stratification effects on the mechanical turbulence lead to higher and results, which indicates that the momentum activities are constrained to a greater degree. The sensible heat is relatively steady when (). Thereafter, the proportions drop slightly under more stable conditions. The highest correlation marks the closest co-transport proportions results, where the buoyancy-driven and mechanical-driven effects achieve a balance in terms of their effects on momentum and sensible heat flux transport.
Under unstable and stable conditions, the highest correlation marks a dividing line of the dominant shift between the mechanical-driven and buoyancy-driven conditions. As the shift is completed, the dominant mechanism for the turbulence transport affects either the momentum or scalar flux. In contrast, the other flux remains the same as the stability changes. For example, the thermal plume only affects the development of sensible heat flux ejections and sweeps under very unstable conditions as the stability increases. At the same time, the large-scale motions of momentum remain the same.
5. Conclusions
Based on a quadrant analysis and the definition of a hyperbolic hole, we proposed a new technique to first define the size of the hyperbolic threshold with time information. Using eddy-covariance data collected at 50 m above the grass canopy in a suburban environment in Zengcheng, Guangzhou, China, small-scale and large-scale turbulent transport characteristics and their dependence on atmospheric stability were investigated under unstable and stable conditions. We also studied how the different mechanisms affect the momentum and sensible heat flux transport under different stability conditions.
First, an isotropic threshold was introduced to separate the flux events into large-timescale and short-timescale events based on their durations. Using the criteria that the total durations of short-timescale events in each quadrant are similar, we found the optimal for every half-hour run. After plotting the short-timescale events in the quadrant domain, we found that the spatial distribution and JPDF contour were hyperbolic and symmetric, indicating that the short-timescale events matched the spatial features of isotropy. Then, we ‘de-spiked’ the flux intensity range of short-timescale events in the quadrant plane to properly define the hyperbolic hole size. We connected the hyperbolic hole with features of isotropic turbulence in a long way. The spatial symmetry of the short-timescale events made it worthwhile. Knowing the small-scale motion features made the large-scale events identified by more significant.
Our method revealed a strong connection between the near-isotropy feature of small-scale turbulence and the hyperbolic threshold.
Average JPDF contours were drawn under unstable and stable conditions to characterize the small event behaviors at a longer time scale. The contours for all variables were smoother and hyperbolic-like than those in the example. The scattering density reduced from the center of symmetry, which was invariant to coordinate axis rotations and reflections. The isotropic threshold and for the different fluxes under different atmospheric stabilities were similar, indicating that the normalized small events of different fluxes had similar time scales and flux intensities.
We located the large-scale ejection and sweep under unstable and stable conditions with the hyperbolic threshold. Large-scale motions had higher transport efficiencies than original events, with 33% of the total ejection/sweep time required to transport 65–85% of the total flux. The ejection-sweep balance changed in large-scale motions. Under unstable conditions, the ejection time scale was larger than the sweep, while under stable conditions, the ejection and sweep time scales were equal, unlike the original data. The ejections were powered by buoyancy-driven thermal plumes under unstable conditions, resulting in more activities at the time scale.
Discussions of transport dissimilarity usually focused on the correlation between momentum and sensible heat. The perspective of the time scale was introduced to analyze the co-transport time fraction of each variable’s large-scale motions. With the change in stability regime, the correlation and proportion of co-ejection/co-sweep changed when different mechanisms became active and dominated the turbulence transport. Under unstable conditions, the thermal plumes enhanced the ejection and sweep motions of sensible heat, whereas under near-neutral conditions, the mechanical wind shear developed momentum activities. Under stable conditions, both mechanical-driven and buoyancy-driven effects were observed on the turbulent motions, with a similar time proportion between momentum and sensible heat.
Current results concerning the features of isotropic events and large-scale motions are sparse compared with other types of canopies. The isotropic features in a longer-term time series or urban area dataset would be worth studying in the future. Large-scale ejection/sweep behaviors under different atmospheric stabilities require cross-referencing with wind profile and temperature profile data. In addition, more results from different canopies and heights may explain the motions when the ejection/sweep of two variables are not co-transporting fluxes.
Author Contributions
Conceptualization, Y.W. and B.W.; methodology, Y.W.; formal analysis, Y.W. and C.L.; investigation, D.Z., B.W., R.F., B.Z., J.L., and Y.W.; data curation, B.W. and D.Z.; writing—original draft preparation, Y.W.; writing—review and editing, B.W. and C.L; visualization, Y.W.; supervision, B.W.; project administration, B.W.; funding acquisition, B.W. All authors have read and agreed to the published version of the manuscript.
Funding
This research was funded by the National Natural Science Foundation of China (41775015, U21A6001, and 41630422), Guangdong Major Project of Basic and Applied Basic Research (2020B0301030004), and Guangdong Province Key Laboratory for Climate Change and Natural Disaster Studies (2020B1212060025).
Institutional Review Board Statement
Not applicable.
Informed Consent Statement
Not applicable.
Data Availability Statement
Data set available upon request to the corresponding authors.
Acknowledgments
We thank the many supports received during the field observations.
Conflicts of Interest
The authors declare no conflict of interest.
Appendix A
The JPDF results of momentum, heat, carbon dioxide and water vapor from other runs are shown below as supplements to Figure 6a. The isotropy threshold and the size for four variables are calculated separately. These demonstrations illustrate the symmetry and similarity to hyperbolic hole of JPDF contour in different stability conditions and for different variables.
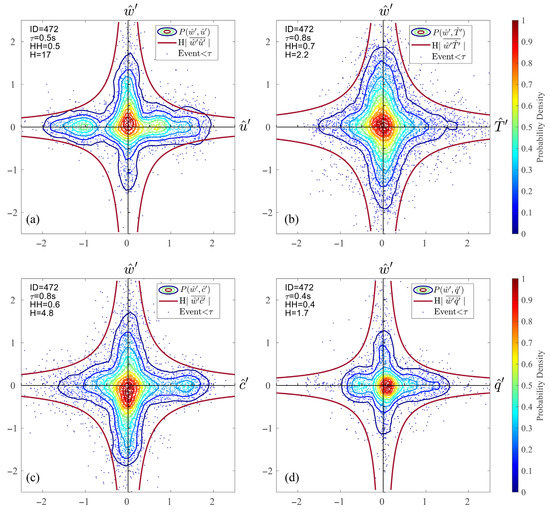
Figure A1.
An example in unstable conditions, the data points of short-timescale events are plotted on the quadrant domain and colored by the density of momentum (a), sensible heat (b), carbon dioxide (c) and water vapor (d) data. The contour is plotted based on JPDF results. A hyperbolic hole (rose red) is drawn to describe the isotropic flux intensity signatures for all variables. The data collected on 15 August 2017 (ID = 472) 10:00–-10:30 local time, where the Obukhov stability was .
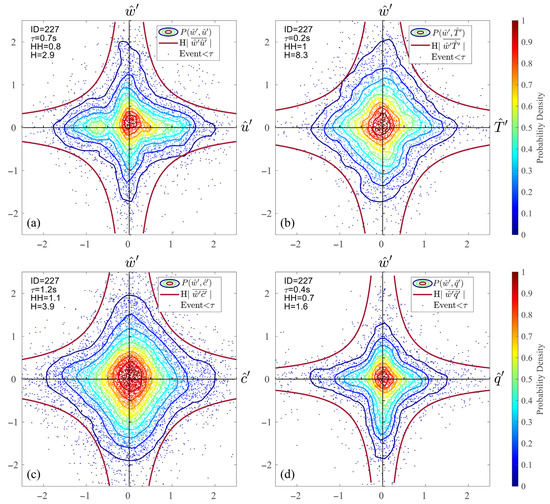
Figure A2.
An example in stable condition, the data points of short-timescale events are plotted on the quadrant domain and colored by the density of momentum (a), sensible heat (b), carbon dioxide (c) and water vapor (d) data. The contour is plotted based on JPDF results. A hyperbolic hole (rose red) is drawn to describe the isotropic flux intensity signatures for all variables. The data collected on 22 March 2017 (ID = 227) 09:30–10:00 local time, where the Obukhov stability was .
References
- Robinson, S.K. Coherent Motions in the Turbulent Boundary Layer. Annu. Rev. Fluid Mech. 1991, 23, 601–639. [Google Scholar] [CrossRef]
- Kline, S.J.; Reynolds, W.C.; Schraub, F.A.; Runstadler, P.W. The structure of turbulent boundary layers. J. Fluid Mech. 1967, 30, 741. [Google Scholar] [CrossRef] [Green Version]
- Corino, E.R.; Brodkey, R.S. A visual investigation of the wall region in turbulent flow. J. Fluid Mech. 1969, 37, 1–30. [Google Scholar] [CrossRef] [Green Version]
- Willmarth, W.W.; Lu, S.S. Structure of the reynolds stress near the wall. J. Fluid Mech. 1972, 55, 65–92. [Google Scholar] [CrossRef]
- Lu, S.S.; Willmarth, W.W. Measurements of the structure of the Reynolds stress in a turbulent boundary layer. J. Fluid Mech. 1973, 60, 481–511. [Google Scholar] [CrossRef]
- Raupach, M.R.; Coppin, P.A.; Legg, B.J. Experiments on scalar dispersion within a model plant canopy part I: The turbulence structure. Bound. Layer Meteorol. 1986, 35, 21–52. [Google Scholar] [CrossRef]
- Narasimha, R.; Kumar, S.R.; Prabhu, A.; Kailas, S.V. Turbulent flux events in a nearly neutral atmospheric boundary layer. Philos. Trans. R. Soc. A Math. Phys. Eng. Sci. 2007, 365, 841–858. [Google Scholar] [CrossRef]
- Schmutz, M.; Vogt, R. Flux Similarity and Turbulent Transport of Momentum, Heat and Carbon Dioxide in the Urban Boundary Layer. Bound. Layer Meteorol. 2019, 172, 45–65. [Google Scholar] [CrossRef]
- Tiederman, W.G. Timescale and structure of ejections and bursts in turbulent channel flows. J. Fluid Mech. 1987, 174, 529–552. [Google Scholar] [CrossRef]
- Steiner, A.L.; Pressley, S.N.; Botros, A.; Jones, E.; Chung, S.H.; Edburg, S.L. Analysis of coherent structures and atmosphere-canopy coupling strength during the CABINEX field campaign. Atmos. Chem. Phys. 2011, 11, 11921–11936. [Google Scholar] [CrossRef] [Green Version]
- Katul, G.; Kuhn, G.; Schieldge, J.; Hsieh, C.I. The ejection-sweep character of scalar fluxes in the unstable surface layer. Bound.-Layer Meteorol. 1997, 83, 1–26. [Google Scholar] [CrossRef]
- Li, D.; Bou-Zeid, E. Coherent structures and the dissimilarity of turbulent transport of momentum and scalars in the unstable Atmospheric surface layer. Bound.-Layer Meteorol. 2011, 140, 243–262. [Google Scholar] [CrossRef]
- Nakagawa, H.; Nezu, I. Prediction of the contributions to the Reynolds stress from bursting events in open-channel flows. J. Fluid Mech. 1977, 80, 99–128. [Google Scholar] [CrossRef]
- Shiau, B.S.; Chen, Y. Bin Observation on wind turbulence characteristics and velocity spectra near the ground at the coastal region. J. Wind Eng. Ind. Aerodyn. 2002, 90, 1671–1681. [Google Scholar] [CrossRef]
- Katul, G.; Hsieh, C.I.; Kuhn, G.; Ellsworth, D.; Nie, D. Turbulent eddy motion at the forest-atmosphere interface. J. Geophys. Res. Atmos. 1997, 102, 13409–13421. [Google Scholar] [CrossRef]
- Sahlée, E.; Rutgersson, A.; Podgrajsek, E.; Bergström, H. Influence from Surrounding Land on the Turbulence Measurements Above a Lake. Bound.-Layer Meteorol. 2014, 150, 235–258. [Google Scholar] [CrossRef]
- Shaw, R.H.; Tavangar, J.; Ward, D.P. Structure of the Reynolds stress in a canopy layer. J. Clim. Appl. Meteorol. 1983, 22, 1922–1931. [Google Scholar] [CrossRef] [Green Version]
- Finnigan, J. Turbulence in plant canopies. Annu. Rev. Fluid Mech. 2000, 32, 253–264. [Google Scholar] [CrossRef]
- Dupont, S.; Patton, E.G. Momentum and scalar transport within a vegetation canopy following atmospheric stability and seasonal canopy changes: The CHATS experiment. Atmos. Chem. Phys. 2012, 12, 5913–5935. [Google Scholar] [CrossRef] [Green Version]
- Lan, C.; Liu, H.; Li, D.; Katul, G.G.; Finn, D. Distinct Turbulence Structures in Stably Stratified Boundary Layers With Weak and Strong Surface Shear. J. Geophys. Res. Atmos. 2018, 123, 7839–7854. [Google Scholar] [CrossRef]
- Francone, C.; Katul, G.G.; Cassardo, C.; Richiardone, R. Turbulent transport efficiency and the ejection-sweep motion for momentum and heat on sloping terrain covered with vineyards. Agric. For. Meteorol. 2012, 162–163, 98–107. [Google Scholar] [CrossRef]
- Weng, S.; Li, Y.; Wei, J.; Du, W.; Gao, X.; Wang, W.; Wang, J. Study on turbulence characteristics and sensitivity of quadrant analysis to threshold level in Lake Taihu. Environ. Sci. Pollut. Res. 2018, 25, 14499–14510. [Google Scholar] [CrossRef] [PubMed]
- Andersson, A.; Sjöblom, A.; Sahlée, E.; Falck, E.; Rutgersson, A. Enhanced Air–Sea Exchange of Heat and Carbon Dioxide Over a High Arctic Fjord During Unstable Very-Close-to-Neutral Conditions. Bound.-Layer Meteorol. 2019, 170, 471–488. [Google Scholar] [CrossRef] [Green Version]
- Feigenwinter, C.; Vogt, R.; Parlow, E. Vertical structure of selected turbulence characteristics above an urban canopy. Theor. Appl. Climatol. 1999, 62, 51–63. [Google Scholar] [CrossRef] [Green Version]
- Feigenwinter, C.; Vogt, R. Detection and analysis of coherent structures in urban turbulence. Theor. Appl. Climatol. 2005, 81, 219–230. [Google Scholar] [CrossRef] [Green Version]
- Moriwaki, R.; Kanda, M. Local and global similarity in turbulent transfer of heat, water vapour, and CO2 in the dynamic convective sublayer over a suburban area. Bound.- Layer Meteorol. 2006, 120, 163–179. [Google Scholar] [CrossRef]
- Wood, C.R.; Lacser, A.; Barlow, J.F.; Padhra, A.; Belcher, S.E.; Nemitz, E.; Helfter, C.; Famulari, D.; Grimmond, C.S.B. Turbulent Flow at 190 m Height Above London During 2006-2008: A Climatology and the Applicability of Similarity Theory. Bound.-Layer Meteorol. 2010, 137, 77–96. [Google Scholar] [CrossRef] [Green Version]
- Wang, L.; Li, D.; Gao, Z.; Sun, T.; Guo, X.; Bou-Zeid, E. Turbulent Transport of Momentum and Scalars Above an Urban Canopy. Bound.-Layer Meteorol. 2014, 150, 485–511. [Google Scholar] [CrossRef]
- Schmutz, M.; Vogt, R.; Feigenwinter, C.; Parlow, E. Ten years of eddy covariance measurements in Basel, Switzerland: Seasonal and interannual variabilities of urban CO2 mole fraction and flux. J. Geophys. Res. 2016, 121, 8649–8667. [Google Scholar] [CrossRef] [Green Version]
- Lee, X.; Yu, Q.; Sun, X.; Liu, J.; Min, Q.; Liu, Y.; Zhang, X. Micrometeorological fluxes under the influence of regional and local advection: A revisit. Agric. For. Meteorol. 2004, 122, 111–124. [Google Scholar] [CrossRef]
- Assouline, S.; Tyler, S.W.; Tanny, J.; Cohen, S.; Bou-Zeid, E.; Parlange, M.B.; Katul, G.G. Evaporation from three water bodies of different sizes and climates: Measurements and scaling analysis. Adv. Water Resour. 2008, 31, 160–172. [Google Scholar] [CrossRef]
- Sempreviva, A.M.; Højstrup, J. Transport of temperature and humidity variance and covariance in the marine surface layer. Bound.-Layer Meteorol. 1998, 87, 233–253. [Google Scholar] [CrossRef]
- De Bruin, H.A.R.; Van Den Hurk, B.J.J.M.; Kroon, L.J.M. On the temperature-humidity correlation and similarity. Bound.-Layer Meteorol. 1999, 93, 453–468. [Google Scholar] [CrossRef]
- Williams, C.A.; Scanlon, T.M.; Albertson, J.D. Influence of surface heterogeneity on scalar dissimilarity in the roughness sublayer. Bound.-Layer Meteorol. 2007, 122, 149–165. [Google Scholar] [CrossRef]
- Kaimal, J.C.; Finnigan, J.J. Atmospheric Boundary Layer Flows: Their Structure and Measurement; Oxford University Press: Oxford, UK, 1994. [Google Scholar]
- Liu, H.; Peters, G.; Foken, T. New equations for sonic temperature variance and buoyancy heat flux with an omnidirectional sonic anemometer. Bound.-Layer Meteorol. 2001, 100, 459–468. [Google Scholar] [CrossRef]
- Foken, T.; Gockede, M.; Mauder, M.; Mahrt, L.; Amiro, B.; Munger, W. Handbook of Micrometeorology: A Guide for Surface Flux Measurement and Analysis: Chapter 9: Post-Field Data Quality Control; Springer Science & Business Media: Berlin/Heidelberg, Germany, 2004. [Google Scholar]
- Chowdhuri, S.; Prabha, T.V. An evaluation of the dissimilarity in heat and momentum transport through quadrant analysis for an unstable atmospheric surface layer flow. Environ. Fluid Mech. 2019, 19, 513–542. [Google Scholar] [CrossRef]
- Ong, L.; Wallace, J.M. Joint probability density analysis of the structure and dynamics of the vorticity field of a turbulent boundary layer. J. Fluid Mech. 1998, 367, 291–328. [Google Scholar] [CrossRef]
- Kolmogorov, A.N. Dissipation of Energy in the Locally Isotropic Turbulence (English translation by V. Levin, 1991). Proc. R. Soc. A Math. Phys. Eng. Sci. 1941, 434, 15–17. [Google Scholar]
- Finnigan, J.J. Turbulence in Waving Wheat: I. Mean Statistics and Honami. Bound.-Layer Meteorol. 1979, 16, 181–211. [Google Scholar] [CrossRef]
- Paw, U.K.T.; Brunet, Y.; Collineau, S.; Shaw, R.H.; Maitani, T.; Qiu, J.; Hipps, L. On coherent structures in turbulence above and within agricultural plant canopies. Agric. For. Meteorol. 1992, 61, 55–68. [Google Scholar] [CrossRef]
- Katul, G.; Poggi, D.; Cava, D.; Finnigan, J. The relative importance of ejections and sweeps to momentum transfer in the atmospheric boundary layer. Bound.-Layer Meteorol. 2006, 120, 367–375. [Google Scholar] [CrossRef]
Publisher’s Note: MDPI stays neutral with regard to jurisdictional claims in published maps and institutional affiliations. |
© 2022 by the authors. Licensee MDPI, Basel, Switzerland. This article is an open access article distributed under the terms and conditions of the Creative Commons Attribution (CC BY) license (https://creativecommons.org/licenses/by/4.0/).