1. Introduction
As an essential part of the land, arid regions have an extremely fragile ecological environment and are very sensitive to global climate change. Climate change in arid regions has become one of the hot issues in climate research against the background of the frequent drought disasters which have occurred in recent years [
1,
2,
3,
4].
In previous studies, precipitation and temperature variations are widely regarded as critical indicators of climate change [
5,
6,
7]. In the past 100 years, the trend for global land precipitation has generally been increasing. However, it shows great regional differences, especially in arid regions [
8,
9]. The Fifth Assessment Report of the Intergovernmental Panel on Climate Change (IPCC) pointed out that from 1880 to 2012, the global average surface temperature increased by about 0.85 °C [
10], and the temperature rise in arid regions was higher [
11]. Therefore, arid regions have a significant impact on global climate change.
As an arid region with the most northerly latitude in the world, the Pan-Central-Asia arid region is different from other arid regions in the world because of its unique topography of plateaus, mountains, hills and deserts [
12]. In addition, this region also has a unique ecological environment and is affected by climate change in a unique way. Studies have shown that this region has been suffering from a severe ecological crisis in recent years, such as the retreat of glacier in the Tianshan Mountains, known as the “water tower of Central Asia” [
13]; the significant shrinkage of the Aral Sea [
14]; the intensification of land desertification [
15]; the frequent occurrence of extreme events [
16], etc. All of these ecological crises have greatly restricted local industrial and agricultural production and had a significant impact on people’s livelihoods. Therefore, it is of great scientific value and practical significance to further explore climate change in the Pan-Central-Asia arid region against the background of global warming.
Previous studies mostly split the Pan-Central-Asia arid region into two parts: the Central Asian arid region [
17] (mainly including five Central Asian countries, such as Kazakhstan), and the China–Mongolia arid region [
18] (mainly including most of Northwest China and Mongolia). As the two arid regions are located at the same latitude in the hinterland of the continent, where the westerly circulation and Qinghai–Tibet Plateau monsoon circulation mainly dominate the weather and climate, the drought causes in both two regions are similar. Thus, there are some limitations when studying the two regions separately [
19]. Moreover, most of previous studies used statistical methods and lacked the latest data. In addition, there are few studies on the relationship between the overall climatic characteristics and large-scale ocean oscillation index in the Pan-Central-Asia arid region.
In this study, the latest monthly gridded dataset of Climate Research Unit Time Series version 4.05 (CRU TS v4.05) was used to study the temporal and spatial variation characteristics of precipitation, temperature and drought index in the Pan-Central-Asia arid region in the last 80 years (1941–2020). In addition, we used EEMD to deconstruct the regional annual average temperature and annual precipitation on multiple time scales; in addition, the relationship between the periodic change in precipitation and temperature, and the large-scale ocean oscillation indexes were further analyzed. Furthermore, based on the multi-model ensemble data from the Coupled Model Intercomparison Project Phase 6 (CIMP6), the variation trends of precipitation and temperature in this region in the future were investigated. The objective of this study was to further understand the characteristics of climate change in the Pan-Central-Asia arid region to provide a scientific basis for a rational response to regional climate change and support a sustainable development strategy.
2. Data and Methods
2.1. Study Region
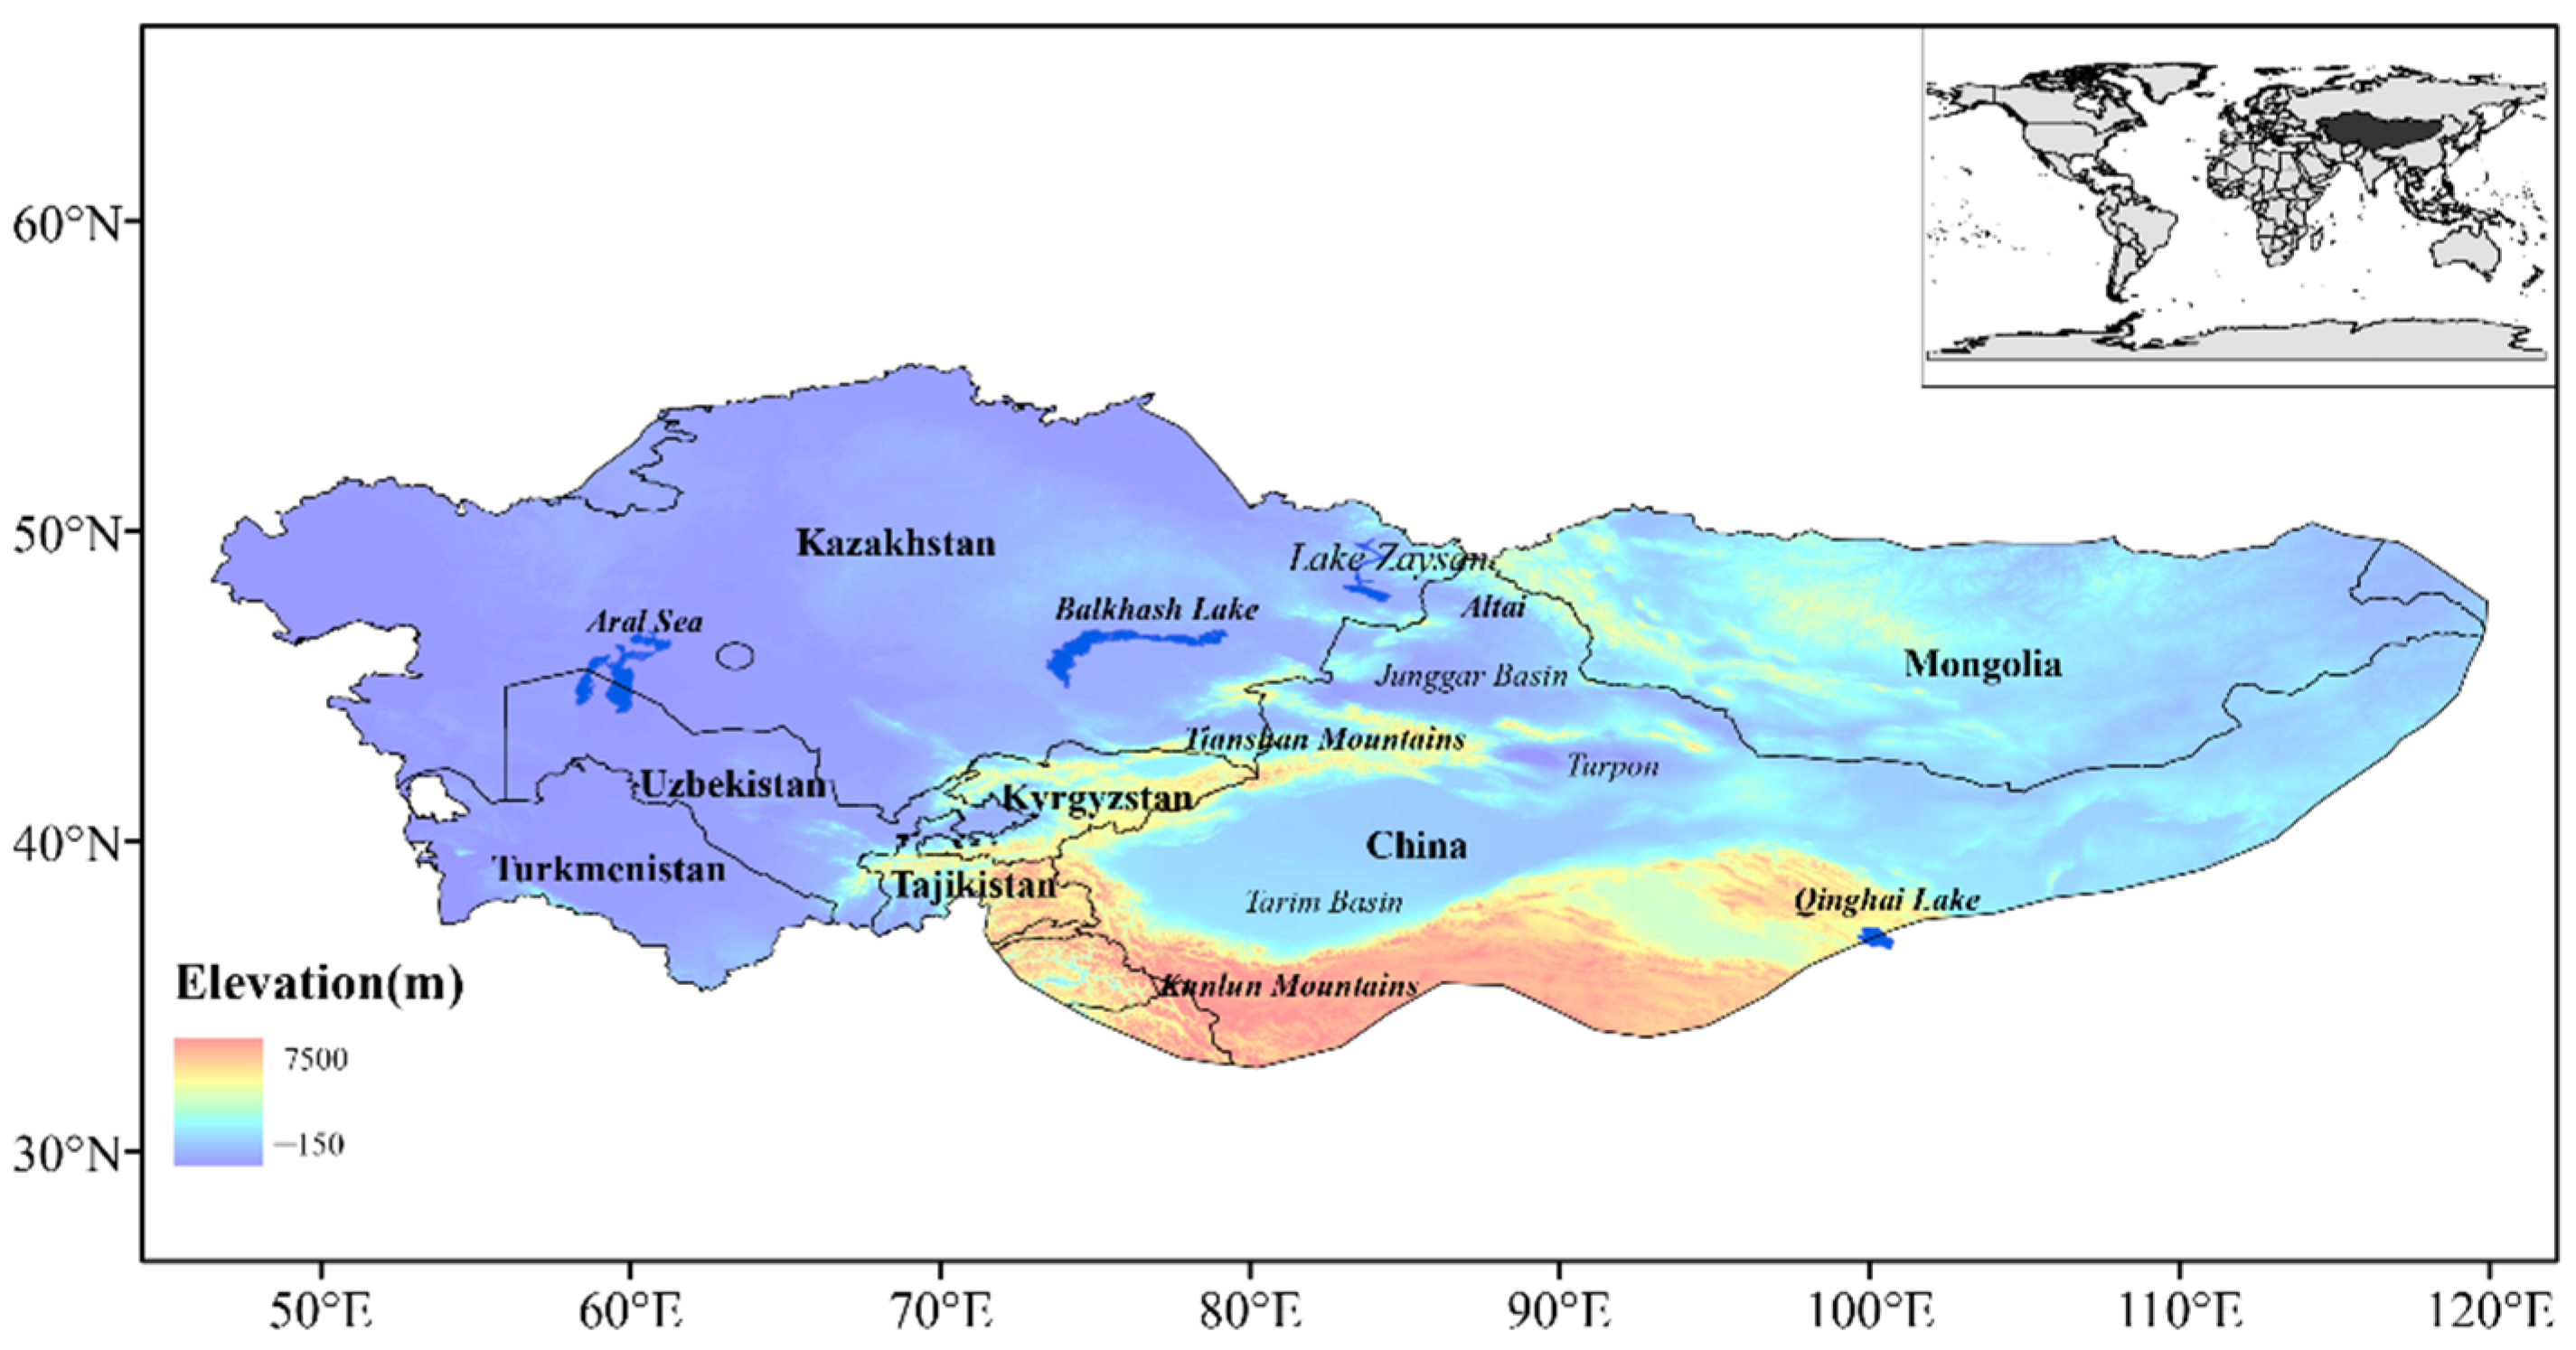
The Pan-Central-Asia arid region consists of five Central Asian countries including Kazakhstan, Turkmenistan, Uzbekistan, Tajikistan and Kyrgyzstan, most of Mongolia, and most of Northwest China (
Figure 1). The average annual precipitation is about 200 mm, and in deserts, is even less than 50 mm [
19]. The climate in this region is generally dry with less rain. The terrain is generally high in the east (including the Mongolian Plateau, Altai Mountains, Tianshan Mountains, Junggar Basin and Pamirs Plateau) and low in the west (Kazakh Hills and Turan Plain).
2.2. Data
The data used in this paper are from the high-resolution monthly gridded datasets developed by the CRU of the University of East Anglia from January 1901 to December 2020, CRU TS v4.05, with a horizontal resolution of 0.5° × 0.5° [
20]. The University of East Anglia conducted a strict time consistency test when reconstructing the CRU dataset. This dataset was obtained through a direct interpolation of the observation results to eliminate the uncertainty caused by the proxy data. It is widely used in climate change research because of its high resolution, long time scale, and high-quality control [
21,
22].
It is well known that some critical ocean oscillation indexes significantly impact the multi-periodic changes of climate at the global and regional scales [
23,
24,
25]. The Southern Oscillation Index (SOI) reflects the activity of the El Niño phenomenon. As the most significant interannual signal in the tropical Pacific, the El Niño phenomenon causes the change in regional and global precipitation distributions through ocean–atmosphere interaction [
26,
27]. Pacific decadal oscillation (PDO) is a long-standing periodic oceanic and atmospheric climate change pattern, which plays an important role in regulating the decadal precipitation change in middle and high latitudes of the Northern Hemisphere [
28,
29]. In addition, the interannual variation in the westerly circulation in middle and high latitudes of the Northern Hemisphere also affects water vapor transport in Central Asia [
30], resulting in precipitation changes in these regions. While the westerly air flow is closely related to North Atlantic oscillation (NAO) and Arctic oscillation (AO) [
31]. Therefore, this paper has discussed the impacts of PDO, NAO, AO and SOI on precipitation and temperature in the Pan-Central-Asia arid region. The details of the four indexes are shown in
Table 1.
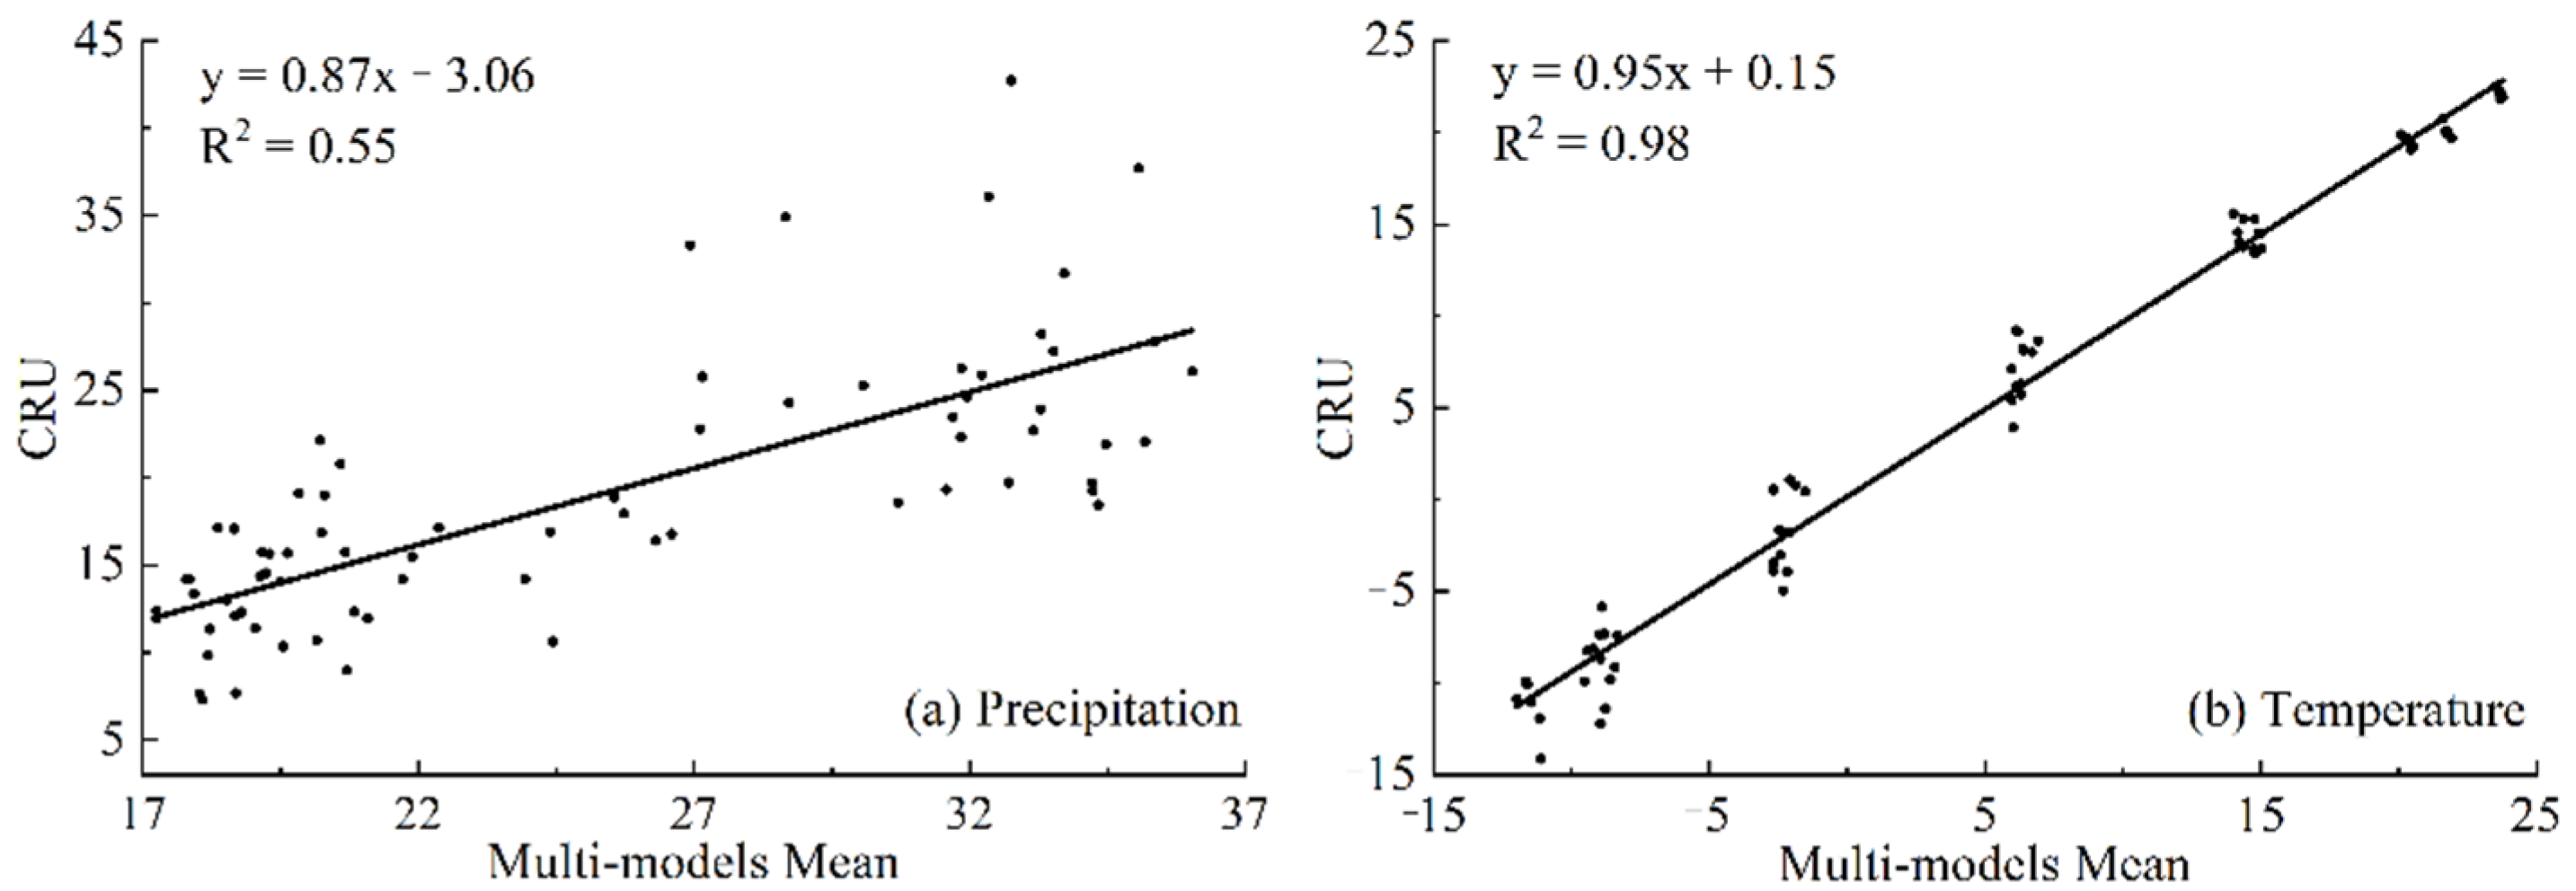
By comparing the multi-model ensemble data during 2015–2100 from 31 models under Shared Socio-Economic Pathway 2 and Representative Concentration Pathway 4.5 (SSP2–RCP4.5) of the CMIP6, it was found that the precipitation (temperature) of the CRU dataset from 2015 to 2020 is lower (higher) than that of multi-model ensemble data. However, they still have good consistency (
Figure 2). The monthly data from 2015 to 2020 were used to establish a linear relationship between the forecast data and the CRU data to maintain the high level of continuity from 2021 to 2100. On this basis, the precipitation and temperature from multi-mode ensembles during 2021–2100 were corrected.
The correction formula for multi-model dataset is as follows:
where P
m and T
m are the corrected precipitation and temperature of the model, respectively; P
mod and T
mod are the multi-model ensemble data before the correction.
2.3. Methods
The Aridity Index (AI) used in this paper refers to the calculation method of Zhang et al. [
32]:
where P is precipitation (unit: mm) and PET is potential evapotranspiration (unit: mm). The larger (smaller) the AI, the drier (wetter).
Ensemble empirical mode decomposition (EEMD) is a noise-assisted data analysis method proposed to solve the shortcomings of empirical mode decomposition (EMD), which extracts specific time scale changes from the original time series [
33]. EEMD is suitable for processing the nonstationary data series and deconstructing the fluctuations and trends of various scales in the signal to obtain the intrinsic mode function (IMF) component. As EEMD is a time–space analysis method, the added white noise is averaged out with sufficient number of trials; this effectively avoids the scale-mixing problem and makes the obtained IMF components physically unique. The only persistent part that survives the averaging process is the component of the signal (original data), which is then treated as the true and more physically meaningful answer [
33]. At present, this method has been widely used in climatology [
34,
35]. Therefore, this study uses the EEMD to deconstruct the annual series of precipitation and temperature, aiming to comprehensively evaluate the decadal oscillation and long-term trend in the study region.
The empirical orthogonal function (EOF) method is valuable for analyzing the temporal and spatial variation characteristics of variables in meteorology. It can deconstruct the time-dependent variable field into a time-independent spatial function and time functions that only depend on time. Then, the main characteristics of the variable field were represented by the spatial function and time function of the first few principal components. In this study, the EOF was used to deconstruct the precipitation and temperature anomaly fields in the study region to understand its spatial variation characteristics systematically. The significance test method proposed by North et al. [
36] was used to verify whether each principal component was meaningful.
The Mann–Kendall method (M–K method for short) was used for the trend test, which was first proposed by Mann [
37,
38] in 1945. It is a non-parametric statistical test method, which does not require the sample data to obey a certain probability distribution, and can also participate in the trend test for a few extreme values. This method is recommended by the World Meteorological Organization and has been widely used to calculate the change trends in a long time series of factors, such as precipitation and temperature [
39,
40]. In addition, the Pearson linear correlation coefficient (PCC) was used to calculate the correlation between the two variables. PCC values were tested using a Student’s
t-test at 95 and 99% confidence levels using N-2 degrees of freedom [
41].
3. Results
3.1. Temporal Variation Characteristics
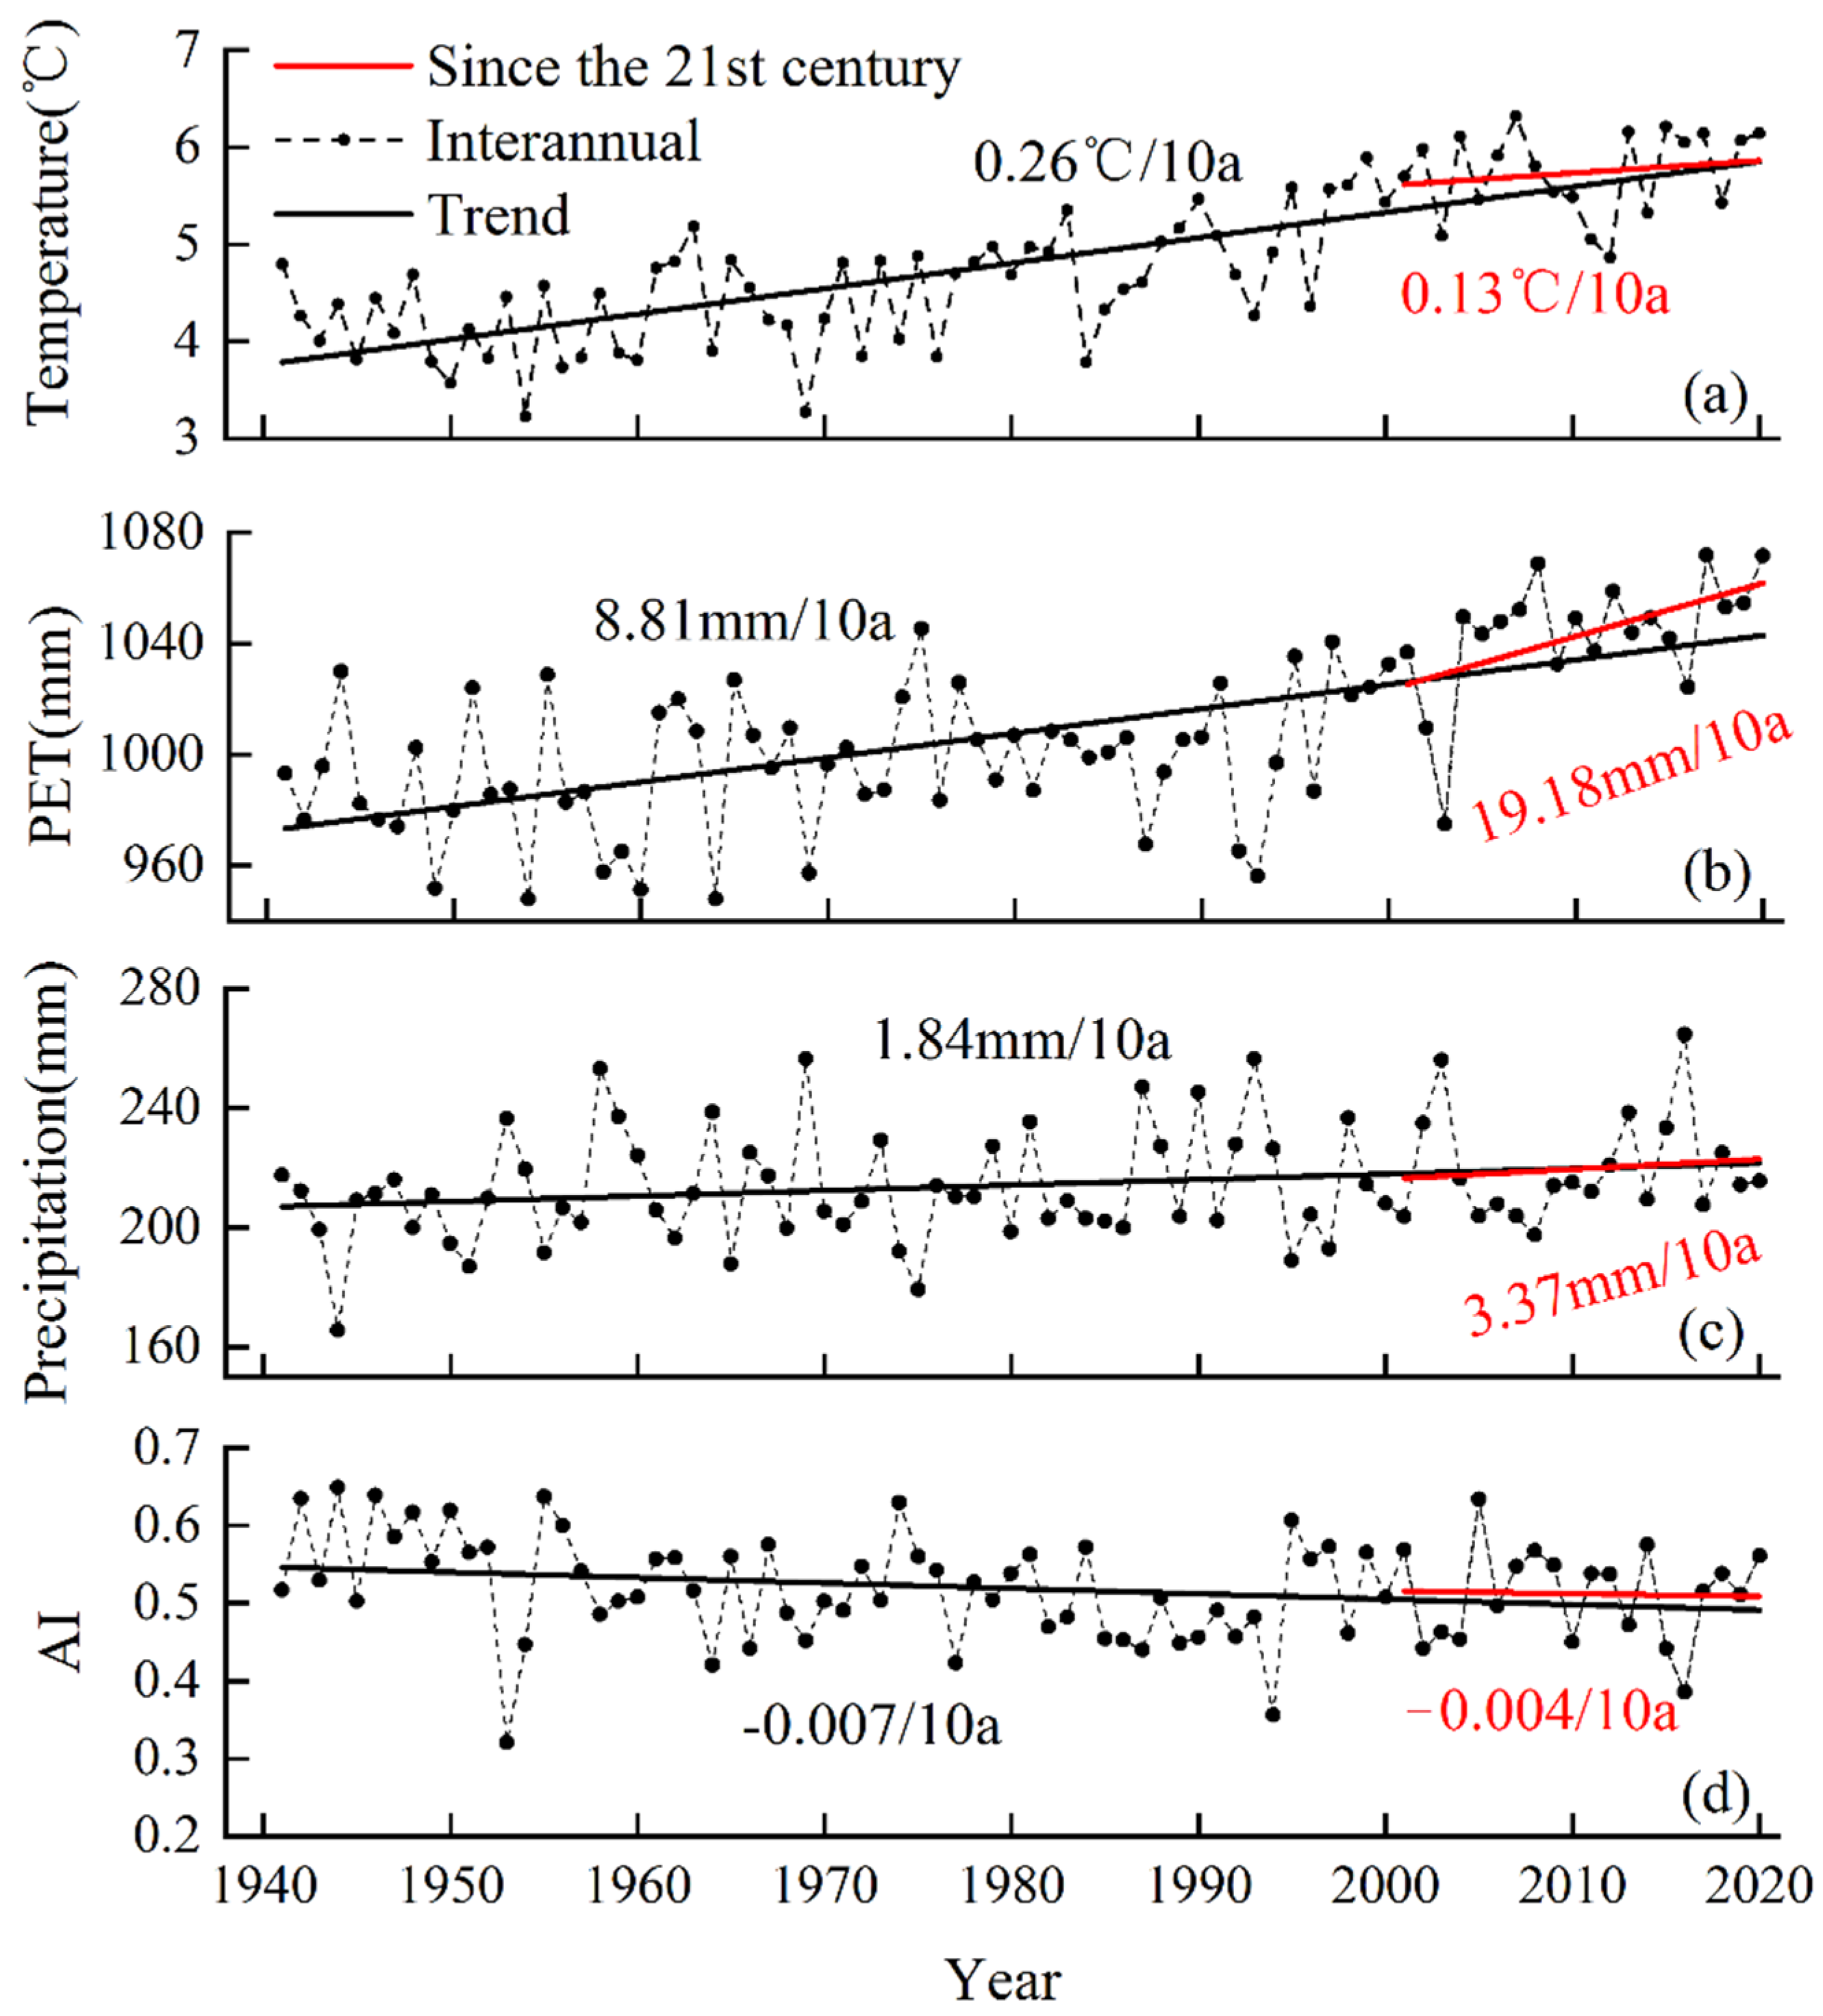
Figure 3 shows the interannual variation trends of temperature, precipitation, potential evapotranspiration (PET) and AI in the Pan-Centra-Asia arid region from 1941 to 2020. Over the last 80 years, the warming rate in the Pan-Central-Asia arid region is 0.26 °C/10a (
Figure 3a), which is higher than the global average of 0.18 °C/10a in the same period. This further shows that the arid regions play an important role in global warming. Huang et al. [
11] pointed out that the arid regions contribute more than 40% to global warming. Since 2000, the warming rate has decreased to 0.13 °C/10a, which is much lower than that from 1941 to 2020. This warming slowdown phenomenon corresponds to the stagnation of global warming. Nevertheless, the growth rate of PET in this period (19.18 mm/10a) is much higher than the average growth rate in the last 80 years (
Figure 3b).
Figure 3d shows the variation in AI. In the last 80 years, this region has generally shown a wetting trend (−0.007/10a) while, since the turn of the 21st century, although the rate of precipitation increase is higher than in the last-80-years average (
Figure 3c), the variation rate of AI has decreased to −0.004/10a. This indicates that the regional wetting trend is slowing down, mainly due to the leap growth of PET caused by global warming.
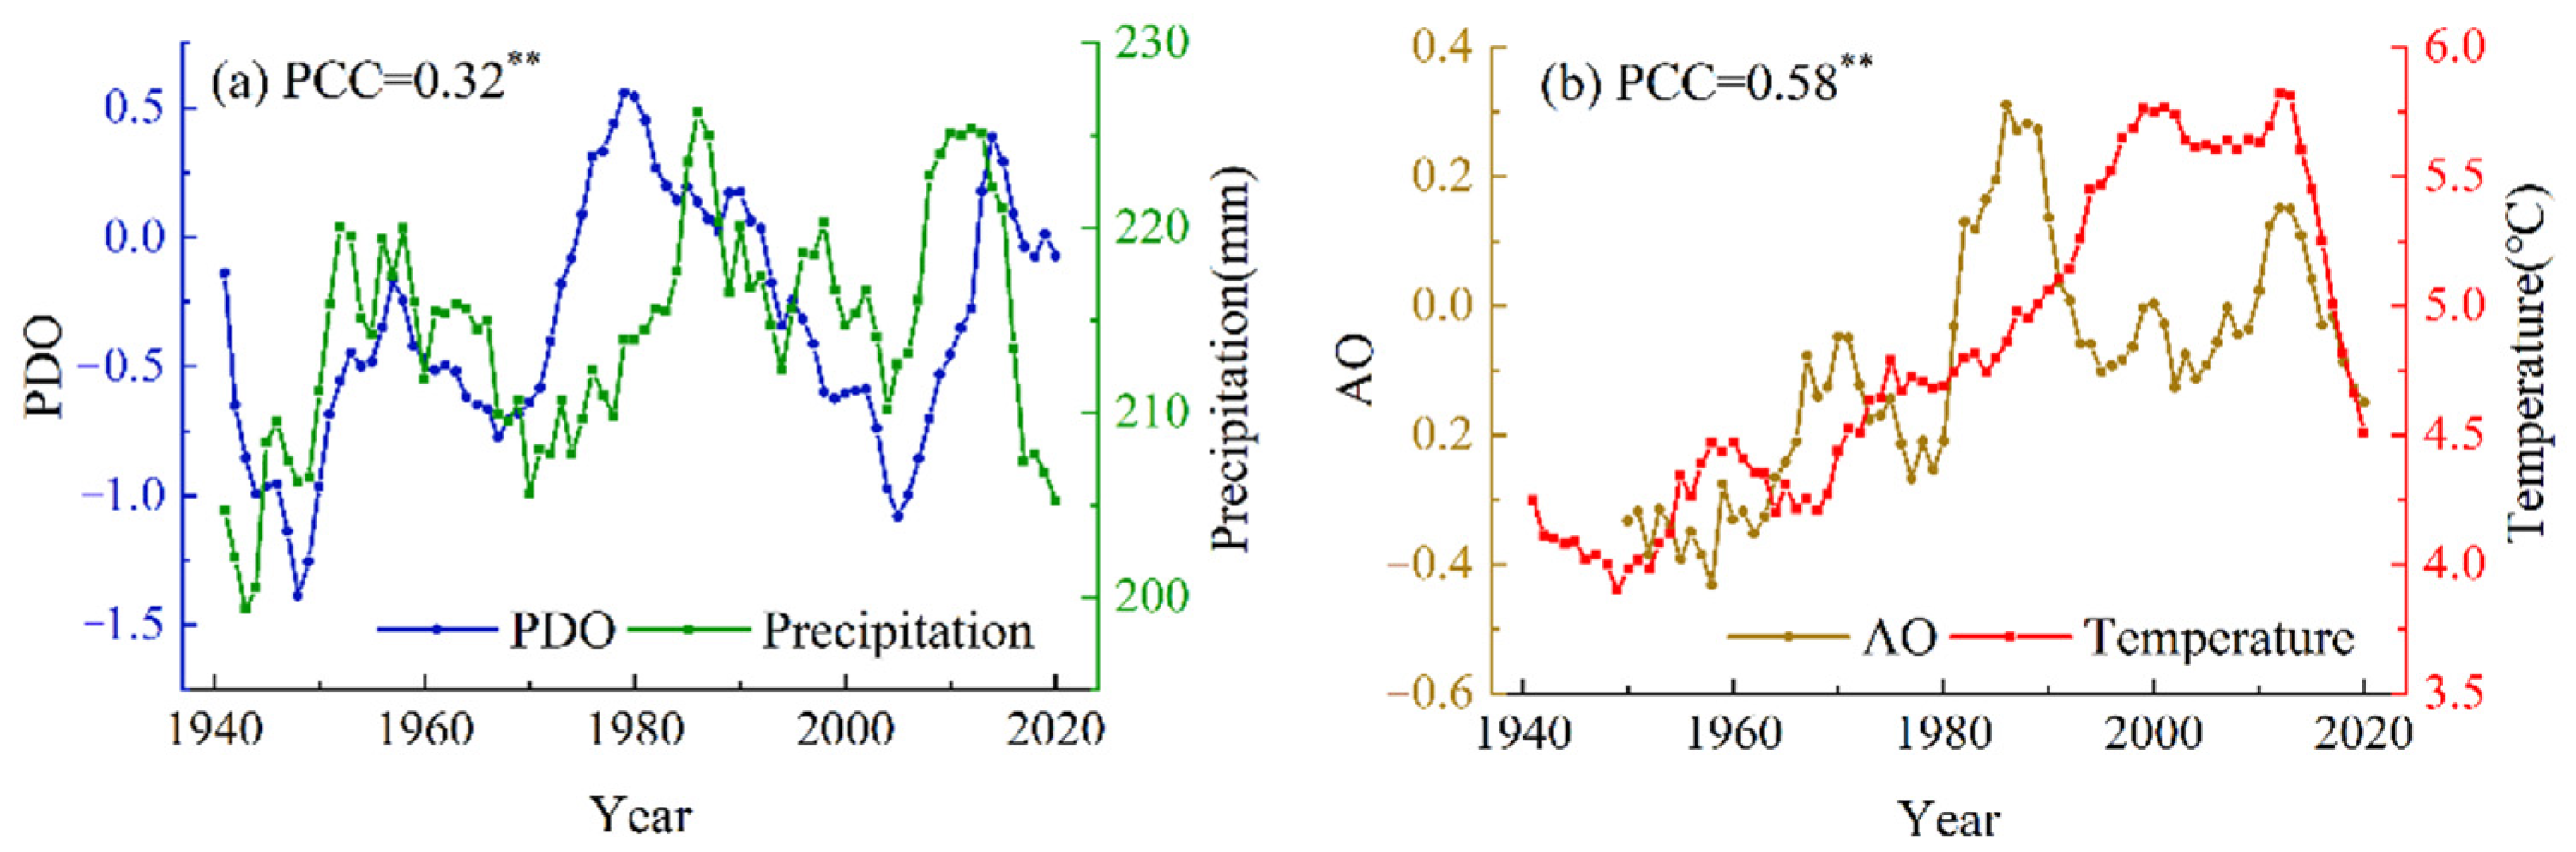
Table 2 shows PCC between precipitation in the Pan-Central-Asia arid region and four ocean oscillation indexes. PDO and SOI had the most significant impacts on precipitation on interannual time scales. PDO positively correlated with precipitation, while SOI showed a negative impact. The correlation coefficient between precipitation and PDO reached 0.46
** from 2001 to 2020. This shows that PDO has played a leading role in the precipitation of the Pan-Central-Asia arid region since the turn of the 21st century. While for indexes of NAO and AO, which reflect the strength of the westerlies in middle latitude of the Northern Hemisphere, their relationships with regional precipitation were not significant in both interannual and decadal time scales.
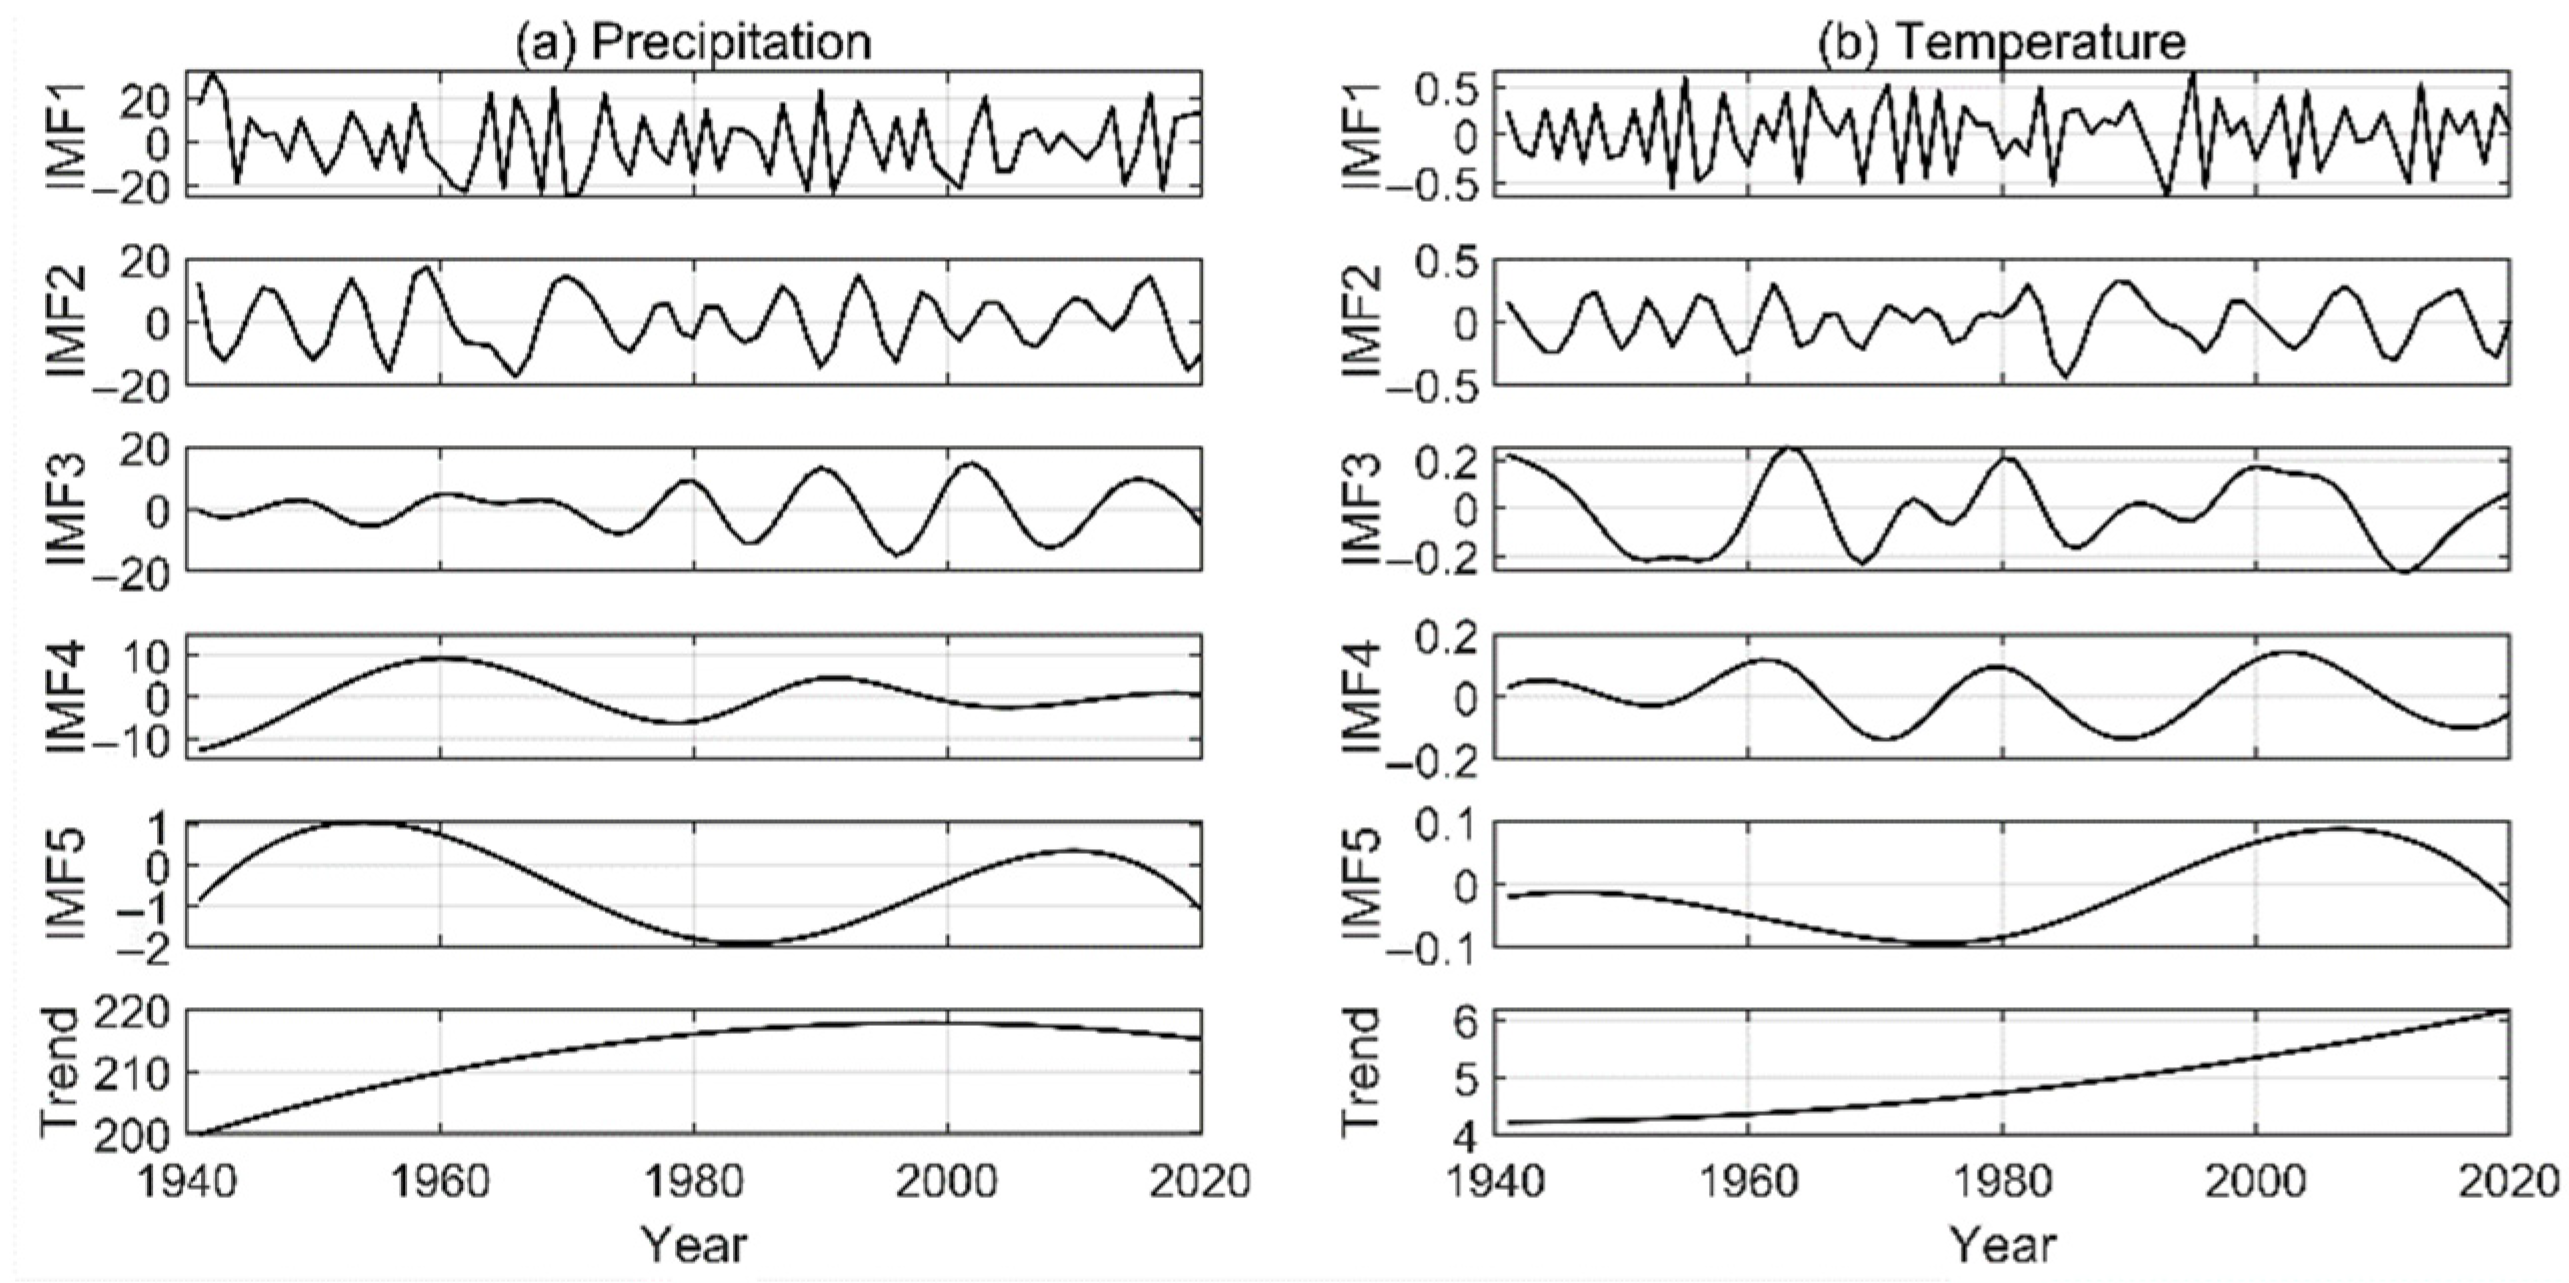
Based on the study of the temporal variation characteristics of temperature and precipitation in the Pan-Central-Asia arid region in the last 80 years, the EEMD method was further used to deconstruct the regional annual average temperature and annual precipitation on multiple time scales. The signal-to-noise ratio between the disturbing white noise and the original signal is set to 0.2, and the average dataset number is 300. Finally, the intrinsic mode function (IMF) components with five different time scales and fluctuation amplitudes and the trend term components (Trend) reflecting the overall variation trend of the signal are obtained (
Figure 4). The IMF components reflect the local features of the original sequence, which changes from high frequency to low frequency. The vertical axis has no practical physical significance, and the trend term can be interpreted as the overall variation trend.
The interannual time scale dominates the precipitation change, with a total variance contribution of 75.36%, including quasi-three-year cycle (IMF1) and quasi-six-year cycle (IMF2). The variance contribution rates are 56.47% and 18.89%, respectively. While there is a quasi-12-year cycle (IMF3) on decadal time scale, with a variance contribution rate of 11.72%. However, the multi-decadal time scale and overall trend are not obvious, and the variance contribution rates are only 6.54% and 6.39%, respectively (
Table 3). Different from precipitation, the long-term variation dominates the temperature change, which reflects the sustained global warming caused by a large number of greenhouse gas emissions for a long time, with the variance contribution rate reaching 66.85%. In addition, the interannual variation in the quasi-three-year cycle is also notable (IMF1), with a contribution rate of 21.83%, while the total contribution of multi-decadal variation is only 2.01% (
Table 3).
The decomposition results after EEMD reveal that the precipitation increased steadily before 2000, closely related to the small amplitude of IMF3 (quasi-13-year) before the 1980s. Meanwhile, the amplitude of IMF4 (32 years) between the 1980s and 2000 was also relatively stable. However, the precipitation has increased rapidly since 2000, related to the peaks of IMF5 and Res. Since the turn of the 21st century, the multi-decadal time scale (IMF4) of the quasi-23-year cycle of temperature is in the decline stage, and the IMF3 of the quasi-13-year cycle is in the trough. These two trends offset the long-term trend of continuous temperature growth, resulting in a slowing down of temperature increase in the study region from the continuous strong warming since the 1970s. Because of the temperature response to precipitation, the contribution of interannual time scale in temperature variation is prominent, but the multi-decadal time scale characteristics of both two factors are not significant.
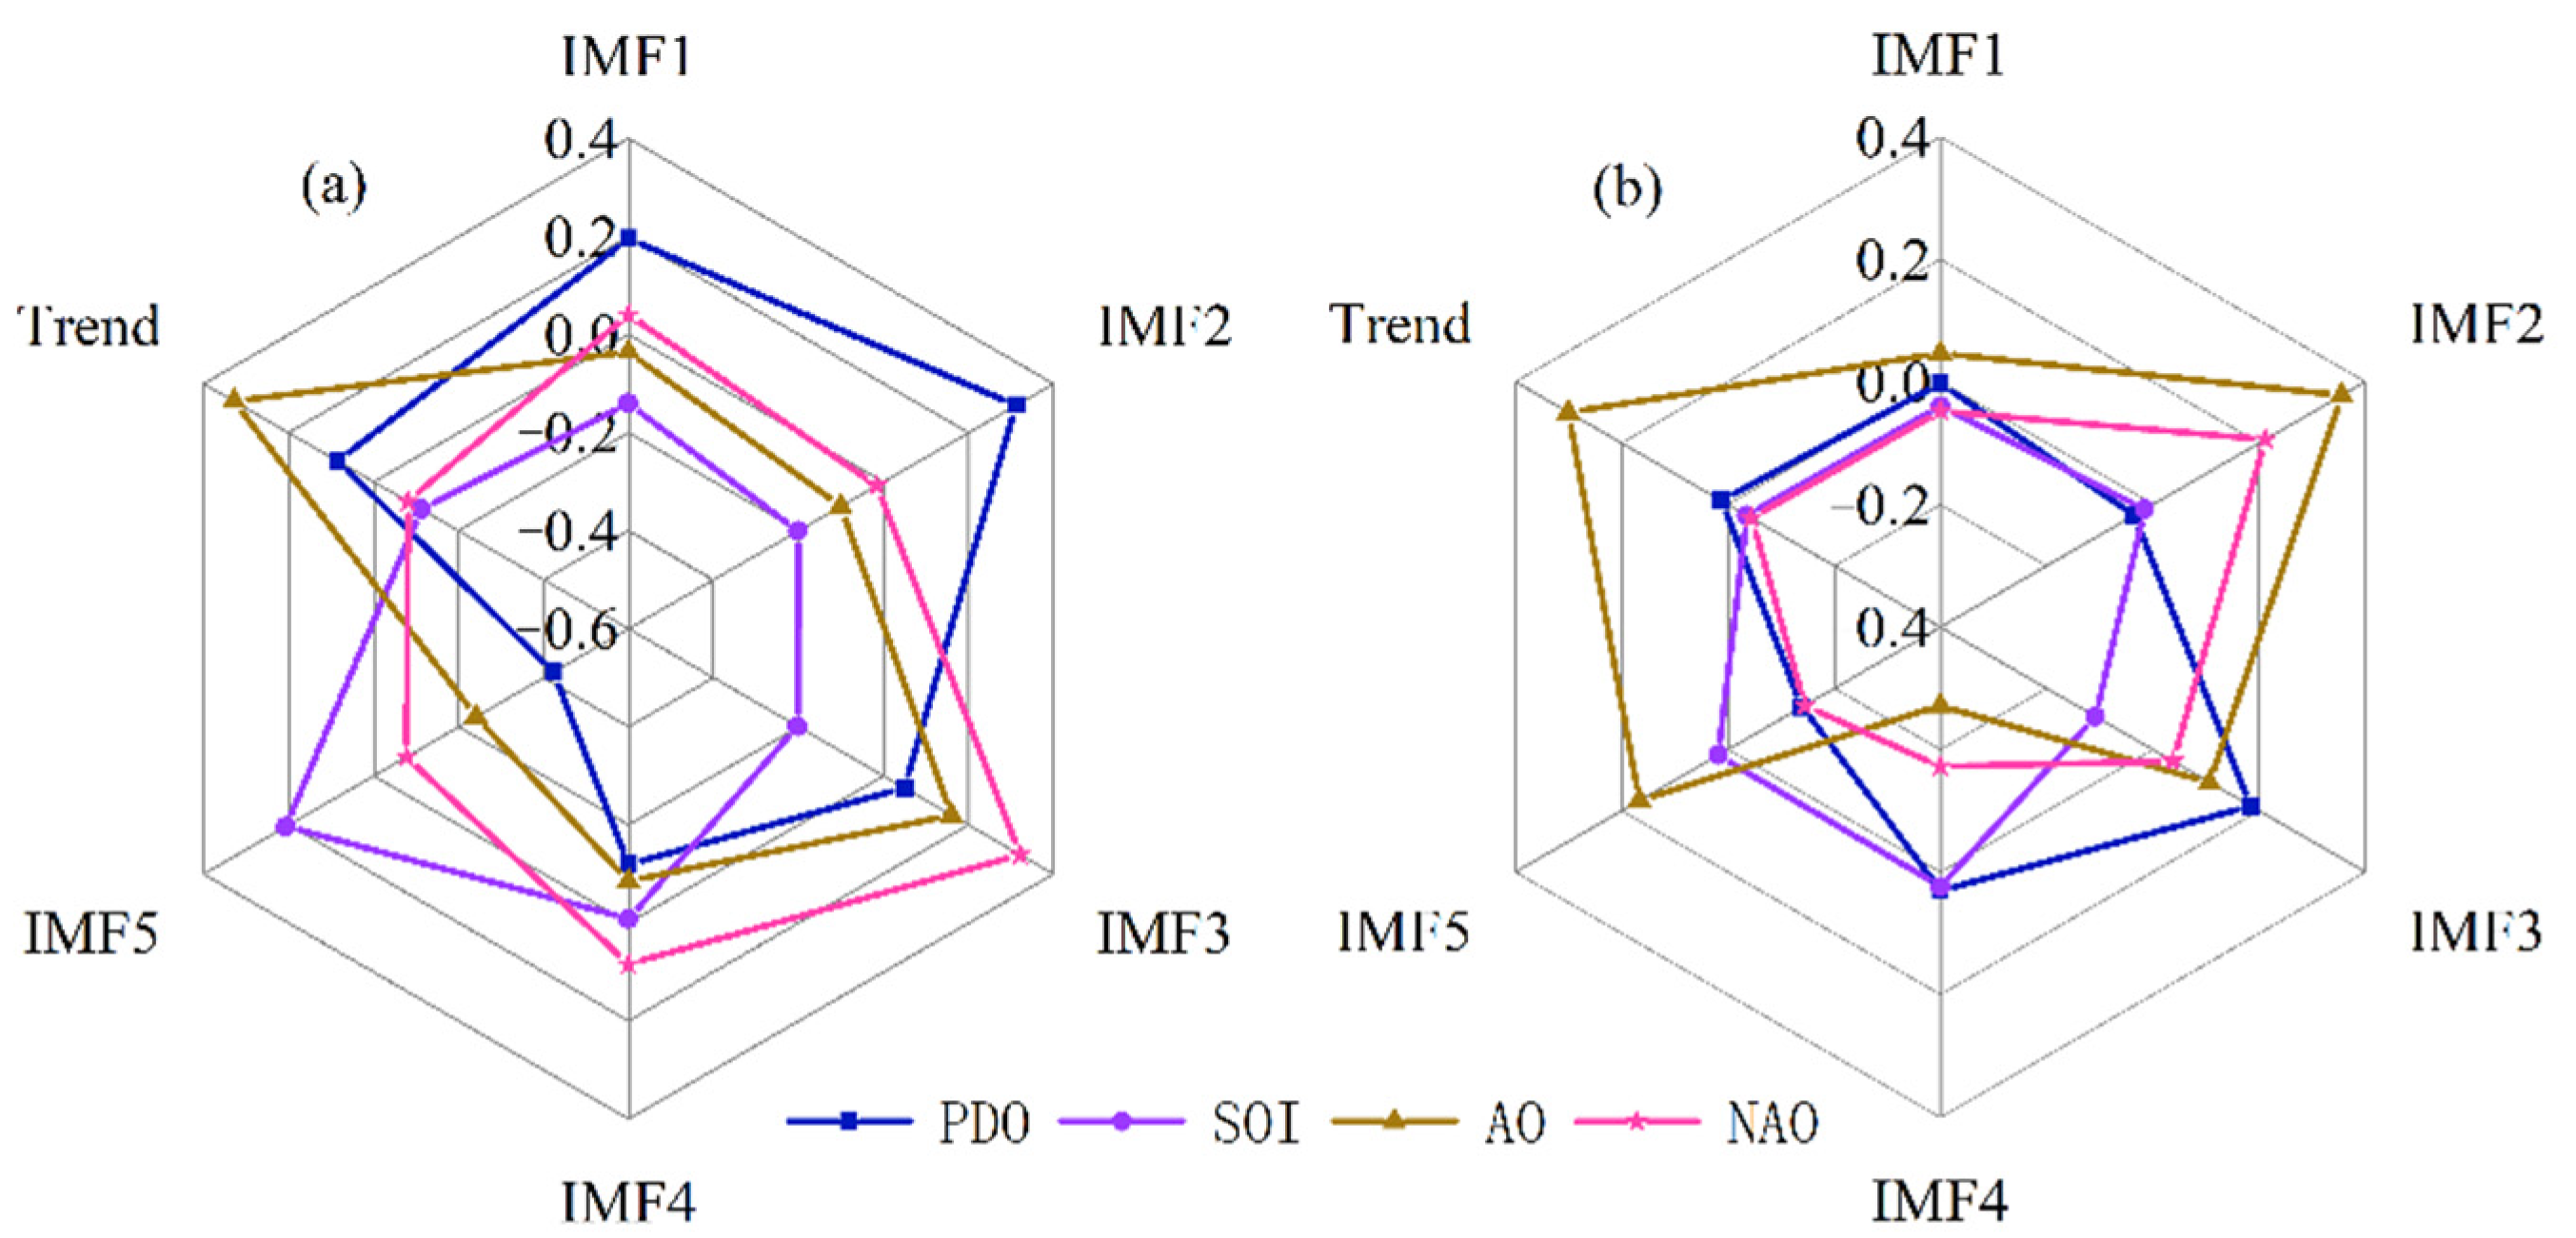
Figure 5 shows the PCC of the four ocean oscillation indexes with each components of precipitation and temperature after EEMD. For precipitation, the phase change in PDO is closely related to its interannual cycle of quasi-three-year (PCC = 0.20 *), quasi-six-year (PCC = 0.31 **) and the multi-decade cycle of 40 years (PCC = −0.42 **). NAO mainly affects the quasi-12-year cycle (PCC = 0.32 **), while AO is significantly related to the long-term trend of precipitation (PCC = −0.32 **). However, the contribution of the long-term trend to the original precipitation series is not high (
Table 3). Hence, AO has little influence on the precipitation in the Pan-Central-Asia arid region. Combined with the variance contribution of each IMF componnet of precipitation, the correlation of PDO with the original series is undoubtedly the best, which is consistent with the previous conclusion. AO is most closely related to the long-term trend that dominates the main variation characteristics of temperature (PCC = 0.32 **), followed by the quasi-six-year cycle (PCC = 0.36 **). On the quasi-three-year scale with the second largest variance contribution, there are no significant correlation relationships between the temperature in the Pan-Central-Asia arid region and the four indexes used in this study.
Combined with the results in
Table 3 and
Figure 5, future research on, and predictions of, precipitation in the Pan-Central-Asia arid region should focus on the variation in PDO, followed by SOI. For the research and prediction of temperature, the effect of AO variation should be emphasized (
Figure 6).
3.2. Spatial Variation Characteristics
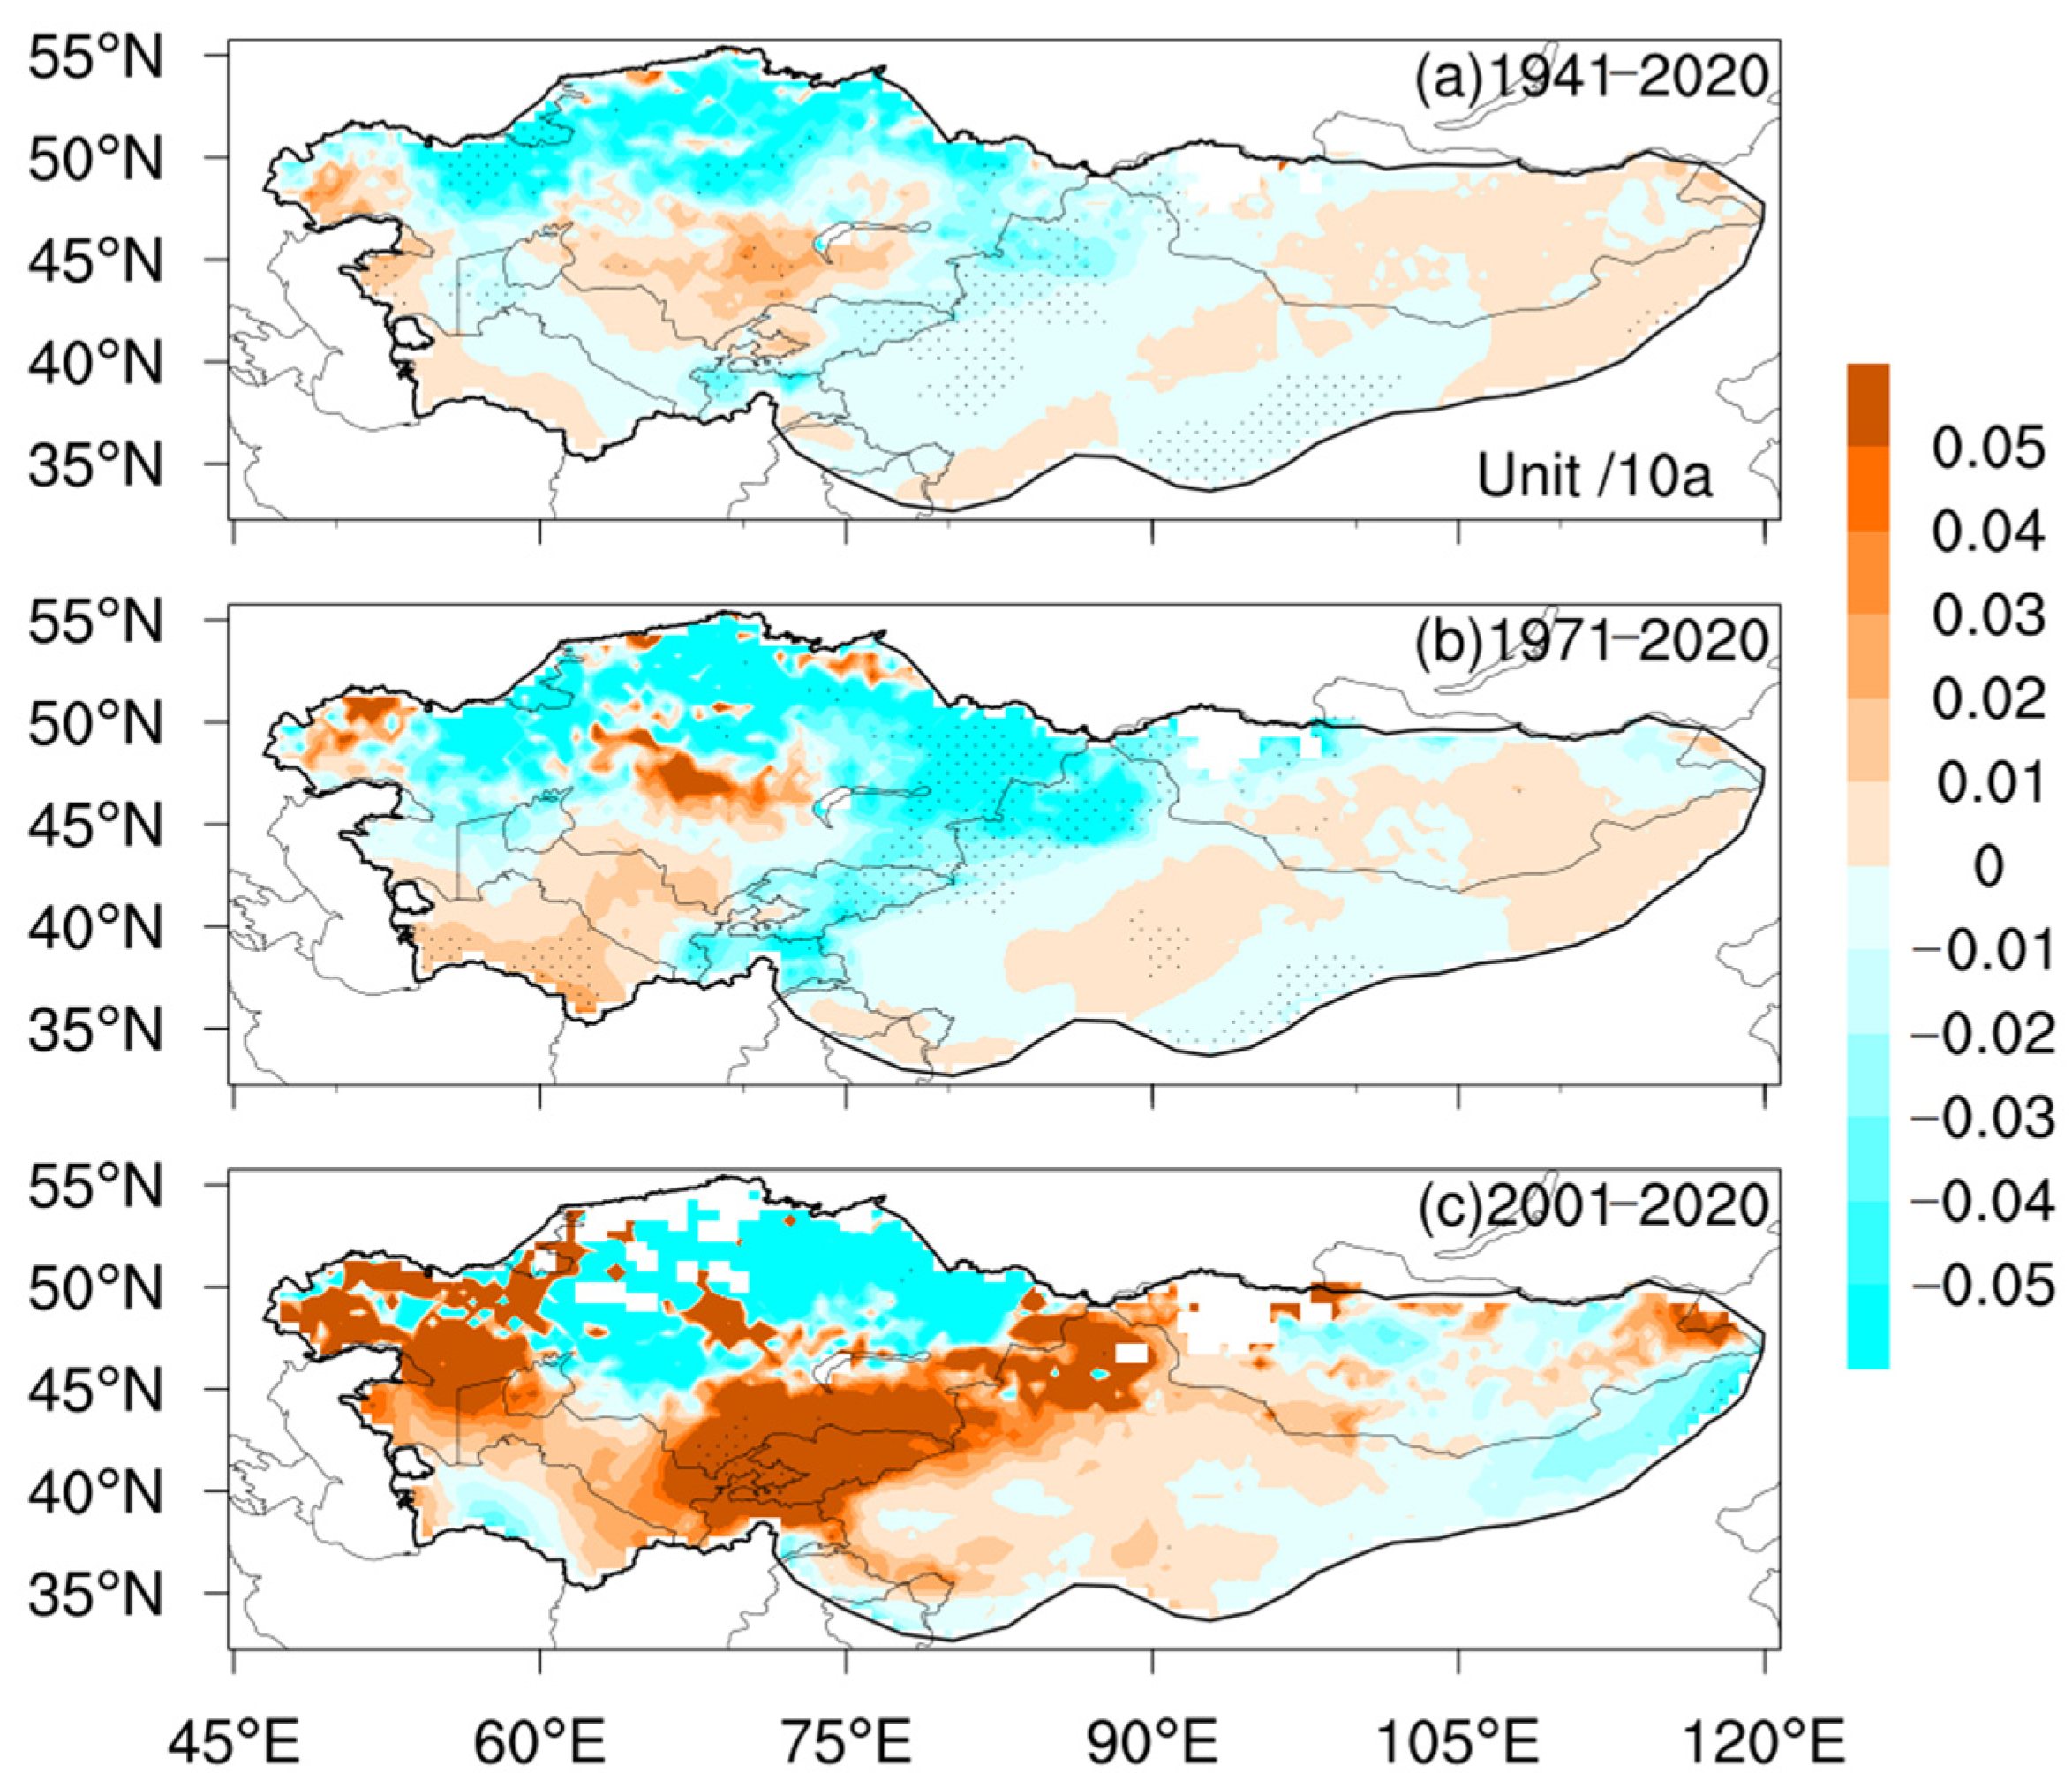
Against the background of global warming, regional climate change has specific spatial differences, and so does climate change in the Pan-Central-Asia arid region. The variation rates of precipitation, temperature and AI in 1941–2020, 1971–2020 and 2001–2020 were analyzed to explore their spatial characteristics further.
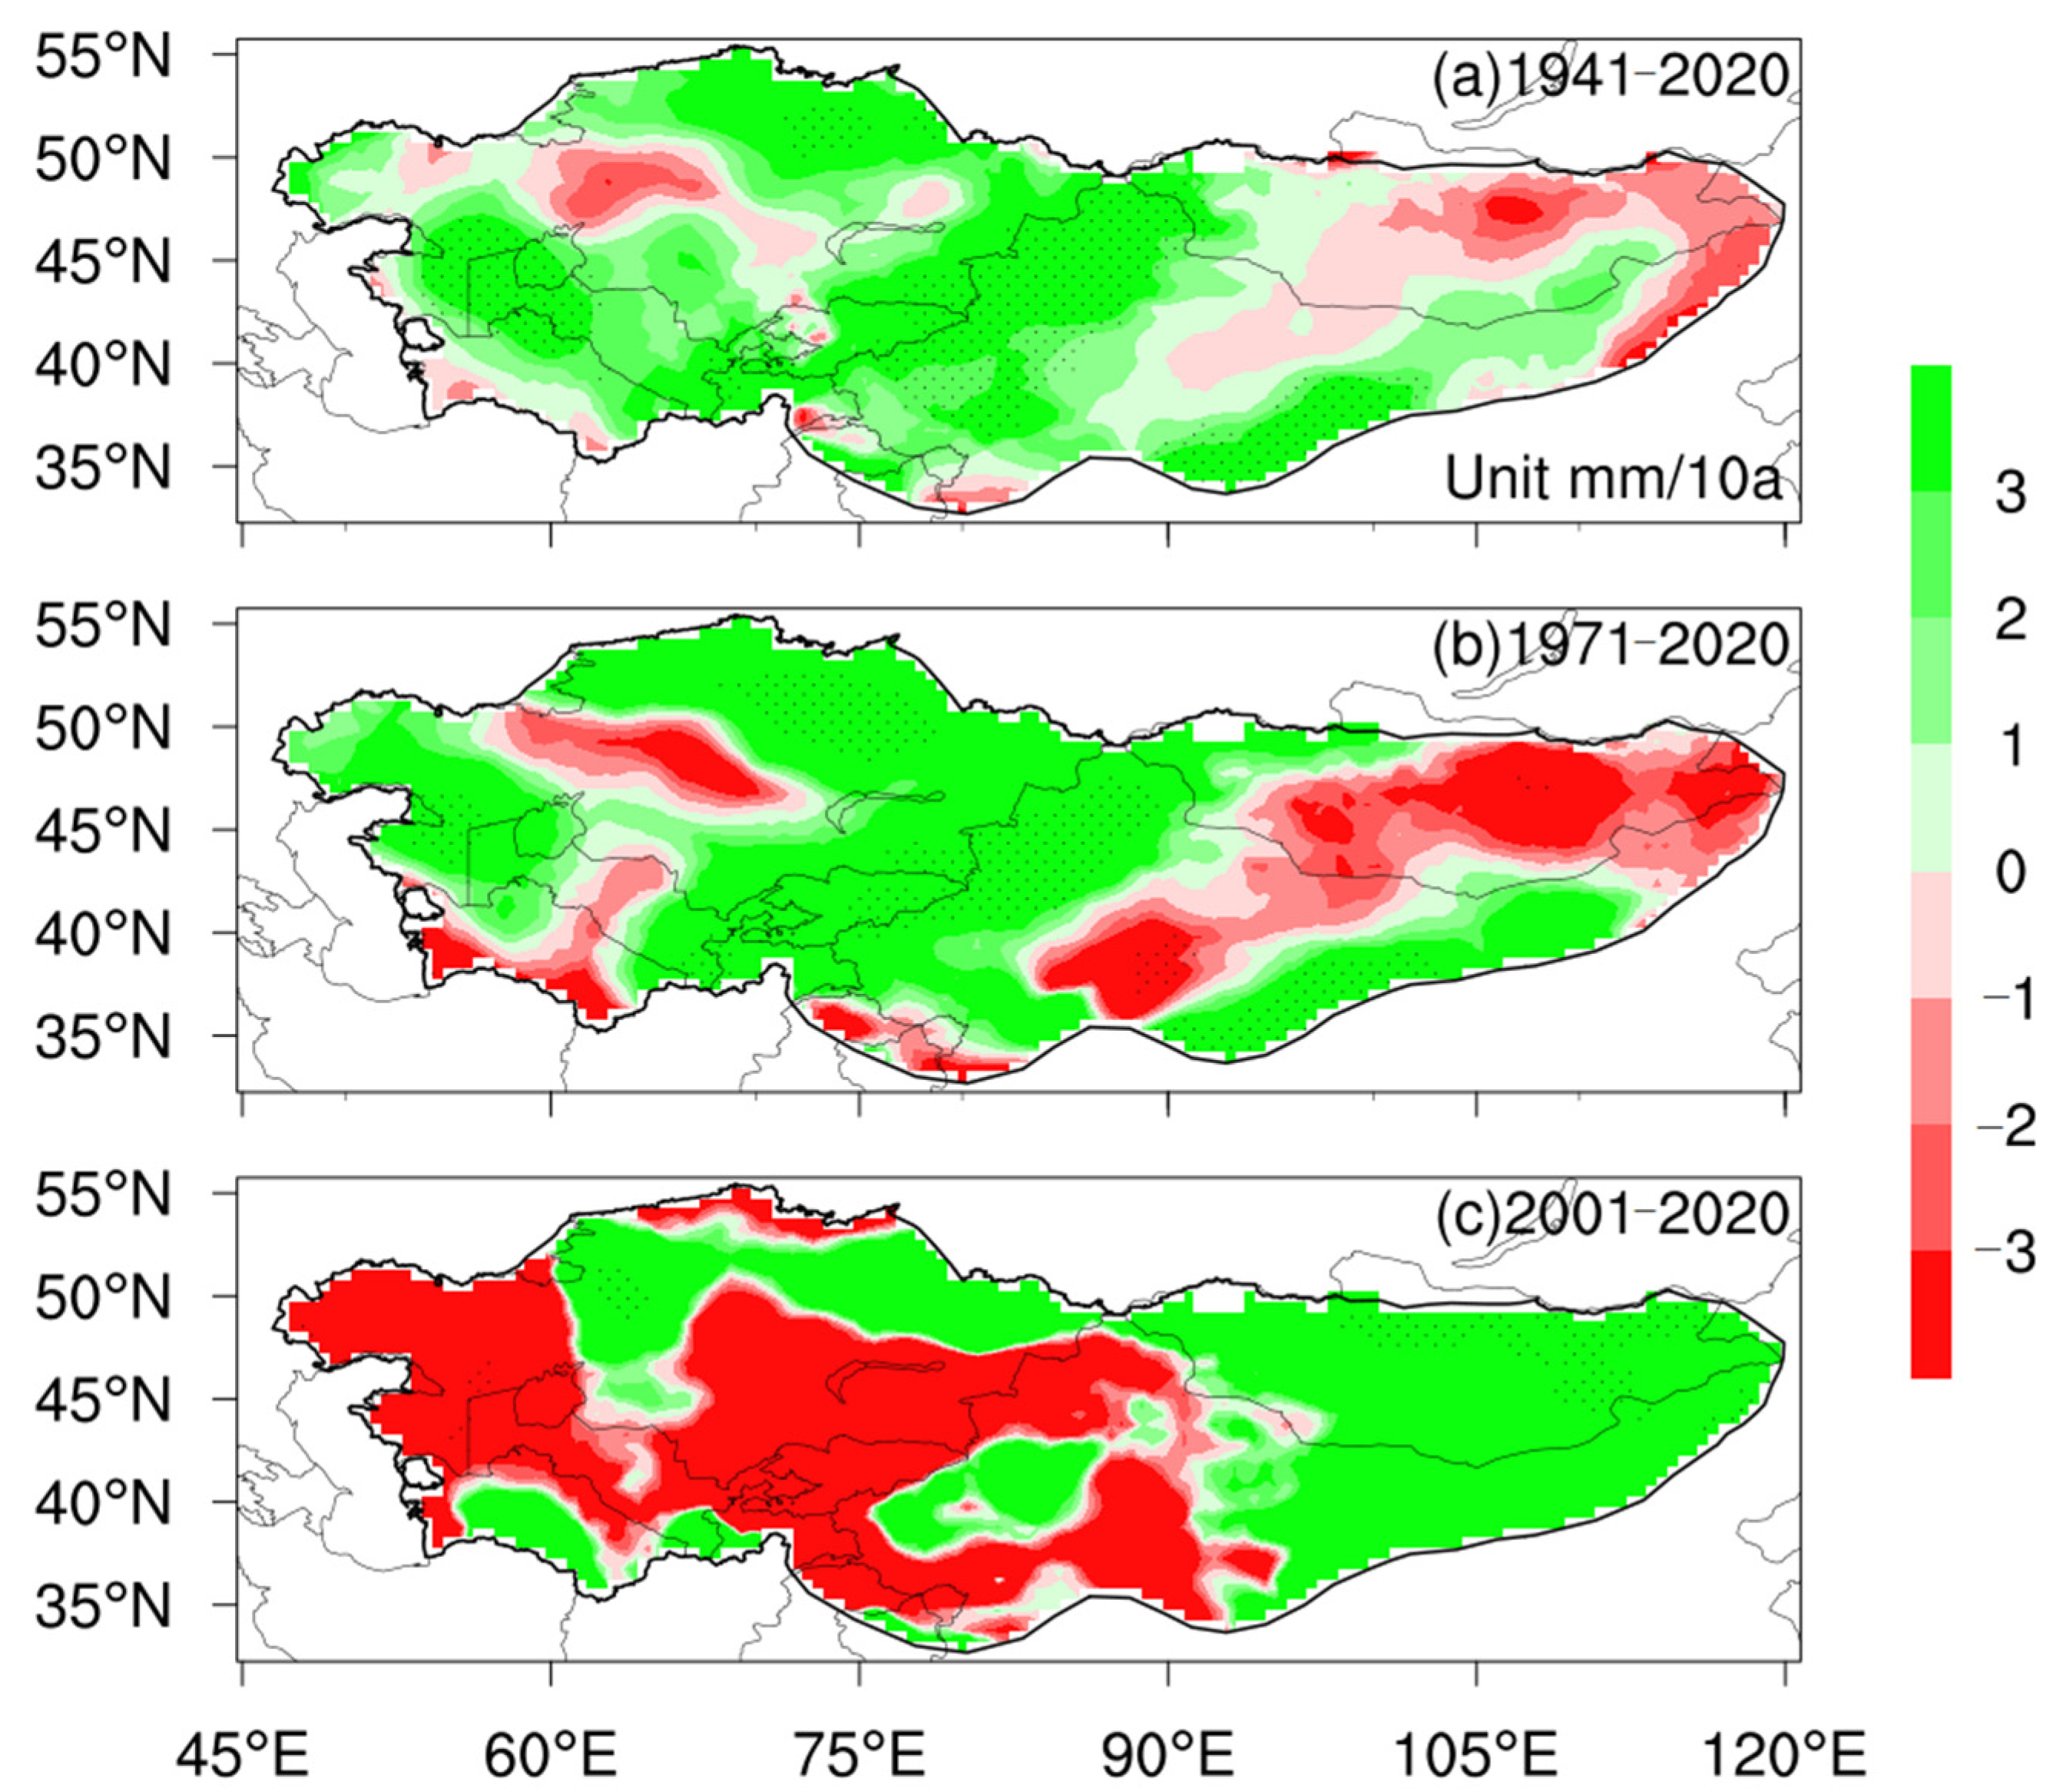
In the last 80 years, except for a few regions in the Middle East of Mongolia and central Kazakhstan, the levels of precipitation in most parts of the Pan-Central-Asia arid region have increased, with the large-value centers located in most of Xinjiang, Western Uzbekistan, Northern Kazakhstan and most of the Pamirs Plateau. The maximum trend value is located in the West of Tajikistan, reaching 18.94 mm/10a, while the maximum trend value of precipitation reduction is located in the central part of Mongolia (−5.37 mm/10a). After 2000, the number of regions with reduced precipitation increased significantly compared with the previous two periods, and the number of regions with increased precipitation decreased (
Figure 7c). However, the extremity of precipitation increased obviously, with the values at positive (negative) centers in
Figure 7c being more than three times those shown in
Figure 7a,b. This phenomenon is due to the intensification of climate warming and the notable increase in atmospheric water vapor content, resulting in the uneven increase in precipitation and extreme precipitation events. It also shows that the response of regional precipitation to global warming is inconsistent and very complex.
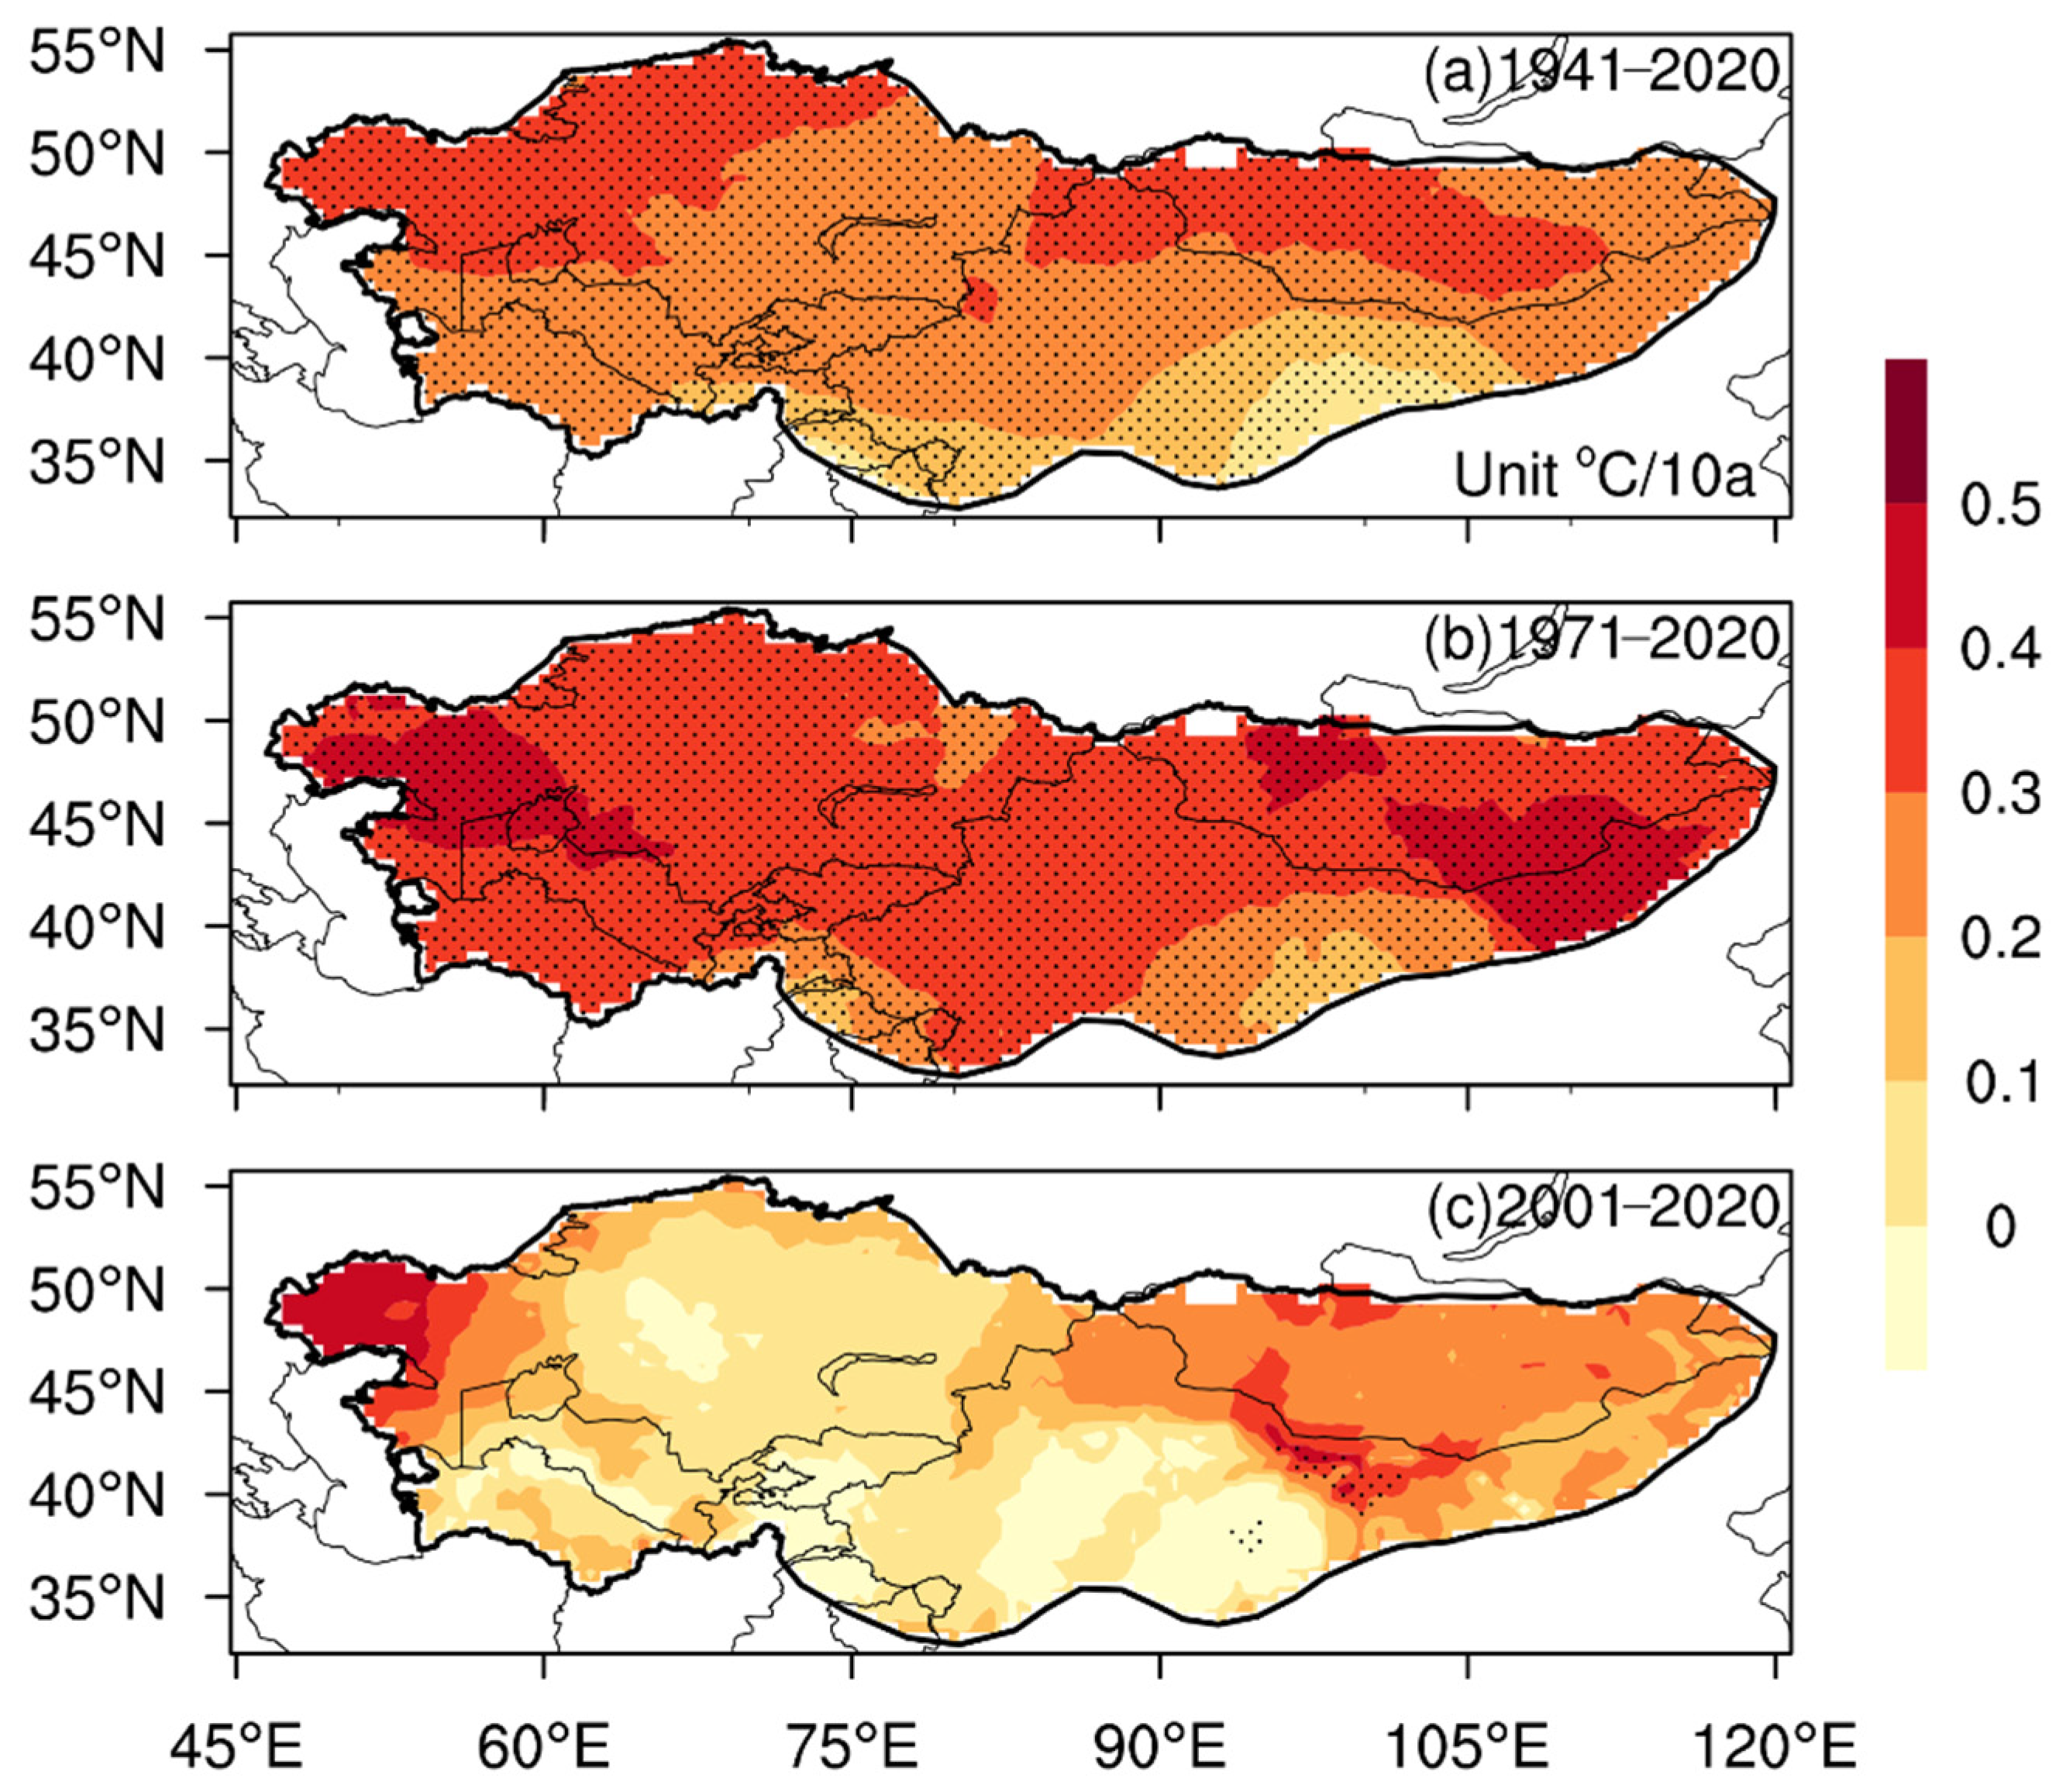
The regional temperature generally presents an increasing trend (
Figure 8). However, in the northeast slope of Qinghai–Tibet Plateau and Hexi Corridor, the temperature increase is obviously lower than in other regions. The centers of temperature increase are located in Eastern Kazakhstan, Northwest Mongolia and some parts of the Inner Mongolian Plateau. In addition, it should be noted that the warming rate in the Pan-Central-Asia arid region is smaller than that in the previous two periods during 2001–2020, which corresponds well to the general trend of global warming stagnation.
As shown by the variability in AI (
Figure 9), there has been a noticeable wetting trend in most parts in the last 80 years, with the largest wetting trends located in Central and Northern Kazakhstan and Northern Xinjiang. In addition, Southern Kazakhstan, most of Mongolia and the Inner Mongolia Plateau showed a drying trend. From 1971 to 2020, the wetting trends in Northern Xinjiang, most of the Pamir Plateau, and Northern and Eastern Kazakhstan were stronger than those in 1941–2020. In Northwest China, except for the weak drying trend in Eastern Xinjiang, most of the others presented wetting trends (
Figure 9b). Since the turn of the 21st century, there has been a pattern of “water-logging in the middle and drought in the surrounding areas” in Xinjiang (
Figure 7c), and most local AI show positive variation trends (
Figure 9c). However, this does not affect the overall warming and wetting in Northwest China.
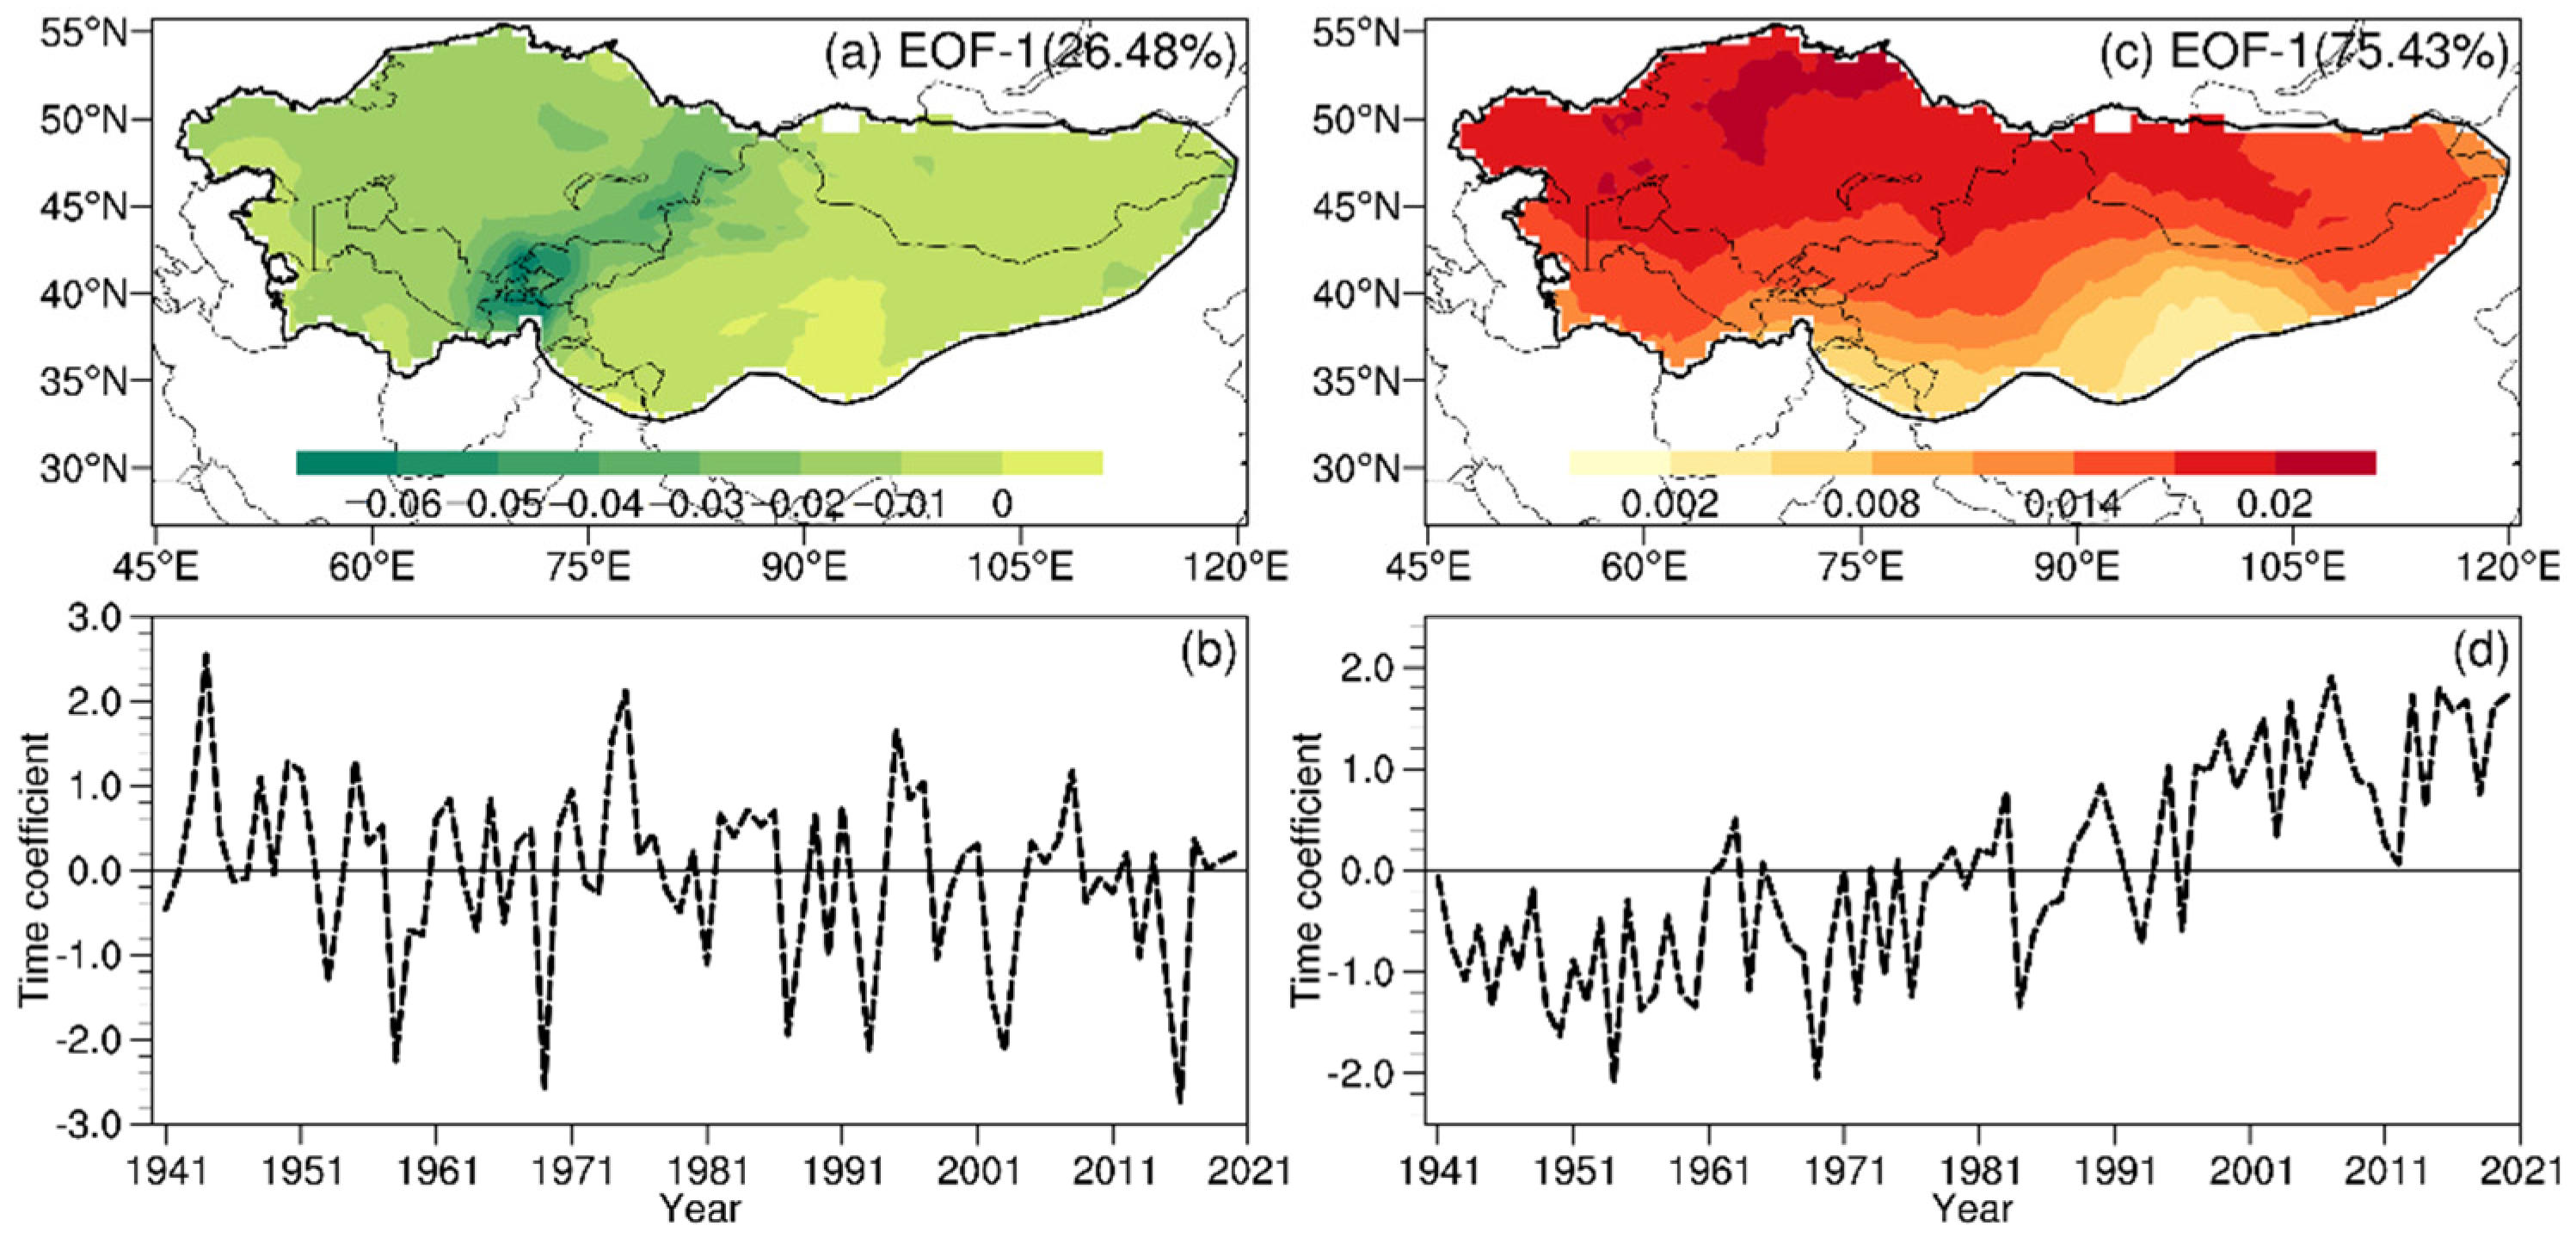
Figure 10 shows the first spatial mode and time series of the precipitation anomaly field (
Figure 10a,b) and the temperature anomaly field (
Figure 10c,d) derived from EOF decomposition. From 1941 to 2020, the first spatial mode of the precipitation anomaly field (variance contribution rate is 26.48%) was mainly dominated by negative values, indicating that the overall variation was consistent. However, an anomaly center near Tajikistan, Kyrgyzstan and Tianshan Mountains indicates that precipitation in these regions changed more dramatically than in other regions. Combined with the time coefficient (
Figure 10b), it can be seen that the precipitation anomalies in 1943, 1975 and 1995 were relatively small. The precipitation anomalies in 1958, 1969, 1987, 1993, 2003 and 2016 were relatively large, consistent with the conclusions of
Figure 3. The first mode of temperature anomaly field (variance contribution rate is 75.43%) also shows the overall regional consistency. Still, there is a stepwise change in temperature decreasing from the northwest to southeast in the Pan-Central-Asia arid region (
Figure 10c).
4. Discussion
The previous analysis showed that the precipitation increase alleviates drought in most regions, including most of Northwest China. Moreover, with the steady rise in temperature, the Pan-Central-Asia arid region become wetter and warmer, consistent with many research results on the warming–wetting trends in Northwest China [
42,
43]. Nevertheless, the “warming-wetting” trend is not equal to a “humid climate”; these are two completely different concepts. Against the background of global climate warming, extreme precipitation increases, and its distribution is highly uneven. In addition, due to the increase in PET [
44], which offsets most of the precipitation increases, the pattern of arid and semi-arid climate in the Pan-Central-Asia arid region has not changed. Will this warming and humidification continue in the future?
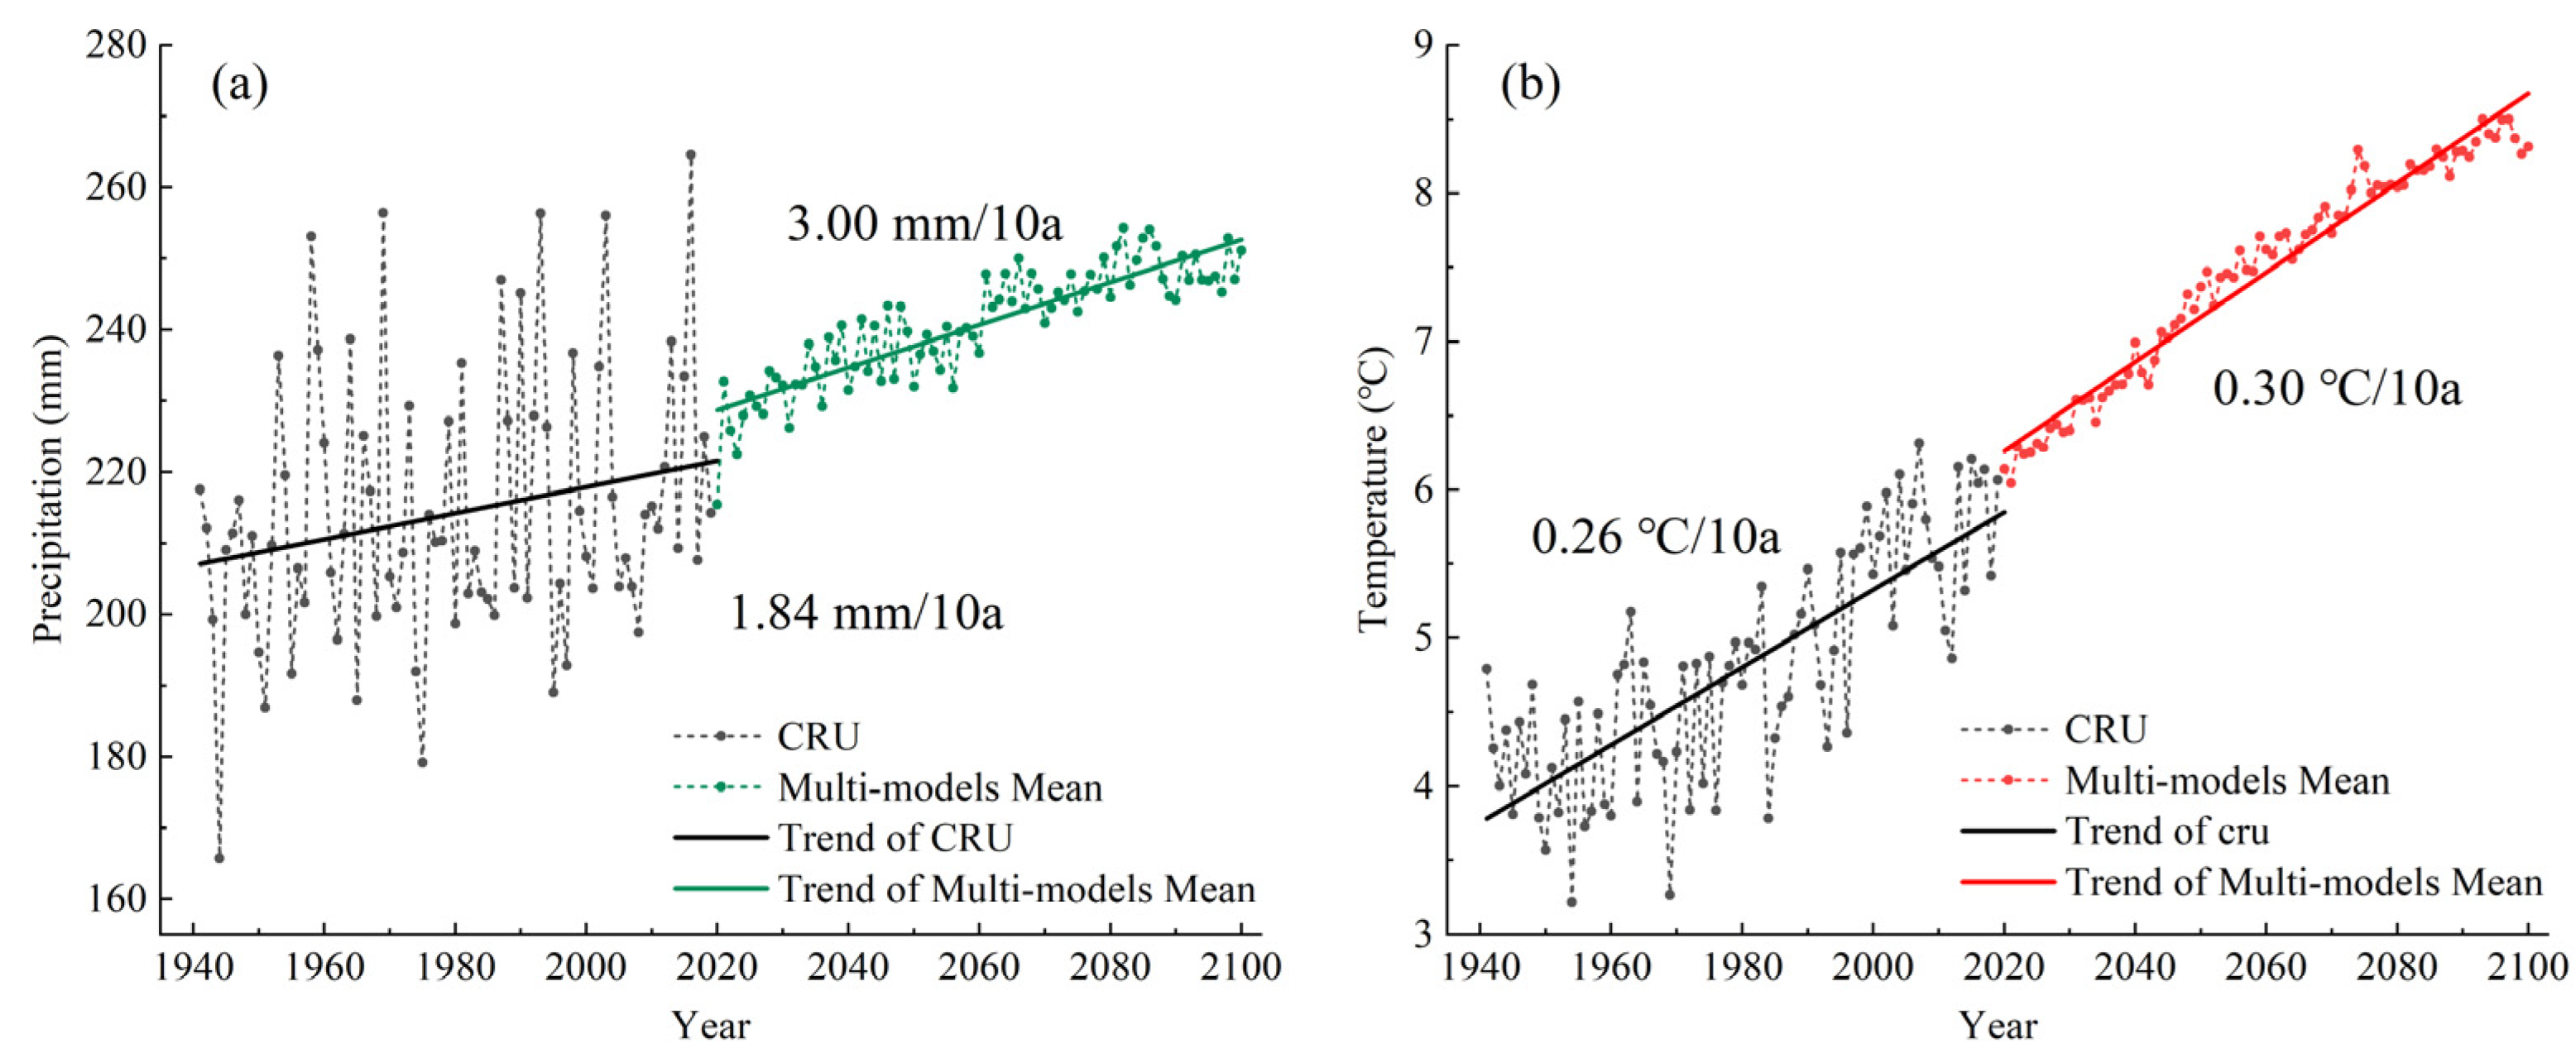
The interannual variations in annual precipitation and average temperature in the next 80 years (2021–2100) were predicted in a medium-emissions scenario using the multi-model ensemble data (
Figure 11). In the past 80 years, the temperature growth rate was 0.26 °C/10a. In the next 80 years, the growth rate will obviously increase to 0.30 °C/10a, which will be 0.04 °C/10a higher than that of 1941–2020. By the end of this century, the regional average temperature will reach about 8.5 °C, significantly higher than that in 2010 (5.7 °C). Yang et al. [
45] pointed out that the temperature growth rate in the eastern part of Northwest China in the next 80 years could reach 0.28 °C/10a—that is, the temperature growth rate in the arid region will exceed that in its surrounding regions in the future. The growth rate of precipitation in the last 80 years was 1.84 mm/10a, and the rate will further rise sharply in the next 80 years, reaching 3.00 mm/10a, which is a response to climate warming. It should be noted that this may result in highly non-uniform precipitation distribution, which means more extreme weather may occur. Nevertheless, there are considerable uncertainties in the prediction results, and the comprehensive impacts of elevated temperature and variable precipitation on drought are still unknown [
46].
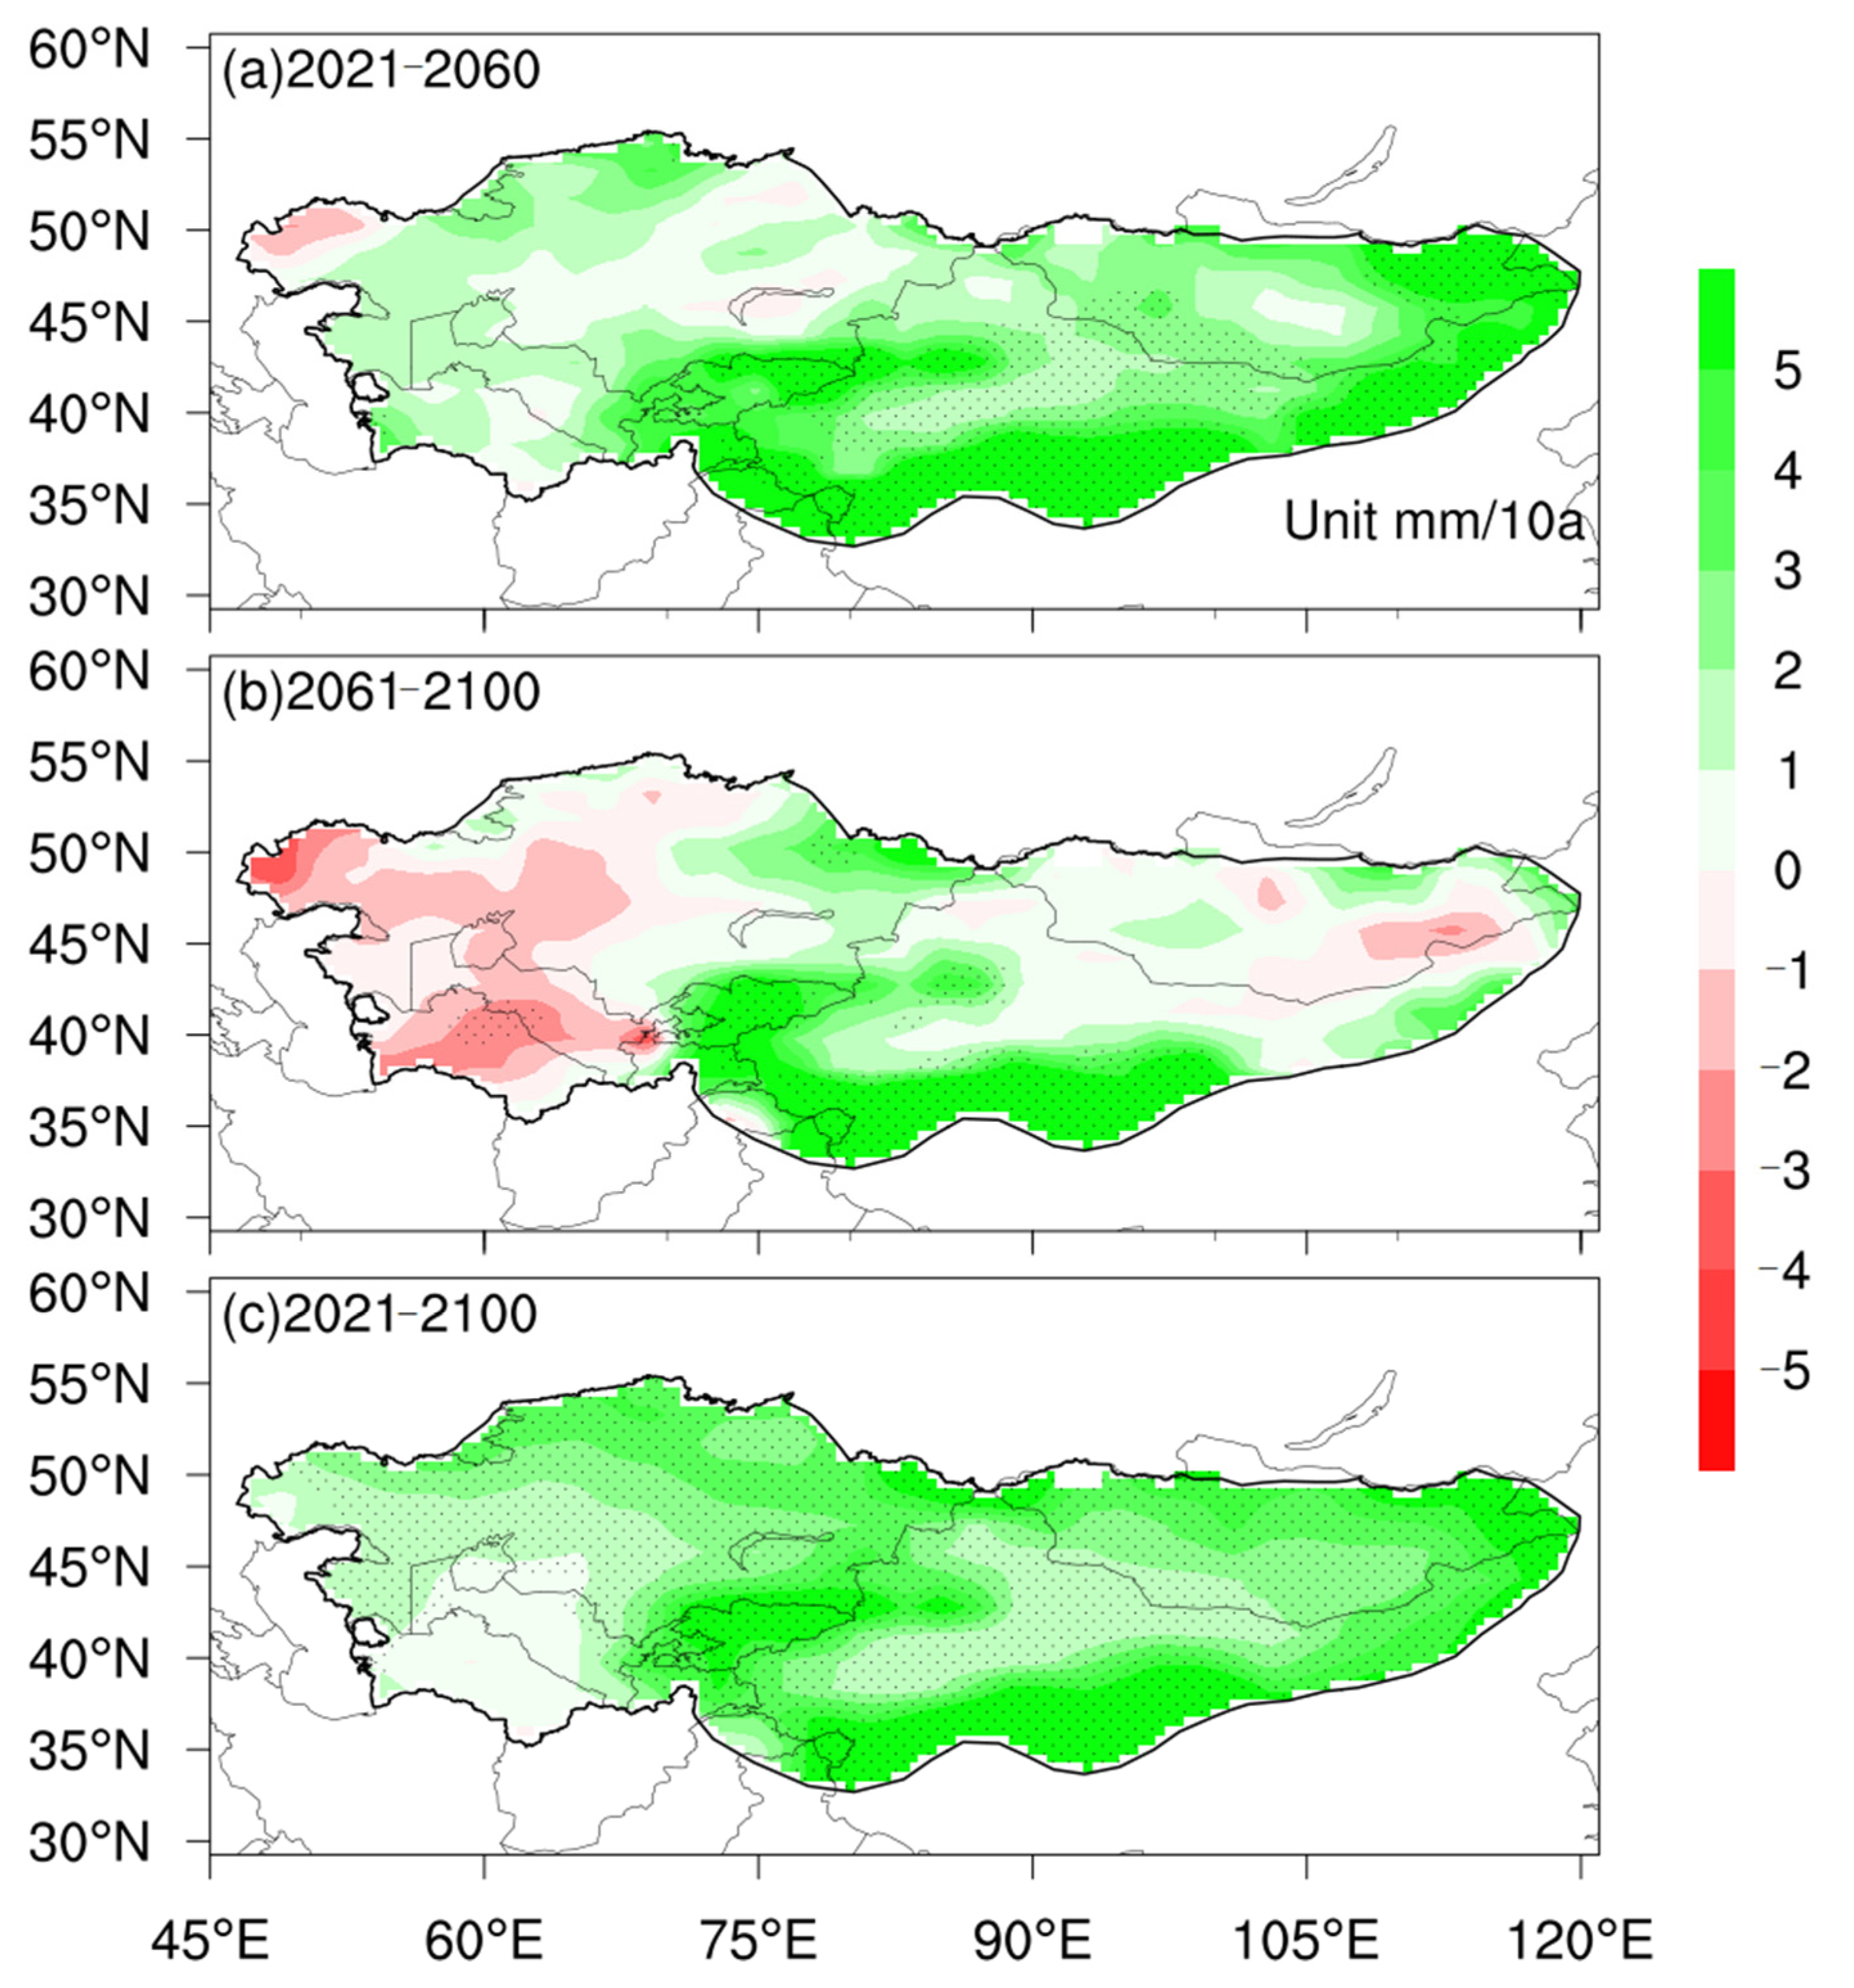
Figure 12 shows the change rate of multi-model ensemble precipitation in 2021–2060, 2061–2100, and 2021–2100. In the next 40 years, precipitation in most parts of the Pan-Central-Asia arid region exhibited a positive variation trend, with the centers located in the Pamir Plateau and Northwest China (
Figure 12a). From 2061 to 2100, the precipitation in most of the five Central Asian countries and the eastern part of Mongolia decrease obviously. Except for a slowdown in the precipitation growth trend in the north of Northwest China, most other regions maintain a positive variation trend (
Figure 12b). In other words, the decreasing trend of precipitation in the north and west of the Pan-Central-Asia arid region may indicate some changes in PDO, NAO, AO, westerly belt and the Siberian high in the future. However, these changes are rendered indeterminate by wide uncertainties in climate forecasts. Resolving these uncertainties should remain a focus of climate modeling given the potential consequences of climate change for ecosystems [
46,
47].
In summary, the climate in the Pan-Central-Asia arid region has moved towards a warming–wetting trend in the last 80 years. The trend could accelerate obviously in the next 80 years in medium-emissions scenarios. Although the increase in precipitation may be a positive side of this trend, the rise in PET caused by sharp warming may cause greater challenges to the regional climate and ecological environment.
5. Conclusions
In the last 80 years, the warming rate in the Pan-Central-Asia arid region was 0.26 °C/10a, which is higher than the global average in the same period (0.18 °C/10a). After 2000, the temperature growth rate decreased to 0.11 °C/10a, similar to the global warming stagnation. Nevertheless, the PET increment in the same period (19.18 mm/10a) was much higher than the average growth rate in the last 80 years. Since the turn of the 21st century, although the growth rate of precipitation has been higher than the average in the last 80 years, the rate of AI has decreased to −0.004/10a. It shows that the regional wetting trend is slowing down, mainly due to the leap growth of PET caused by global warming.
The interannual time scale dominated the precipitation change in the last 80 years, including quasi-three-year cycle and quasi-six-year cycle, of which the former is more significant. However, the decadal and multi-decadal changes were weak. The interannual cycle of precipitation was mainly affected by the change in PDO phases. The long-term trend dominated the main variation characteristics of temperature and was significantly related to the variations in AO. In addition, the interannual variation in temperature in the quasi-three-year cycle was also significant, while the interannual and multi-decadal scale changes were relatively weak. In a word, future research and prediction of precipitation in the Pan-Central-Asia arid region should focus on PDO variations, followed by SOI variations. For the research and prediction of temperature, the variations in AO are impossible to overlook.
In the last 80 years, except for a few regions in central-eastern Mongolia and central Kazakhstan, the precipitation in most parts of the Pan-Central-Asia arid region has increased. The centers of precipitation variation were located in Xinjiang, Western Uzbekistan, Northern Kazakhstan and most of the Pamirs Plateau. The regional temperature was mainly increasing, but in the northeast slope of Qinghai–Tibet Plateau and Hexi Corridor, the temperature increment was obviously lower than that in other regions. There was a stepwise decrease in regional temperature from northwest to southeast.
There has been a noticeable wetting trend in most parts of the Pan-Central-Asia arid region, with the wetting centers in central-northern Kazakhstan and northern Xinjiang. Besides, southern Kazakhstan, most of Mongolia, and the Inner Mongolia Plateau show a drying trend. Since the turn of the 21st century, there has been a pattern of “water-logging in the middle and drought in the surrounding areas” in Xinjiang, and most local AI has shown a positive variation trend. However, it does not affect the overall warming and wetting in Northwest China.
The increase in precipitation alleviates the drought process in most of the study regions, including most of Northwest China. Moreover, with the steady temperature rise, these regions become wetter and warmer. However, the “warming-wetting” trend is not equal to “humid climate”. Under climate warming background, extreme precipitation increases, and the distribution is highly uneven. Besides, because the increase in PET offsets most of the increase in precipitation, the arid and semi-arid climate pattern in the arid region of Pan-Central-Asia has not changed.
The climate in the Pan-Central-Asia arid region has changed towards the warming–wetting trend in the last 80 years. The trend could accelerate obviously in the next 80 years in medium-emissions scenarios. According to the forecast results, the regional average temperature will reach about 8.5 °C, significantly higher than that in 2010 (5.7 °C) by the end of this century. The sharp rise in precipitation may result in highly non-uniform precipitation distribution, which means more extreme weather may occur. Although the increase in precipitation may be a positive aspect of this trend, the rise in PET caused by sharp warming may cause greater challenges to the regional climate and ecological environment. Nevertheless, the estimated results are subject to considerable uncertainty, and the comprehensive impacts of elevated temperature and variable precipitation on drought are still unknown. Considering the significant impact of climate change on ecosystems, solving the uncertainty of model predictions should remain a focus of climate modeling in the future.
Author Contributions
Conceptualization, X.Y. (Xinyang Yan), Q.Z. and X.W.; data curation, X.Y.(Xinyang Yan); formal analysis, X.Y.(Xinyang Yan); funding acquisition, X.Y.(Xinyang Yan), Q.Z.; investigation, X.Y.(Xiaomin Yan); methodology, X.R., L.W.; software, L.B., X.L.; writing—original draft preparation, X.Y.(Xinyang Yan); writing—review and editing, X.Y.(Xinyang Yan), Q.Z.; All authors have read and agreed to the published version of the manuscript.
Funding
This research was funded by National Natural Science Foundation of China (No. 41630426), and Drought Meteorological Science Research Fund of Key Laboratory of Arid Climatic Change and Reducing Disaster of Gansu Province (IAM201913).
Institutional Review Board Statement
Not applicable.
Informed Consent Statement
Not applicable.
Data Availability Statement
The data that support the findings of this study are available from the corresponding author upon reasonable request.
Conflicts of Interest
The authors declare no conflict of interest.
References
- Sheffield, J.; Wood, E.F.; Roderick, M.L. Little change in global drought over the past 60 years. Nature 2012, 491, 435–438. [Google Scholar] [CrossRef] [PubMed]
- Zhang, Q.; Wang, S.; Yang, F.L.; Yue, P.; Yao, T.; Wang, W.Y. Characteristics of Dew Formation and Distribution, and Its Contribution to the Surface Water Budget in a Semi-arid Region in China. Bound.-Layer Meteorol. 2014, 154, 317–331. [Google Scholar] [CrossRef] [Green Version]
- Dai, A. Characteristics and trends in various forms of the Palmer Drought Severity Index during 1900–2008. J. Geophys. Res. 2011, 116. [Google Scholar] [CrossRef] [Green Version]
- Dai, A.; Zhao, T. Uncertainties in historical changes and future projections of drought. Part I: Estimates of historical drought changes. Clim. Chang. 2016, 144, 519–533. [Google Scholar] [CrossRef]
- Bintanja, R.; Selten, F. Future increase in Arctic precipitation linked to local evaporation and sea-ice retreat. Nature 2014, 509, 479–482. [Google Scholar] [CrossRef] [PubMed]
- Zhang, R.; Delworth, T.L. Impact of Atlantic multidecadal oscillations on India/Sahel rainfall and Atlantic hurricanes. Geophys. Res. Lett. 2006, 33, L11712. [Google Scholar] [CrossRef] [Green Version]
- Zhang, J.; Chen, H.; Zhang, Q. Extreme drought in the recent two decades in northern China resulting from Eurasian warming. Clim. Dyn. 2018, 52, 2885–2902. [Google Scholar] [CrossRef] [Green Version]
- Trenberth, K.E.; Branstator, G.W.; Arkin, P.A. Origins of the 1988 North American Drought. Science 1988, 242, 1640–1645. [Google Scholar] [CrossRef]
- Dai, A.; Trenberth, K.E.; Karl, T.R. Global variations in droughts and wet spells: 1900–1995. Geophys. Res. Lett. 1998, 25, 3367–3370. [Google Scholar] [CrossRef] [Green Version]
- IPCC. Climate Change 2013: The Physical Science Basis: Contribution of Working Group I to the Fifth Assessment Report of the Intergovernmental Panel on Climate Change; Cambridge University Press: Cambridge, UK, 2013; pp. 95–123. [Google Scholar]
- Huang, J.; Guan, X.D.; Ji, F. Enhanced cold-season warming in semi-arid regions. Atmos. Chem. Phys. 2012, 12, 5391–5398. [Google Scholar] [CrossRef] [Green Version]
- Yan, X.Y.; Zhang, Q.; Yan, X.M.; Wang, S.; Ren, X.Y.; Zhao, F.N. An overview of distribution characteristics and formation mechanisms in global arid areas. Adv. Earth Sci. 2019, 34, 826–841. (In Chinese) [Google Scholar] [CrossRef]
- Sorg, A.; Bolch, T.; Stoffel, M.; Solomina, O.; Beniston, M. Climate change impacts on glaciers and runoff in Tien Shan (Central Asia). Nat. Clim. Chang. 2012, 2, 725–731. [Google Scholar] [CrossRef]
- Hu, Z.Y.; Zhang, C.; Hu, Q.; Tian, H.Q. Temperature Changes in Central Asia from 1979 to 2011 Based on Multiple Datasets. J. Clim. 2014, 27, 1143–1167. [Google Scholar] [CrossRef]
- Zhang, Q.; Han, L.; Jia, J.; Song, L.; Wang, J.S. Management of drought risk under global warming. Theor. Appl. Climatol. 2015, 125, 187–196. [Google Scholar] [CrossRef]
- Cai, W.J.; Wang, G.J.; Dewitte, B.; Wu, L.; Santoso, A.; Takahashi, K.; Yang, Y.; Carréric, A.; McPhaden, M.J. Increased variability of eastern Pacific El Niño under greenhouse warming. Nature 2018, 564, 201–206. [Google Scholar] [CrossRef] [PubMed]
- Esper, J.; Shiyatov, S.G.; Mazepa, V.S.; Wilson, R.J.S.; Graybill, D.A.; Funkhouser, G. Temperature-sensitive Tien Shan tree ring chronologies show multi-centennial growth trends. Clim. Dyn. 2003, 21, 699–706. [Google Scholar] [CrossRef] [Green Version]
- Zhang, Q.; Zhao, Y.D.; Zhang, C.J.; Li, Y.H.; Sun, G.W.; Gao, Q.Z. Issues about hydrological cycle and water resource in arid region of Northwest China. Arid Meteorol. 2008, 26, 1–8. (In Chinese) [Google Scholar]
- Yan, X.Y.; Zhang, Q.; Zhang, W.B.; Ren, X.Y.; Wang, S.; Zhao, F.N. Analysis of climate characteristics in the Pan-Central-Asia arid region. Arid Zone Res. 2021, 38, 1–11. (In Chinese) [Google Scholar] [CrossRef]
- Harris, I.; Osborn, T.J.; Jones, P.; Lister, D. Version 4 of the CRU TS monthly high-resolution gridded multivariate climate dataset. Sci. Data 2020, 7, 109. [Google Scholar] [CrossRef] [PubMed] [Green Version]
- Zhang, H.L.; Zhang, Q.; Liu, Q.; Chai, Y.C.; Yan, X.Y. The temporal and spatial distribution characteristics of dryness index and its main factors in China. J. Lanzhou Univ. Nat. Sci. Ed. 2016, 52, 484–491. (In Chinese) [Google Scholar] [CrossRef]
- Chen, F.H.; Huang, W.; Jin, L.Y.; Chen, J.H.; Wang, J.S. Spatiotemporal precipitation variations in the arid Central Asia in the context of global warming. Sci. China Earth Sci. 2011, 41, 1647–1657. [Google Scholar] [CrossRef]
- Giannini, A.; Saravanan, R.; Chang, P. Oceanic Forcing of Sahel Rainfall on Interannual to Interdecadal Time Scales. Science 2003, 302, 1027–1030. [Google Scholar] [CrossRef] [PubMed] [Green Version]
- McCabe, G.J.; Palecki, M.A.; Betancourt, J.L. Pacific and Atlantic Ocean influences on multidecadal drought frequency in the United States. Proc. Natl. Acad. Sci. USA 2004, 101, 4136–4141. [Google Scholar] [CrossRef] [PubMed] [Green Version]
- Dong, B.; Dai, A. The influence of the Interdecadal Pacific Oscillation on Temperature and Precipitation over the Globe. Clim. Dyn. 2015, 45, 2667–2681. [Google Scholar] [CrossRef]
- Huang, J.; Ji, M.; Xie, Y.; Wang, S.; He, Y.; Ran, J. Global semi-arid climate change over last 60 years. Clim. Dyn. 2016, 46, 1131–1150. [Google Scholar] [CrossRef] [Green Version]
- Infanti, J.; Kirtman, B. North American rainfall and temperature prediction response to the diversity of ENSO. Clim. Dyn. 2016, 46, 3007–3023. [Google Scholar] [CrossRef]
- Guan, X.; Ma, J.; Huang, J.; Huang, R.X.; Zhang, L.; Ma, Z.G. Impact of oceans on climate change in drylands. Sci. China Earth Sci. 2019, 62, 891–908. [Google Scholar] [CrossRef]
- Gu, G.; Adler, R. Spatial patterns of global precipitation change and variability during 1901–2010. J. Clim. 2015, 28, 4431–4453. [Google Scholar] [CrossRef]
- Liu, Y.Z.; Wu, C.Q.; Jia, R.; Huang, J.P. An overview of the influence of atmospheric circulation of the climate in arid and semi-arid region of Central and East Asia. Sci. China Earth Sci. 2018, 61, 1183–1192. [Google Scholar] [CrossRef]
- Vicente-Serrano, S.; Garcia-Herrera, R.; Barriopedro, D.; Azorin-Molina, C.; Lopez-Moreno, J.; Martin-Hernandez, N.; Tomas-Burguera, M.; Gimeno, L.; Nieto, R. The Westerly Index as complementary indicator of the North Atlantic oscillation in explaining drought variability across Europe. Clim. Dyn. 2016, 47, 845–863. [Google Scholar] [CrossRef] [Green Version]
- Zhang, H.L.; Qiang, Z.; Ping, Y.; Liang, Z.; Qiao, L.; Shaobo, Q.; Pengcheng, Y. Aridity over a semi-arid zone in northern China and responses to the East Asian summer monsoon. J. Geophys. Res. Atmos. 2016, 121, 13901–13918. [Google Scholar] [CrossRef] [Green Version]
- Wu, Z.; Huang, N.E. Ensemble empirical mode decomposition: A noise-assisted data analysis method. Adv. Adapt. Data Anal. 2009, 1, 1–41. [Google Scholar] [CrossRef]
- Bi, S.B.; Li, S.; Xinyu, L.; Changchun, C.; Yin, L. Characteristics of drought and flood disasters in the middle and lower reaches of the Yellow River from 1470 to 1911 based on EEMD method. J. Nat. Disasters 2018, 27, 137–147. [Google Scholar] [CrossRef]
- Xu, B.L.; Yang, Q.; Ma, Z.G. Decadal characteristics of global land annual precipitation variation on multiple spatial scales. Chin. J. Atmos. Sci. 2017, 41, 593–602. [Google Scholar] [CrossRef]
- North, G.R.; Bell, T.L.; Cahalan, R.F.; Moeng, F.J. Sampling errors in the estimation of empirical orthogonal functions. Mon. Weather Rev. 1982, 110, 699–706. [Google Scholar] [CrossRef]
- Mann, H.B. Nonparametric tests against trend. Econometrica 1945, 13, 245–259. [Google Scholar] [CrossRef]
- Kossack, C.F.; Kendall, M.G. Rank Correlation Methods. Am. Math. Mon. 1950, 57, 425. [Google Scholar] [CrossRef]
- Zhang, Q.; Xu, C.Y.; Zhang, Z.; Chen, Y.D.; Liu, C.L. Spatial and temporal variability of precipitation over China, 1951–2005. Theor. Appl. Climatol. 2009, 95, 53–68. [Google Scholar] [CrossRef]
- Ma, Z.G.; Fu, C.B. Decadal variations of arid and semi-arid boundary in China. Chin. J. Geophys. 2005, 48, 519–525. (In Chinese) [Google Scholar] [CrossRef]
- Hu, Z.Y.; Zhou, Q.M.; Chen, X.; Qian, C.; Wang, S.S.; Li, J.F. Variations and changes of annual precipitation in Central Asia over the last century. Int. J. Climatol. 2017. [Google Scholar] [CrossRef]
- Wang, Q.; Zhai, P.M.; Qin, D.H. New perspectives on ‘warming-wetting’ trend in Xinjiang, China. Adv. Clim. Chang. Res. 2020, 11, 252–260. [Google Scholar] [CrossRef]
- Peng, D.; Zhou, T. Why was the arid and semiarid Northwest China getting wetter in the recent decades? J. Geophys. Res. 2017, 122, 9060–9075. [Google Scholar] [CrossRef]
- Wu, P.; Ding, Y.; Liu, Y.; Li, X. The characteristics of moisture recycling and its impact on regional precipitation against the background of climate warming over Northwest China. Int. J. Climatol. 2019, 39, 5241–5255. [Google Scholar] [CrossRef]
- Yang, J.; Zhang, Q.; Lu, G.; Liu, X.; Wang, Y.; Wang, D.; Liu, W.; Yue, P.; Zhu, B.; Duan, X. Climate Transition fromWarm-Dry to Warm-Wet in Eastern Northwest China. Atmosphere 2021, 12, 548. [Google Scholar] [CrossRef]
- Hessl, A.E.; Anchukaitis, K.J.; Jelsema, C.; Cook, B.; Byambasuren, O.; Leland, C.; Nachin, B.; Pederson, N.; Tian, H.Q.; Hayles, L.A. Past and future drought in Mongolia. Sci. Adv. 2018, 4, e1701832. [Google Scholar] [CrossRef] [PubMed] [Green Version]
- Zhang, Q.; Zhu, B.; Yang, J.H.; Ma, P.L.; Liu, X.Y.; Lu, G.Y.; Wang, Y.H.; Yu, H.P.; Liu, W.P.; Wang, D.W. New characteristics about the climate humidification trend in Northwest China. Chin Sci Bull. 2021, 66, 3757–3771. [Google Scholar] [CrossRef]
Figure 1.
The Pan-Central-Asia arid region.
Figure 1.
The Pan-Central-Asia arid region.
Figure 2.
Comparison of precipitation (a) and temperature (b) between CRU and multi-model ensemble data from 2015 to 2020.
Figure 2.
Comparison of precipitation (a) and temperature (b) between CRU and multi-model ensemble data from 2015 to 2020.
Figure 3.
Interannual variations in temperature (a), PET (b), precipitation (c) and AI (d) from 1941 to 2020.
Figure 3.
Interannual variations in temperature (a), PET (b), precipitation (c) and AI (d) from 1941 to 2020.
Figure 4.
Variation trends of precipitation (a) and temperature (b) after EEMD.
Figure 4.
Variation trends of precipitation (a) and temperature (b) after EEMD.
Figure 5.
PCC of four ocean oscillation indexes with components of precipitation (a) and temperature (b) deconstructed by EEMD.
Figure 5.
PCC of four ocean oscillation indexes with components of precipitation (a) and temperature (b) deconstructed by EEMD.
Figure 6.
Correlations between precipitation and PDO (a), and correlations between temperature and AO (b); here, the series adopted the 9-year moving averages. ** passing the 99% confidence level.
Figure 6.
Correlations between precipitation and PDO (a), and correlations between temperature and AO (b); here, the series adopted the 9-year moving averages. ** passing the 99% confidence level.
Figure 7.
Variation rates (unit: mm/10a) of precipitation in the Pan-Central-Asia arid region during 1941–2020 (a), 1971–2020 (b), and 2001–2020 (c). The shaded region indicates where the variability has passed the significance test at 0.05 significance level—the same applies below.
Figure 7.
Variation rates (unit: mm/10a) of precipitation in the Pan-Central-Asia arid region during 1941–2020 (a), 1971–2020 (b), and 2001–2020 (c). The shaded region indicates where the variability has passed the significance test at 0.05 significance level—the same applies below.
Figure 8.
Same as
Figure 7, but for variation rates (unit: °C/10a) of temperature (
a–
c).
Figure 8.
Same as
Figure 7, but for variation rates (unit: °C/10a) of temperature (
a–
c).
Figure 9.
Same as
Figure 7, but for variation rates (unit: /10a) of AI (
a–
c).
Figure 9.
Same as
Figure 7, but for variation rates (unit: /10a) of AI (
a–
c).
Figure 10.
The first leading spatial mode and time series of precipitation anomaly field (a,b) and temperature anomaly field (c,d) derived from EOF decomposition in the Pan-Central-Asia arid region—all have passed the North significance test.
Figure 10.
The first leading spatial mode and time series of precipitation anomaly field (a,b) and temperature anomaly field (c,d) derived from EOF decomposition in the Pan-Central-Asia arid region—all have passed the North significance test.
Figure 11.
Multi-model ensemble predictions of precipitation (a) and temperature (b) in the next 80 years.
Figure 11.
Multi-model ensemble predictions of precipitation (a) and temperature (b) in the next 80 years.
Figure 12.
Variation rates of multi-mode ensemble precipitation in 2021–2060 (a), 2061–2100 (b), and 2021–2100 (c). Shading indicates a passed 0.05 significance test.
Figure 12.
Variation rates of multi-mode ensemble precipitation in 2021–2060 (a), 2061–2100 (b), and 2021–2100 (c). Shading indicates a passed 0.05 significance test.
Table 1.
Five major climatic indexes used in this study.
Table 1.
Five major climatic indexes used in this study.
Table 2.
PCC between four ocean oscillation indexes and precipitation in the Pan-Central-Asia arid region.
Table 2.
PCC between four ocean oscillation indexes and precipitation in the Pan-Central-Asia arid region.
| Index | Period | Interannual | Interdecadal |
|---|
| PDO | 1941–2020 | 0.28 ** | 0.13 |
| 1971–2020 | 0.21 | - |
| 2001–2020 | 0.46 ** | - |
| NAO | 1941–2020 | 0.14 | 0.18 |
| 1971–2020 | 0.21 | - |
| 2001–2020 | 0.29 | - |
| SOI | 1951–2020 | −0.29 * | −0.43 |
| 1971–2020 | −0.31 * | - |
| 2001–2020 | −0.37 | - |
| AO | 1951–2020 | 0.02 | 0.46 |
| 1971–2020 | 0.08 | - |
| 2001–2020 | 0.06 | - |
Table 3.
Variance contribution rates and periods of precipitation and temperature components after EEMD.
Table 3.
Variance contribution rates and periods of precipitation and temperature components after EEMD.
| | Precipitation | Temperature |
|---|
| Period (Year) | Contribution (%) | Period (Year) | Contribution (%) |
|---|
| IMF1 | 3.33 | 56.47 | 2.76 | 21.83 |
| IMF2 | 6.4 | 18.89 | 5.71 | 5.70 |
| IMF3 | 12.31 | 11.72 | 13.33 | 3.61 |
| IMF4 | 32 | 6.34 | 22.86 | 1.36 |
| IMF5 | 40 | 0.20 | 80 | 0.65 |
| Trend | / | 6.39 | / | 66.85 |
| Publisher’s Note: MDPI stays neutral with regard to jurisdictional claims in published maps and institutional affiliations. |
© 2022 by the authors. Licensee MDPI, Basel, Switzerland. This article is an open access article distributed under the terms and conditions of the Creative Commons Attribution (CC BY) license (https://creativecommons.org/licenses/by/4.0/).


