Article

Evaluation of Wave Contributions in Hurricane Irma Storm Surge Hindcast

Department of Mechanical and Manufacturing Engineering, Tennessee State University, Nashville, TN 37209, USA
*
Author to whom correspondence should be addressed.
Atmosphere 2022, 13(3), 404; https://doi.org/10.3390/atmos13030404
Submission received: 10 January 2022 / Revised: 18 February 2022 / Accepted: 23 February 2022 / Published: 1 March 2022

Abstract

:
This paper evaluates the contribution of waves to the total predicted storm surges in a Hurricane Irma hindcast, using ADCIRC+SWAN and ADCIRC models. The contribution of waves is quantified by subtracting the water levels hindcasted by ADCIRC from those hindcasted by ADCIRC+SWAN, using OWI meteorological forcing in both models. Databases of water level time series, wave characteristic time series, and high-water marks are used to validate the model performance. Based on the application of our methodology to the coastline around Florida, a peninsula with unique geomorphic characteristics, we find that wave runup has the largest contribution to the total water levels on the south and northeast coasts. Waves increase the surge on the south and northeast coasts, due to large fetch and wave runups. On the west coast, the wave effect is not significant, due to limited fetch. However, significant wave heights become greater as the waves propagate into the deep inner gulf. The continental shelf on Florida’s west coast plays a critical role in decreasing the significant wave height and sheltering the coastal areas from large wave effects. Both models underpredict the high-water marks, but ADCIRC+SWAN reduces the underprediction and improves the parity with the observed data, although the scatter is slightly higher than that of ADCIRC.

1. Introduction

The increase in the total water level along the coast during a hurricane is mainly caused by a combination of tides, storm surges and waves [1]. The water level rise due to tides is predictable, due to the gravitational pull of the moon and sun. During a storm, the storm surge causes the water level to rise over and above the predicted astronomical tide. To simulate storm surges for operational forecasting, several hydrodynamic models, such as Sea, Lake, and Overland Surges from Hurricanes (SLOSH) [2], Advanced Circulation (ADCIRC) [3], etc., have been successfully used to simulate storm surges due to tropical cyclones.
The water levels at the coast are further elevated by wave transformations through wave runup and wave setup. Waves contribute to the total water level by wave setup through radiation stress [4], and researchers have indicated that wave setup levels are typically around 20% of the offshore significant wave height, so are commonly in the range of 0.5 to 1.5 m on exposed open-coast beaches during storms on the New South Wales coast [5]. The contribution due to wave setup is proportional to the breaking wave height [6], and its magnitude increases substantially at the shoreline, which can be very large in regions with deep water close to the shore. At coasts of deep ocean islands, the wave radiation stress and wave runup tend to be higher due to the lack of a broad shelf to dissipate the wave energy [7]. Joyce et al. [8] analyzed the response of Hurricane Irma’s and Hurricane Maria’s water levels, with respect to tides, winds, atmospheric pressures, waves, and wave radiation stress-induced setups, using SWAN+ADCIRC for deep ocean and reef-fringed islands in the Caribbean. The study observed that the water level response was dominated by the pressure deficit of the hurricanes. It was also observed that wind-driven surge is important over the shallow shelf on the east coast of Puerto Rico, while wave-induced setup was significant at locations near the coastline.
The storm surge and wave processes of Hurricane Rita (2005) and Hurricane Ike (2008) were analyzed on mildly sloping and broad continental shelves in the Gulf of Mexico [9,10]. Studies have indicated that storm surge is largely driven by wind effects in such regions, due to the presence of a broad and shallow continental shelf. Kerr et al. [10] found that waves are minor contributors to water levels in most areas of Louisiana and Texas, but are more significant in steep-sloped regions. The wave processes of Hurricane Ike were analyzed using SWAN+ADCIRC, and it was observed that this hurricane produced large significant wave heights, exceeding 15 m, in the deep gulf [9]. These wave heights radiated from the storm’s center and transformed upon reaching the continental shelf. The study further observed a lag in the arrival of the peak wave heights to the shelf, due to artificial retardation of the swell on the continental shelf, which is heavily dependent on bottom friction.
The size of waves depends on the wind speed and wind duration, and is directionally dependent on the area over which the wind is blowing [11,12,13,14]. From earlier studies, such as [11,12], the relationship between waves and fetch is well understood. The larger the fetch over which the wind blows, the longer the average waves will be [11]. The study [12] found that wave height is proportional to the square root of the fetch. In a study that analyzed the effect of fetch on wave-generated shear stresses, it was found that wave height depends on the wind direction for a given fetch distance [13]. Bolanõs et al. [14] studied the effects of nearshore wave features on wave generation and found that storms corresponding to fetch-limited direction had smaller wave spectra widths. Understanding these wave characteristics is fundamental in assessing a storm’s coastal impact.
This study focuses on coastal areas around the Florida Peninsula, which is bordered by the North Atlantic Ocean on the east, the Gulf of Mexico on the west, and Florida Bay to the south. In addition to these areas, Florida also has an abundance of bays and estuaries associated with the state’s river systems, which add many miles to the coastline [15]. These coastal geomorphic characteristics present unique storm surge and wave processes. A wave energy classification around Florida’s coasts indicated that the east coast is categorized as a high wave energy zone, as it is directly open to the sea [16]. Because the winds over the North Atlantic Ocean have many hundreds of miles to build into swells, these swells increase as they approach the shallow inshore areas and finally break, resulting in large significant wave heights of 3–12 ft [15]. On other the hand, the west coast is considered a low wave energy zone, as it is sheltered from large wave action and has short wind fetch distances [16]. The height and frequency of waves along most of this coast are much smaller when compared to the Atlantic side.
The goal of this study is to quantify the contribution of waves to water elevation during the 2017 Hurricane Irma around the Florida Peninsula, to better understand the drivers of storm surge and coastal flooding. To achieve this, total water levels, including wave contributions, are simulated using the ADCIRC+SWAN model, while the ADCIRC model is utilized to simulate the same, excluding wave contributions. The contribution from waves is then quantified by subtracting the water levels hindcasted by ADCIRC from those hindcasted by ADCIRC+SWAN, using OWI meteorological forcing.

2. Methodology

2.1. ADCIRC

Advanced Circulation (ADCIRC) uses the continuous Galerkin finite element method to solve shallow-water equations to model hurricane storm surges on unstructured meshes [17,18]. The two-dimensional (2D) depth-integrated version, often referred to as ADCIRC-2DDI, is used in this study to simulate the tide component of total water levels during Hurricane Irma around Florida Peninsula.

2.2. ADCIRC+SWAN

Advanced Circulation and Simulating Waves Nearshore (ADCIRC+SWAN) is a tightly coupled model of the ADCIRC and SWAN models that is used to simulate waves and storms by sharing the same unstructured fine element mesh [19]. The ADCIRC model first interpolates the input wind spatially and temporally onto the computational vertices and runs to calculate water levels and currents. The wind field, water level, and currents are then passed to the SWAN model, which solves the wave action balance equation and obtains wave parameters, such as significant wave height and wave period, by integrating a 2D wave energy spectrum into the frequency and direction domain. The spectra balance equation can be expressed in spherical coordinates as follows:
N t + c λ N λ + c o s 1 φ   c φ c o s φ N φ + c σ N σ + c θ N θ = S t o t σ
where σ is the relative radian or circular frequency; θ is the wave propagation direction; c λ and c φ denote the speed of wave energy propagation in longitudinal and latitudinal directions, respectively; c σ and c θ are the wave energy propagation velocities in spectral space; S t o t is the source term that represents all physical processes that generate, dissipate, or redistribute wave energy; N is the wave action density. The wave action density is equal to the energy density (E) divided by the relative frequency, and can be expressed as follows:
N ( λ , φ , σ , θ ) = E ( λ , φ , σ , θ ) σ
The right-hand side of Equation (1) is the source S expressed in terms of energy density. In deep water, three components are more relevant, corresponding to the atmospheric input, nonlinear quadruplet interactions, and white capping dissipation. In intermediate and shallow water, some additional terms, corresponding to the finite depth effects, including bottom friction, depth-induced wave breaking, or triad nonlinear wave–wave interactions, may become significant.

3. Model Setup

3.1. Model Domain

This study uses the Hurricane Surge On-Demand Forecasting System (HSOFS) mesh [20], which covers the US east coast and Gulf of Mexico (Figure 1). The unstructured mesh has 3,564,104 nodes and 1,813,443 triangular elements. The mesh has an average resolution of 500 m along the coast, with some areas decreasing to a resolution of 150 m. The HSOFS is a reasonably acceptable mesh for a storm surge and wave study around Florida. Figure 1a shows the unstructured mesh, and the area of study is marked with a red box. Figure 1b shows the locations and bathymetry of tidal gauges and wave buoys, and the track of Hurricane Irma. The bathymetry of wave buoys shows that their locations are in the deep ocean compared to tidal gauges. Table 1 presents the details of the locations and bathymetry of the tidal gauges and wave buoys.

3.2. Surface Wind and Pressure Forcing

The Interactive Objective Kinematic Analysis (IOKA) by Ocean Weather Inc. (OWI, Stamford, CT, USA), a data-assimilated wind model for meteorological forcing, is used in the present study. The OWI wind field for Hurricane Irma was generated by blending the TC96 (short for Thompson and Cardone, 1996) mesoscale model [21], an inner core wind field transformed to 30 min, averaged at the 10 m reference level, sustained winds using the IOKA system. In this model, wind and surface pressure fields are generated based on observations from anemometers, airborne- and land-based Doppler radar, microwave radiometers, buoys, ships, aircraft, coastal stations, and satellite measurements [22,23]. The OWI data have been validated by several studies, such as [10,24,25], and are found to reasonably represent the surface wind and pressure of hurricanes.

3.3. Model Parameters

The ADCIRC-2DD1 model is used for the simulation of tides and surges. The model uses the continuous Galerkin finite element method to solve shallow-water equations to model hurricane storm surges on unstructured meshes [11,26]. The wind drag formulation of Powell, with a cap of 0.0028, is adopted for the calculation of wind stress. The spatially varying Manning’s n bottom friction is based on the Coastal Change Analysis Program (CCAP) regional land cover data. The timestep for ADCIRC is set to 4 s to maintain computation stability.
The SWAN model shares the same HSOFS mesh and meteorological forcing with ADCIRC. The Komen formulation is used for white capping; dissipation by death-induced breaking and bottom friction are activated, and three wave–wave interactions (triads) are activated [27]. The Jonswap formulation is used for the bottom formulation. The friction coefficient of 0.067 m2/s3 is used for both wind waves and swells. The spectral space is discretized using 36 directional bins with a directional resolution of 10° and 30 frequency bins with a logarithmic resolution over the range of 0.03 to 0.55 Hz. The timestep for SWAN is set to 600 s.
ADCIRC+SWAN uses the same coupling interval as the time step for SWAN. The ADCIRC model passes wind forcing, water levels, and currents to the SWAN model every 600 s, while the SWAN model passes radiation stress to the ADCIRC model to update the circulation calculations. The model simulation is cold-started from 0000 UTC 16 July, with a 50.5-day tide-only period that allows the tides to reach dynamic equilibrium. This is followed by a 7.5-day Irma simulation from 1200 UTC 04 September to 0000 UTC 12 September.
The following two simulations are run in this study: (1) the ADCIRC model simulation for the total water level, excluding waves; (2) ADCIRC+SWAN to consider the effect of waves on the total water level.

3.4. Model Validation

To validate the model performance, databases of water level time series [28], wave characteristic time series [29], and high-water marks [30] are collected by filtering stations from a wide variety of sources, for both the ADCIRC and ADCIRC+SWAN models. Model validation is achieved by comparing the simulated results of the ADCIRC and ADCIRC+SWAN models against the observed data at eight tidal gauges and four wave buoys, respectively, as shown in Table 1. In addition, 47 high-water marks (HWM) distributed around the Florida Peninsula are compared to the simulated results using three statistical performance indicators, i.e., coefficient of determination ( R 2 ), mean normalized bias (BMN), and root mean square error (ERMS).
The coefficient of determination ( R 2 ) describes how well a regression line fits a set of data, and has an ideal value of one. The mean normalized bias (BMN) indicates the model’s magnitude of overprediction or underprediction, normalized to the observed value, with an ideal value of zero, and is expressed as follows:
B M N = 1 N i = 1 N E i 1 N i N | O i |
The root mean square error (ERMS) is an indication of the magnitude of error, with an ideal value of zero, and can be expressed as follows:
E R M S = 1 N i = 1 N E i 2
where O is the observed value, E is the error, in terms of simulated minus observed, and N is the number of data points.
The above statistics are used to validate the model performance by only utilizing the points that were wetted by the model.

4. Results

4.1. Evolution of Surges and Waves

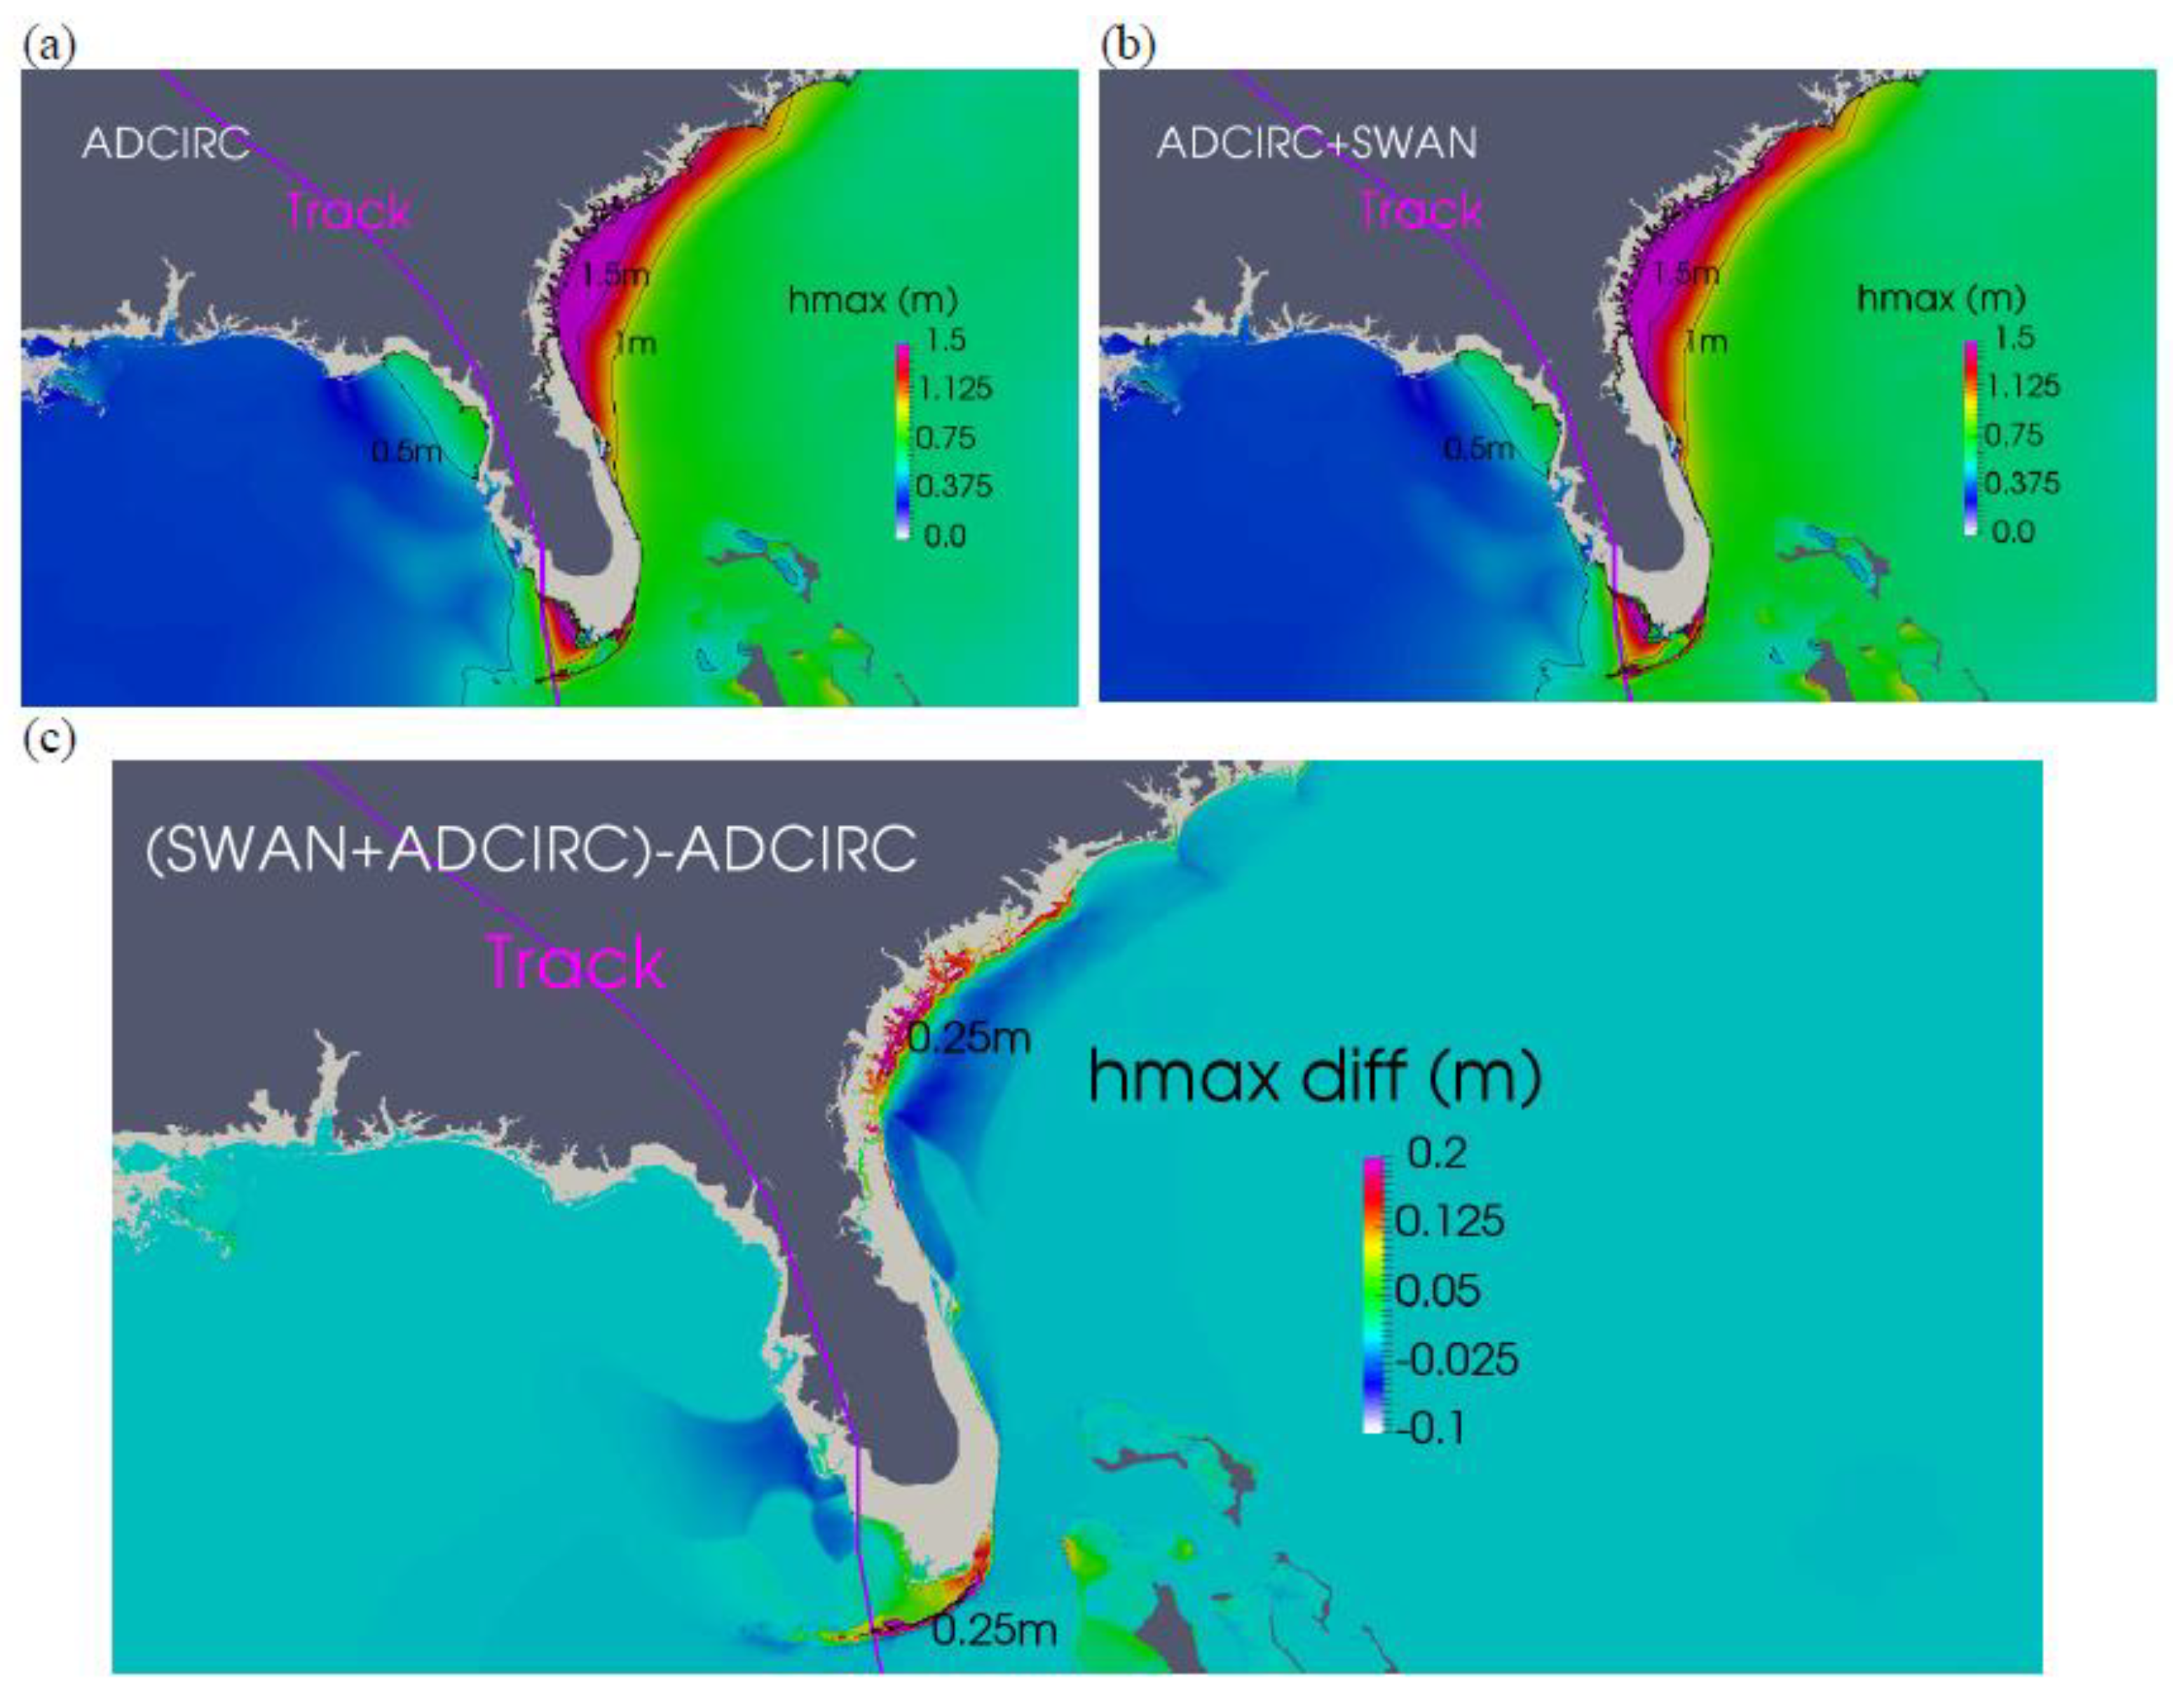
To quantify the contribution of waves to the simulated total water levels in Figure 2, we first compare the simulated maximum water elevation from the two models using OWI wind fields. Figure 2a shows a contour plot of the maximum water elevation due to all forcings, excluding waves (i.e., results from the ADCIRC model), and Figure 2b displays a similar contour plot of all forcings, including waves (i.e., results from the coupled ADCIRC+SWAN model). It can be observed that the surge effects of Hurricane Irma were more dominant on the south and northeast coasts of Florida, with a maximum water elevation of more than 1.5 m. By comparing the contour plots in Figure 2a,b, waves do not seem to have a significant effect on storm size and the extent of flooding.
To quantify the actual effect of waves on the total water levels, the maximum water elevation, simulated by ADCIRC, is subtracted from that simulated by ADCIRC+SWAN, as presented in Figure 2c. It can be observed that the effect of waves is more dominant on the northeast and south coasts of Florida, while waves have little effect on the west coast of Florida. The possible reason for this is that on the south and northeast coasts, storms have much longer fetch distances, which allow high wave runup that breaks into large water elevation and significant wave heights when approaching the coast [15,16]. However, due to the limited wind fetch distances on the west coast, the wave effects are much smaller [16]. As shown by the black contour line in Figure 2c, the wave contribution in the surge can reach more than 0.25 m on the south and northeast coasts of Florida.
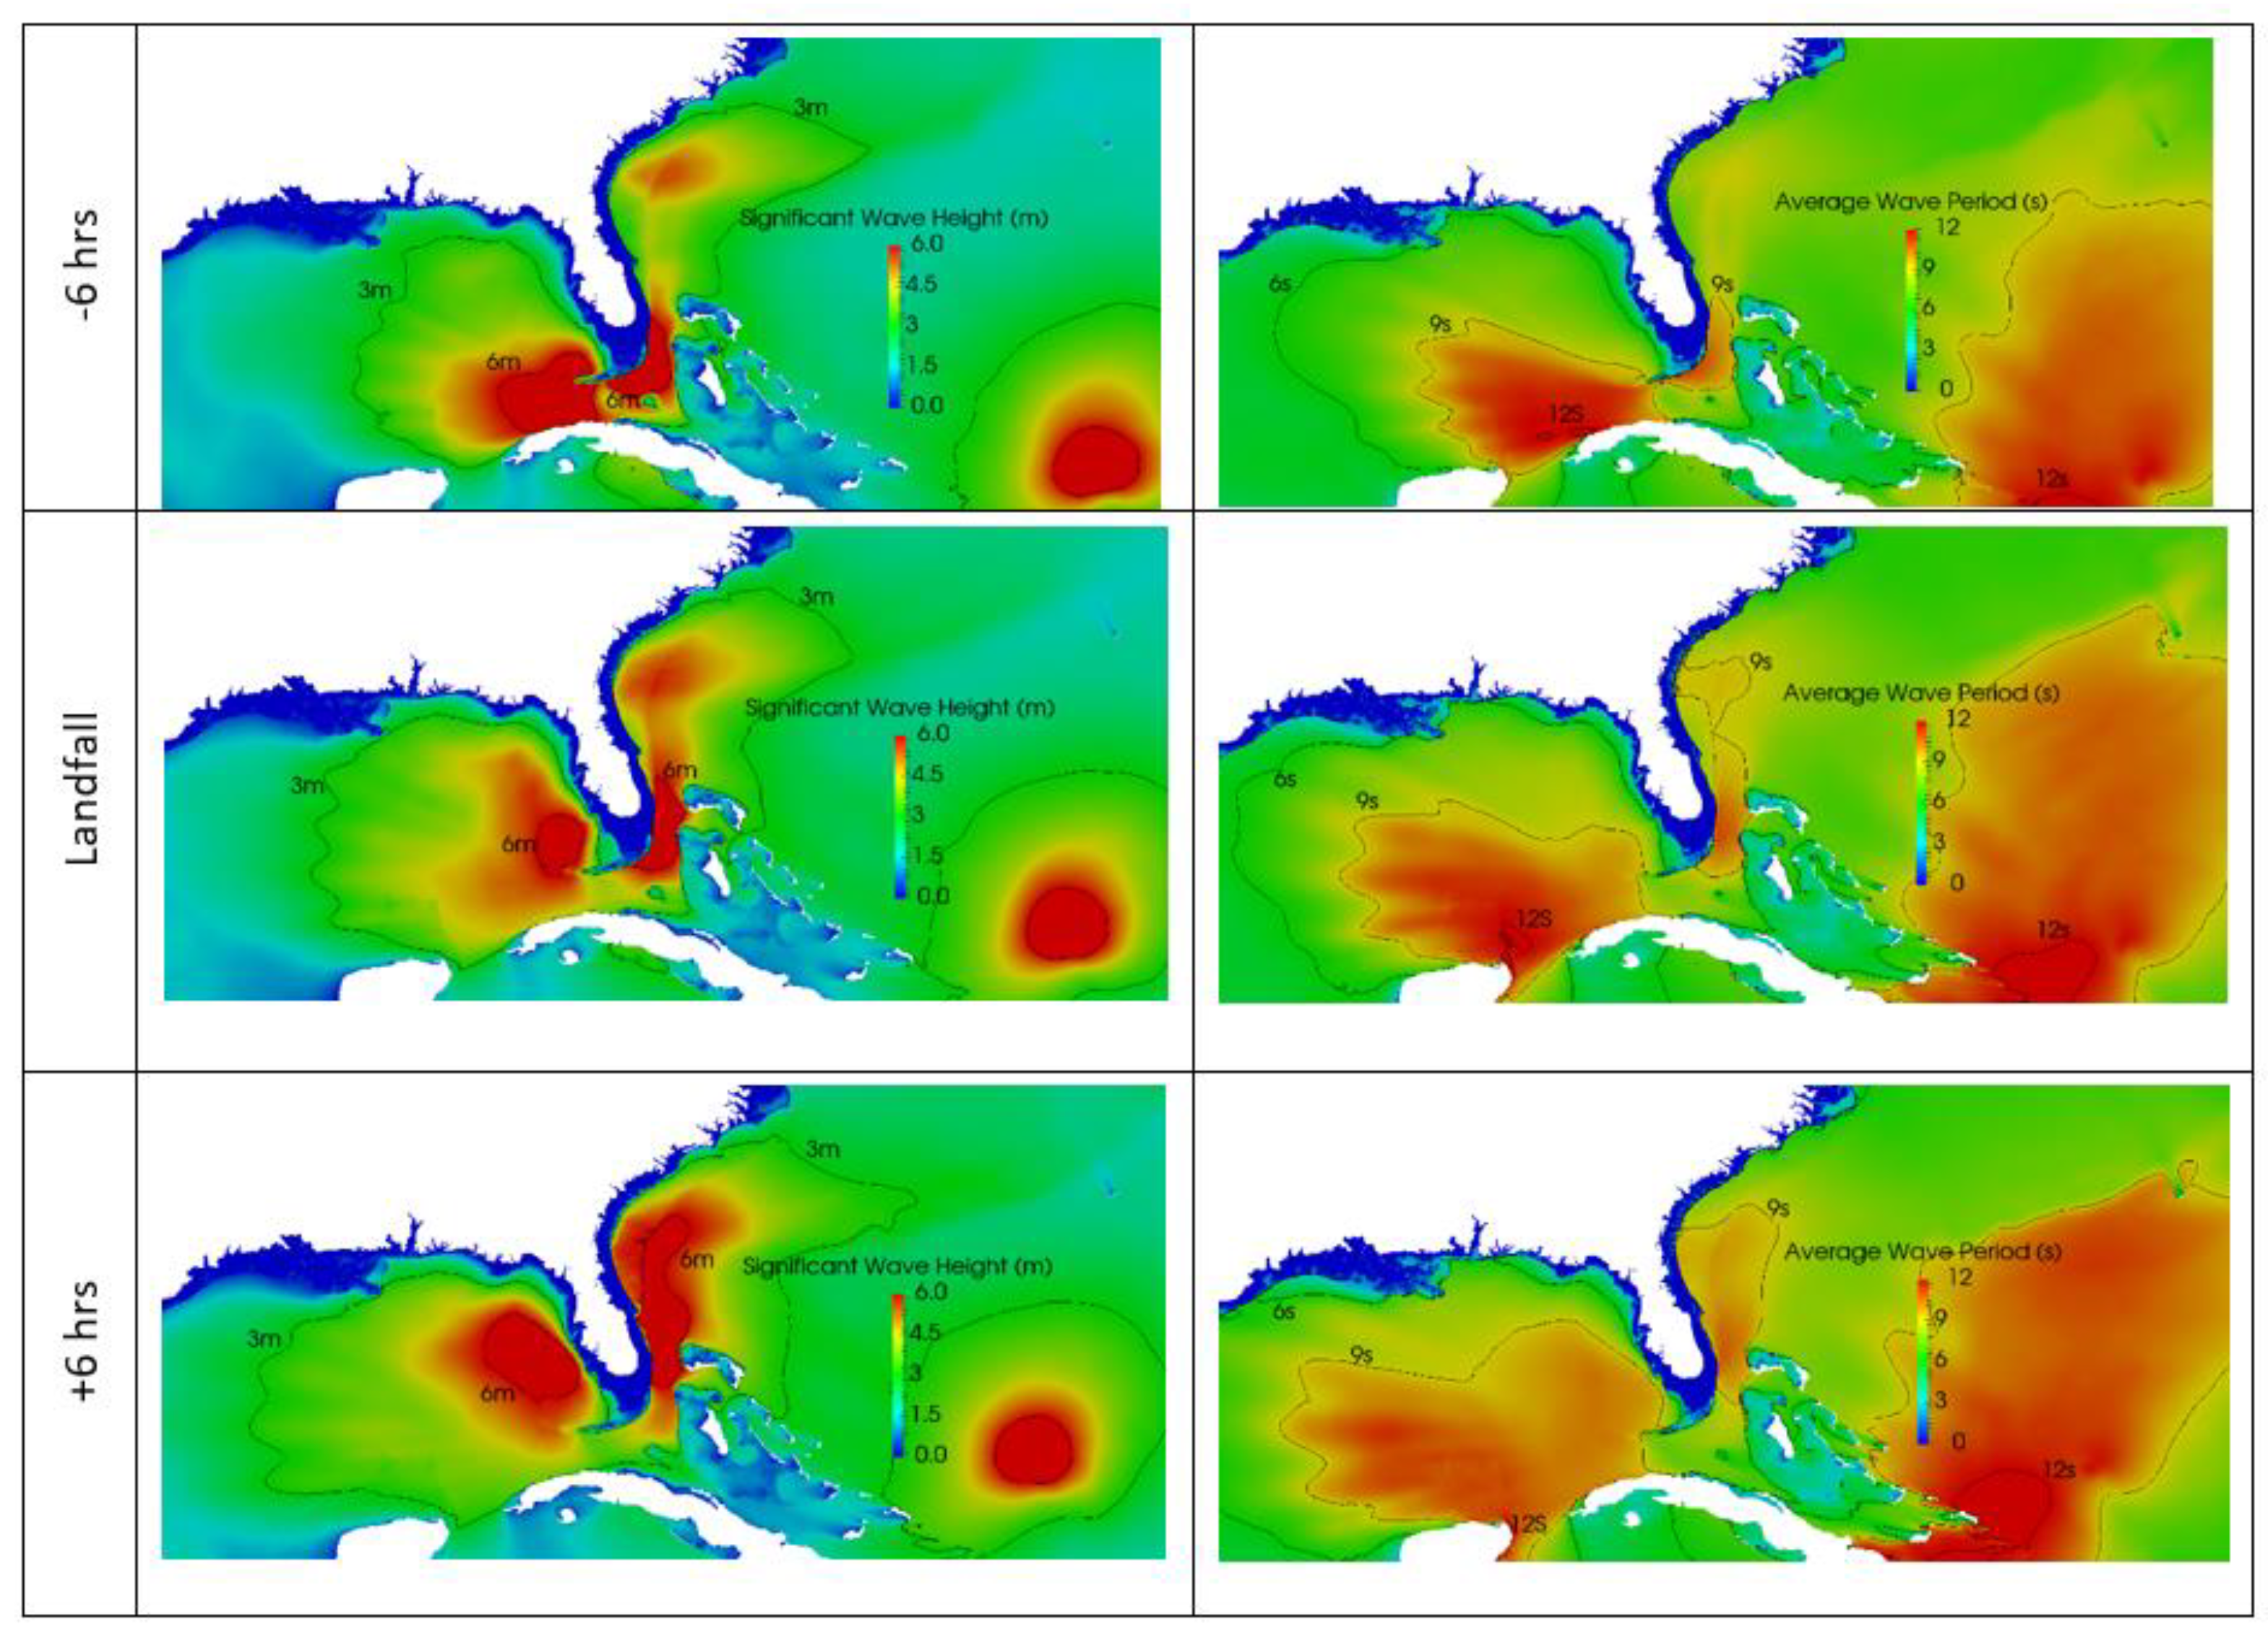
Figure 3 shows snapshots of the wave fields for Hurricane Irma at select times, with respect to its landfall. The significant wave height (SWH) and average wave period (AWP), simulated by the ADCIRC+SWAN model, are displayed in column 1 and column 2 of Figure 3, respectively. As shown in column 1, with the exception of Florida’s west coast, the SWH exceeded 3 m around most of the Florida Peninsula. Six hours before landfall, a large SWH is observed to dominate most of the south coast of Florida. At landfall and 6 h after landfall, the SWH becomes more dominant on the east coast. In the nearshore areas of the west coast, the SWH is negligible, which can be attributed to the limited fetch distance, as indicated by previous studies, such as [14]. However, the SWH becomes greater as waves propagate into the inner gulf, due to the wave energy being dissipated over a deeper and wider area. This phenomenon indicates that the shelf on the west coast of Florida plays a critical role in decreasing the significant wave height and sheltering the coastal areas from large wave actions.
As shown in column 2, an AWP of more than 9 s is dominant on the south coast, 6 h before landfall. At landfall and 6 h after landfall, the AWP is increased on the east coast. In the nearshore areas of the west coast, the AWP is negligible, but increases in the offshore areas of the inner gulf.

4.2. Validation of Water Levels

The storm surge hindcasts simulated by the ADCIRC and ADCIRC+SWAN models are compared with the observed water levels recorded during Hurricane Irma, at eight NOAA tidal gauge stations, as shown in Table 1. Figure 4 shows water level time series comparisons at eight gauge stations. First, the model results from ADCIRC and ADCIRC+SWAN are compared with the observed water levels. The simulated water levels at stations located on the east coast of Florida (Mayport, Virginia Key, and Lake Worth Pier) agree with the observed data, in terms of both magnitude and phase. However, the water levels simulated by both ADCIRC and ADCIRC+SWAN at stations on the south and west coasts of Florida underpredicted the surge levels. The highest degree of underprediction is observed at the Florida Keys, Key West and Vaca Key stations. An insufficient mesh resolution, outdated bathymetry, inaccurate wind field, etc., are possible reasons for this mismatch.
We then compared the results from ADCIRC and ADCIRC+SWAN at eight tidal gauge stations. Generally, the water levels simulated by ADCIRC+SWAN are consistently higher than those simulated by ADCIRC at all eight gauge stations, indicating a potential contribution of waves to the total water levels through wave runups. At the west coast stations (Naples, Fort Myers, and Port Manatee), the contribution of waves is barely noticeable, probably due to the short fetch length on the west coast, as discussed earlier. However, larger differences in water elevation are observed at the stations on the east or northeast coasts (Mayport and Lake Worth Pier), and on the south coast (Virginia Key, Key West, and Vaca Key). This reemphasizes the fact that the impact of waves around Florida is more dominant on the east, northeast and south coasts than on the west coast.

4.3. Validation of Waves

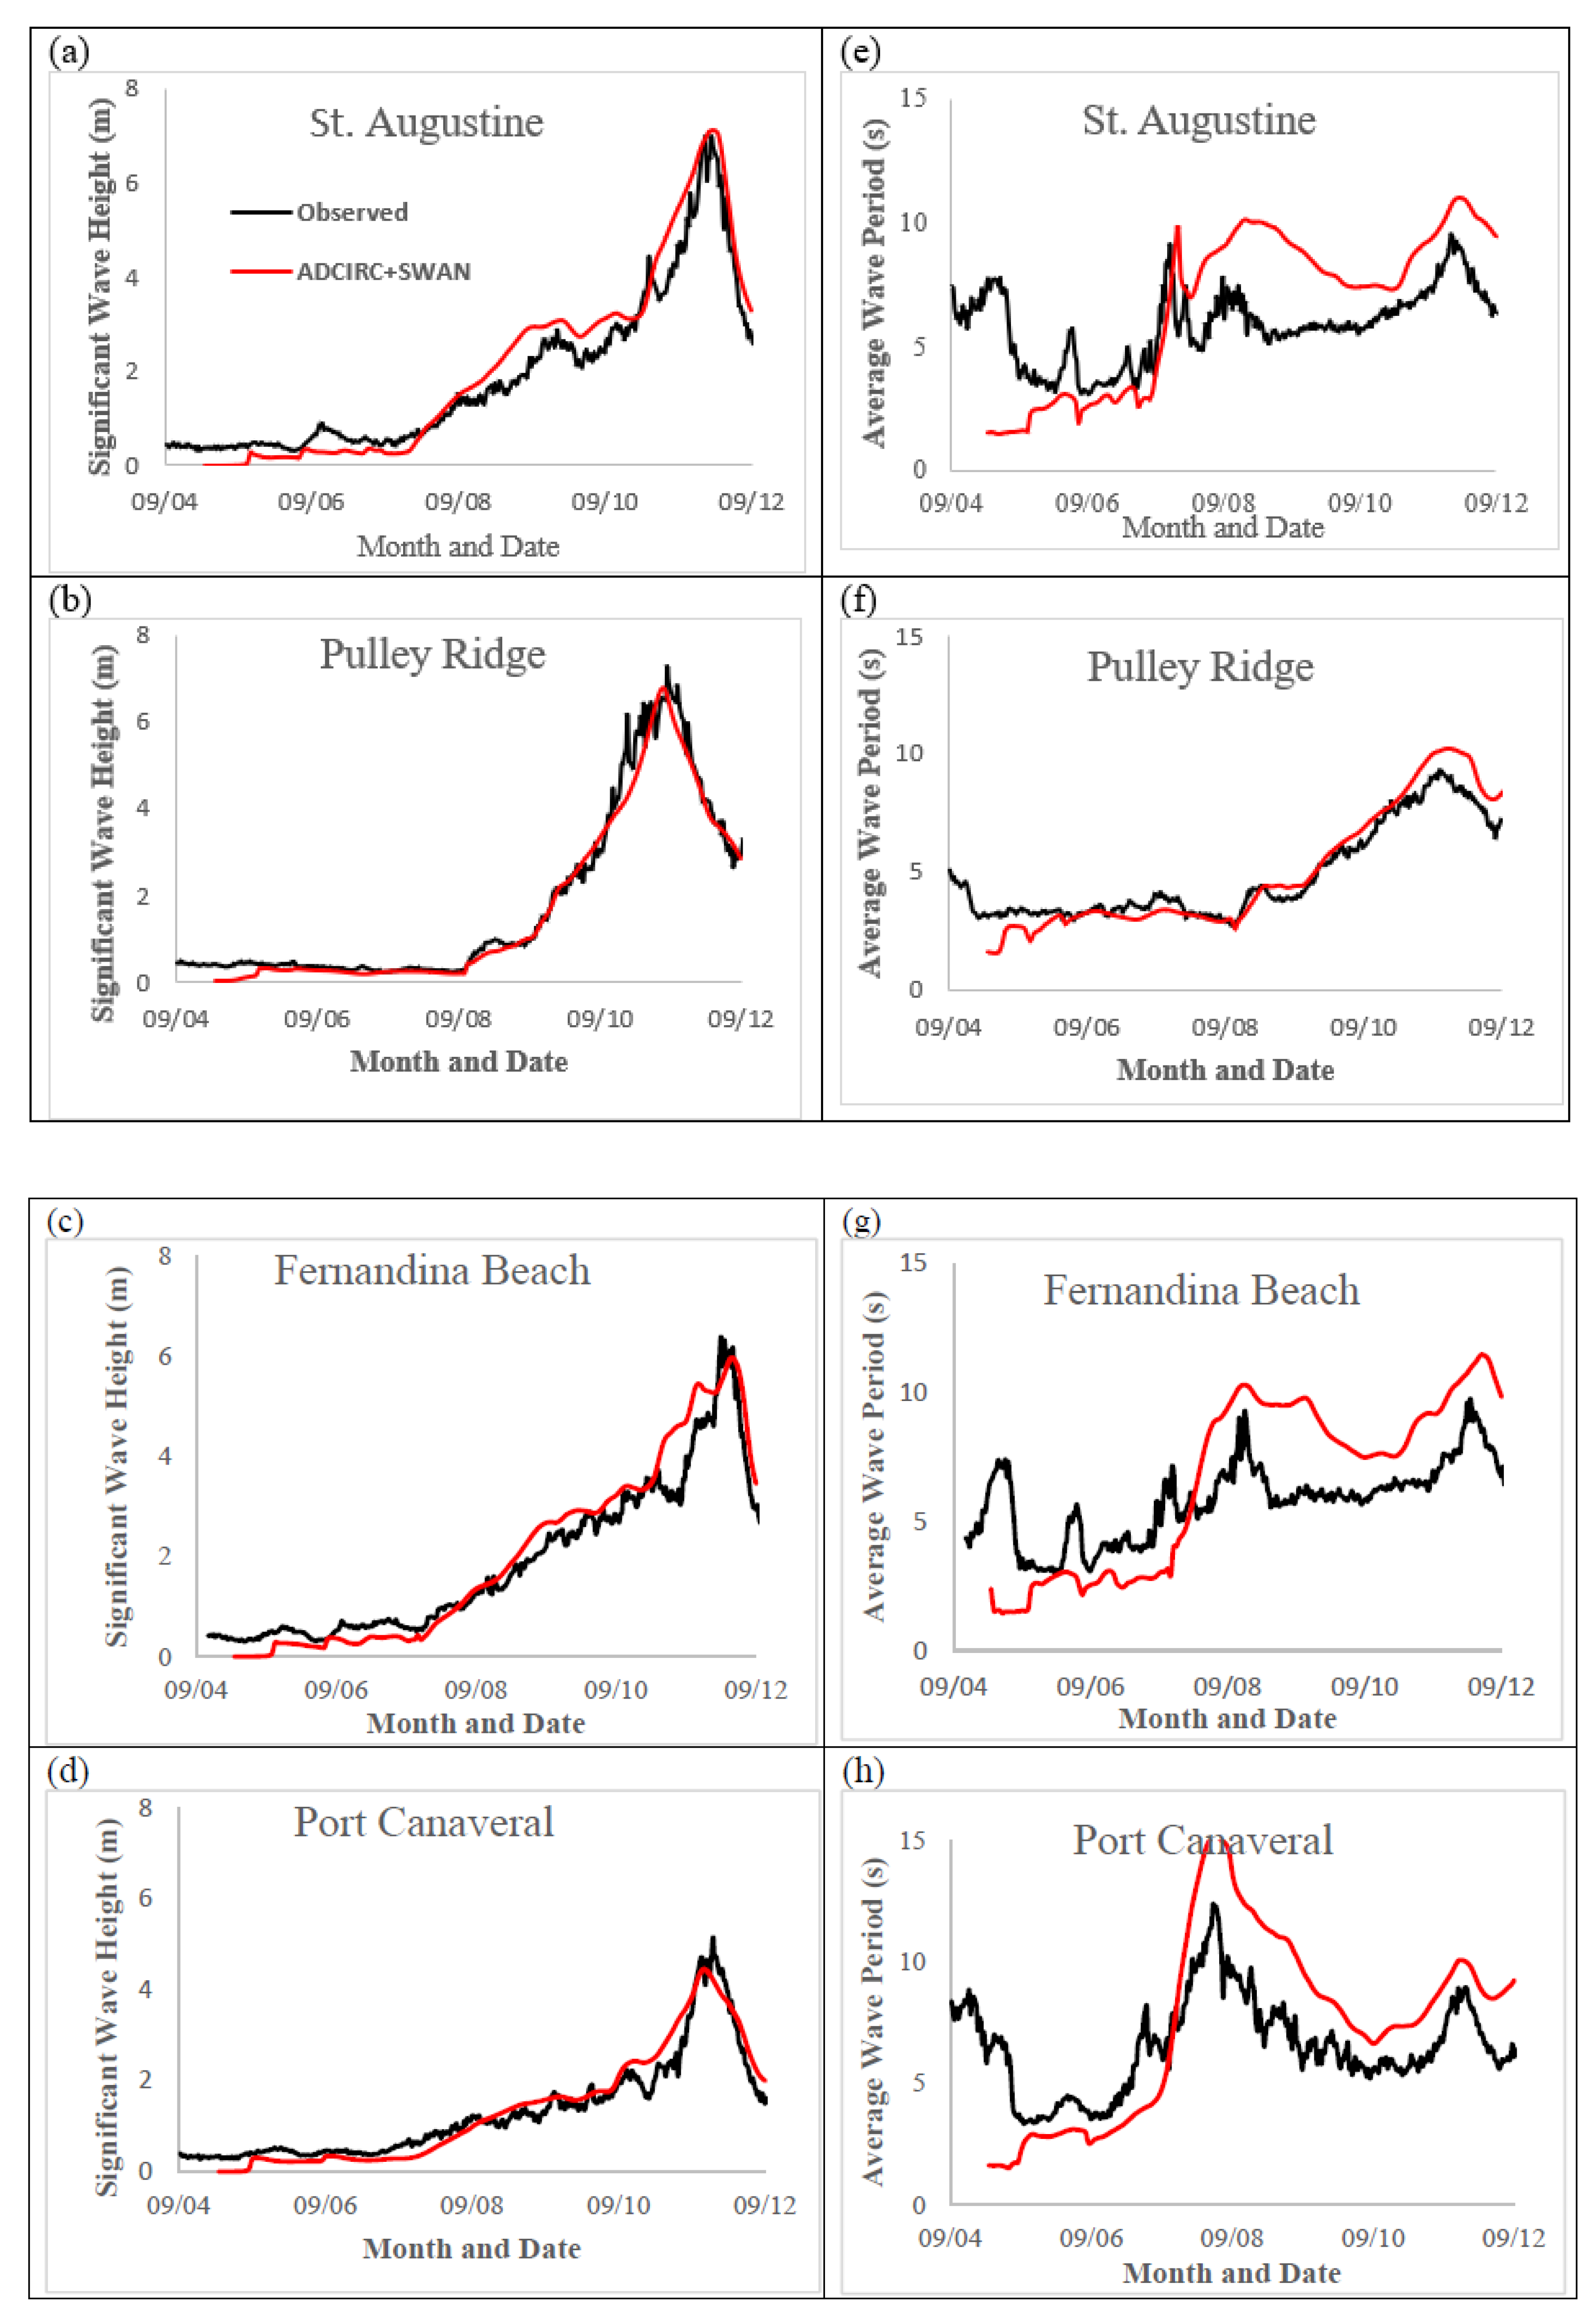
The simulated waves are compared with buoy data observed at four stations, as presented in Table 1. Figure 5 shows comparisons of the significant wave height (SWH) and average wave period (AWP). The results indicate that the ADCIRC+SWAN model is able to reasonably reproduce the wave growth. The time series for SWH agree with the observed data at all four buoy stations. The disagreement between the observed and modelled maximum SWH lies between 0 and 0.75 m. The deeper the buoy station is, the greater the maximum SWH is, indicating that significant wave heights are sensitive to local bathymetry. The highest maximum SWH, of more than 7.2 m, is observed at Pulley Ridge, which is a deep ocean station. Large SWHs are also observed at St. Augustine and Fernandina Beach stations along the Georgia and South Carolina coasts. The lowest SWHs are observed at Cape Canaveral station on the east coast of Florida.
The modelled average wave period has quite good agreement with the observed data, but shows some overprediction. The average wave periods are much smaller near the beginning of the simulation, and then become reasonably close to the observed data. However, near and after the storm peak, the model overpredicts the AWP by between 1 and 3 s. A possible reason for this is because the finite simulation length of the hurricane does not allow wave heights and periods to develop earlier in the simulation, before it reaches the station locations [7]. Interestingly, at the station deep in the Gulf of Mexico, the AWPs have a single peak that coincides with the SWH peak time. On the other hand, stations on the east coast of Florida, and those on the Georgia and South Carolina coasts, experience dual peaks—one around 8 September, well before the hurricane reached there, and another one coinciding with the SWH peak time.

4.4. High-Water Marks

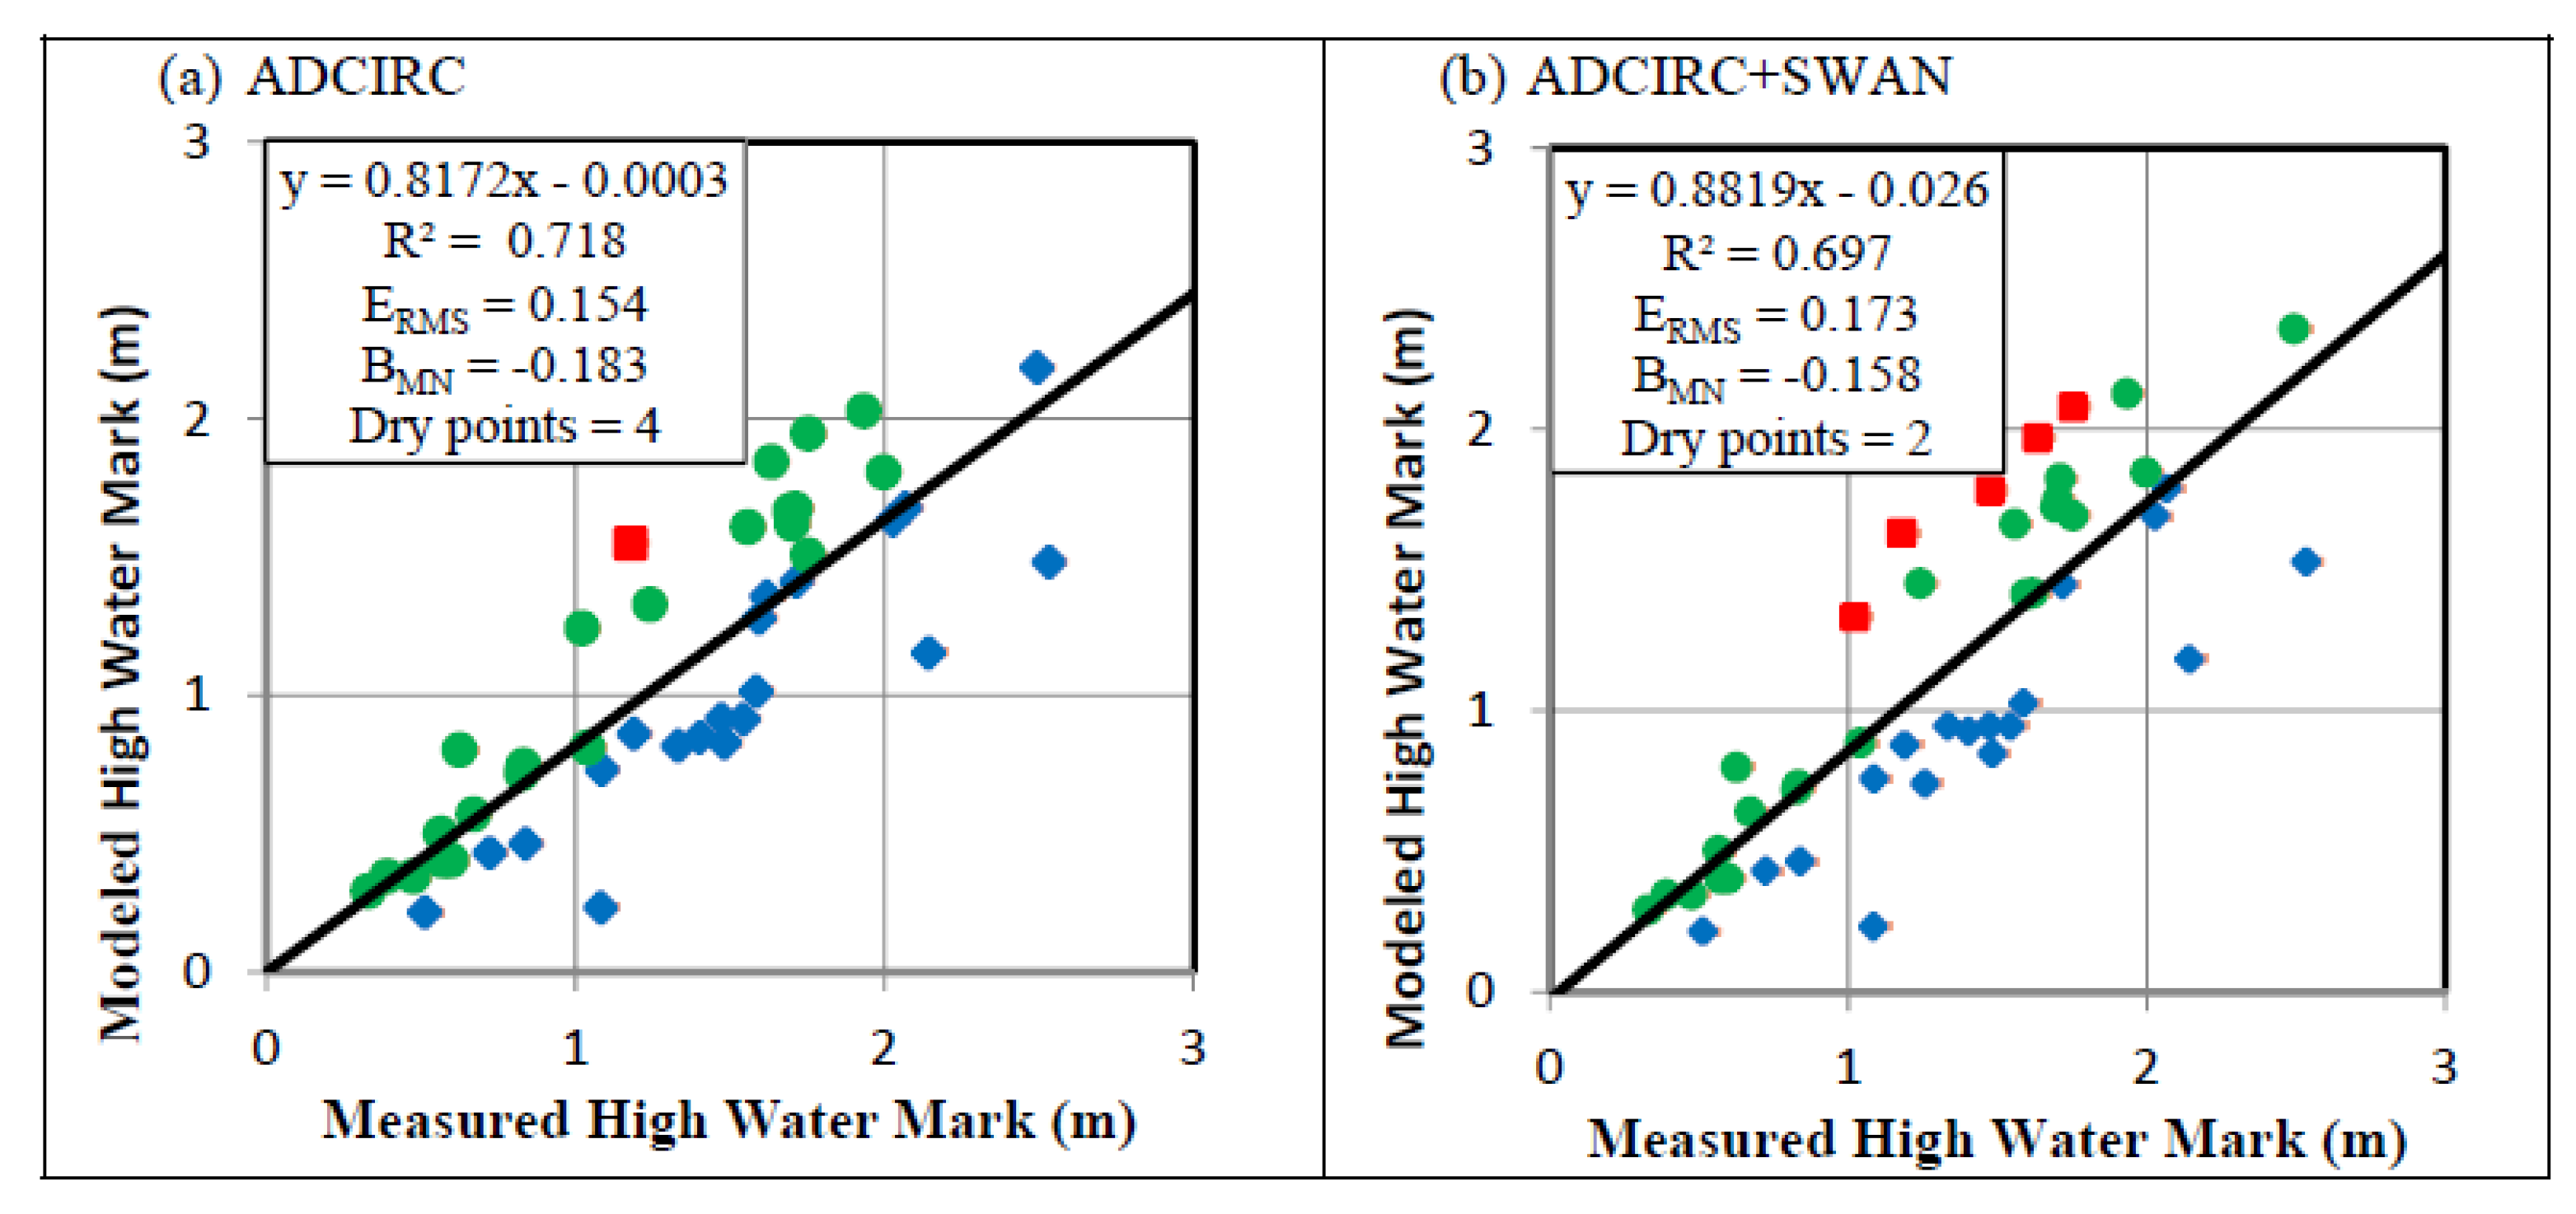
A total of 47 National Ocean Service-observed high-water marks (HWMs) are used to evaluate the performance of each modeled water level against the observed HWMs. Most of the high-valued HWM stations are on the east coast, and the low-valued HWM stations are on the southwest coast of Florida. Figure 6 shows scatter plots of the observed and predicted water levels by ADCIRC and ADCIRC+SWAN. Red points indicate overprediction by the model; blue points indicate underprediction; green points indicate a match within 0.5 m. The black line represents the best line of fit. All the models underpredict Hurricane Irma’s water level, with negative values of mean normalized bias (BMN) of −0.183 and −0.158 for ADCIRC and ADCIRC+SWAN, respectively. Overall, as indicated by the BMN values, ADCIRC+SWAN reduces the underprediction due to wave contributions. ADCIRC’s degree of determination ( R 2 ) value is 0.718, and it has a root mean square error (ERMS) of 0.154, while ADCIRC+SWAN’s degree of determination ( R 2 ) value is 0.694, and its root mean square error (ERMS) is 0.173. These values indicate that the HWM scatter is higher for ADCIRC+SWAN in comparison to that of ADCIRC. In terms of the wetting of HWM points, ADCIRC+SWAN only has 2 dry points, while ADCIRC has 4 dry points of the 47 points. Wave contributions in the ADCIRC+SWAN model slightly increase the water levels, thus wetting two additional points, mainly in marshy and forested areas in the southwest. Our findings are similar to those of Kerr et al. [10], who found that waves contributed to a slight increase (about 0.5 m) in the water levels of Hurricane Ike and Hurricane Rita in the marshes and back bays along the Gulf coast. Both scatter plots have near zero intercepts, but the ADCIRC+SWAN plot shows a slope closer to one—indicating slightly better parity with the observed data.

5. Conclusions

We present a numerical experimentation to evaluate the contribution of waves to the total water levels during Hurricane Irma, which impacted the Florida Peninsula in September 2017. The effect of waves is quantified by the subtracting water levels simulated by the ADCIRC model from the values simulated by ADCIRC+SWAN, a fully coupled model, using OWI meteorological forcing. Databases of water level time series, wave characteristic time series, and high-water marks are used to validate the model performance. In general, the simulation results matched well with the observed data. Due to wave contributions, ADCIRC+SWAN consistently predicted higher water elevation than ADCIRC, although the amount depends on the geographical location around the Florida Peninsula. Our study reveals that the continental shelf of Florida plays a critical role in sheltering the west coastal areas from large wave effects.
Waves increase the surge by 0.25 m on the south and northeast coasts. The large expanse of the North Atlantic Ocean plays an important role in increasing the magnitude of water elevation on the south and northeast coasts, due to the fetch length and wave runup. On the west coast, wave runup has no significant contribution to the water elevation, due to the limited fetch distance.
Significant wave heights become high as waves propagate into the inner gulf and Georgia Carolina coastal regions, indicating that depth plays a critical role in the magnitude of water elevation due to waves. The average wave period on the west coast peaked at the same time as SWH. On the east and northeast coasts, dual AWP peaks are observed.
In terms of a high-water mark comparison, ADCIRC+SWAN reduces underprediction, with a lower absolute value of BMN, in comparison to that of ADCIRC. ADCIRC+SWAN also has better parity with the observed data, and wets more points, due to the effect of waves that slightly increase the water levels, especially in marshy and forested areas in the southwest. However, ADCIRC+SWAN with a higher R 2 value and smaller root mean square error displays more HWM scatter than that of ADCIRC.

Author Contributions

A.M. performed ADCIRC+SWAN runs, post processed results, and original draft preparation; L.R. performed ADCIRC runs; M.K.A. provided critical reviews and editing. All authors have read and agreed to the published version of the manuscript.

Funding

This research was funded by National Science Foundation—Excellence in Research, grant number 2000283.

Institutional Review Board Statement

Not Applicable.

Informed Consent Statement

Not Applicable.

Data Availability Statement

Not Applicable.

Acknowledgments

Authors are grateful to the University of North Carolina’s Renaissance Computing Center for the access to their high-performance computing platform.

Conflicts of Interest

The authors declare sole responsibility for the research results.

References

  1. National Hurricane Center. Introduction to Storm Surge. Available online: https://www.nhc.noaa.gov/surge/surge_intro.pdf (accessed on 11 November 2021).
  2. Jelesnianski, C.P. SLOSH: Sea, Lake, and Overland Surges from Hurricanes; US Department of Commerce: Washington, DC, USA; National Oceanic and Atmospheric Administration: Silver Spring, MD, USA; National Weather Service: Silver Spring, MD, USA, 1992; Volume 48. [Google Scholar]
  3. Luettich, R.A.; Westerink, J.J.; Scheffner, N.W. ADCIRC: An Advanced Three-Dimensional Circulation Model for Shelves, Coasts and Estuaries; Report 1: Theory and Methodology of ADCIRC-2DDI and ADCIRC-3DL; Technical Report DRP-92-6; United States Department of the Army, United States Army Corps of Engineers (USACE): Washington, DC, USA, 1991.
  4. Longuet-Higgins, M.S.; Stewart, R.W. Radiation stresses in water waves; a physical discussion, with applications. In Deep Sea Research and Oceanographic Abstracts; Elsevier: Amsterdam, The Netherlands, 1964; Volume 11, pp. 529–562. [Google Scholar]
  5. New South Wales. Coastline Management Manual; New South Wales Government: Parramatta, NSW, Australia, 1990.
  6. Dean, R.G.; Dalrymple, R.A. Water Wave Mechanics for Engineers and Scientists; World Scientific Publishing Company: Singapore, 1991; Volume 2. [Google Scholar]
  7. Kennedy, A.B.; Westerink, J.J.; Smith, J.M.; Hope, M.E.; Hartman, M.; Taflanidis, A.; Tanaka, S.; Westerink, H.; Cheung, K.F.; Smith, T.; et al. Tropical cyclone inundation potential on the Hawaiian Islands of Oahu and Kauai. Ocean Model. 2012, 52, 54–68. [Google Scholar] [CrossRef]
  8. Joyce, B.R.; Gonzalez-Lopez, J.; Van Der Westhuysen, A.J.; Yang, D.; Pringle, W.J.; Westerink, J.J.; Cox, A.T. U.S. IOOS Coastal and Ocean Modeling Testbed: Hurricane-Induced Winds, Waves, and Surge for Deep Ocean, Reef-Fringed Islands in the Caribbean. J. Geophys. Res. Oceans. 2019, 124, 2876–2907. [Google Scholar] [CrossRef]
  9. Hope, M.E.; Westerink, J.J.; Kennedy, A.B.; Kerr, P.C.; Dietrich, J.C.; Dawson, C.; Bender, C.J.; Smith, J.M.; Jensen, R.E.; Zijlema, M.; et al. Hindcast and validation of Hurricane Ike (2008) waves, forerunner, and storm surge. J. Geophys. Res. Oceans 2013, 118, 4424–4460. [Google Scholar] [CrossRef] [Green Version]
  10. Kerr, P.C.; Martyr, R.C.; Donahue, A.; Hope, M.E.; Westerink, J.J.; Luettich, R.A., Jr.; Kennedy, A.; Dietrich, J.; Dawson, C.U.S. IOOS coastal and ocean modeling testbed: Evaluation of tide, wave, and hurricane surge response sensitivities to mesh resolution and friction in the Gulf of Mexico. J. Geophys. Res. Oceans. 2013, 118, 4633–4661. [Google Scholar] [CrossRef]
  11. Wiegel, R.L. Wind waves and swell. Coast. Eng. Proc. 1961, 7, 1. [Google Scholar] [CrossRef] [Green Version]
  12. Stevenson, T. The Design and Construction of Harbours: A Treatise on Maritime Engineering; A. and C. Black: London, UK, 1988. [Google Scholar]
  13. Fagherazzi, S.; Wiberg, P.L. Importance of wind conditions, fetch, and water levels on wave-generated shear stresses in shallow intertidal basins. J. Geophys. Res. Earth Surf. 2009, 114. [Google Scholar] [CrossRef] [Green Version]
  14. Bolaños, R.; Sánchez-Arcilla, A. A note on nearshore wave features: Implications for wave generation. Prog. Oceanogr. 2006, 70, 168–180. [Google Scholar] [CrossRef]
  15. Nick, T.; Place, T.N. LESSON 4: Coastal Ecosystems—Beach, Estuary, Marsh & Swamp. University of Florida. 2017. Available online: https://edis.ifas.ufl.edu/pdf%5C4H%5C4H35000.pdf (accessed on 30 November 2021).
  16. Feng, Z.; Reniers, A.; Haus, B.K.; Solo-Gabriele, H.M.; Kelly, E.A. Wave energy level and geographic setting correlate with Florida beach water quality. Mar. Pollut. Bull. 2016, 104, 54–60. [Google Scholar] [CrossRef] [PubMed] [Green Version]
  17. Westerink, J.J.; Luettich, R.A.; Blain, C.A.; Scheffner, N.W. Adcirc: An Advanced Three-Dimensional Circulation Model for Shelves, Coasts and Estuaries; Report 2: Users’ Manual for ADCIRC-2DDI; Department of the Army, USACE: Washington, DC, USA, 1992.
  18. Luettich, R.A., Jr.; Westerink, J.J. Implementation of the Wave Radiation Stress Gradient as a Forcing for the ADCIRC Hydrodynamic Model.: Upgrades and Documentation for ADCIRC Version 34.12; Contractors Report, Department of the Army, US Army Corps of Engineers, Waterways Experiment Station: Vicksburg, MS, USA, 1999; p. 9. [Google Scholar]
  19. Dietrich, J.C.; Zijlema, M.; Westerink, J.J.; Holthuijsen, L.H.; Dawson, C.; Luettich Jr, R.A.; Jensen, R.E.; Smith, J.M.; Stelling, G.S.; Stone, G.W. Modeling hurricane waves and storm surge using integrally-coupled, scalable computations. Coast. Eng. 2011, 58, 45–65. [Google Scholar] [CrossRef]
  20. Riverside Technology, Inc. AECOM. In Mesh Development, Tidal Validation, and Hindcast Skill Assessment of an ADCIRC Model for the Hurricane Storm Surge Operational Forecast System on the US Gulf-Atlantic Coast; Riverside Technology, Inc.: Fort Collins, CO, USA; AECOM: Dallas, TX, USA, 2015. [Google Scholar] [CrossRef]
  21. Thompson, E.F.; Cardone, V.J. Practical modeling of hurricane surface wind fields. J. Waterw. Port Coast. 1996, 122, 195–205. [Google Scholar] [CrossRef]
  22. Cox, A.T.; Greenwood, J.A.; Cardone, V.J.; Swail, V.R. An interactive objective kinematic analysis system. In Proceedings of the Fourth International Workshop on Wave Hindcasting and Forecasting, Banff, Alberta, 16–20 October 1995; pp. 109–118. [Google Scholar]
  23. Cardone, V.J.; Cox, A.T. Tropical cyclone wind field forcing for surge models: Critical issues and sensitivities. Nat. Hazards 2009, 51, 29–47. [Google Scholar] [CrossRef]
  24. Musinguzi, A.; Akbar, M.K.; Fleming, J.G.; Hargrove, S.K. Understanding Hurricane Storm Surge Generation and Propagation Using a Forecasting Model, Forecast Advisories and Best Track in a Wind Model, and Observed Data—Case Study Hurricane Rita. J. Mar. Sci. Eng. 2019, 7, 77. [Google Scholar] [CrossRef] [Green Version]
  25. Akbar, M.K.; Kanjanda, S.; Musinguzi, A. Effect of bottom friction, wind drag coefficient, and meteorological forcing in hindcast of Hurricane Rita storm surge using SWAN+ ADCIRC model. J. Mar. Sci. Eng. 2017, 5, 38. [Google Scholar] [CrossRef] [Green Version]
  26. Kolar, R.L.; Gray, W.G.; Westerink, J.J.; Luettich, R.A. Shallow water modeling in spherical coordinates: Equation formulation, numerical implementation, and application. J. Hydraul. Res. 1994, 32, 3–24. [Google Scholar] [CrossRef]
  27. SWAN—Scientific and Technical Documentation Version 40.91AB. Delft University of Technology, Environmental Fluid Mechanics Section. Available online: http://www.swan.tudelft.nl (accessed on 20 November 2021).
  28. National Oceanic and Atmospheric Administration. Tides and Currents. Available online: https://tidesandcurrents.noaa.gov/ (accessed on 2 December 2021).
  29. National Oceanic and Atmospheric Administration. National Data Buoy Center. Available online: https://www.ndbc.noaa.gov/ (accessed on 2 December 2021).
  30. Cangialosi, J.P.; Latto, A.S.; Berg, R. National Hurricane Center Tropical Cyclone Report: Hurricane Irma; Report no. AL112017; National Oceanic and Atmospheric Administration and National Hurricane Center: Miami, FL, USA, 2018.
Figure 1. Model domain: (a) unstructured mesh, and the area of study marked with a red box; (b) locations of tidal gauges and wave buoys, and the track of Hurricane Irma within the area of study.
Atmosphere 13 00404 g001
Figure 2. Contour plots of Hurricane Irma’s maximum water surface elevation in meters. (a) ADCIRC; (b) ADCIRC+SWAN; (c) (ADCIRC+SWAN)-ADCIRC.
Atmosphere 13 00404 g002
Figure 3. Snapshots of wave fields for Hurricane Irma at select times with respect to landfall. Significant wave height (m) (Column 1); average wave period (s) (Column 2).
Atmosphere 13 00404 g003
Figure 4. Observed and modeled water elevation time series (2017) for Hurricane Irma at selected stations using ACIRC and ADCIRC+SWAN: (a) Mayport, (b) Lake Worth Pier, (c)Virginia Key, (d) Key West, (e) Vaca Key, (f) Naples, (g) Fort Myers, and (h) Port Manatee.
Atmosphere 13 00404 g004
Figure 5. Observed and modeled significant wave height (m) (left column), and average wave period (s) (right column) time series (2017) for Hurricane Irma at selected stations using ADCIRC+SWAN: (a,e) St. Augustine, (b,f) Pulley Ridge, (c,g)Fernandina Beach, and (d,h) Port Canaveral.
Atmosphere 13 00404 g005
Figure 6. Comparison between the modelled and measured HWMs at the various USGS locations. (a) ADCIRC; (b) ADCIRC+SWAN. Red points indicate overprediction by the model; blue points indicate underprediction; green points indicate a match within 0.5 m. The black line represents the best line of fit.
Atmosphere 13 00404 g006
Table 1. Geo-locations and bathymetry of tidal gauges and wave buoys used in the study.
Tidal GaugesWave Buoys
NameLonLatBathymetry (m)NameLonLatBathymetry (m)
Mayport−81.43030.397−8.313St. Augustine−81.08030.000−22.093
Lake Worth Pier−80.03326.612−6.437Fernandina Beach−81.29230.709−15.216
Virginia Key−80.16225.731−3.686Pulley Ridge−83.65025.701−82.006
Key West−81.80824.556−1.388Cape Canaveral −80.53328.400−11.018
Vaca Key−81.11324.712−1.512
Naples−81.80826.132−0.323
Fort Myers−81.87326.648−2.067
Port Manatee−82.56327.6380.235
Publisher’s Note: MDPI stays neutral with regard to jurisdictional claims in published maps and institutional affiliations.