Article

Sources and Seasonal Variance of Ambient Volatile Organic Compounds in the Typical Industrial City of Changzhi, Northern China

1
Key Laboratory of Resources and Environmental Systems Optimization, Ministry of Education, College of Environmental Science and Engineering, North China Electric Power University, Beijing 102206, China
2
Institute of Transport Energy and Environment, Beijing Jiaotong University, Beijing 100091, China
3
College of Environmental Science and Engineering, North China Electric Power University, Baoding 071003, China
*
Author to whom correspondence should be addressed.
Atmosphere 2022, 13(3), 393; https://doi.org/10.3390/atmos13030393
Submission received: 14 February 2022 / Revised: 18 February 2022 / Accepted: 22 February 2022 / Published: 27 February 2022
(This article belongs to the Section Air Quality and Human Health)

Abstract

:
Volatile organic compounds (VOCs) emitted from industrial processes, which are major emission sources of air pollutants, could cause significant impacts on air quality. However, studies on the comprehensive analysis from sources contributing to the health risk perspective regarding ambient VOCs in industrial cities are limited. In this study, VOC samples were collected from 15 April 2018 to 19 October 2018 in Changzhi, a typical industrial city in northern China, and a total of 57 VOCs were measured for analysis. The average VOC concentrations were 54.4 µg·m−3, with the highest concentrations in autumn (58.4 µg·m−3). Ambient VOCs in spring, summer and autumn were all dominated by alkanes (66.8%), with contributions of 70.3%, 66.3% and 63.8%, respectively. The top five concentrations of total VOCs were isopentane (19.0%), ethane (9.5%), n-butane (8.1%), benzene (7.9%) and propane (5.2%), indicating that vehicle exhaust and coal combustion are the main sources of VOCs. Source apportionment by principal component analysis showed that vehicle exhaust (27.5%) and coal combustion (23.5%) were the main sources of VOCs in Changzhi, followed by industrial production (17.4%), solvent evaporation (13.5%), liquefied petroleum gas/natural gas leaking (9.5%), and biogenic emissions (8.7%). Sources of coal combustion and vehicle exhaust contributed more VOCs than industrial production. The carcinogenic risks of benzene (3.4 × 10⁻⁵) and ethylbenzene (2.2 × 10⁻⁶) were higher than the limit levels (1 × 10⁻⁶). Coal combustion contributed most (25.3%) to the carcinogenic risks because of its high VOC emissions. In an industrial city such as Changzhi, vehicle exhaust and coal combustion have become major sources of ambient air VOCs owing to the increasingly stringent industrial standards. Therefore, VOCs from vehicle exhaust and coal combustion also need to take into account mitigation measures for VOCs from the perspective of source contribution to health risk.

1. Introduction

The concentration of particulate matter (PM) in China has been significantly reduced in recent years owing to the implementation of strict clean air policies. For example, PM2.5 and PM10 concentrations decreased by 30–33% between 2015 and 2019 in the Beijing-Tianjin-Hebei region, and by 7–13% in the Pearl River Delta [1,2]. Conversely, ozone air pollution has continued to rise, and ozone has become a priority pollutant in many Chinese cities during the summer [3,4]. Ozone pollution is addressed in the ambient air quality standards issued by the Chinese Ministry of Environmental Protection in 2016, and it is the only air pollutant whose concentration has increased over the past few years [5,6,7,8,9,10]. High ozone concentrations deteriorate air quality and cause a range of human health and ecosystem problems [11,12]. Volatile organic compounds (VOCs) are important precursors to ozone production in the near-surface atmosphere, and high concentrations of VOCs often lead to high ozone concentrations. In addition, VOCs also pose both short- and long-term negative impacts to human health [13,14,15]. Recent studies have shown that increased O3 concentrations also lead to reduced carbon uptake by plants [16]. Therefore, the identification and quantification of potential VOC sources can provide a basis for decision makers to develop control strategies to mitigate VOC emissions and O3 pollution.
Atmospheric VOCs can be emitted from natural and anthropogenic sources. Plants are the main natural sources of VOCs, including isoprene, monoterpenes, sesquiterpenes, etc. [17]. Studies have shown that 34.27 (±2.06) Tg of VOCs are emitted annually from plant sources in China, including 15.94 (±1.12) Tg of isoprene [18]. Studies for Athens and Patras have shown that VOCs are mainly caused by biogenic and traffic emissions in summer while biomass burning is predominant in winter [19]. Studies in the city of Barykessy, Turkey showed that in a drinking water treatment plant, industrial solvent emissions from pesticide and insecticide applications in agriculture and emissions from traffic were the main sources of VOCs in the atmosphere [20]. Anthropogenic sources primarily include vehicle exhaust, solvent evaporation, industrial production, coal combustion, and liquefied petroleum gas/natural gas (LPG/NG) leaking [21]. The characteristics and sources of VOCs differ according to energy, economy, and industrial structure of a region. In Shanghai, vehicle exhaust is the main source of VOCs, accounting for 34% of ambient VOCs [22]. However, in Nanjing, fossil fuel/biomass/biofuel combustion accounted for 28% of the total VOC concentrations [23]. In rural eastern China, 71% of total VOC emissions are attributed to a combination of vehicle exhaust and biofuel combustion [24]. However, industrial production is also an important source of environmental VOCs, and the high concentration and intensity of emissions from industrial zones can significantly affect surrounding areas [25]. The study of Chang et al. on source identification of environmental VOCs by principal component analysis showed that PU coating, chemical packaging, and lithographic printing industries were the main sources of VOC emissions in industrial parks in Taiwan [26]. Previous studies have also investigated the influence of industrial production on ambient VOCs in industrial cities. For example, studies in Bursa, one of the most industrialized cities in Turkey, have shown that vehicle exhaust (gasoline and diesel engine vehicles) and industrial emissions are the main sources of VOCs [27]. VOC emissions from industrial production have been widely studied in China, and several policies and technological innovations have been developed to address this issue in industries, including coking, chemical, steel, and solvent industries [28,29]. However, these studies mostly focus on industrial parks, so that there is limited information regarding the VOC emissions in industrial cities in China.
Changzhi is a typical industrial city in China, with recent rapid economic and population growth. From 2014 to 2018, the total industrial output value of Changzhi increased from RMB 77.6 billion to RMB 89.2 billion, and the total industrial output accounted for more than 50% of the gross product of Changzhi (http://www.changzhi.gov.cn/gzsj/tjgb/) (accessed on 15 July 2019). Steel, electricity, coal, and coking industries are the main industries in Changzhi. In addition, the number of vehicles in the city increased from 386,000 to 528,000 from 2014 to 2018. With the increasing industrial development and number of vehicles in Changzhi, ozone concentration reached 218 µg·m−3 in the summer of 2018, exceeding the national air quality limit (160 µg·m−3), and it has become a serious problem in Changzhi during the summers. Nevertheless, recent studies on the air pollution in Changzhi have mainly focused on PM and heavy metal pollution, with limited information on VOCs [30,31].
In this study, the concentrations of 57 VOCs were measured at an urban site in Changzhi from 15 April 2018 to 19 October 2018 (summer to autumn). The dominant emission sources were identified by principal component analysis-multiple linear regression (PCA-MLR). The ozone formation potential (OFP) of VOC species was investigated based on the maximum incremental reactivity (MIR) method. We also conducted a health risk assessment for the investigated VOCs in Changzhi. The results provide important insights to clarify the source apportionment of VOCs in industrial cities, thereby providing a background for governments to develop more efficient strategies for the control and mitigation of VOC emissions and ozone pollution in Changzhi.

2. Materials and Methods

2.1. Site Description and Sample Collection

The sampling site was the rooftop of the Changzhi Environmental Monitoring Station (113.12 °N, 36.19 °E), which was 20 m aboveground, with adjacent buildings of almost the same height. The sampling port was set at a height of 1.5–2 m from the roof. The building is located in the center of Changzhi, which is a region with a representative dense population. Air samples were collected using Summa canisters (3 L, Entech, Simi Valley, CA, USA) in stainless steel with a Silonite surface coating on the inside of the canisters. The gas flow rate was controlled via a flow valve (8 h/L, Entech, Simi Valley, CA, USA) by the passive sampling method, which was directly docked to the upper end of the summa canister to obtain a 24 h average air sample. The samples were collected in the spring (April to May), summer (June to August), and autumn (September to October) of 2018 with the interval of 5 or 6 days, which effectively characterized the VOCs in the air during different seasons. Finally, a total of 32 valid samples were collected during the sampling period. The concentrations of NO2 and O3 during the sampling period were obtained from China City Air Quality Real-time Release Platform (http://106.37.208.233:20035/) (accessed on 30 October 2018). Meteorological parameters (temperature, relative humidity, wind speed, wind direction, and atmosphere pressure) were obtained from automatic weather stations at the same site of VOC sampling.

2.2. Sampling and Analysis

All VOC samples were analyzed in a laboratory in Beijing using a three-stage preconcentration system (7200 concentrator, Entech, Entech, Simi Valley, CA, USA), followed by gas chromatography (GC) analysis (Agilent, 7890B, Santa Clara, CA, USA). In this analytical setup, dual columns were configured and coupled to a mass spectrometer (MS) (Agilent, 5977B, Santa Clara, CA, USA) for the analysis of C4–C12 compounds and to a flame ionization detector (FID) for C2–C3 compounds, including ethane, ethylene, acetylene, propylene, and propane. The FID was used to quantify C2–C3 compounds on a HP-PLOT/Q column (30 m × 0.53 mm × 40 μm, Agilent, Santa Clara, CA, USA). To trap VOCs, 400 mL of air was drawn from each Summa canister through a liquid nitrogen cryogenic trap at −40 °C. The trapped VOCs were then transferred to a secondary trap at −70 °C using pure helium and Tenax-TA (sorbent). Finally, the VOCs were transferred to a tertiary trap at −190 °C. In the above steps, most CO2, O2, H2O, and N2 were removed. Subsequently, the sample was desorbed at >60 °C and injected into the GC equipment with high purity helium (99.99%) as the carrier gas. The MS was used to quantify VOCs with a C4–C12 carbon backbone on a DB-1 column (60 m × 0.25 mm × 0.25 μm, Agilent, Santa Clara, CA, USA). A multi-ramp temperature program was used as follows: 35 °C (10 min), 5 °C min−1 to 150 °C (5 min hold), and 10 °C min−1 to 210 °C (5 min hold). The total running time was 49 min. The FID was maintained at 250 °C and supplied with high purity hydrogen and compressed air. The MS ionization source temperature was 250 °C, and the scan rate was 4.2 scans per second. The analytical system was calibrated using prepared standards and comprising a minimum of five concentrations and a blank. The system stability was verified before each use. Internal standards (benzene-d6, 2-bromo-1,1,1-trifluoroethane and chlorobenzene-d5) were added to the sample stream prior to the trap.
Quality control was achieved by calibrating the instruments before acquiring and analyzing samples throughout the study period so as to ensure the authenticity and accuracy of the experimental data. The instrument blank was analyzed every 24 h, and its results should be lower than the laboratory detection limit. The C2–C5 hydrocarbons and other VOCs were quantified using external and internal standard methods, respectively. The standard gas was measured once a day before the sample was analyzed, and the relative standard deviation (RSD) for each substance response factor was less than 30%. If the RSD was greater than 30%, the standard curve was recreated.

2.3. Air Back Trajectories

HYSPLIT was used to calculate the source and long-range transport paths of VOCs during the study period at the Changzhi Environmental Monitoring Station (113.12 °N, 36.19 °E) with an altitude setting of 500 m and a trajectory duration of 24 h. Trajectory clustering was performed using TrajStat to obtain the major air mass source paths. The detailed calculation method is described in the related article [30].

2.4. Principal Component Analysis-Multiple Linear Regression

Principal component analysis-multiple linear regression (PCA-MLR) using the “dimensionality reduction” method, transforms the original variables into a smaller number of new variables (principal components) that are orthogonal to each other and reflect the information provided by the original data to the greatest extent possible. Feng’s study compared the FA-NNC, PCA-MLR, and PMF methods in the source apportionment results and showed that PCA-MLR performed best in calculating contributions [32]. PCA can be used for studies with small sample sizes, and Choi’s study showed that more than 25 samples were needed to produce stable PCA results [33].
The purpose of the multiple linear regression is to determine the contribution of different pollution sources based on the source identification. The equation is:
y = 1 p m i X i + b
In this study, y denotes ΣVOCs, p denotes the number of extracted principal components. Xi denotes the factor score variables obtained from the principal component analysis. b denotes the information of the remaining variables not explained by the factors. The independent and dependent variables were standardized, and the standardized equations were regressed for analysis.
Z = 1 p B i X i
Bi is the coefficient of the requested multiple linear regression, so the source contribution was calculated as follows:
C o n t r i b u t i o n   r a t e   F i = ( B i /   B i ) × 100 %

2.5. Analysis of Ozone Formation Potential

The level of VOC reactivity and sources are key factors for policy makers to consider when aiming to control local ozone contamination. There are different methods used to estimate O3 formation from VOCs. Among them, the simple calculation of ozone formation potentials (OFPs) with maximum incremental reactivity (MIR) values of different VOC species has been widely applied in other studies [34,35]. It is calculated by Equation (4),
O F P ( i ) = C o n c ( i ) × M I R   ( i )
where OFP(i) and Conc(i) are the molar mass of O3 and individual VOC species, respectively, and MIR(i) is the maximum incremental reactivity coefficient of this VOC species.

2.6. Health Risk Estimation

To identify and estimate the health risk of specific VOCs to human health, we used the Integrated Risk Information System (IRIS) by the USEPA. The inhalation risks of non-carcinogenic and carcinogenic VOCs were assessed using Equation (5):
E C = C A × E T × E F × E D A T
where EC (µg·m−3) is the concentration of inhalation exposure, CA is the average pollutant concentration (µg·m−3), ET is the exposure time (24 h/d), EF is the exposure frequency (365 d/y), ED is the exposure duration (70 y), and AT is the average exposure time (70 × 365 × 24 h).
The carcinogenic (R) and non-carcinogenic risks (HQ) of all risk-posing VOC species were estimated using the following equations: R = EC × IUR, where R is the estimated inhalation cancer risk, and IUR (m3/µg) is the inhalation unit risk, and data were obtained from USEPA’s IRIS; and HQ = EC / ( RfC × 1000 ) , where HQ is the non-cancer risk hazard quotient (HQ) of specific VOCs, and RfC (mg·m−3) is the chronic reference concentration (mg·m−3). Cancer risks lower than 1 × 10⁻⁶ were regarded as acceptable. In addition, we used HI = ∑HQ for the analysis, where HI is the sum of the HQ of several pollutants. If HQ or HI were below 1, there was no chronic toxicity, but if HQ exceeded 1, chronic toxicity after long-term exposure was expected.

3. Results and Discussion

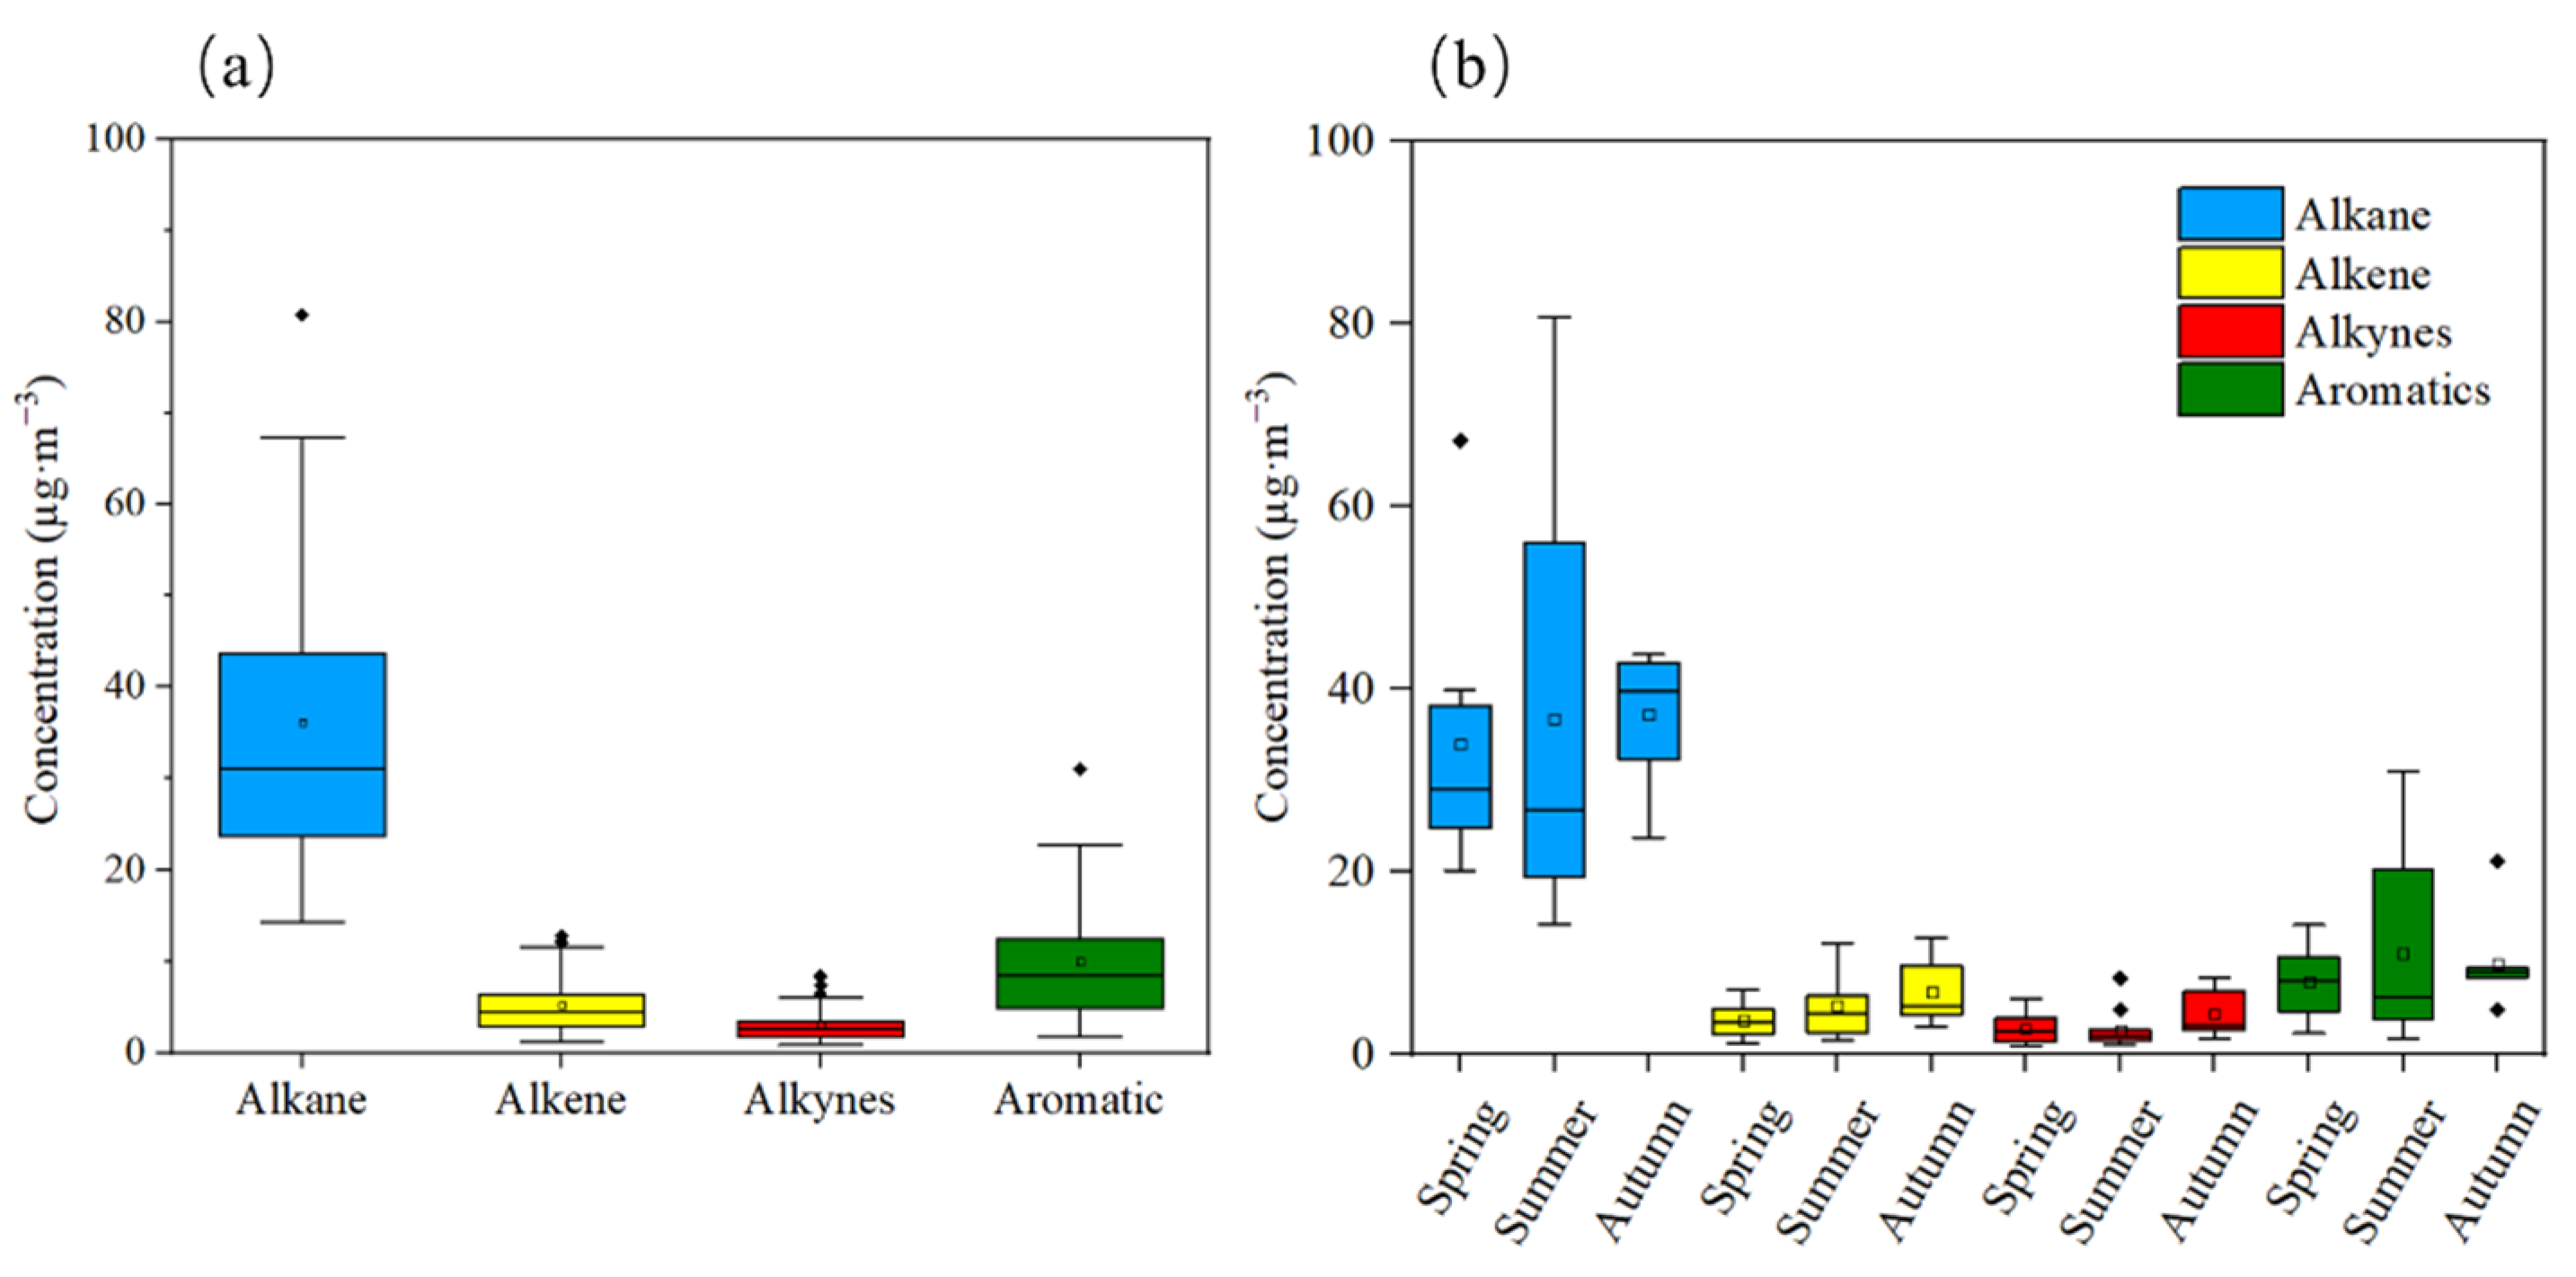
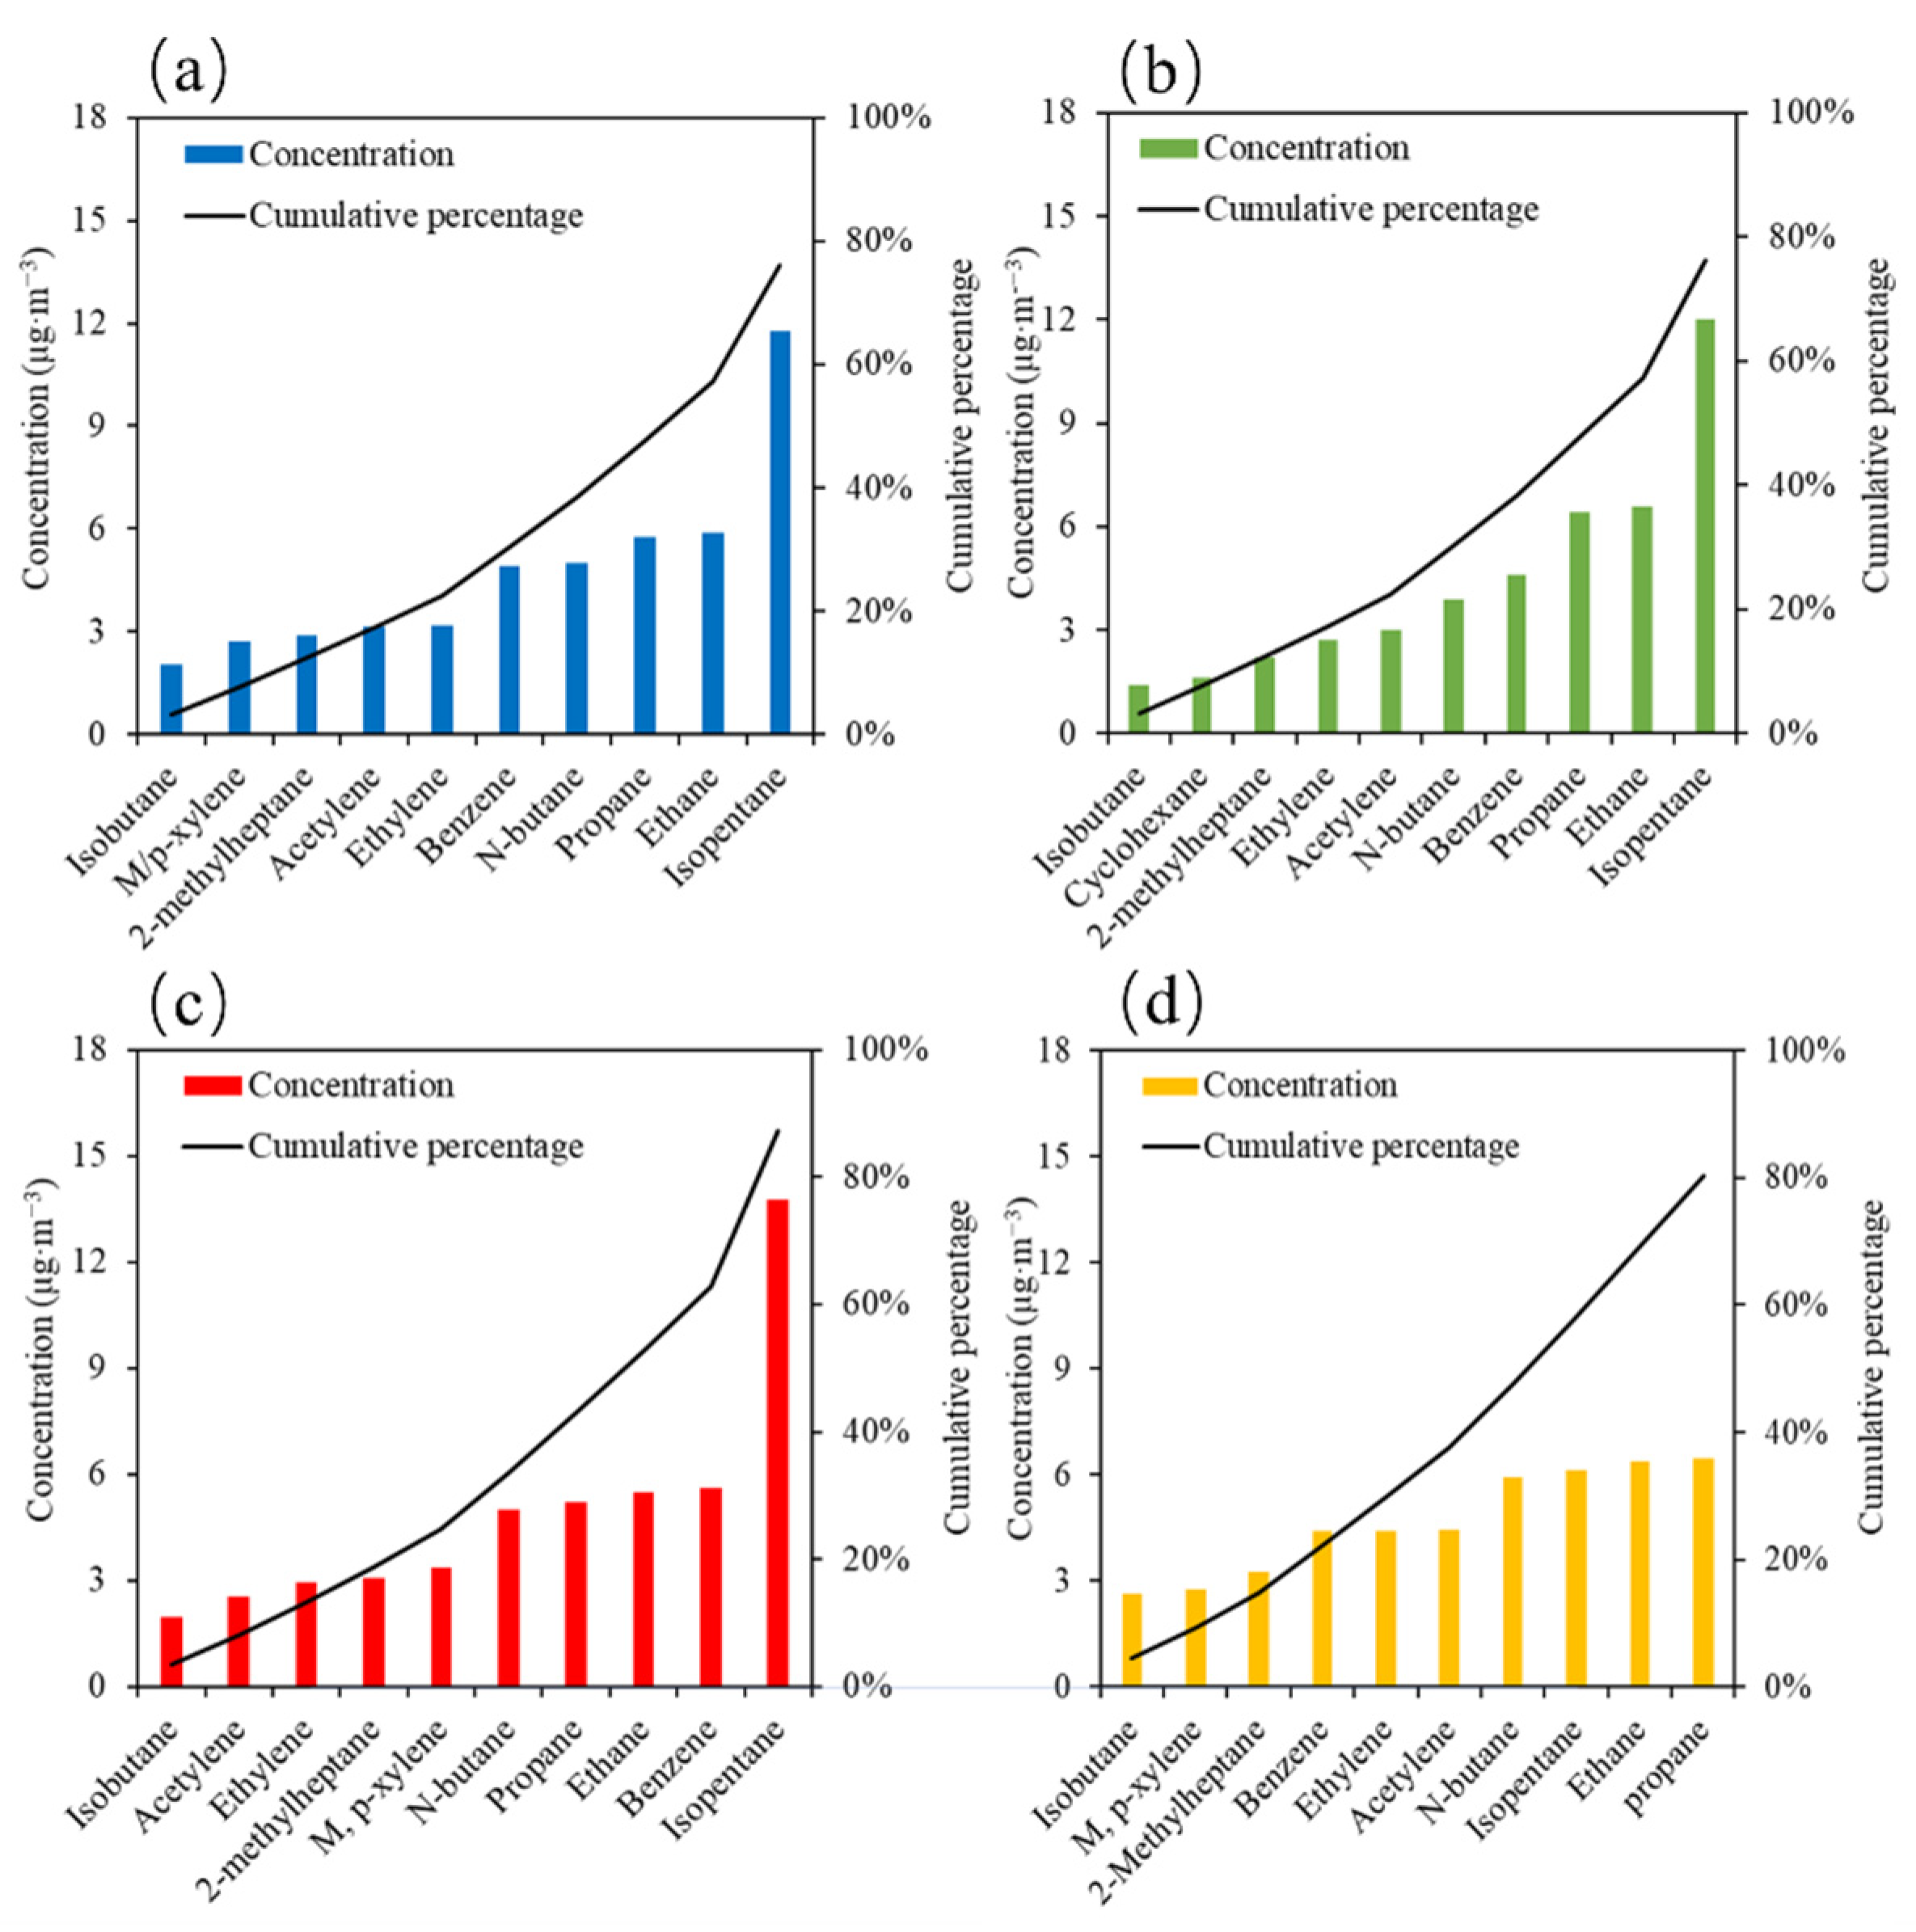
3.1. Situation of Sampling Point Data

The mean wind speed, temperature, and relative humidity during the study period were 3.1 m·s−1, 19.5 °C, and 64.9%. The average and standard deviation of total VOC mass concentration was 54.4 ± 20.4 µg·m−3, ranging from 21.3 to 112.0 µg·m−3. The VOC concentrations in Changzhi were lower than those in other main cities of China such as Beijing (98.1 µg·m−3) [36] and Jinan (53.1 µg·m−3) [37]. Despite the many industrial enterprises in Changzhi, the city and its population are small.
Meteorological factors and variations in the intensity of VOC emissions caused temporal variations in the VOC concentration in Changzhi. The concentration of total VOCs was 25.7–82.0 µg·m−3 (mean of 48.3 µg·m−3) in the spring, 21.3–112.0 µg·m−3 (mean 55.4 µg·m−3, median 52.5 µg·m−3) in the summer, and 40.5–70.2 µg·m−3 (mean 58.4 µg·m−3, median 62.6 µg·m−3) in autumn (Figure 1). The temperature in Changzhi was higher in the summer (23.1 °C) than in the spring (17.4 °C) and autumn (14.7 °C). Similarly, the humidity was higher in the summer (70%) than in the spring (58%) and autumn (61%). VOC concentrations in autumn were higher than those in the spring and summer, a feature consistent in cities such as Beijing, Nanjing, Wuhan, and Hohhot [12,38,39]. Compared to the spring, the higher temperatures in the summer increased the VOC emissions from sources such as solvent evaporation. In addition, the high temperatures, low relative humidity, and strong solar radiation in the summer are conducive to atmospheric oxidation reactions, which can accelerate the depletion of VOCs. The low wind speeds (3.0 m s−1) and low temperatures in autumn reduced the rate of atmospheric photochemical reactions, which can lead to the accumulation of VOCs in the atmosphere and the decrease of O3 concentrations. The O3 concentration was higher in the summer (218 µg·m−3) than in the autumn (154 µg·m−3). However, the mean NO2 concentration, which is also a precursor of O3, was lower in the summer (16 µg·m−3) than in the autumn (30 µg·m−3). In addition, the photochemical reaction rate decreased at lower temperatures and light intensities under stronger north-westerly wind conditions in the autumn, which decreased the consumption of NO2 and VOCs, thereby increasing their concentrations in the air.
Alkanes were the main components (66.8%) of VOCs in Changzhi, followed by aromatic compounds (16.4%), alkenes (10.2%), and alkynes (6.6%). Higher alkane concentrations have also been observed in Beijing (58%) and Tianjin (63%) [40,41]. The proportion of different components of atmospheric VOCs in Changzhi presented clear seasonal changes, with higher levels of alkanes in the spring (70.3%) than in the summer (66.3%) and autumn (63.8%). The high proportion of alkanes in the spring was consistent with results obtained for other Chinese cities [12,42]. The contribution of aromatic compounds was higher in the summer (19.5%), followed by autumn (16.9%) and spring (15.6%). The high concentration of aromatics in the summer was also similar to results obtained for Shanghai and Tianjin [8,43]. The intensity of emissions from solvent evaporation and the chemical industry, which are the main sources of aromatics, increased in the summer because of the higher temperatures.
As shown in Figure 2, alkanes in the top 10 VOCs with the highest concentrations accounted for 53.7% of the total VOCs, and included isopentane (19.0%), ethane (9.5%), propane (5.2%), n-butane (8.1%), 2-methylheptane (4.6%), and isobutane (3.3%). Alkanes were followed by aromatics (12.2%), including benzene (7.9%) and m/p-xylene (4.3%), alkenes (5.2%, ethylene), and alkynes (3.3%, acetylene). Isopentane concentrations (11.8 µg·m−3) were high throughout the seasons, with the highest concentrations in the summer (20.8 µg·m−3), followed by spring (12.0 µg·m−3) and autumn (6.1 µg·m−3). As isopentane is a VOC commonly emitted by gasoline volatilization, its high concentrations were attributed to the extensive emissions from gasoline vehicles [4]. Ethane (5.9 µg·m−3) was the second most emitted VOC, and its concentration was lower in the summer (5.5 µg·m−3) than in the spring (6.6 µg·m−3) and autumn (6.4 µg·m−3). Ethane is a typical VOC emitted from coal combustion [44], and its relatively low concentration in the summer was attributed to the lower contribution of coal combustion to ambient VOCs in the summer. The concentrations of aromatic compounds such as benzene and m-xylene, which were the more reactive VOCs, were higher in the summer (5.6 and 3.3 µg·m−3, respectively) than in the spring (4.6 and 1.3 µg·m−3, respectively) and autumn (4.4 and 2.8 µg·m3, respectively). This higher concentration of aromatics in the summer inevitably produced more ozone, which increased ozone concentrations. Propane and n-butane were also within the top 10 VOCs identified in Changzhi, with average concentrations of 5.8 and 5.0 µg·m−3, respectively. They are typical VOCs emitted by LPG leaks [45], which is a major source of VOCs in Changzhi.

3.2. Source Apportionment and Profile

3.2.1. Ratio of Specific Compounds

The ratios between VOC species have been widely used to identify VOC sources and associated chemical reactions [40,45,46]. When two species with low reactivity or similar OH reaction constants (kOH) are emitted from the same source, their ratios should not change significantly by photochemical degradation. However, if they share a common source but have different chemical reactivity, their ratios are expected to change upon chemical reactions [47].
The VOC ratios of ethylbenzene to m-xylene (E/X) and benzene to m-xylene (B/X) are widely used to analyze ambient air aging because of their different photochemical reactivity [21,48]. The E/X and B/X ratios vary with the photochemical reaction of the air mass. When E/X is higher than 0.33 or B/X is higher than 1.7, the given region is more likely to be controlled by aging air masses [49]. The results in Table 1 show an E/X of 0.6 and a B/X of 2.8 for Changzhi, which indicate that atmospheric VOCs were probably controlled by aging air masses. The high E/X and B/X in the spring indicated a greater degree of air mass aging, which could be related to the influence of air mass transport in the atmosphere. The average wind speed in spring (3.6 m·s−1) in Changzhi is higher than that in summer (2.9 m·s−1) and autumn (3.0 m·s−1), which leads to longer air mass transport distances and therefore greater air mass aging in spring. As shown in Figure S1, the results of our analysis of the backward trajectory at the time of sampling in Changzhi indicated that the air masses transported in spring are mainly from the north upwards compared to summer and autumn. Air mass in spring transport was mainly from the northern and northwestern directions, with relatively low emission intensities at the places where it was mainly experienced. Air mass transport in summer and autumn all pass through places with relatively large VOC emissions in Henan Province and Hebei Province, and primary emissions had a significant effect on transport and low oxidation.
The greatest sources of pentane are LPG combustion, gasoline vehicle exhaust, and fuel evaporation [15,21,44,50]. The mean i-pentane/n-pentane ratio in this study was 8.1 ± 7.1, indicating that VOC emissions in Changzhi were influenced by vehicle exhaust or associated sources. The lower i-pentane/n-pentane ratio (3.4) in autumn indicated that the sources of high isopentane emissions were significantly reduced in that season. Previous studies have shown that the i-butane/n-butane ratio varies according to source, with values of ~0.2–0.3 for vehicle exhaust, 0.46 for LPG emissions, and 0.6–1.0 for NG emissions [51,52,53]. The correlation between isobutane and n-butane in Changzhi was very strong (R2 = 0.74), and the i-butane/n-butane ratio was 0.8, which indicates that NG emissions had a significant impact on the butane concentration. In addition, the higher i-butane/n-butane ratio (1.0) in the summer indicated that NG emissions contributed more to the VOC concentration in the summer than in other seasons.

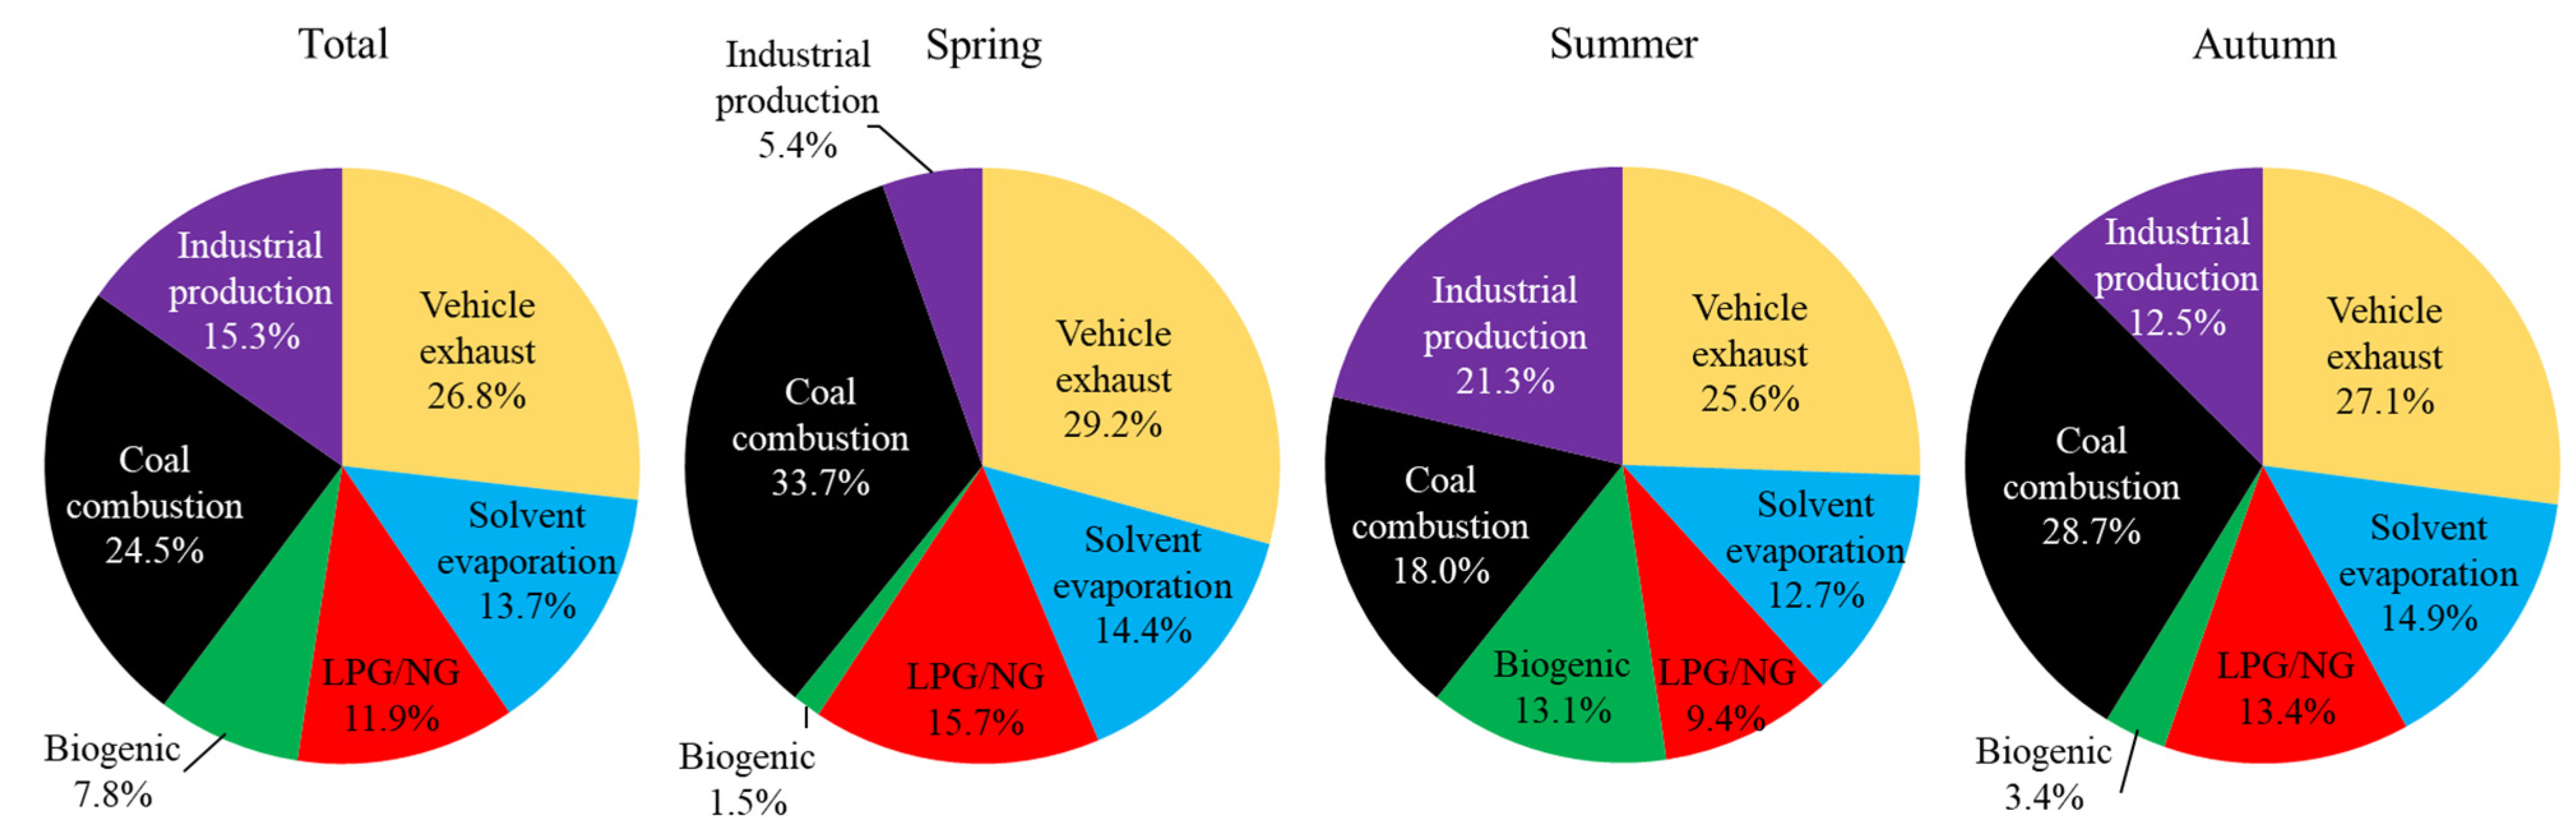
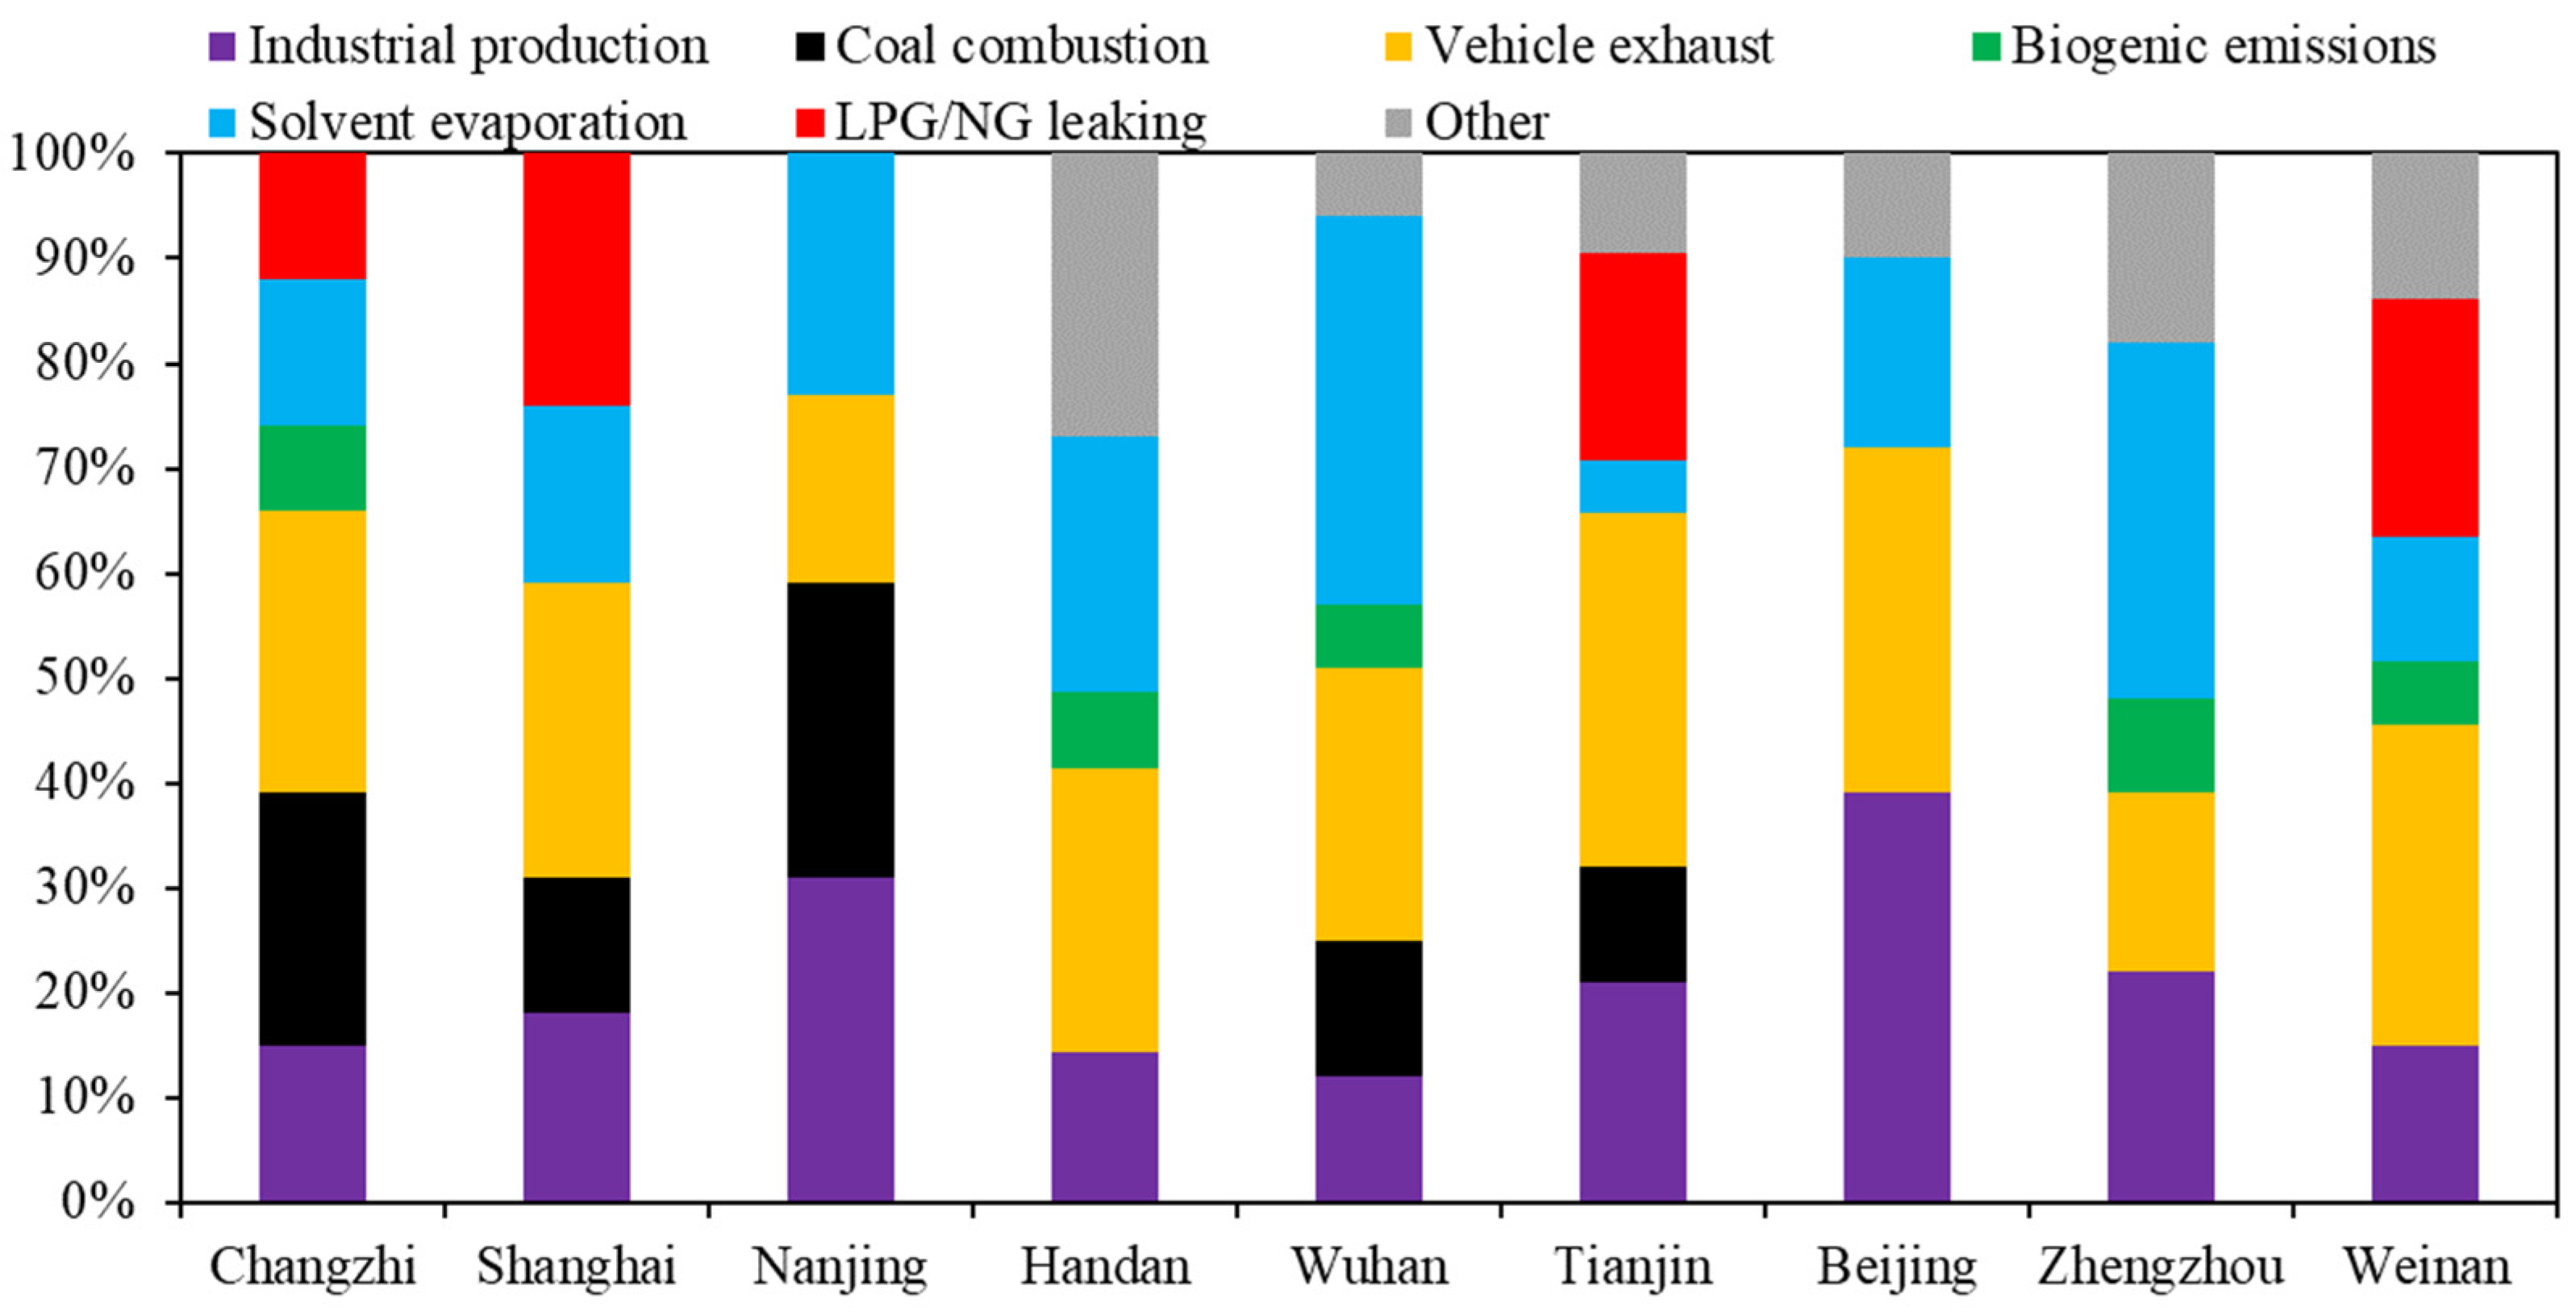
3.2.2. Source Apportionment by PCA-MLR

PCA-MLR is often used to assess the contribution of various sources to the concentration of pollutants in the ambient atmosphere. PCA-MLR applies multiple methods to transform the correlation matrix composed of receptor data to extract the source information. The steps of PCA are to first transform the collected data orthogonally, then perform a maximum variance rotation, then select the principal factors (eigenvalues greater than 1 or cumulative contribution of variance value between 85–95%), and finally multiple linear regression based on the calculated source component spectrum to estimate the contribution of each type of pollutant source to the pollutant concentration. In this study, there were 57 VOCs monitored online, and 26 of them were selected for source analysis, considering data integrity and substance types and concentrations. The selected basic statistics of VOCs are shown in Table S1. In this paper, the principal component analysis of VOCs was performed using SPSS 21.0 software, and the explained total variance table and rotation matrix table were obtained as follows. There were six factors with eigenvalues greater than 1 obtained, accounting for 89.34% of the total variance. Based on the VOC species, six sources were identified, namely solvent evaporation, vehicle exhaust, industrial production, coal combustion, biogenic emissions, and LPG/NG leaking. These sources were classified into six factors, as shown in Table 2. Due to the limited data used in this study, there is uncertainty in the results of the sources of VOCs, and more observations could better explain the sources of VOCs in Changzhi.
Factor 1 was distinguished by a high proportion of ethane, ethylene, propene, acetylene, and benzene. Benzene, toluene, ethylbenzene, and xylene (BTEX) compounds are usually emitted by coal combustion, solvent evaporation, and industrial processes [54]. Factor 1 was defined as coal combustion considering that coking, iron and steel, and power industries are typical industries in Changzhi that consume large amounts of coal.
Factor 2 encompassed other industrial production. The industrial enterprises in Changzhi were diverse and at large scale, including electricity, coking, iron and steel, and chemical sectors. High contributions of C3–C6 alkanes and aromatics were observed in factor 2. Iron and steel industries emit large amounts of aromatics [55], and the chemical and coking industries produce large amounts of alkanes and aromatics [8,56]. Therefore, factor 2 was identified as industrial production.
Factor 3 consisted mainly of alkanes (such as propane, n-butane, n-pentane and 2,3-dimethylbutane) and aromatics (such as benzene). C3–C6 alkanes and alkenes are typical products of the incomplete combustion of gasoline or LPG [37,57]. In addition, the high proportion of aromatic species is a main characteristic of gasoline. Therefore, factor 3 was defined as vehicle exhaust [58].
Factor 4 comprised biogenic emissions. In 2018, the forest area of Changzhi was 445,800 ha, and the forest coverage rate was 31.9%. Biogenic emissions can release large amounts of isoprene, especially during the summer [59]. Isoprene is the predominant species in factor 4, and therefore factor 4 is considered to be the biogenic emission.
In factor 5, 1-butene and isobutane are the predominant species, and they are usually considered to be from NG and LPG leaking [60]. In recent years, the natural gas sector in Changzhi has rapidly developed, aiming to replace coal for residential fuel. However, natural gas can leak during pipeline transportation and use [41,61]. Therefore, this category was defined as LPG/NG leaking.
Factor 6 is distinguished by ethylbenzene, m/p-xylene, isopropylbenzene, n-propylbenzene, and 3-methylhexane. Previous studies have shown that isopropylbenzene and n-propylbenzene can be used as a solvent or as an intermediate in organic synthesis, as well as in textile dyes and printing [21,62]. Therefore, we consider this factor as solvent evaporation.
Figure 3 shows the source apportionment of VOCs according to the PCA. Vehicle exhaust was the largest source (27.5%) of atmospheric VOCs, and coal combustion was the second largest one (23.5%). Additionally, the contributions of industrial production, solvent evaporation, LPG/NG, and biogenic emissions to atmospheric VOCs were 17.4%, 13.5%, 9.5%, and 8.7%, respectively.
The contribution of different sources in each season was calculated from the coefficients of each source for different samples and VOC concentration data in the PCA calculation results. The contribution of different VOC sources varied between seasons. The contribution of biogenic emission was significantly higher in the summer (13.2%) than in the spring (6.8%) and autumn (6.2%). The temperatures are higher in summer (23.0 °C) than in spring (17.4 °C) and autumn (15.0 °C), which leads to accelerated plant growth and higher respiration rates, resulting in more emissions from biogenic sources in summer, whereas the contributions of vehicle exhaust were generally consistent across the seasons, at 29.1%, 26.2%, and 27.2% in the spring, summer, and autumn, respectively. The lowest contribution of coal combustion to VOCs was in the summer (18.6%), followed by autumn (24.3%) and spring (27.5%). The highest contribution of industrial production was in the summer (23.3%), which might be related to the increased intensity of industrial emissions in that season. The contribution of LPG/NG was significantly lower in the summer (6.7%) than in the spring (11.1%) and autumn (10.7%). Finally, the contribution of solvent evaporation was mostly consistent across the seasons, at 14.6%, 12.1%, and 13.8% in the spring, summer, and autumn, respectively.
Figure S1 showed that the summer air mass transport in Changzhi was mainly from northern Henan Province (51.8%). Henan Province is one of the major grain producing areas in China. Summer crop growth generated a large number of biogenic emissions that reach Changzhi through air mass transport, resulting in a high proportion of biogenic contribution. In addition, both summer and autumn air masses pass through the industrial agglomerations in central Henan province. The transport of industrial emissions of VOCs through the air masses may be one of the reasons for the high proportion of industrial contributions in summer and autumn in Changzhi.
Figure 4 shows the source apportionment of VOCs in seven Chinese cities during a similar period, including Shanghai, Nanjing, Handan, Wuhan, Tianjin, Beijing, Zhengzhou, and Weinan [22,23,40,41,60,63,64,65]. Vehicle exhaust was the main source of VOCs in several cities. The contribution of vehicle exhaust (27%) in Changzhi was lower than those in densely populated cities such as Beijing (33%) and Shanghai (28%). As a typical industrial city, the contribution of industrial production to VOCs in Changzhi was higher than that of southern cities such as Wuhan (12%) and Handan (11%) but lower than that of the northern Chinese city of Tianjin (20%). In addition, the contribution of solvent evaporation in Changzhi was significantly lower than those in the southern cities of Wuhan (37%) and Nanjing (23%). In recent years, the coal chemical and pharmaceutical industries in Changzhi have grown rapidly. The production processes in these industries consume large amounts of organic materials and produce large amounts of VOCs. Therefore, industrial production and solvent evaporation have become important sources of local VOCs. Nevertheless, steel, electricity and coking are still the most important industries in Changzhi, and they have a high energy demand, which is mostly produced by coal combustion. Therefore, the contribution of coal combustion was significantly higher in Changzhi than in other cities. The contribution of biogenic emissions to VOCs was similar across all investigated cities, ranging from 6 to 9%.

3.3. Ozone Formation Potential

Because of the large differences in the photochemical reactivities of VOC species, the contributions of different VOC species to the photochemical generation of ozone are different. To better understand the characteristics of VOC species in the atmosphere and determine their role in the photochemical generation of ozone, we used MIR methods to analyze and describe the reactivity and OFP of VOC species.
The contribution of major VOC groups to the OFP is shown in Figure 5. This study assessed the effect of VOCs on ozone formation using the OFP, which was based on the results of the MIR study. The calculated OFP of each VOC species sampled during the observation period is shown in Figure 5. The VOCs contributed to 125.8 µg·m−3 of the atmospheric ozone generation in Changzhi during the study period. Alkenes were the largest contributor to ozone formation in Changzhi (40.9% of OFP), followed by aromatics (28.6%), alkanes (28.2%), and alkynes (2.3%).
Although the concentrations of alkenes and aromatics were significantly lower than those of alkanes, their chemical reactivities were relatively high, and their contributions to the concentration of ozone were greatly increased. The contribution of VOCs to ozone production was higher in June and October. The increased emissions of alkanes, especially isopentane, led to the higher OFP in June, whereas the weaker atmospheric photochemical reactions in autumn can explain the increased OFP in October. As isopentane and O3 concentrations are indicators of vehicle exhaust emissions, their variation suggested that vehicle exhaust in Changzhi had a significant influence on atmospheric O3.
The contribution of the emission sources to ozone production and to VOC pollution is different because the emitted pollutants are subjected to different chemical activities. Coal combustion was the largest source of ozone production, contributing to 28.9% of the OFP. Industrial production was associated with high VOC contribution and contributed to 18.0% of OFP, followed by LPG/NG (15.3%), solvent evaporation (16.7%), vehicle exhaust (12.8%), and biogenic emissions (8.3%). Ethylene and propylene are characteristic species from coal combustion emissions, and their high concentrations and high chemical reactivity led to the greatest contribution to OFP. In addition, solvent evaporation was also a main source to OFP owing to the chemical reactivity and high concentrations of aromatics emitted from solvent evaporation.
The contribution of different sources to OFP also changed according to season. The increased emissions from the local vegetation in the summer resulted in a higher contribution of biogenic emission to OFP. Coal combustion contributed less to the OFP in the summer because of its diminished contribution to VOCs in that season. These changes were attributed to the different VOC concentrations and reactivity of the indicator species. Therefore, source apportionment based on OFP can provide a basis for the development of countermeasures to reduce O3 concentrations.

3.4. Human Health Assessment

As a standard to estimate overall risk, six aromatic compounds (benzene, toluene, ethylbenzene, p-xylene, o-xylene, and styrene) were selected for the health risk assessment. The non-carcinogenic risks (HQ) of all compounds were lower than the criterion, ranging from 1.5 × 10⁻¹ to 1.5 × 10⁻⁵. The HI (average of 2.0 × 10⁻¹) was higher in the summer (2.4 × 10⁻¹) than in the spring (1.7 × 10⁻¹) and autumn (1.9 × 10⁻¹), and they were all below the criterion during the study period, which indicates that exposure to these benzenes would not pose a non-carcinogenic risk to the public. The R of benzene (average of 3.8 × 10⁻⁵) was higher than the criterion (1 × 10⁻⁶) in all seasons, at 3.4 × 10⁻⁵, 4.4 × 10⁻⁵, and 3.4 × 10⁻⁵ for the spring, summer, and autumn, respectively. The average R of ethylbenzene in the study period was 2.9 × 10⁻⁶, and it was higher than the criterion in all seasons, at 2.2 × 10⁻⁶, 3.4 × 10⁻⁶, and 2.8 × 10⁻⁶ in the spring, summer, and autumn, respectively. The high R indicated that long-term exposure to benzene and ethylbenzene in the study area can cause potential carcinogenic risks. Therefore, their emissions should be controlled to ensure public health.
The relative contribution of each source to health risk was evaluated. The sources containing more toxic pollutants were expected to generate higher health risks. In this study, solvent evaporation contributed to 28.0% of the non-carcinogenic risk, and 19.1% of the carcinogenic risk. The contribution of solvent evaporation to the carcinogenic risk was attributed to its high load of aromatics. Coal combustion contributed to 29.0% and 25.3% of the non-carcinogenic and carcinogenic risks because of its high VOC emissions. Therefore, the health risks of different sources should be considered when developing abatement measures for VOC pollution.

4. Conclusions

This study assessed the concentration, OFP, source apportionment, and human health aspects of VOC emissions from 15 April 2018 to 19 October 2018 at the Changzhi Environmental Monitoring Station. The concentration of VOCs in Changzhi during the study period was 54.4 ± 20.4 µg·m−3, and alkanes were the dominant component (66.8%), followed by aromatics (16.4%), alkenes (10.2%), and alkynes (6.6%). The highest VOC concentration was observed in the autumn (58.4 µg·m−3), followed by summer (52.5 µg·m−3) and spring (48.3 µg·m−3). The top 10 VOCs in terms of concentration were isopentane (19.0%), ethane (9.5%), n-butane (8.1%), benzene (7.9%), propane (5.2%), ethylene (5.2%), 2-methylheptane (4.6%), m-xylene (4.3%), acetylene (3.7%), and isobutane (3.3%). These results indicated that vehicle exhaust and coal combustion were the main sources of VOCs in Changzhi. The species of these top 10 VOCs were generally consistent across the seasons, which indicates a relatively stable source of VOCs. The high E/X (0.6) and B/X (2.8) indicated high levels of air aging in Changzhi. The high isopentane/n-pentane ratio (8.1 ± 7.1) indicated that VOCs in Changzhi were significantly influenced by vehicle exhaust or similar sources, and the isobutane/n-butane ratio (0.8) indicated that natural gas emissions were the main source of butanes in Changzhi. The PCA modeling identified six main emission sources of VOCs in Changzhi, including vehicle exhaust (27.5%), followed by coal combustion (23.5%), industrial production (17.4%), solvent evaporation (13.5%), LPG/NG (9.5%), and biogenic emission (8.7%). The OFP of VOCs in Changzhi was 125.8 μg·m−3, to which alkenes contributed the most (40.9%), followed by aromatics (28.6%), alkanes (28.2%), and alkynes (2.3%). The non-carcinogenic risks were lower than 1, but the carcinogenic risks of benzene and ethylbenzene were 3.4 × 10⁻⁵ and 2.2 × 10⁻⁶, respectively. Vehicle exhaust and coal combustion were the first and second largest sources of VOCs in Changzhi, respectively. Therefore, vehicle exhaust and industrial coal combustion should be controlled to reduce VOC emissions and ozone pollution in Changzhi.

Supplementary Materials

The following supporting information can be downloaded at: https://www.mdpi.com/article/10.3390/atmos13030393/s1, Figure S1: Backward trajectory of air in Changzhi during spring (a), summer(b) and autumn (c); Table S1: Basic statistics of VOCs used in PCA analysis (µg·m−3).

Author Contributions

X.Z.: Investigation, Formal analysis, Writing—original draft. Y.Y.: Conceptualization, Methodology, Writing—original draft. X.D. and Y.X.: Investigation, Formal analysis. R.L., J.C. and Z.L.: Validation. L.P.: Methodology, Supervision. All authors have read and agreed to the published version of the manuscript.

Funding

This work was supported by the National Key R&D Program of China (Grant No. 2019YFC0214200), the National Natural Science Foundation of China (NSFC) (Grant No. 21976053, No. 42103056), and the Key Project of Heavy Air Pollution Cause and Control (No. DQGG202108).

Institutional Review Board Statement

Not applicable.

Informed Consent Statement

Not applicable.

Data Availability Statement

The datasets analyzed during the current study are available from the corresponding author on reasonable request.

Conflicts of Interest

The authors declare that they have no known competing financial interests or personal relationships that could have appeared to influence the work reported in this paper.

References

  1. Zhang, Y.; Jin, J.-L.; Yan, P.; Tang, J.; Fang, S.-X.; Lin, W.-L.; Lou, M.-Y.; Liang, M.; Zhou, Q.; Jing, J.-S. Long-term variations of major atmospheric compositions observed at the background stations in three key areas of China. Adv. Clim. Chang. Res. 2020, 11, 370–380. [Google Scholar] [CrossRef]
  2. Zhou, W.; Chen, C.; Lei, L.; Fu, P.; Sun, Y. Temporal variations and spatial distributions of gaseous and particulate air pollutants and their health risks during 2015–2019 in China. Environ. Pollut. 2021, 272, 116031. [Google Scholar] [CrossRef] [PubMed]
  3. Tan, Z.; Lu, K.; Jiang, M.; Su, R.; Wang, H.; Lou, S.; Fu, Q.; Zhai, C.; Tan, Q.; Yue, D. Daytime atmospheric oxidation capacity in four Chinese megacities during the photochemically polluted season: A case study based on box model simulation. Atmos. Chem. Phys. 2019, 19, 3493–3513. [Google Scholar] [CrossRef] [Green Version]
  4. Wang, L.; Xing, L.; Wu, X.; Sun, J.; Kong, M. Spatiotemporal variations and risk assessment of ambient air O3, PM10 and PM2.5 in a coastal city of China. Ecotoxicology 2021, 30, 1333–1342. [Google Scholar] [CrossRef]
  5. Li, K.; Jacob, D.J.; Liao, H.; Shen, L.; Zhang, Q.; Bates, K.H. Anthropogenic drivers of 2013–2017 trends in summer surface ozone in China. Proc. Natl. Acad. Sci. USA 2019, 116, 422–427. [Google Scholar] [CrossRef] [Green Version]
  6. Tian, D.; Fan, J.; Jin, H.; Mao, H.; Geng, D.; Hou, S.; Zhang, P.; Zhang, Y. Characteristic and spatiotemporal variation of air pollution in Northern China based on correlation analysis and clustering analysis of five air pollutants. J. Geophys. Res. Atmos. 2020, 125, e2019JD031931. [Google Scholar] [CrossRef]
  7. Feng, J.; Zhang, Y.; Li, S.; Mao, J.; Patton, A.P.; Zhou, Y.; Ma, W.; Liu, C.; Kan, H.; Huang, C. The influence of spatiality on shipping emissions, air quality and potential human exposure in the Yangtze River Delta/Shanghai, China. Atmos. Chem. Phys. 2019, 19, 6167–6183. [Google Scholar] [CrossRef] [Green Version]
  8. Liu, Y.; Wang, H.; Jing, S.; Gao, Y.; Peng, Y.; Lou, S.; Cheng, T.; Tao, S.; Li, L.; Li, Y. Characteristics and sources of volatile organic compounds (VOCs) in Shanghai during summer: Implications of regional transport. Atmos. Environ. 2019, 215, 116902. [Google Scholar] [CrossRef]
  9. Zhang, X.; Fung, J.C.; Lau, A.K.; Hossain, M.S.; Louie, P.K.; Huang, W. Air quality and synergistic health effects of ozone and nitrogen oxides in response to China’s integrated air quality control policies during 2015–2019. Chemosphere 2021, 268, 129385. [Google Scholar] [CrossRef]
  10. Zeng, Y.; Cao, Y.; Qiao, X.; Seyler, B.C.; Tang, Y. Air pollution reduction in China: Recent success but great challenge for the future. Sci. Total Environ. 2019, 663, 329–337. [Google Scholar] [CrossRef]
  11. Zheng, H.; Kong, S.; Yan, Y.; Chen, N.; Yao, L.; Liu, X.; Wu, F.; Cheng, Y.; Niu, Z.; Zheng, S. Compositions, sources and health risks of ambient volatile organic compounds (VOCs) at a petrochemical industrial park along the Yangtze River. Sci. Total Environ. 2020, 703, 135505. [Google Scholar] [CrossRef] [PubMed]
  12. Liu, Y.; Kong, L.; Liu, X.; Zhang, Y.; Li, C.; Zhang, Y.; Zhang, C.; Qu, Y.; An, J.; Ma, D.; et al. Characteristics, secondary transformation, and health risk assessment of ambient volatile organic compounds (VOCs) in urban Beijing, China. Atmos. Pollut. Res. 2021, 12, 33–46. [Google Scholar] [CrossRef]
  13. Tagiyeva, N.; Sheikh, A. Domestic exposure to volatile organic compounds in relation to asthma and allergy in children and adults. Expert Rev. Clin. Immunol. 2014, 10, 1611–1639. [Google Scholar] [CrossRef] [PubMed]
  14. Huang, Y.; Su, T.; Wang, L.; Wang, N.; Xue, Y.; Dai, W.; Lee, S.C.; Cao, J.; Ho, S.S.H. Evaluation and characterization of volatile air toxics indoors in a heavy polluted city of northwestern China in wintertime. Sci. Total Environ. 2019, 662, 470–480. [Google Scholar] [CrossRef] [PubMed]
  15. Bari, M.A.; Kindzierski, W.B. Ambient volatile organic compounds (VOCs) in communities of the Athabasca oil sands region: Sources and screening health risk assessment. Environ. Pollut. 2018, 235, 602–614. [Google Scholar] [CrossRef] [PubMed] [Green Version]
  16. Agyei, T.; Juráň, S.; Edwards-Jonášová, M.; Fischer, M.; Švik, M.; Komínková, K.; Ofori-Amanfo, K.; Marek, M.; Grace, J.; Urban, O. The Influence of Ozone on Net Ecosystem Production of a Ryegrass–Clover Mixture under Field Conditions. Atmosphere 2021, 12, 1629. [Google Scholar] [CrossRef]
  17. Kaser, L.; Peron, A.; Graus, M.; Striednig, M.; Wohlfahrt, G.; Juráň, S.; Karl, T. Interannual variability of BVOC emissions in an alpine city. Atmos. Chem. Phys. Discuss. 2021, 1–26. [Google Scholar] [CrossRef]
  18. Wang, H.; Wu, Q.; Guenther, A.B.; Yang, X.; Wang, L.; Xiao, T.; Li, J.; Feng, J.; Xu, Q.; Cheng, H. A long-term estimation of biogenic volatile organic compound (BVOC) emission in China from 2001–2016: The roles of land cover change and climate variability. Atmos. Chem. Phys. 2021, 21, 4825–4848. [Google Scholar] [CrossRef]
  19. Kaltsonoudis, C.; Kostenidou, E.; Florou, K.; Psichoudaki, M.; Pandis, S.N. Temporal variability and sources of VOCs in urban areas of the eastern Mediterranean. Atmos. Chem. Phys. 2016, 16, 14825–14842. [Google Scholar] [CrossRef] [Green Version]
  20. Yalçin, E.; Tecer, L.H.; Yurdakul, S.; Tuncel, G. Potential sources and measured concentrations of VOCs in Balikesir ambient atmosphere. Atmósfera 2020, 33, 269–284. [Google Scholar] [CrossRef] [Green Version]
  21. Liu, Y.; Shao, M.; Fu, L.; Lu, S.; Zeng, L.; Tang, D. Source profiles of volatile organic compounds (VOCs) measured in China: Part I. Atmos. Environ. 2008, 42, 6247–6260. [Google Scholar] [CrossRef]
  22. Geng, F.; Cai, C.; Tie, X.; Yu, Q.; An, J.; Peng, L.; Zhou, G.; Xu, J. Analysis of VOC emissions using PCA/APCS receptor model at city of Shanghai, China. J. Atmos. Chem. 2009, 62, 229–247. [Google Scholar] [CrossRef]
  23. Xia, L.; Cai, C.; Zhu, B.; An, J.; Li, Y.; Li, Y. Source apportionment of VOCs in a suburb of Nanjing, China, in autumn and winter. J. Atmos. Chem. 2014, 71, 175–193. [Google Scholar] [CrossRef]
  24. Guo, H.; Wang, T.; Simpson, I.J.; Blake, D.R.; Yu, X.M.; Kwok, Y.H.; Li, Y.S. Source contributions to ambient VOCs and CO at a rural site in eastern China. Atmos. Environ. 2004, 38, 4551–4560. [Google Scholar] [CrossRef] [Green Version]
  25. Olajire, A.A.; Azeez, L. Source apportionment and ozone formation potential of volatile organic compounds in Lagos (Nigeria). Chem. Ecol. 2014, 30, 156–168. [Google Scholar] [CrossRef]
  26. Chang, P.E.P.; Yang, J.C.R.; Den, W.; Wu, C.F. Characterizing and locating air pollution sources in a complex industrial district using optical remote sensing technology and multivariate statistical modeling. Environ. Sci. Pollut. Res. 2014, 21, 10852–10866. [Google Scholar] [CrossRef]
  27. Civan, M.Y.; Kuntasal, Ö.O.; Tuncel, G. Source apportionment of ambient volatile organic compounds in Bursa, a heavily industrialized city in Turkey. Environ. Forensics 2011, 12, 357–370. [Google Scholar] [CrossRef]
  28. Liang, X.; Sun, X.; Xu, J.; Ye, D. Improved emissions inventory and VOCs speciation for industrial OFP estimation in China. Sci. Total Environ. 2020, 745, 140838. [Google Scholar] [CrossRef]
  29. Shen, L.; Xiang, P.; Liang, S.; Chen, W.; Wang, M.; Lu, S.; Wang, Z. Sources profiles of volatile organic compounds (VOCs) measured in a typical industrial process in Wuhan, Central China. Atmosphere 2018, 9, 297. [Google Scholar] [CrossRef] [Green Version]
  30. Duan, X.; Yan, Y.; Li, R.; Deng, M.; Hu, D.; Peng, L. Seasonal variations, source apportionment, and health risk assessment of trace metals in PM2.5 in the typical industrial city of Changzhi, China. Atmos. Pollut. Res. 2021, 12, 365–374. [Google Scholar] [CrossRef]
  31. Jia, Y.H.; Peng, L.; Mu, L. The chemical composition and sources of PM10 in urban road dust. Appl. Mech. Mater. 2011, 71, 2749–2752. [Google Scholar] [CrossRef]
  32. Feng, J.; Song, N.; Yu, Y.; Li, Y. Differential analysis of FA-NNC, PCA-MLR, and PMF methods applied in source apportionment of PAHs in street dust. Environ. Monit. Assess. 2020, 192, 727. [Google Scholar] [CrossRef]
  33. Choi, Y.; Elliott, S.; Simpson, I.J.; Blake, D.R.; Colman, J.J.; Dubey, M.K.; Meinardi, S.; Rowland, F.S.; Shirai, T.; Smith, F.A. Survey of whole air data from the second airborne Biomass Burning and Lightning Experiment using principal component analysis. J. Geophys. Res. Atmos. 2003, 108, 0148–0227. [Google Scholar] [CrossRef] [Green Version]
  34. Carter, W.P.L. Development of ozone reactivity scales for volatile organic compounds. J. Air Waste Manag. Assoc. 1994, 44, 881–899. [Google Scholar] [CrossRef] [Green Version]
  35. Li, Q.; Su, G.; Li, C.; Liu, P.; Zhao, X.; Zhang, C.; Sun, X.; Mu, Y.; Wu, M.; Wang, Q.; et al. An investigation into the role of VOCs in SOA and ozone production in Beijing, China. Sci. Total Environ. 2020, 720, 137536. [Google Scholar] [CrossRef] [PubMed]
  36. Liu, Y.; Shao, M.; Zhang, J.; Fu, L.L.; Lu, S.H. Distributions and source apportionment of ambient volatile organic compounds in Beijing city, China. J. Environ. Sci. Health Part A Toxic/Hazard. Subst. Environ. Eng. 2005, 40, 1843–1860. [Google Scholar] [CrossRef]
  37. Liu, Z.; Li, N.; Wang, N. Characterization and source identification of ambient VOCs in Jinan, China. Air Qual. Atmos. Health 2016, 9, 285–291. [Google Scholar] [CrossRef]
  38. Wang, M.; Qin, W.; Chen, W.; Zhang, L.; Zhang, Y.; Zhang, X.; Xie, X. Seasonal variability of VOCs in Nanjing, Yangtze River delta: Implications for emission sources and photochemistry. Atmos. Environ. 2020, 223, 117254. [Google Scholar] [CrossRef]
  39. Xie, F.; Zhou, X.; Wang, H.; Gao, J.; Hao, F.; He, J.; Lü, C. Heating events drive the seasonal patterns of volatile organic compounds in a typical semi-arid city. Sci. Total Environ. 2021, 788, 147781. [Google Scholar] [CrossRef]
  40. Liu, Y.; Song, M.; Liu, X.; Zhang, Y.; Hui, L.; Kong, L.; Zhang, Y.; Zhang, C.; Qu, Y.; An, J. Characterization and sources of volatile organic compounds (VOCs) and their related changes during ozone pollution days in 2016 in Beijing, China. Environ. Pollut. 2020, 257, 113599. [Google Scholar] [CrossRef]
  41. Liu, B.; Liang, D.; Yang, J.; Dai, Q.; Bi, X.; Feng, Y.; Yuan, J.; Xiao, Z.; Zhang, Y.; Xu, H. Characterization and source apportionment of volatile organic compounds based on 1-year of observational data in Tianjin, China. Environ. Pollut. 2016, 218, 757–769. [Google Scholar] [CrossRef] [PubMed]
  42. Guo, H.; Ling, Z.; Cheng, H.; Simpson, I.; Lyu, X.; Wang, X.; Shao, M.; Lu, H.; Ayoko, G.; Zhang, Y. Tropospheric volatile organic compounds in China. Sci. Total Environ. 2017, 574, 1021–1043. [Google Scholar] [CrossRef] [PubMed] [Green Version]
  43. Barletta, B.; Meinardi, S.; Simpson, I.J.; Khwaja, H.A.; Blake, D.R.; Rowland, F.S. Mixing ratios of volatile organic compounds (VOCs) in the atmosphere of Karachi, Pakistan. Atmos. Environ. 2002, 36, 3429–3443. [Google Scholar] [CrossRef]
  44. Barletta, B.; Meinardi, S.; Rowland, F.S.; Chan, C.-Y.; Wang, X.; Zou, S.; Chan, L.Y.; Blake, D.R. Volatile organic compounds in 43 Chinese cities. Atmos. Environ. 2005, 39, 5979–5990. [Google Scholar] [CrossRef] [Green Version]
  45. Lyu, X.; Chen, N.; Guo, H.; Zhang, W.; Wang, N.; Wang, Y.; Liu, M. Ambient volatile organic compounds and their effect on ozone production in Wuhan, central China. Sci. Total Environ. 2016, 541, 200–209. [Google Scholar] [CrossRef] [PubMed]
  46. Yuan, B.; Shao, M.; De Gouw, J.; Parrish, D.D.; Lu, S.; Wang, M.; Zeng, L.; Zhang, Q.; Song, Y.; Zhang, J. Volatile organic compounds (VOCs) in urban air: How chemistry affects the interpretation of positive matrix factorization (PMF) analysis. J. Geophys. Res. Atmos. 2012, 117, 24302. [Google Scholar] [CrossRef]
  47. Parrish, D.D.; Stohl, A.; Forster, C.; Atlas, E.; Blake, D.; Goldan, P.; Kuster, W.; De Gouw, J. Effects of mixing on evolution of hydrocarbon ratios in the troposphere. J. Geophys. Res. Atmos. 2007, 112, D10S34. [Google Scholar] [CrossRef] [Green Version]
  48. An, J.; Zhu, B.; Wang, H.; Li, Y.; Lin, X.; Yang, H. Characteristics and source apportionment of VOCs measured in an industrial area of Nanjing, Yangtze River Delta, China. Atmos. Environ. 2014, 97, 206–214. [Google Scholar] [CrossRef]
  49. Yurdakul, S.; Civan, M.; Kuntasal, Ö.; Doğan, G.; Pekey, H.; Tuncel, G. Temporal variations of VOC concentrations in Bursa atmosphere. Atmos. Pollut. Res. 2018, 9, 189–206. [Google Scholar] [CrossRef]
  50. Li, B.; Ho, S.S.H.; Gong, S.; Ni, J.; Li, H.; Han, L.; Yang, Y.; Qi, Y.; Zhao, D. Characterization of VOCs and their related atmospheric processes in a central Chinese city during severe ozone pollution periods. Atmos. Chem. Phys. 2019, 19, 617–638. [Google Scholar] [CrossRef] [Green Version]
  51. Russo, R.; Zhou, Y.; White, M.; Mao, H.; Talbot, R.; Sive, B. Multi-year (2004–2008) record of nonmethane hydrocarbons and halocarbons in New England: Seasonal variations and regional sources. Atmos. Chem. Phys. 2010, 10, 4909–4929. [Google Scholar] [CrossRef] [Green Version]
  52. Velasco, E.; Lamb, B.; Westberg, H.; Allwine, E.; Sosa, G.; Arriaga-Colina, J.; Jobson, B.; Alexander, M.L.; Prazeller, P.; Knighton, W.B. Distribution, magnitudes, reactivities, ratios and diurnal patterns of volatile organic compounds in the Valley of Mexico during the MCMA 2002 & 2003 field campaigns. Atmos. Chem. Phys. 2007, 7, 329–353. [Google Scholar]
  53. Zheng, H.; Kong, S.; Xing, X.; Mao, Y.; Hu, T.; Ding, Y.; Li, G.; Liu, D.; Li, S.; Qi, S. Monitoring of volatile organic compounds (VOCs) from an oil and gas station in northwest China for 1 year. Atmos. Chem. Phys. 2018, 18, 4567–4595. [Google Scholar] [CrossRef] [Green Version]
  54. Yan, Y.; Peng, L.; Li, R.; Li, Y.; Li, L.; Bai, H. Concentration, ozone formation potential and source analysis of volatile organic compounds (VOCs) in a thermal power station centralized area: A study in Shuozhou, China. Environ. Pollut. 2017, 223, 295–304. [Google Scholar] [CrossRef]
  55. Jiun-Horng, T.; Kuo-Hsiung, L.; Chih-Yu, C.; Nina, L.; Sen-Yi, M.; Hung-Lung, C. Volatile organic compound constituents from an integrated iron and steel facility. J. Hazard. Mater. 2008, 157, 569–578. [Google Scholar]
  56. Song, M.; Liu, X.; Zhang, Y.; Shao, M.; Lu, K.; Tan, Q.; Feng, M.; Qu, Y. Sources and abatement mechanisms of VOCs in southern China. Atmos. Environ. 2019, 201, 28–40. [Google Scholar] [CrossRef]
  57. Srivastava, A.; Sengupta, B.; Dutta, S. Source apportionment of ambient VOCs in Delhi City. Sci. Total Environ. 2005, 343, 207–220. [Google Scholar] [CrossRef]
  58. Han, M.; Lu, X.; Zhao, C.; Ran, L.; Han, S. Characterization and source apportionment of volatile organic compounds in urban and suburban Tianjin, China. Adv. Atmos. Sci. 2015, 32, 439–444. [Google Scholar] [CrossRef]
  59. Sun, J.; Wu, F.; Hu, B.; Tang, G.; Zhang, J.; Wang, Y. VOC characteristics, emissions and contributions to SOA formation during hazy episodes. Atmos. Environ. 2016, 141, 560–570. [Google Scholar] [CrossRef]
  60. Hui, L.; Liu, X.; Tan, Q.; Feng, M.; An, J.; Qu, Y.; Zhang, Y.; Deng, Y.; Zhai, R.; Wang, Z. VOC characteristics, chemical reactivity and sources in urban Wuhan, central China. Atmos. Environ. 2020, 224, 117340. [Google Scholar] [CrossRef]
  61. Ling, Z.H.; Guo, H.; Cheng, H.R.; Yu, Y.F. Sources of ambient volatile organic compounds and their contributions to photochemical ozone formation at a site in the Pearl River Delta, southern China. Environ. Pollut. 2011, 159, 2310–2319. [Google Scholar] [CrossRef]
  62. Wang, H.; Nie, L.; Li, J.; Wang, Y.; Wang, G.; Wang, J.; Hao, Z. Characterization and assessment of volatile organic compounds (VOCs) emissions from typical industries. Chin. Sci. Bull. 2013, 58, 724–730. [Google Scholar] [CrossRef] [Green Version]
  63. Wang, Y.; Yang, G.; Wang, L.; Zhao, L.; Ji, S.; Qi, M.; Lu, X.; Liu, Z.; Tan, J.; Liu, Y.; et al. Characteristics and source apportionment of VOCs in a city with complex pollution in China. Aerosol Air Qual. Res. 2020, 20, 2196–2210. [Google Scholar] [CrossRef] [Green Version]
  64. Li, Y.; Yin, S.; Yu, S.; Yuan, M.; Dong, Z.; Zhang, D.; Yang, L.; Zhang, R. Characteristics, source apportionment and health risks of ambient VOCs during high ozone period at an urban site in central plain, China. Chemosphere 2020, 250, 126283. [Google Scholar] [CrossRef] [PubMed]
  65. Hui, L.; Ma, T.; Gao, Z.; Gao, J.; Wang, Z.; Xue, L.; Liu, H.; Liu, J. Characteristics and sources of volatile organic compounds during high ozone episodes: A case study at a site in the eastern Guanzhong Plain, China. Chemosphere 2021, 265, 129072. [Google Scholar] [CrossRef] [PubMed]
Figure 1. Concentration of various VOC groups in (a) total sampling time and (b) different seasons.
Atmosphere 13 00393 g001
Figure 2. Top 10 VOC concentrations during (a) total sampling time, (b) spring, (c) summer and (d) winter.
Atmosphere 13 00393 g002
Figure 3. Contribution of each VOC source in Changzhi according to PCA during the total sampling time and various seasons.
Atmosphere 13 00393 g003
Figure 4. Contribution of each VOC sources in different cities.
Atmosphere 13 00393 g004
Figure 5. Contribution of (a) various VOCs groups and (b) various sources to OFP in Changzhi.
Atmosphere 13 00393 g005
Table 1. Ratio of selected VOC species in Changzhi.
E/XB/Xi-Pentane/n-Pentanei-Butane/n-Butane
April1.16.72.10.5
May0.63.923.40.8
Spring0.85.312.80.7
June0.40.924.60.6
July0.51.96.71.8
August0.42.17.80.5
Summer0.51.613.01.0
September0.41.64.10.5
October0.42.52.70.7
Autumn0.42.03.40.6
Average0.62.810.20.8
Table 2. PCA results for 24 VOCs at the Changzhi Environmental Monitoring Station.
Factor
F1F2F3F4F5F6
Ethylene0.8720.317
Ethyne0.836
Ethane0.862
Propylene0.8030.347
Propane0.572 0.588
Isobutane0.563 0.548
n-Butene 0.735
n-Butane 0.892
Isopentane 0.377
n-Pentane 0.888
2-Methyl 1,3-butadiene 0.797
2,2-Dimethylbutane0.4210.6540.393
2-Methylpentane 0.6150.425
Benzene0.439 0.525
Toluene 0.875
Ethylbenzene 0.892
m-p-xylene 0.922
2,3-Dimethylbutane 0.6980.502
n-Hexane 0.476 0.511
2-Methylhexane 0.89
3-Methylhexane 0.758
Isopropylbenzene 0.621
n-Propylbenzene 0.498
1,2,4-Trimethylbenzene0.4210.495
Extraction method: principal component analysis; rotation method: Varimax with Kaiser normalization, and only factors with eigenvalue ≥ 1 shown.
Publisher’s Note: MDPI stays neutral with regard to jurisdictional claims in published maps and institutional affiliations.

