
Modeling the Airborne Transmission of SARS-CoV-2 in Public Transport

 ,
,  ,
,
Abstract
:1. Introduction
- Direct transmission by droplets >5 μm containing the virus emitted by an infected person.
- Transmission by respiratory droplets and aerosols (<5 μm) that contain the virus and can remain suspended in the air for an extended time and travel greater distances.
- Transmission by direct contact with the virus through contact with an infected person or through direct contact with contaminated surfaces.
2. Materials and Methods
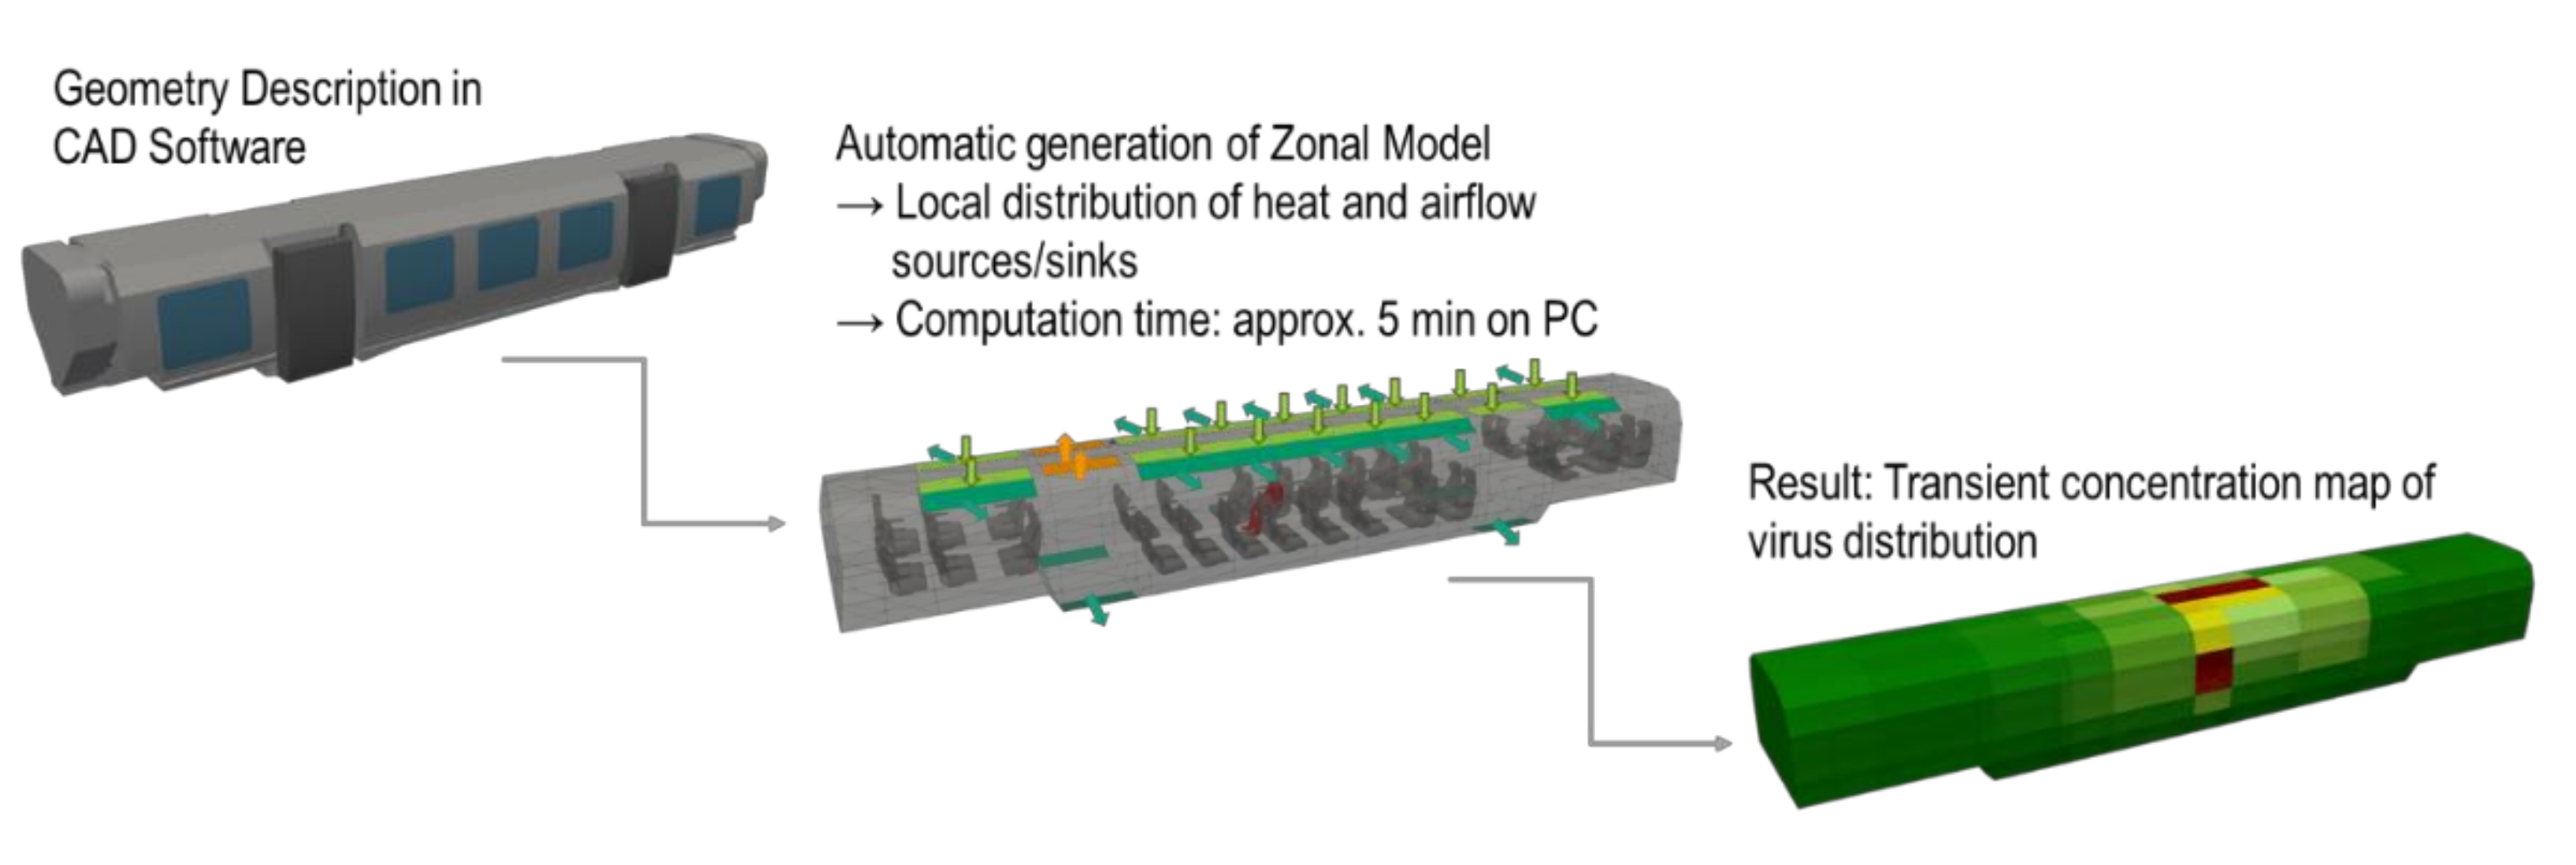
2.1. Zonal Model
2.2. Model Development and Evaluation
2.3. Boundary Conditions
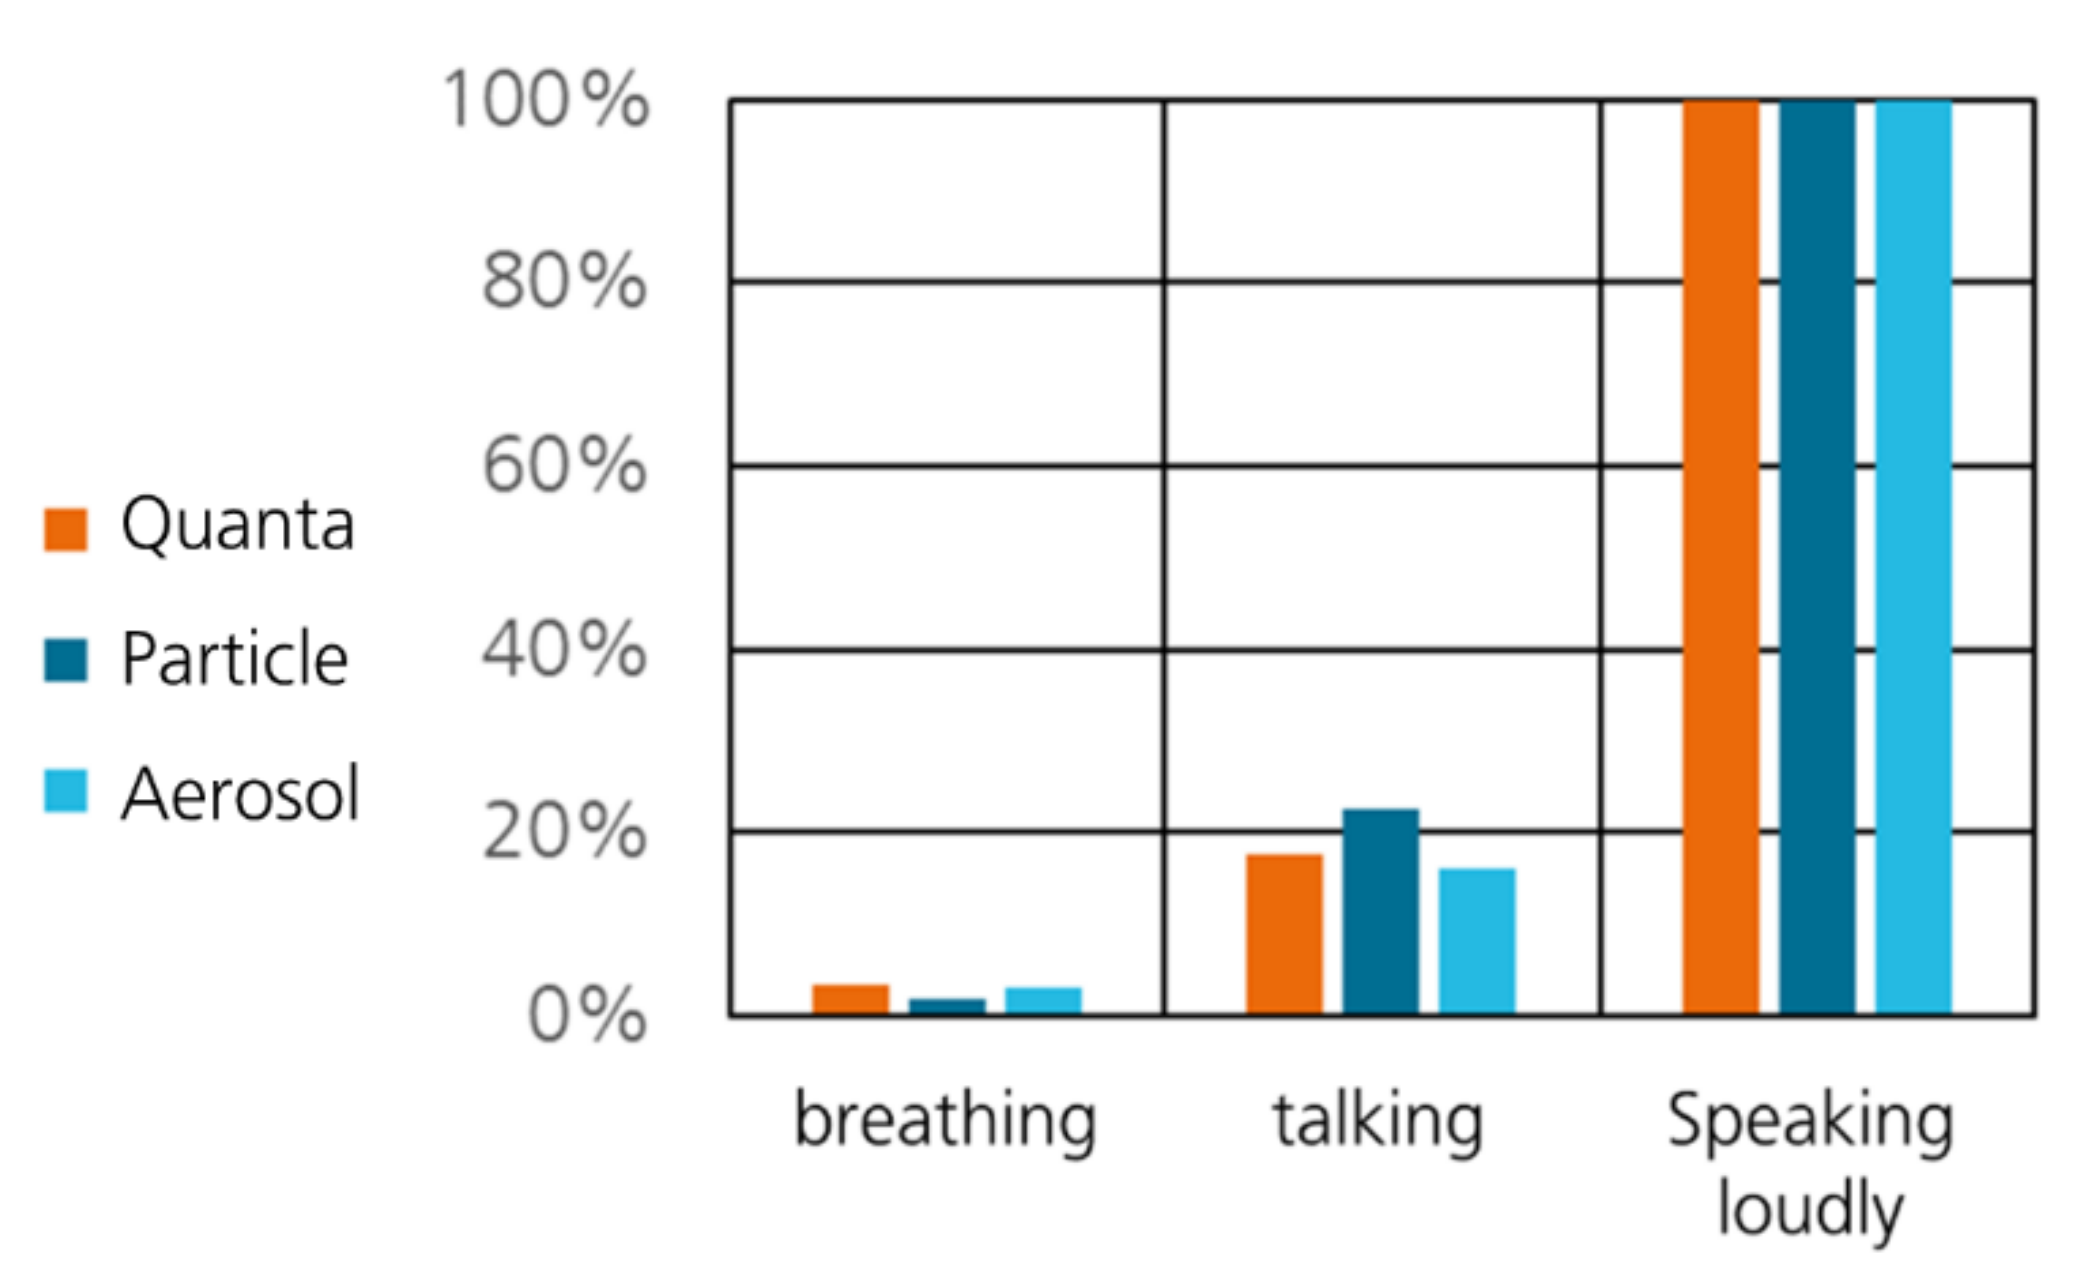
2.3.1. Viral Load
- Breathing: 2.3 quanta/h
- Talking: 11.4 quanta/h
- Speaking loudly: 65.1 quanta/h
2.3.2. CO2 Emission
2.3.3. Masks
- without mask
- mouth-nose protection (MNP) and homemade masks
- FFP2-mask
2.3.4. Ventilation
2.3.5. Partition Walls
2.3.6. Occupancy Density
2.4. Determination of Train, Bus and Station Types
3. Simulation
3.1. Input Data
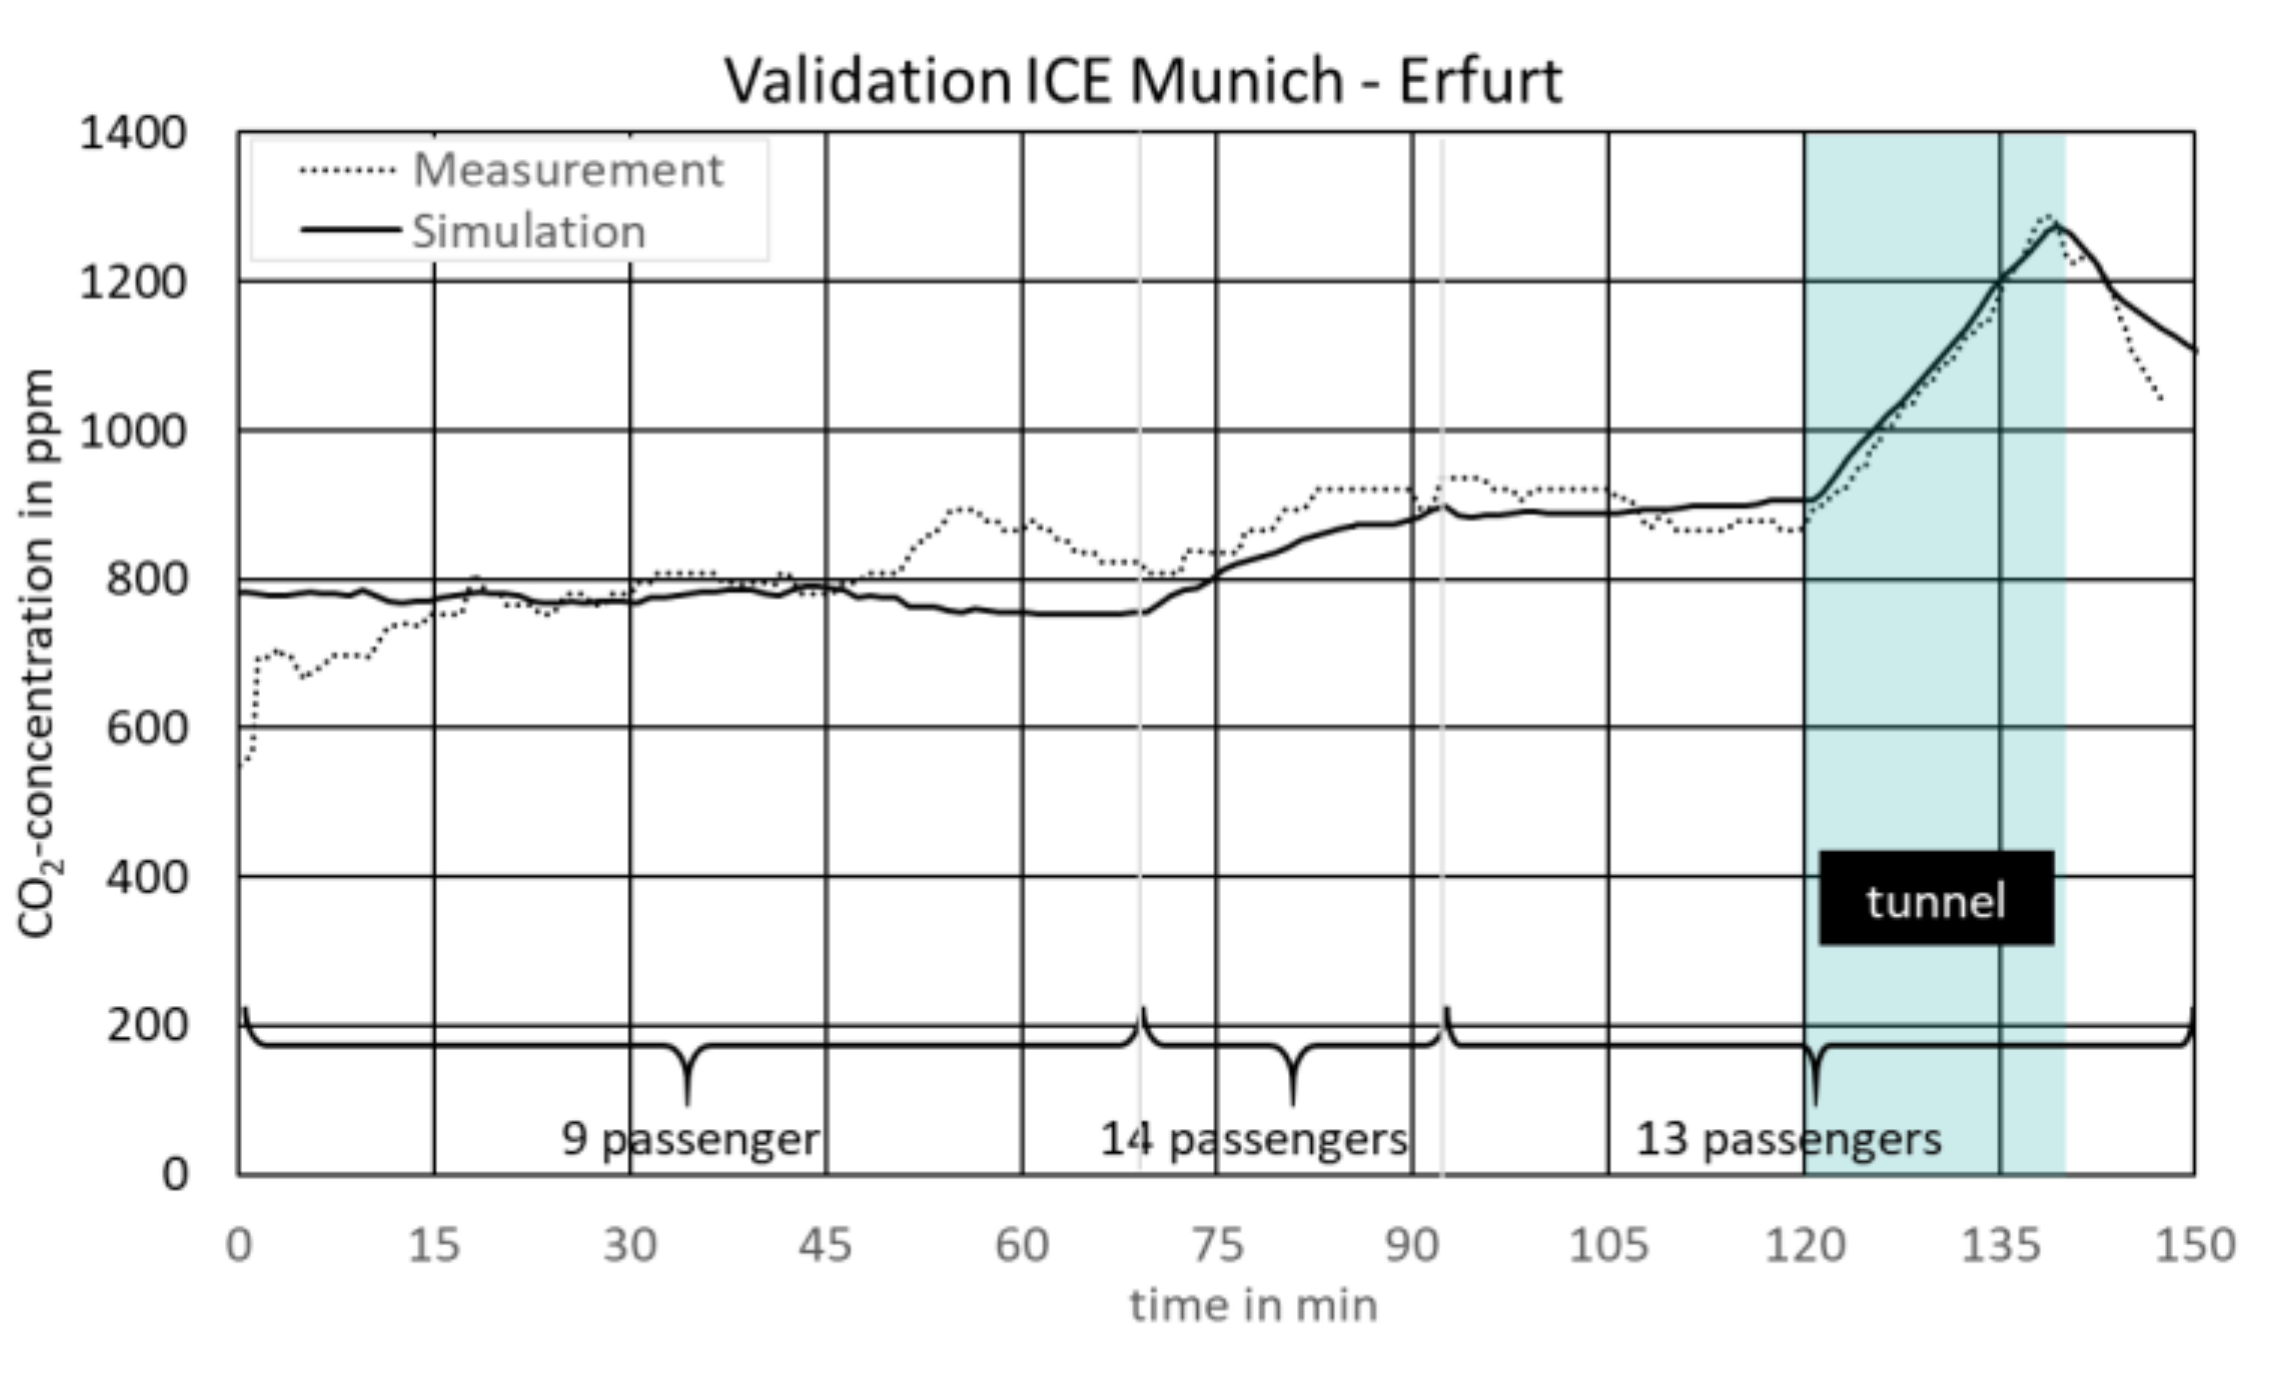
3.2. Validation
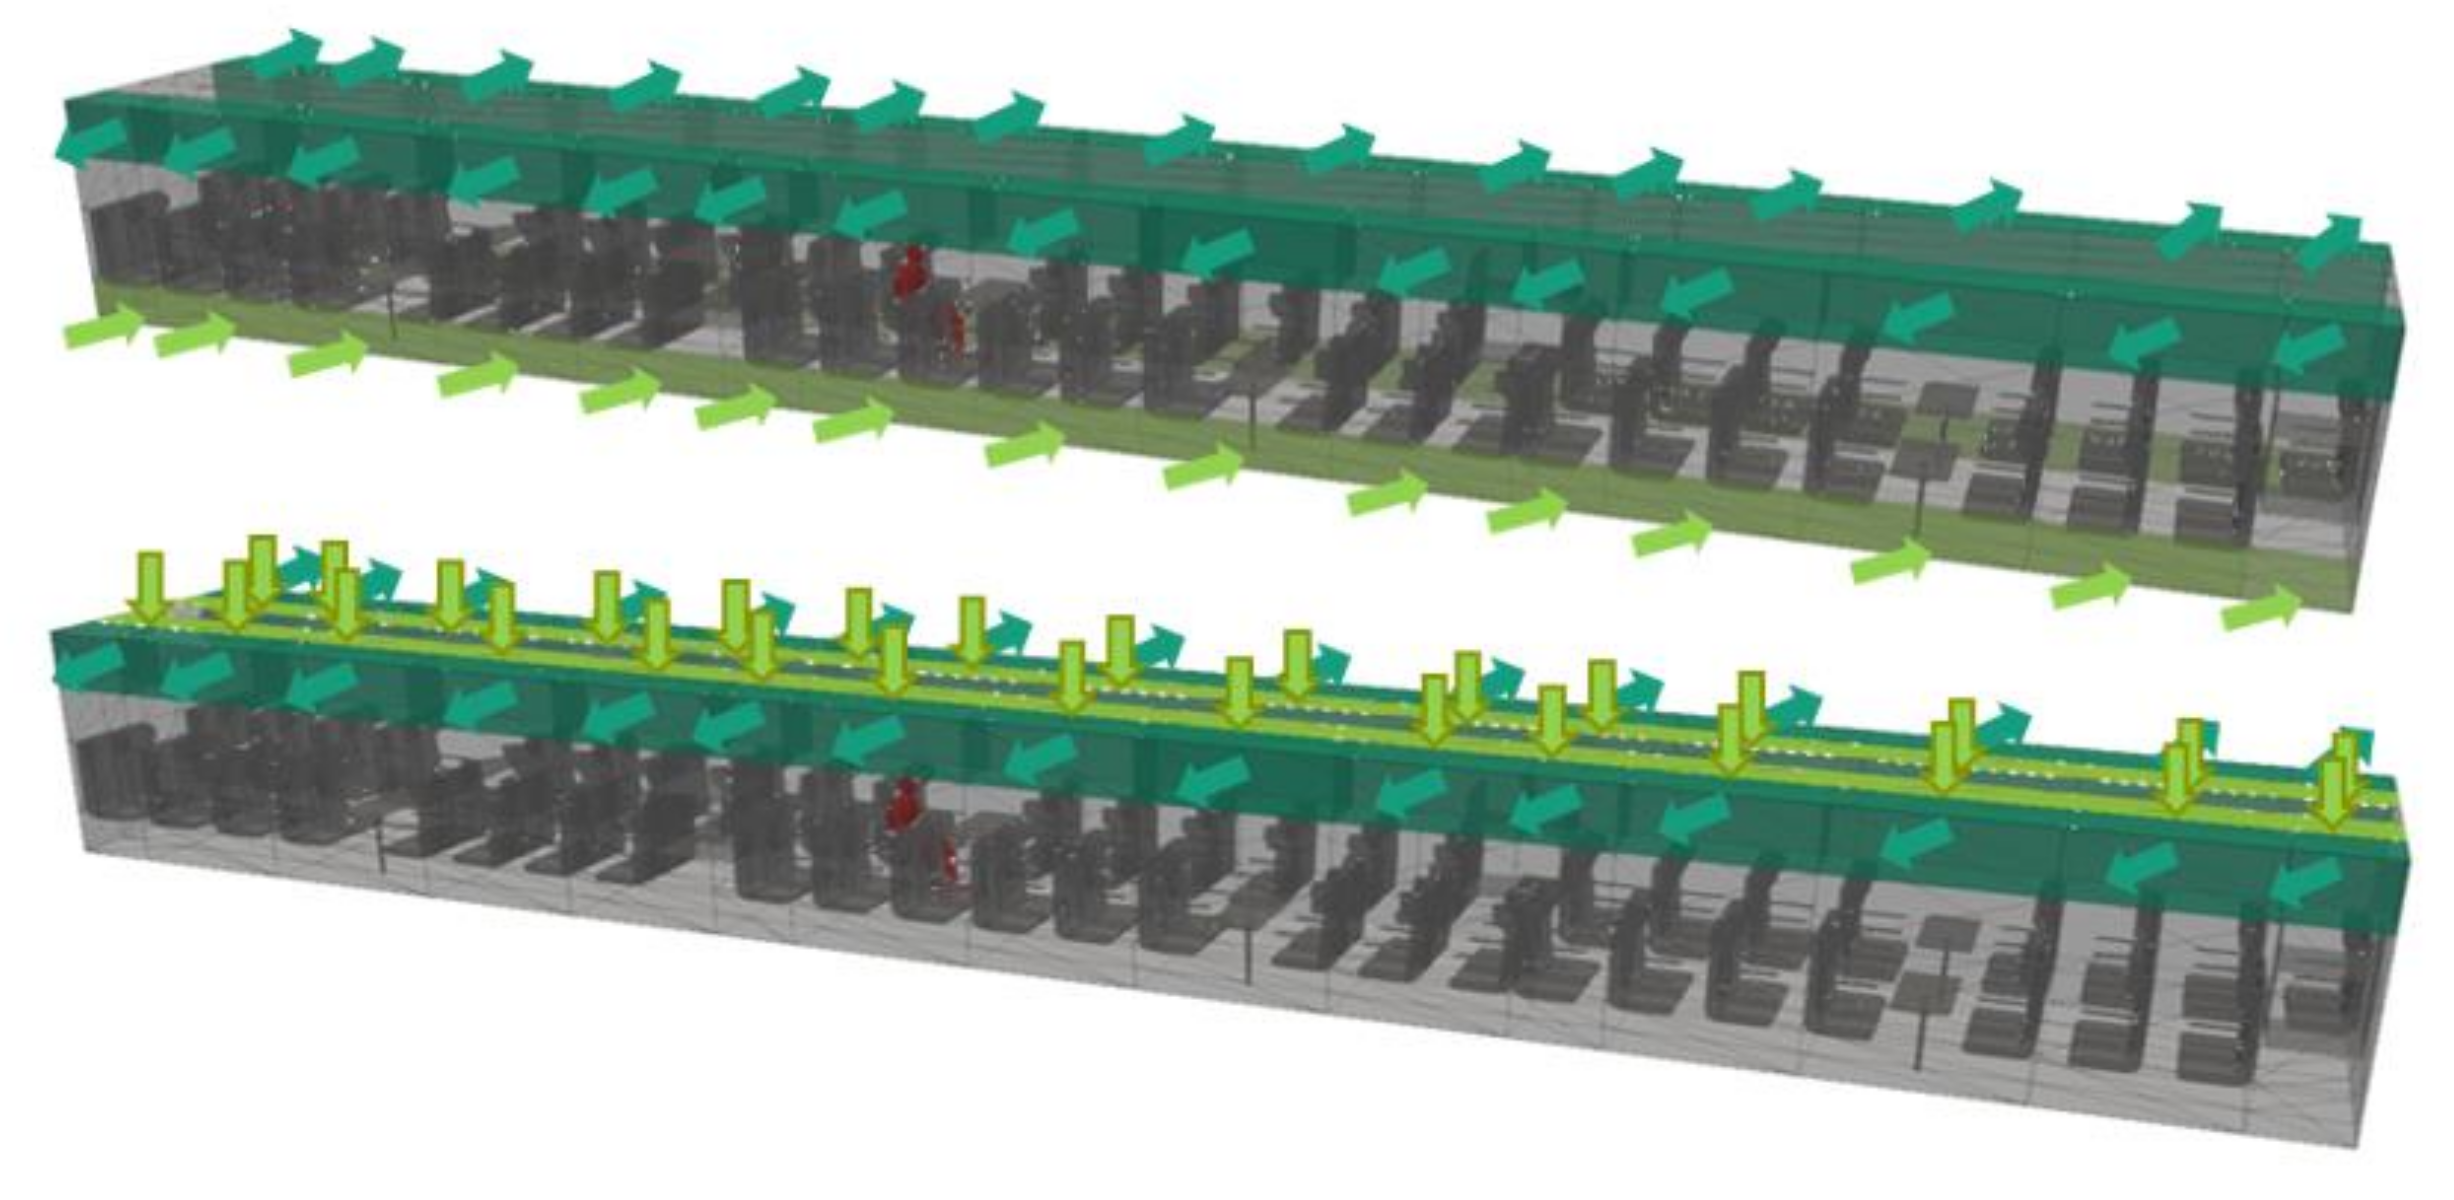
3.3. Main Results of Flow Simulations
3.4. Further Simulations
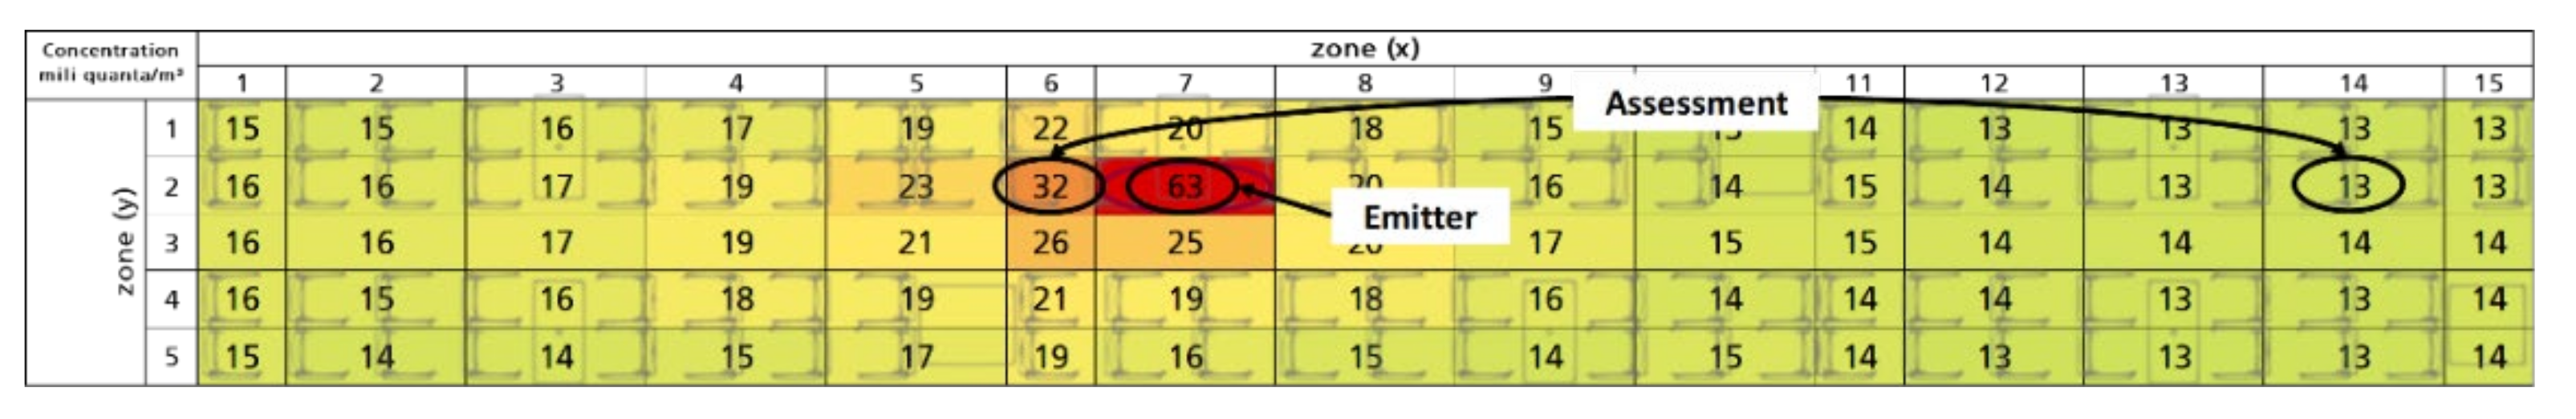
3.5. Risk Assessment
4. Results
5. Discussion
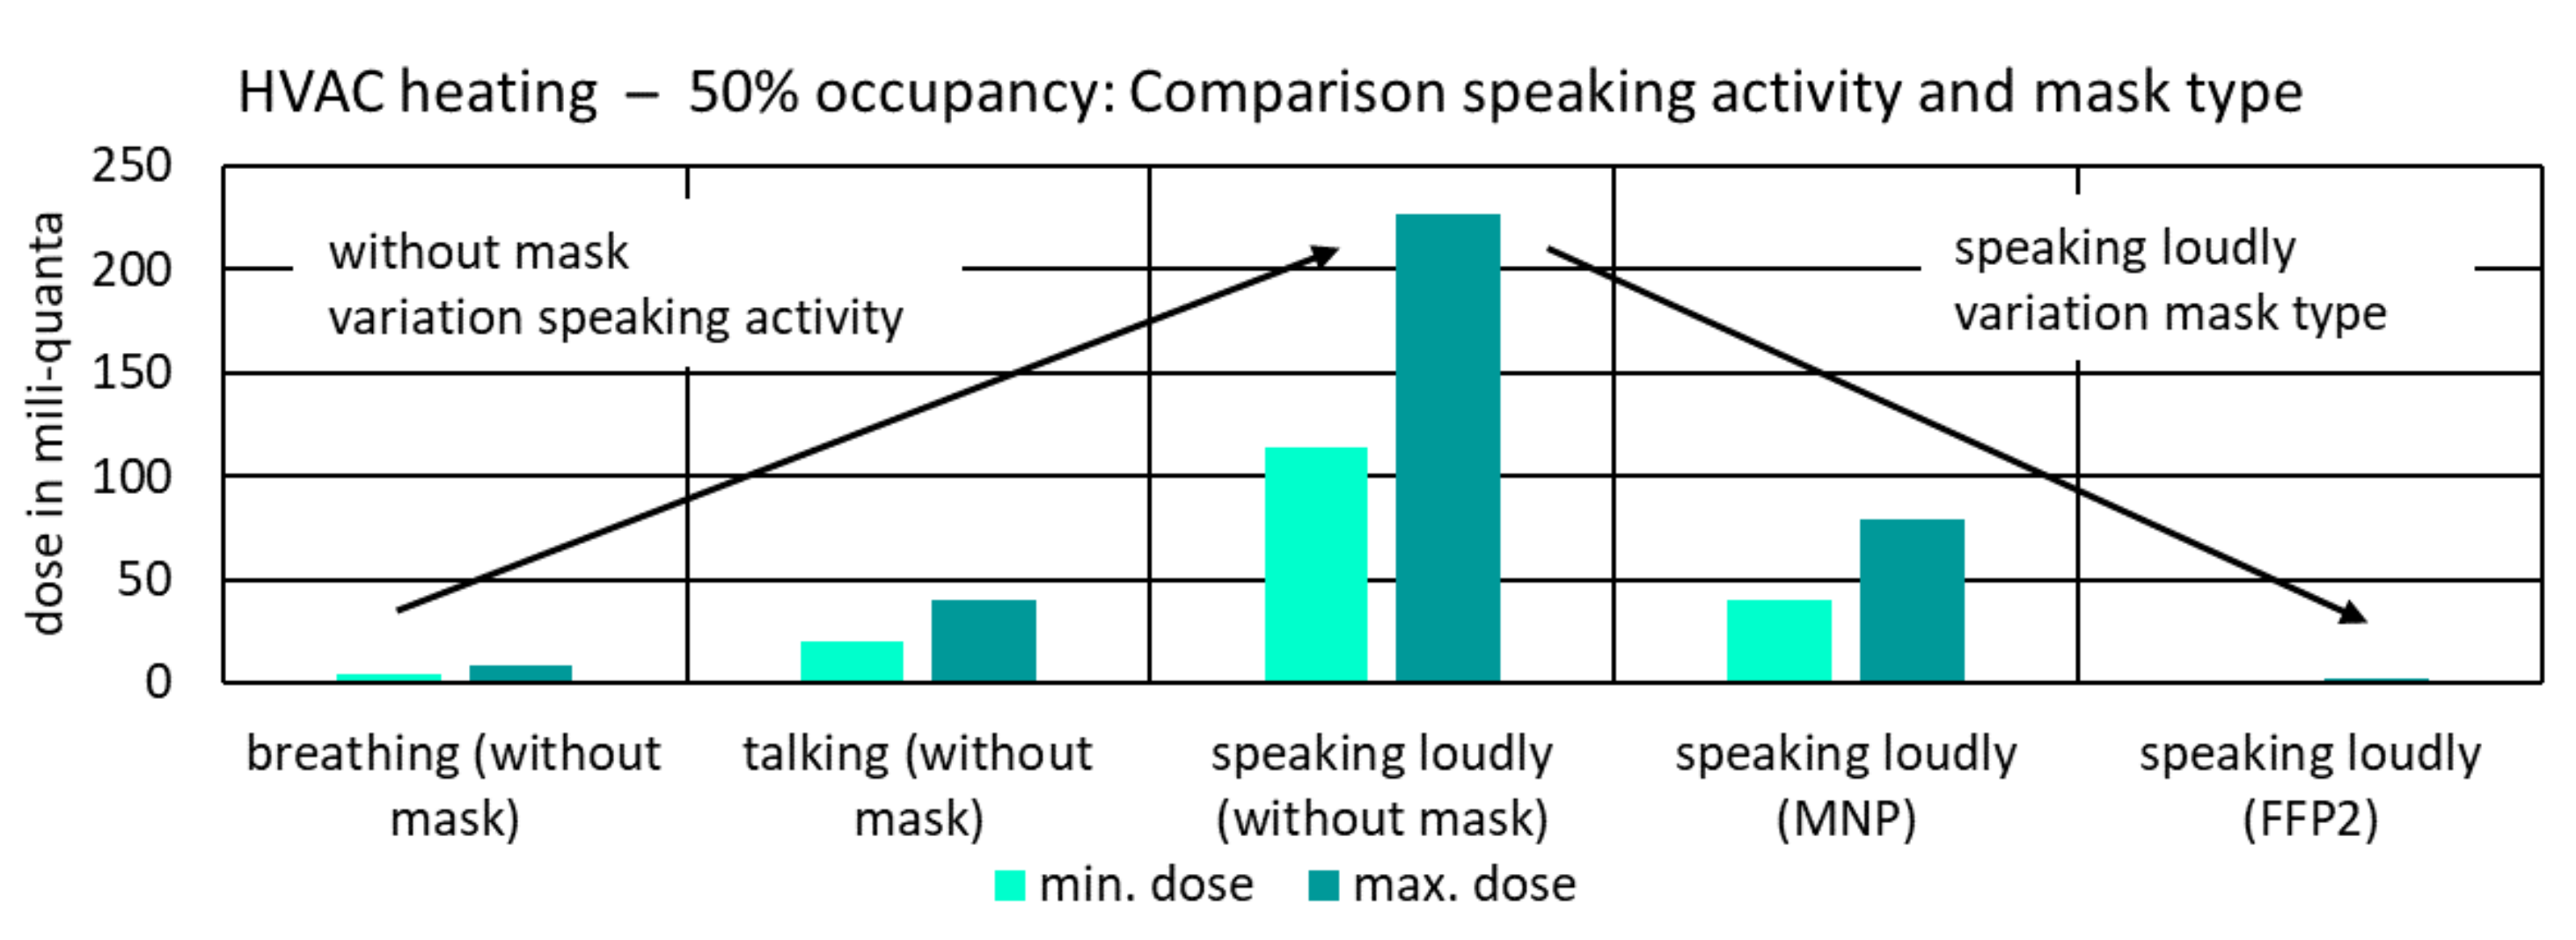
5.1. Influence of Input Parameters
5.2. Influence of Compliance
5.3. Influence of Occupancy
6. Conclusions
Author Contributions
Funding
Institutional Review Board Statement
Informed Consent Statement
Acknowledgments
Conflicts of Interest
References
- Scheuch, G. Breathing Is Enough: For the Spread of Influenza Virus and SARS-CoV-2 by Breathing Only. J. Aerosol Med. Pulm. Drug Deliv. 2020, 33, 230–234. [Google Scholar] [CrossRef] [PubMed]
- Wang, C.C.; Prather, K.A.; Sznitman, J.; Jimenez, J.L.; Lakdawala, S.S.; Tufekci, Z.; Marr, L.C. Airborne transmission of respiratory viruses. Science 2021, 373, 3–5. [Google Scholar] [CrossRef] [PubMed]
- Harrison, A.G.; Lin, T.; Wang, P. Mechanisms of SARS-CoV-2 Transmission and Pathogenesis. Trends Immunol. 2020, 41, 1100–1115. [Google Scholar] [CrossRef] [PubMed]
- Hadei, M.; Hopke, P.K.; Jonidi, A.; Shahsavani, A. A Letter about the Airborne Transmission of SARS-CoV-2 Based on the Current Evidence. Aerosol Air Qual. Res. 2020, 20, 911–914. [Google Scholar] [CrossRef] [Green Version]
- Morawska, L.; Cao, J. Airborne transmission of SARS-CoV-2: The world should face the reality. Environ. Int. 2020, 139, 1–2. [Google Scholar] [CrossRef] [PubMed]
- Nazari, A.; Jafari, M.; Rezaei, N.; Arash-Azad, S.; Talati, F.; Nejad-Rahim, R.; Taghizadeh-Hesary, F.; Taghizadeh-Hesary, F. Effects of High-speed Wind, Humidity, and Temperature on the Generation of a SARS-CoV-2 Aerosol; a Novel Point of View. Aerosol Air Qual. Res. 2021, 21, 200574. [Google Scholar] [CrossRef]
- Gameiro Da Silva, M. An analysis of the transmission modes of COVID-19 in light of the concepts of Indoor Air Quality. REHVA J. 2020, 3, 46–54. [Google Scholar] [CrossRef]
- Statistisches Bundesamt. Korrektur: 46% Weniger Fahrgäste im Fernverkehr mit Bussen und Bahnen im 1. Halbjahr. 2020. Available online: https://www.destatis.de/DE/Presse/Pressemitteilungen/2020/10/PD20_424_461.html (accessed on 9 February 2022).
- Tirachini, A.; Cats, O. COVID-19 and Public Transportation: Current Assessment, Prospects, and Research Needs. JPT 2020, 22. [Google Scholar] [CrossRef]
- Kutela, B.; Novat, N.; Langa, N. Exploring geographical distribution of transportation research themes related to COVID-19 using text network approach. Sustain. Cities Soc. 2021, 67, 102729. [Google Scholar] [CrossRef]
- Shen, J.; Duan, H.; Zhang, B.; Wang, J.; Ji, J.S.; Wang, J.; Pan, L.; Wang, X.; Zhao, K.; Ying, B.; et al. Prevention and control of COVID-19 in public transportation: Experience from China. Environ. Pollut. 2020, 266, 115291. [Google Scholar] [CrossRef]
- Heinrich, J.; Zhao, T.; Quartucci, C.; Herbig, B.; Nowak, D. SARS-CoV-2 Infektionen während Reisen mit Bahn und Bus. Ein systematisches Review epidemiologischer Studien. Gesundh. Bundesverb. Arzte Offentlichen Gesundh. 2021, 83, 581–592. [Google Scholar] [CrossRef] [PubMed]
- Arpino, F.; Grossi, G.; Cortellessa, G.; Mikszewski, A.; Morawska, L.; Buonanno, G.; Stabile, L. Risk of SARS-CoV-2 in a car cabin assessed through 3D CFD simulations. arXiv 2022, arXiv:2201.09958. [Google Scholar]
- Park, J.; Kim, G. Risk of COVID-19 Infection in Public Transportation: The Development of a Model. Int. J. Environ. Res. Public Health 2021, 18, 12790. [Google Scholar] [CrossRef]
- Woodward, H.; Fan, S.; Bhagat, R.K.; Dadonau, M.; Wykes, M.D.; Martin, E.; Hama, S.; Tiwari, A.; Dalziel, S.B.; Jones, R.L.; et al. Air Flow Experiments on a Train Carriage—Towards Understanding the Risk of Airborne Transmission. Atmosphere 2021, 12, 1267. [Google Scholar] [CrossRef]
- Will, H.; Scherer, C.; Stratbücker, S.; Norrefeldt, V.; Matheis, C.; Reith, A.; Schwitalla, C.; de Boer, J.; Neves Pimenta, D.; Zaglauer, M.; et al. Risikoeinschätzung zur Ansteckungsgefahr mit COVID-19 im Schienenpersonen—Sowie im Straßenpersonennah- und -Fernverkehr. Berichte des Deutschen Zentrums für Schienenverkehrsforschung, Nr. 12, Dresden. 2021. Available online: https://www.dzsf.bund.de/SharedDocs/Textbausteine/DZSF/Forschungsberichte/Forschungsbericht_2021-12.html (accessed on 9 February 2022).
- Norrefeldt, V.; Grün, G.; Sedlbauer, K. VEPZO—Velocity propagating zonal model for the estimation of the airflow pattern and temperature distribution in a confined space. Build. Environ. 2012, 48, 183–194. [Google Scholar] [CrossRef]
- Modelica Association. Modelica. Available online: https://modelica.org/ (accessed on 7 February 2022).
- Hartmann, A.; Lange, J.; Rotheudt, H.; Kriegel, M. Emissionsrate und Partikelgröße von Bioaerosolen beim Atmen, Sprechen und Husten. 2020. Available online: https://do.tu-berlin.de/bitstream/11303/11451/4/hartmann_etal_2020_de.pdf (accessed on 9 February 2022).
- Pathak, A.; Norrefeldt, V.; Lemouedda, A.; Grün, G. The Modelica Thermal Model Generation Tool for Automated Creation of a Coupled Airflow, Radiation Model and Wall Model in Modelica. In Proceedings of the 10th International Modelica Conference, Lund, Sweden, 10–12 March 2014; Linköping University Electronic Press: Linköping, Sweden, 2014; pp. 115–124. [Google Scholar]
- Buonanno, G.; Morawska, L.; Stabile, L. Quantitative assessment of the risk of airborne transmission of SARS-CoV-2 infection: Prospective and retrospective applications. Environ. Int. 2020, 145, 106–112. [Google Scholar] [CrossRef] [PubMed]
- Buonanno, G.; Stabile, L.; Morawska, L. Estimation of airborne viral emission: Quanta emission rate of SARS-CoV-2 for infection risk assessment. Environ. Int. 2020, 141, 105794. [Google Scholar] [CrossRef]
- Müller, D.; Rewitz, K.; Derwein, D.; Burgholz, T.M.; Schweiker, M.; Bardey, J.; Tappler, P. Abschätzung des Infektionsrisikos durch Aerosolgebundene Viren in Belüfteten Räumen (2. Überarbeitete und Korrigierte Auflage); RWTH Aachen Uviersity: Aachen, Germany, 2021. [Google Scholar]
- Jimenez, J.L. SARS-CoV-2 Aerosol Transmission Estimator; University of Colorado: Boulder, CO, USA, 2020. [Google Scholar]
- Asadi, S.; Wexler, A.S.; Cappa, C.D.; Barreda, S.; Bouvier, N.M.; Ristenpart, W.D. Aerosol emission and superemission during human speech increase with voice loudness. Sci Rep. 2019, 9, 2348. [Google Scholar] [CrossRef] [PubMed] [Green Version]
- Edwards, D.A.; Man, J.C.; Brand, P.; Katstra, J.P.; Sommerer, K.; Stone, H.A.; Nardell, E.; Scheuch, G. Inhaling to mitigate exhaled bioaerosols. Proc. Natl. Acad. Sci. USA 2004, 101, 17383–17388. [Google Scholar] [CrossRef] [Green Version]
- RWTH Aachen University. RisiCo. Available online: https://risico.eonerc.rwth-aachen.de/ (accessed on 15 February 2022).
- Lahrz, T.; Bischof, W.; Sagunski, H.; Baudisch, C.; Fromme, H.; Grams, H.; Gabrio, T.; Heinzow, B.; Müller, L. Gesundheitliche Bewertung von Kohlendioxid in der Innenraumluft. Mitteilungen der Ad-hoc-Arbeitsgruppe Innenraumrichtwerte der Innenraumlufthygiene-Kommission des Umweltbundesamtes und der Obersten Landesgesundheitsbehörden. Bundesgesundheitsblatt Gesundh. Gesundh. 2008, 51, 1358–1369. [Google Scholar] [CrossRef]
- Howard, J.; Huang, A.; Li, Z.; Tufekci, Z.; Zdimal, V.; van der Westhuizen, H.-M.; Von Delft, A.; Price, A.; Fridman, L.; Tang, L.-H.; et al. An evidence review of face masks against COVID-19. Proc. Natl. Acad. Sci. USA 2021, 118. [Google Scholar] [CrossRef] [PubMed]
- Grinshpun, S.A.; Haruta, H.; Eninger, R.M.; Reponen, T.; McKay, R.T.; Lee, S.-A. Performance of an N95 filtering facepiece particulate respirator and a surgical mask during human breathing: Two pathways for particle penetration. J. Occup. Environ. Hyg. 2009, 6, 593–603. [Google Scholar] [CrossRef] [PubMed]
- Davies, A.; Thompson, K.-A.; Giri, K.; Kafatos, G.; Walker, J.; Bennett, A. Testing the efficacy of homemade masks: Would they protect in an influenza pandemic? Disaster Med. Public Health Prep. 2013, 7, 413–418. [Google Scholar] [CrossRef]
- Nordquist, B. Vädring av Skolor—Ett Komplement till Normal Ventilation? Ph.D. Thesis, Department of Building Science, Lund Institute of Technology, Lund, Sweden, 1998. [Google Scholar]
- Deutscher Wetterdienst. Testreferenzjahre (TRY). 2021. Available online: https://www.dwd.de/DE/leistungen/testreferenzjahre/testreferenzjahre.html (accessed on 9 February 2022).
- Deutsche Bahn, AG. Daten & Fakten. 2019. Available online: https://assets.static-bahn.de/dam/jcr:1289cfc8-512e-42c3-a7e3-04302f1784c7/233600-311901.pdf (accessed on 9 February 2022).
- Deutsche Bahn, AG. Kennzahlen der DB Regio nach Geschäftsbereichen. Available online: https://www.dbregio.de/wir/zahlen-daten-fakten (accessed on 9 February 2022).
- Deutsche Bahn, AG. Züge im Fernverkehr: Zugtypen und Ihre Strecken: ICE 4. Available online: https://www.bahn.de/p/view/service/zug/fahrzeuge/zugtypen.shtml?dbkanal_007=L01_S01_D001_KIN_-rs-zug_NAVIGATION-fahrzeuge_LZ01 (accessed on 9 February 2022).
- Schwandl, R. Tram Atlas Deutschland 5, 5th ed.; Revidierte Ausgabe; Robert Schwandl: Berlin, Germany, 2019; ISBN 9783936573602. [Google Scholar]
- Maibaum, C.-A. Strassenbahn-Online. Available online: http://www.strassenbahn-online.de/ (accessed on 9 February 2022).
- Esser, B. Tram-info. Available online: https://www.tram-info.de/ (accessed on 9 February 2022).
- Verband Deutscher Verkehrsunternehmen VDV. VDV-Statistik & Jahresbericht. Available online: https://www.vdv.de/statistik-jahresbericht.aspx (accessed on 9 February 2022).
- Stade, C. Gleispläne der Webseite gleisplanweb.de. Available online: https://gleisplanweb.eu/ (accessed on 9 February 2022).
- Deutsche Bahn, AG. Produktmanagement ICE: Fahrzeuglexikon für den Fernverkehr. Available online: http://download-data.deutschebahn.com/static/datasets/fahrzeuglexikon/Fahrzeuglexikon_2017.pdf (accessed on 9 February 2022).
- Siemens, A.G. Der Icx—Eine Neue Ära im Fernverkehr der Deutschen Bahn. Available online: https://docplayer.org/37850426-Siemens-com-mobility-der-icx-eine-neue-aera-im-fernverkehr-der-deutschen-bahn.html (accessed on 9 February 2022).
- Scharff, S. Markteinführung des TALENT 3 mit Ausblick. In Sonderheft Graz; Statistisches Amt: Graz, Austria, 2017; p. 141. [Google Scholar]
- Vlexx GmbH. Datenblatt Bombardier Talent 3. Available online: https://www.vlexx.de/ueber-uns/fahrzeugflotte/talent3/ (accessed on 9 February 2022).
- EvoBus GmbH. Die Citaro Stadtbusse. Technische Information. Available online: https://www.mercedes-benz-bus.com/de_DE/buy/services-online/download-technical-brochures.html#content/headline_840766654_c (accessed on 9 February 2022).
- HeiterBlick GmbH. TW3000 Hannover Datenblatt. Available online: https://www.heiterblick.de/fahrzeuge/hochflur/tw-3000/ (accessed on 9 February 2022).
- Münchner Verkehrsgesellschaft mbH. Website der Münchner Verkehrsgesellschaft mbH (MVG). Available online: https://www.mvg.de/ (accessed on 9 February 2022).
- Norta, M.; Valleé, D. Ein Verkehrsmittelwahlmodell für den Personenfernverkehr auf der Basis von Verkehrswiderständen. Ph.D. Thesis, University of Aachen, Aachen, Germany, 2012. [Google Scholar]
- Kebdani, Z. Ventilation of subway stations. Personal communication, 2021.
- DIN—Deutsches Institut für Normung e.V. DIN EN 14750-1; Bahnanwendungen—Luftbehandlung in Schienenfahrzeugen des Innerstädtischen und Regionalen Nahverkehrs—Teil 1: Behaglichkeitsparameter; Deutsches Institut für Normung: Berlin, Germany, 2006. [Google Scholar]
- Schumann, L.; Lange, J.; Rotheudt, H.; Hartmann, A.; Kriegel, M. Experimentelle Untersuchung der Leckage und Abscheideleistung von typischen Mund-Nasen-Schutz und Mund-Nasen-Bedeckungen zum Schutz vor luftgetragenen Krankheitserregern, Berlin. 2020. Available online: https://www.depositonce.tu-berlin.de/handle/11303/11975 (accessed on 9 February 2022).
- Hu, M.; Lin, H.; Wang, J.; Xu, C.; Tatem, A.J.; Meng, B.; Zhang, X.; Liu, Y.; Wang, P.; Wu, G.; et al. Risk of Coronavirus Disease 2019 Transmission in Train Passengers: An Epidemiological and Modeling Study. Clin. Infect. Dis. 2021, 72, 604–610. [Google Scholar] [CrossRef] [PubMed]
- Luo, K.; Lei, Z.; Hai, Z.; Xiao, S.; Rui, J.; Yang, H.; Jing, X.; Wang, H.; Xie, Z.; Luo, P.; et al. Transmission of SARS-CoV-2 in Public Transportation Vehicles: A Case Study in Hunan Province, China. Open Forum Infect. Dis. 2020, 7, ofaa430. [Google Scholar] [CrossRef]
- Shen, Y.; Li, C.; Dong, H.; Wang, Z.; Martinez, L.; Sun, Z.; Handel, A.; Chen, Z.; Chen, E.; Ebell, M.H.; et al. Community Outbreak Investigation of SARS-CoV-2 Transmission Among Bus Riders in Eastern China. JAMA Intern. Med. 2020, 180, 1665–1671. [Google Scholar] [CrossRef]
- Qian, H.; Miao, T.; Liu, L.; Zheng, X.; Luo, D.; Li, Y. Indoor transmission of SARS-CoV-2. Indoor Air 2021, 31, 639–645. [Google Scholar] [CrossRef]
- Moreno, T.; Pintó, R.M.; Bosch, A.; Moreno, N.; Alastuey, A.; Minguillón, M.C.; Anfruns-Estrada, E.; Guix, S.; Fuentes, C.; Buonanno, G.; et al. Tracing surface and airborne SARS-CoV-2 RNA inside public buses and subway trains. Environ. Int. 2021, 147, 106326. [Google Scholar] [CrossRef]


| Quanta | Particle | Aerosol | ||||
|---|---|---|---|---|---|---|
| Literature | [24] | [21,22] | [25] | [26] | [23] | [27] |
| Breathing | 2.3 quanta/h | Double logarithmic plots and information on percentiles | 0.1 particle/s | Normal: 14–71 particle/L | 0.0018 mL/m3 | Online calculator, based on [23], use of a stochastic approach for risk assessment. |
| Talking | 11.4 quanta/h | 1.2 particle/s | 0.0096 mL/m3 | |||
| Speaking Loudly | 65.1 quanta/h | 5.3 particle/s Max.: 17 particle/s | 0.06 mL/m3 | |||
| Super Emitter | factor 102 | 660–3230 p/L (factor 102) | 660–3230 p/L (factor 102) | no | ||
| Assessment | Introduced specifically for SARS-CoV-2 Allows super emitter assessment Theoretical risk assessment | Reference literature is not SARS-CoV-2 specific. Divergent data on super emitters. | No information on super emitters. Theoretical risk assessment derived, specifically introduced for SARS-CoV-2. | |||
| Mask Type | Reduction Exhalation | Reduction Inhalation |
|---|---|---|
| without | 0% | 0% |
| (MNP) or homemade mask | 50% | 30% |
| FFP2 (N95) mask | 90% | 90% |
| Means of Transport | Type | Selection Criterion | Literature |
|---|---|---|---|
| Long-Distance Train | ICE high-capacity train | Most common type | [34,35,36] |
| Regional Train/Local Traffic | multiple-unit train TALENT 2/3 (Bombardier Transportation) | Very common type, Detailed data basis | [34,35,36] |
| Subway/Light Rail Vehicles | Munich subway (A series) Munich subway (C series) | Most common length (15 to 30 m) Future increase in frequency expected | [37] |
| Tram/Streetcar | Flexity Berlin (Bombardier Transportation) | Most common length (30 m) | [37,38,39,40] |
| Suburban Train | TALENT 2 (Bombardier Transportation) | Typical vehicle dimensions, Detailed data basis | - |
| City Bus | 12 m Bus | Most common type, Length | [40] |
| Long-Distance Bus | FDH2 bus | Possibility of in situ measurements | [41] |
| Station | Subway platform in low position with central platform, station concourse of terminus station (half-open) | Most common platform type for subway, limiting case (underground) |
| Means of Transport | Stop Time | Travel Time Between Stations | Total Travel Duration | Literature |
|---|---|---|---|---|
| Long-Distance Train | negligible | 2.5 h | 2.5 h | Measurement period during validation |
| Regional Train/Local Traffic | 52 s (1 door) | 295 s | 98 min | Research on travel and stop times |
| Subway/Light Rail Vehicles | 25 s (3 doors) | 72 s | 29.5 min | Research on travel and stop times [48,51] |
| Tram/Streetcar | 17 s (2 doors) | 65 s | 25 min | Research on travel and stop times |
| Suburban Train | 36 s (2 doors) | 127 s | 77 min | Research on travel and stop times |
| City Bus | 12 s (2 doors) | 70 s | 21.5 min | Research on travel and stop times |
| Long-Distance Bus | negligible | 2.5 h | 2.5 h | Comparability with long-distance train |
| Stations | - | - | 12–35 min (depending on reason for travel and time of day) | [49] |
| Without Mask | With MNP | With FFP2-Mask | ||||
|---|---|---|---|---|---|---|
| Min. Dose | Max. Dose | Min. Dose | Max. Dose | Min. Dose | Max. Dose | |
| Long-Distance Train (2.5 h) | 6.09 | 8.33 | 2.13 | 2.96 | 0.06 | 0.08 |
| Regional Train/Local Traffic (98 min) | 0.97 | 3.01 | 0.34 | 1.05 | 0.01 | 0.03 |
| Old/New Subways (29.5 min) | 0.07/0.03 | 1.52/1.52 | 0.02/0.01 | 0.53/0.53 | 0.00/0.00 | 0.02/0.02 |
| Tram/Streetcar (25 min) | 0.16 | 0.87 | 0.05 | 0.30 | 0.00 | 0.01 |
| Suburban Train (77 min) | 0.30 | 0.96 | 0.10 | 0.33 | 0.00 | 0.01 |
| City Bus (21.5 min) | 0.41 | 3.16 | 0.14 | 1.10 | 0.00 | 0.03 |
| Long-Distance Bus (2.5 h) | 3.91 | 6.24 | 1.37 | 2.18 | 0.04 | 0.06 |
| Train Station Hall (35 min) | 0.00 | 0.09 | 0.00 | 0.03 | 0.00 | 0.00 |
| Underground Station (8 min) | 0.00 | 0.04 | 0.00 | 0.01 | 0.00 | 0.00 |
| Without Mask | With MNP | With FFP2-Mask | ||||
|---|---|---|---|---|---|---|
| Min. Dose | Max. Dose | Min. Dose | Max. Dose | Min. Dose | Max. Dose | |
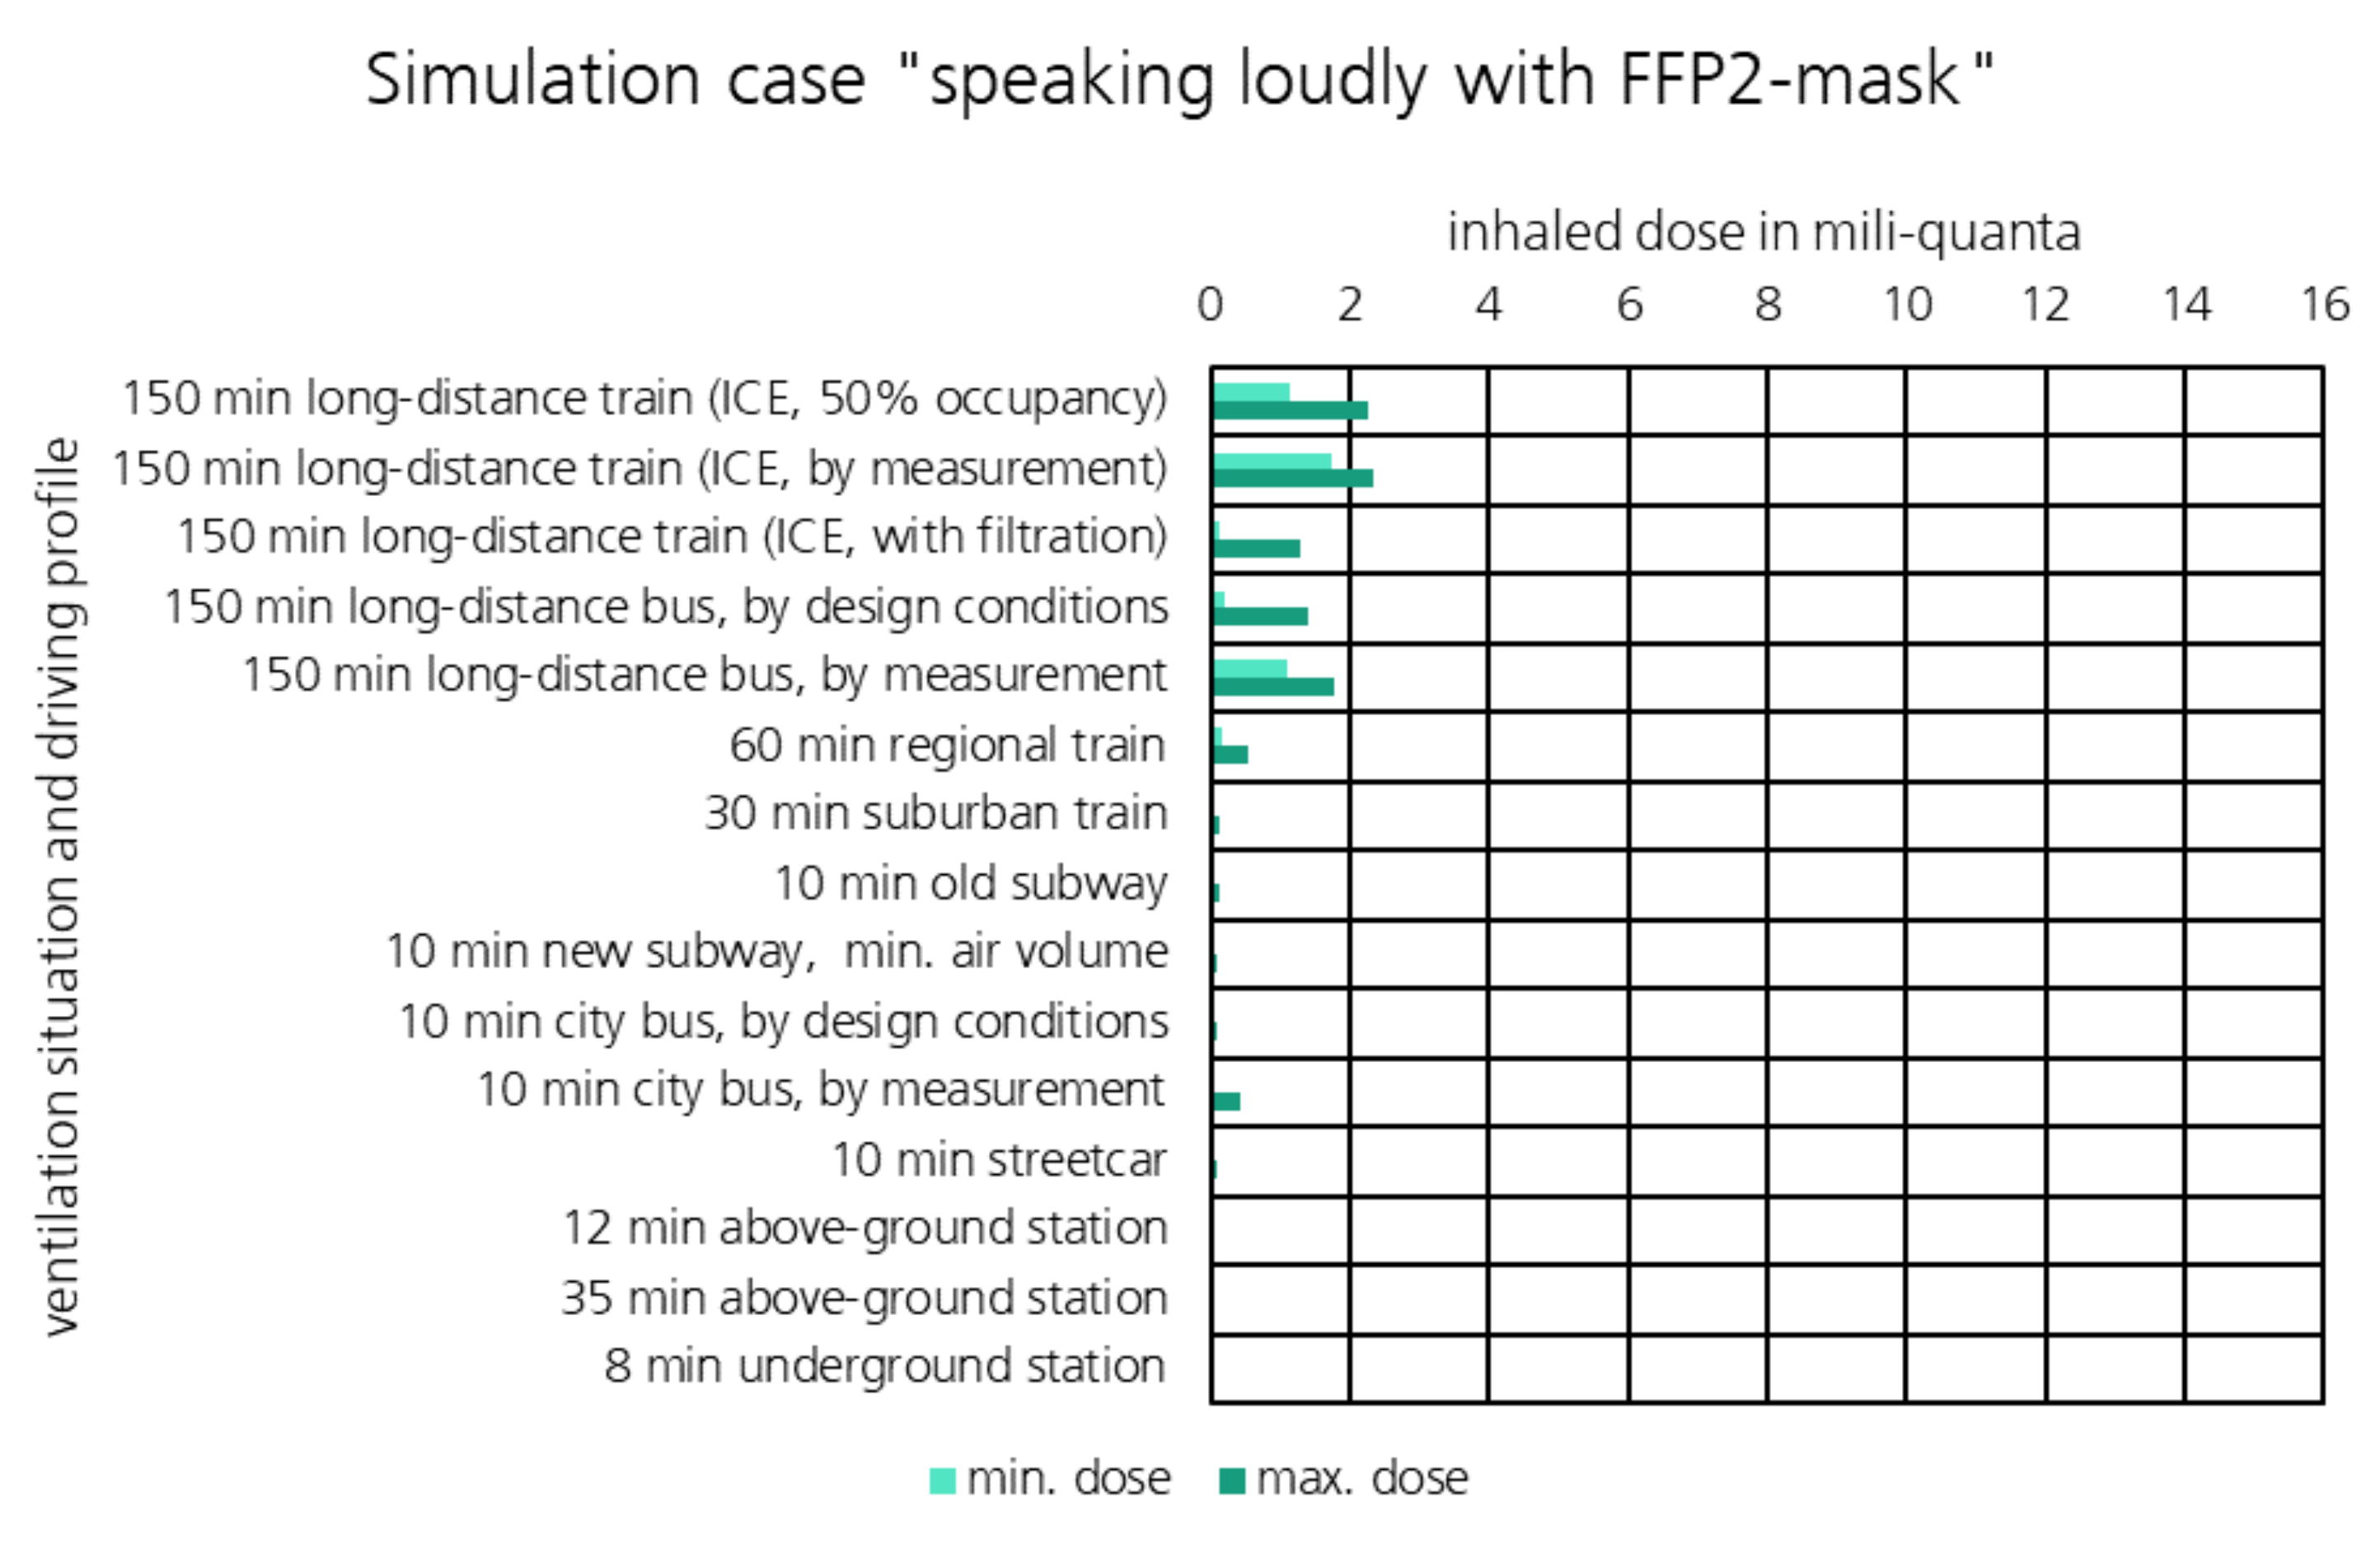
| Long-Distance Train (2.5 h) | 172.47 | 235.86 | 60.37 | 82.55 | 1.72 | 2.36 |
| Regional Train/Local Traffic (98 min) | 27.49 | 85.15 | 9.62 | 29.80 | 0.27 | 0.85 |
| Old/New Subways (29.5 min) | 2.01/0.74 | 43.12/42.95 | 0.70/0.26 | 15.09/15.03 | 0.02/0.01 | 0.43/0.43 |
| Tram/Streetcar (25 min) | 4.41 | 24.59 | 1.54 | 8.61 | 0.04 | 0.25 |
| Suburban Train (77 min) | 8.45 | 27.09 | 2.96 | 2.48 | 0.08 | 0.27 |
| City Bus (21.5 min) | 11.62 | 89.34 | 4.07 | 31.27 | 0.12 | 0.89 |
| Long-Distance Bus (2.5 h) | 110.60 | 176.64 | 38.71 | 61.82 | 1.11 | 1.77 |
| Train Station Hall (35 min) | 0.05 | 2.45 | 0.02 | 0.86 | 0.00 | 0.02 |
| Underground Station (8 min) | 0.01 | 1.10 | 0.00 | 0.38 | 0.00 | 0.01 |
Publisher’s Note: MDPI stays neutral with regard to jurisdictional claims in published maps and institutional affiliations. |
© 2022 by the authors. Licensee MDPI, Basel, Switzerland. This article is an open access article distributed under the terms and conditions of the Creative Commons Attribution (CC BY) license (https://creativecommons.org/licenses/by/4.0/).
Share and Cite
Matheis, C.; Norrefeldt, V.; Will, H.; Herrmann, T.; Noethlichs, B.; Eckhardt, M.; Stiebritz, A.; Jansson, M.; Schön, M. Modeling the Airborne Transmission of SARS-CoV-2 in Public Transport. Atmosphere 2022, 13, 389. https://doi.org/10.3390/atmos13030389
Matheis C, Norrefeldt V, Will H, Herrmann T, Noethlichs B, Eckhardt M, Stiebritz A, Jansson M, Schön M. Modeling the Airborne Transmission of SARS-CoV-2 in Public Transport. Atmosphere. 2022; 13(3):389. https://doi.org/10.3390/atmos13030389
Chicago/Turabian StyleMatheis, Christina, Victor Norrefeldt, Harald Will, Tobias Herrmann, Ben Noethlichs, Michael Eckhardt, André Stiebritz, Mattias Jansson, and Martin Schön. 2022. "Modeling the Airborne Transmission of SARS-CoV-2 in Public Transport" Atmosphere 13, no. 3: 389. https://doi.org/10.3390/atmos13030389
APA StyleMatheis, C., Norrefeldt, V., Will, H., Herrmann, T., Noethlichs, B., Eckhardt, M., Stiebritz, A., Jansson, M., & Schön, M. (2022). Modeling the Airborne Transmission of SARS-CoV-2 in Public Transport. Atmosphere, 13(3), 389. https://doi.org/10.3390/atmos13030389