Abstract
Cirrus clouds contain a large number of irregular small ice crystals. These solid ice crystals cause energy loss and reduce the signal-to-noise ratio at the receiver, causing errors in reception. Considering the random motion and structural diversity of ice particles in cirrus clouds, the discrete dipole approximation method was used to establish sphere-sphere, sphere–ellipsoid, sphere-hexagonal prism, and sphere-hexagonal plate ice particle models. The effects of different agglomerated ice particles on the laser extinction, absorption, and scattering efficiency, as well as the laser intensity and Mueller matrix elements, were analyzed, and the scattering characteristics of agglomerated ice particles in different spatial orientations were preliminarily explored. The results show that the spatial orientation of the clustered particles has great influence on the scattering characteristics. The maximum relative error of the scattering efficiency was 200%, and the maximum relative error value of the elements of the Mueller matrix reaches 800-fold. The results of this study provide theoretical support for further analysis of the scattering characteristics of ice crystal particles with complex agglomeration structures and for further study of the scattering characteristics of randomly moving agglomeration particles in cirrus clouds.
1. Introduction
To understand the influence of ice crystal particles in cirrus clouds on laser signals, it is necessary to study the scattering characteristics of various complex particles [1,2]. The scattering calculation of the ice crystal particles usually equates the structure of the ice crystal particles to spherical particles of equal volume [3]. A single axisymmetric spherical ice crystal particle is taken as the research object to solve the scattering problem of ice crystal particles in cirrus clouds to a certain extent. However, with the deepening of research, Wang et al. [4] pointed out that, when studying the attenuation efficiency of non-spherical ice crystals, hexagonal ice crystals and elliptical ice crystals in actual ice clouds are regarded as spherical particles with the same volumes, so their attenuation and scattering are underestimated. Xie et al. [5] studied the aspect ratio, size, frequency band, and direction of non-spherical single hexagonal prism ice crystal particles in the terahertz frequency band. Yang et al. [6] used the finite-difference time domain and T-matrix methods to calculate single spheroidal ice crystal particles, including bullet rose type, droplet type, and hollow column type, and established a database of 49 incident wavelengths (3–100 µm ) and particle sizes (2–1000 µm), which comprehensively enriched the research on sphericity. Ke [7] and Ren et al. [8] optimized the internal structure of ice crystal particles and proposed ice crystal particle models with a water-hockey shape and a water-ice hexagonal plate core–shell structure. By increasing the number of ice crystal particles used to form a clustered structure, they expected to further approximate the microstructure of ice crystal particles in cirrus clouds in nature in terms of the quantity. A technique for measuring BSPM elements with lidar is described by Kaul et al. [9]. It is found that the orientation of coarse particles with large diameters in an azimuthal direction and in a horizontal position is more probable than in a random direction. However, with the improvement of the cirrus cloud ice crystal particle capture technology, a clearer understanding of the microscale details of cirrus particles has been attained. In 2021, Magee et al. [10] developed a cryoencapsulated balloon system to capture ice particles and observe the microscopic morphology of particles via cryoscanning electron microscopy. They found that cirrus clouds are formed from random clumps of amorphous ice crystals of various shapes. At present, most studies have focused on the agglomeration model of regular ice crystal particles such as spheres, ellipsoids, cylinders, and particles with the same geometric structure, but these studies did not consider the agglomeration of ice crystal particles with different structures and the non-uniformity of the distribution and randomness of the movement of the agglomeration particles.
Based on the latest observations of Xiao et al. [1] and Magee et al. [10], in this study, the ice crystal particle shapes accounting for the largest proportion of particles were taken as the research object. Considering the inhomogeneity and randomness of ice crystal distribution, four ice crystal agglomeration models are established, including sphere–sphere, sphere–ellipsoid, sphere-hexagonal plate, and sphere-hexagonal prism models.
2. DDA Method and Agglomeration Model
2.1. Discrete Dipole Approximation (DDA)
The DDA approximates the target object with an array of dipoles [11] to calculate the scattering of particles with arbitrary geometries. This method can be used to study particles with a spatial size equivalent to the incident wavelength [12]. In the calculation, we found that a strict compliance with the DDA criteria without regard to the resultant quantities may either lead to erroneous conclusions or waste of precious computing resources. The extinction efficiency and scattering efficiency are generally much less sensitive to those criteria, and it is usually sufficient to let the value of density be around 1 or greater. On the other hand, the Mueller matrix elements() are small in magnitude and sensitive to the fine structure of aggregate, requiring densities of about 0.5 or less.
In this way, we can use Discrete Dipole Scattering (DDSCAT) code to estimate the number of typical dipoles needed to obtain reliable results. Therefore, when applying DDA calculation, we consider: (1) For a complex refractive index medium, if the imaginary part is small compared with the real part of the refractive index, it satisfies . In order to calculate the scattering phase function accurately, the standard is changed to . (2) In order to meet the requirements of calculation accuracy, for the calculation of the finite scatterer target, the minimum number of dipoles required is , which is set to 2300 in this paper.
2.2. Agglomeration Structural Model
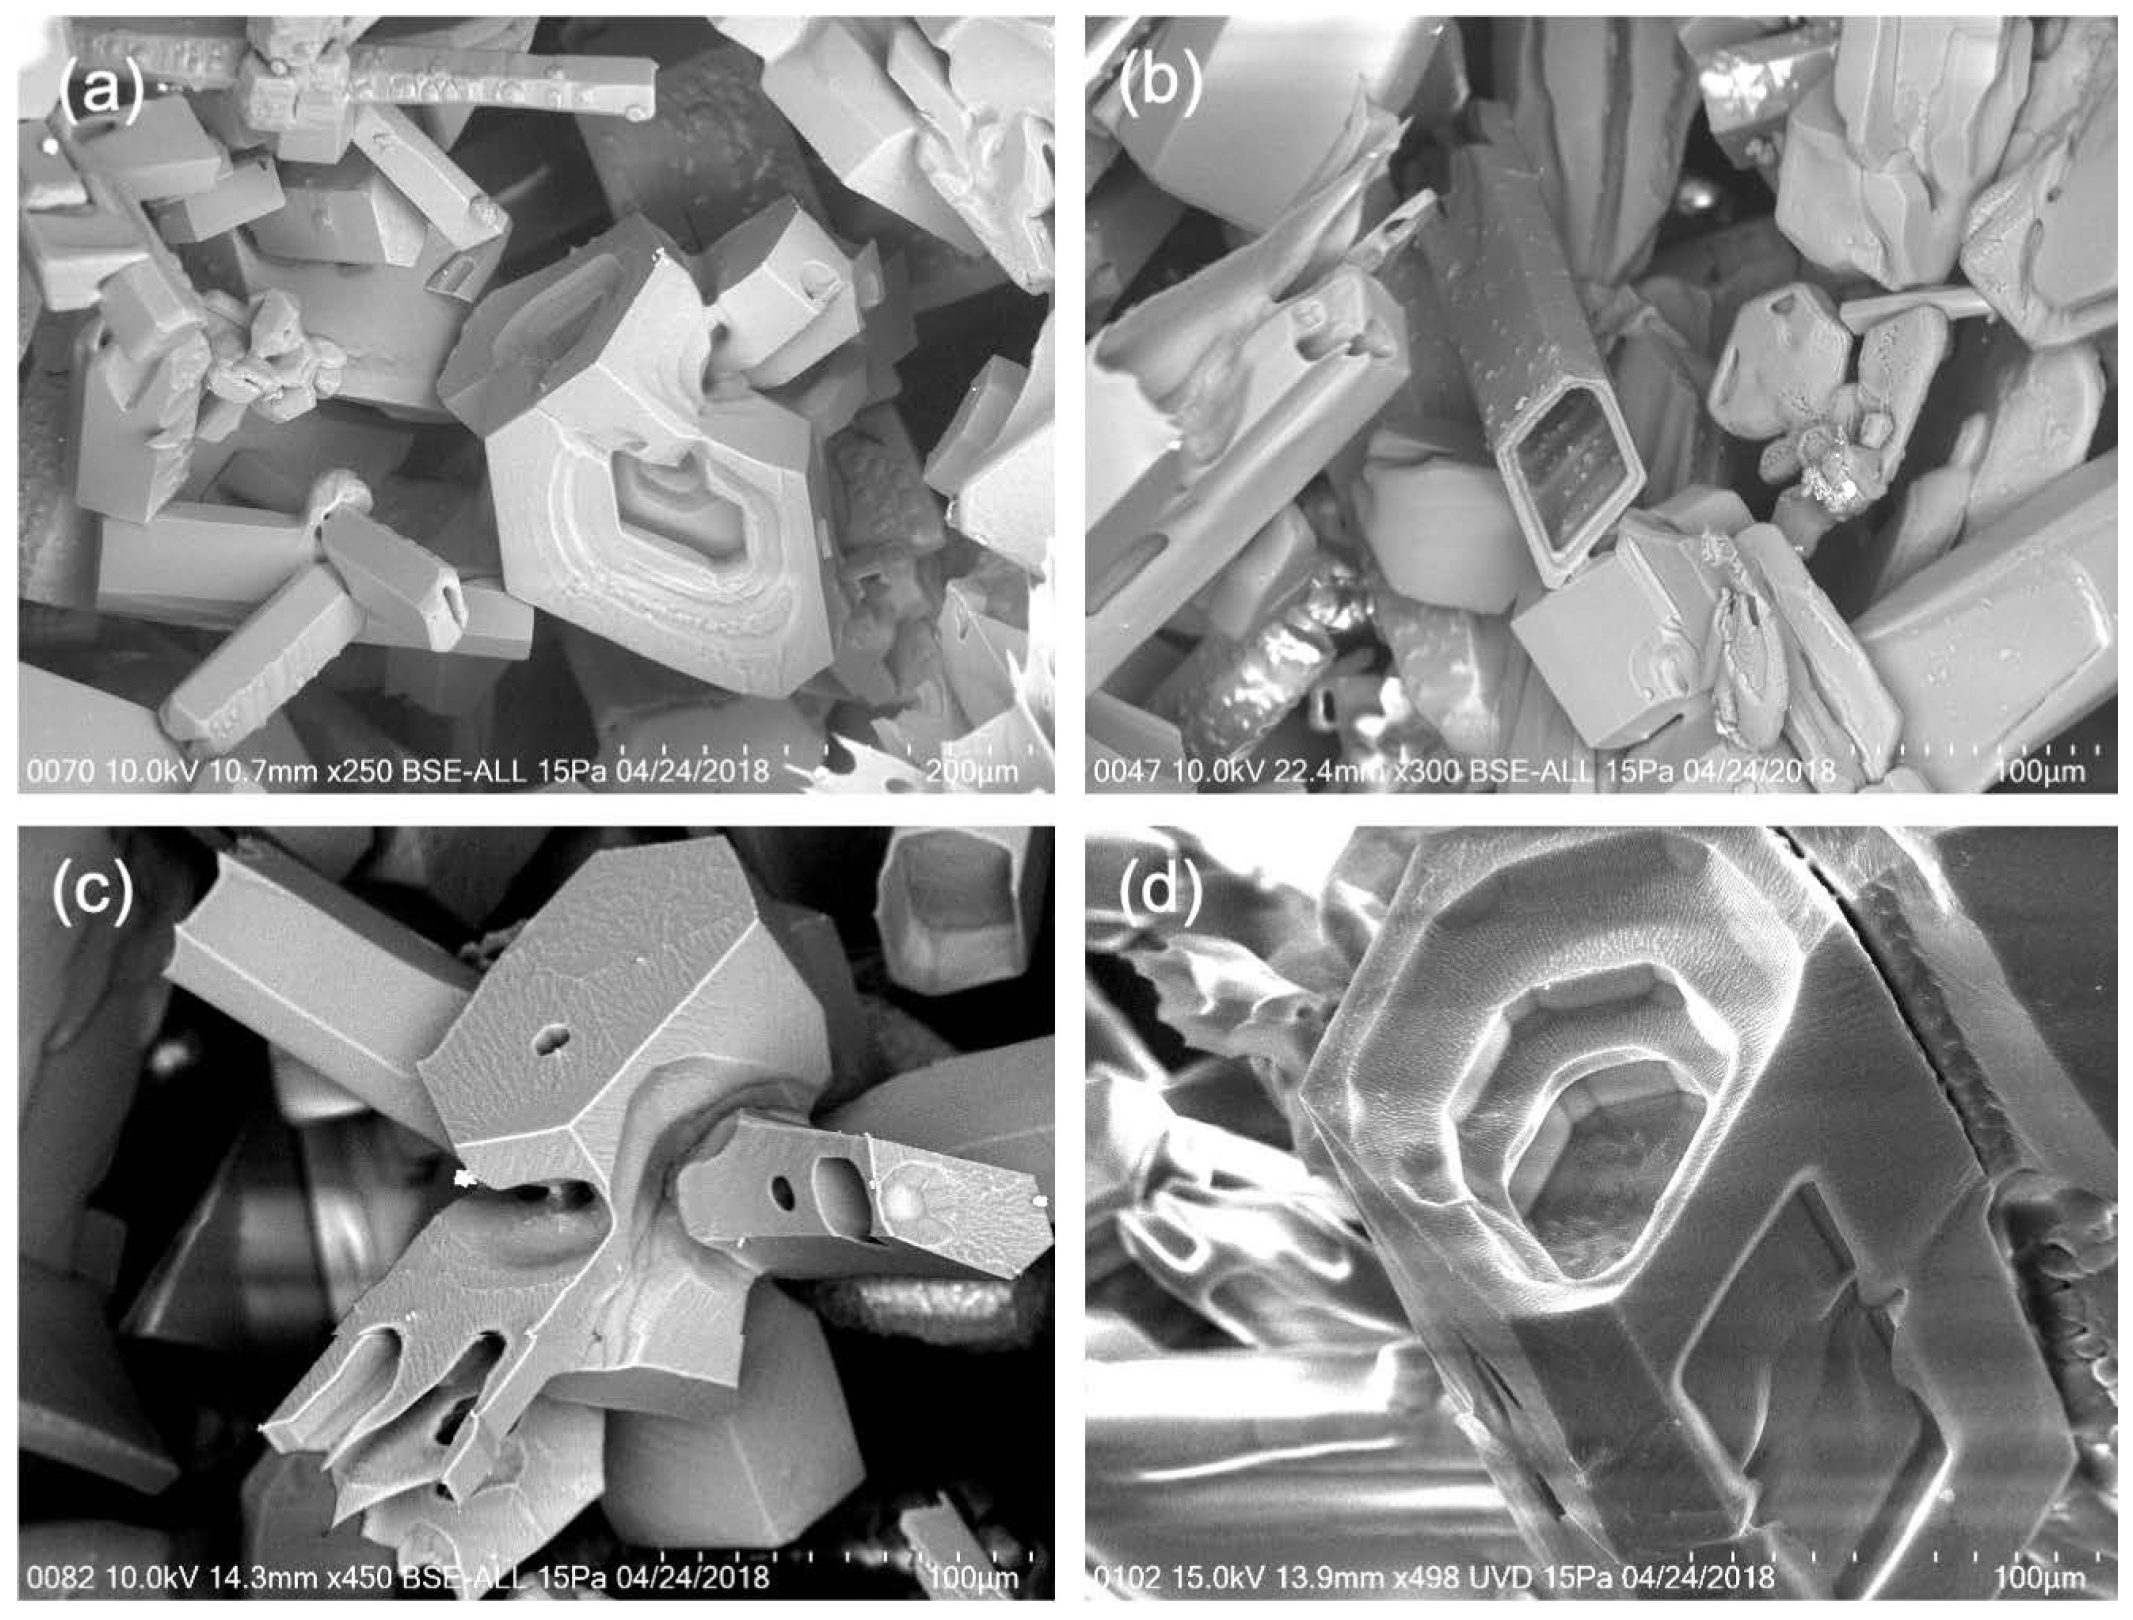
According to the statistical data and figures provided by Magee et al. [10], the main shape of the ice crystal particles with a size of 1–100 µm is shown in Figure 1. In addition to the immeasurable complex poly-crystals and damaged bullet bodies, among the single particles with modeling significance, the approximate hexagonal prism accounts for the largest number, and its cross-sectional area accounts for the largest proportion of the total area (about 60%). Moreover, the hexagonal prism variant-hexagonal plate accounts for about 25% of the total area.
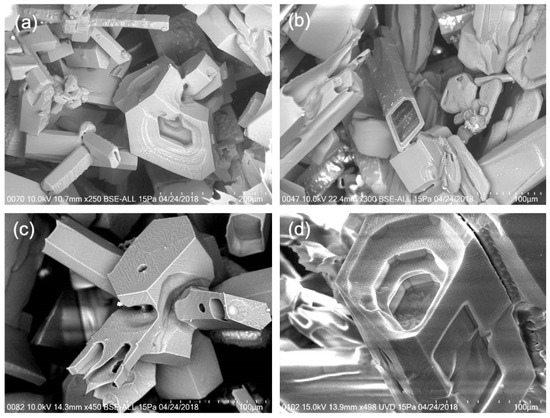
Figure 1.
Complex ice crystal particles with a modest magnification of 250–4500 times. (a) bullet rosette and unclassified compact convolution ‘singular polyhedron’; (b) rhomboid and prismatic linear coarser crystals with discrete adhesion spots on the surface; (c) rosette mixed crystals; (d) irregular cross section of the base, geometrically stratified and hollow columnar, a highly coarser crystal [10].
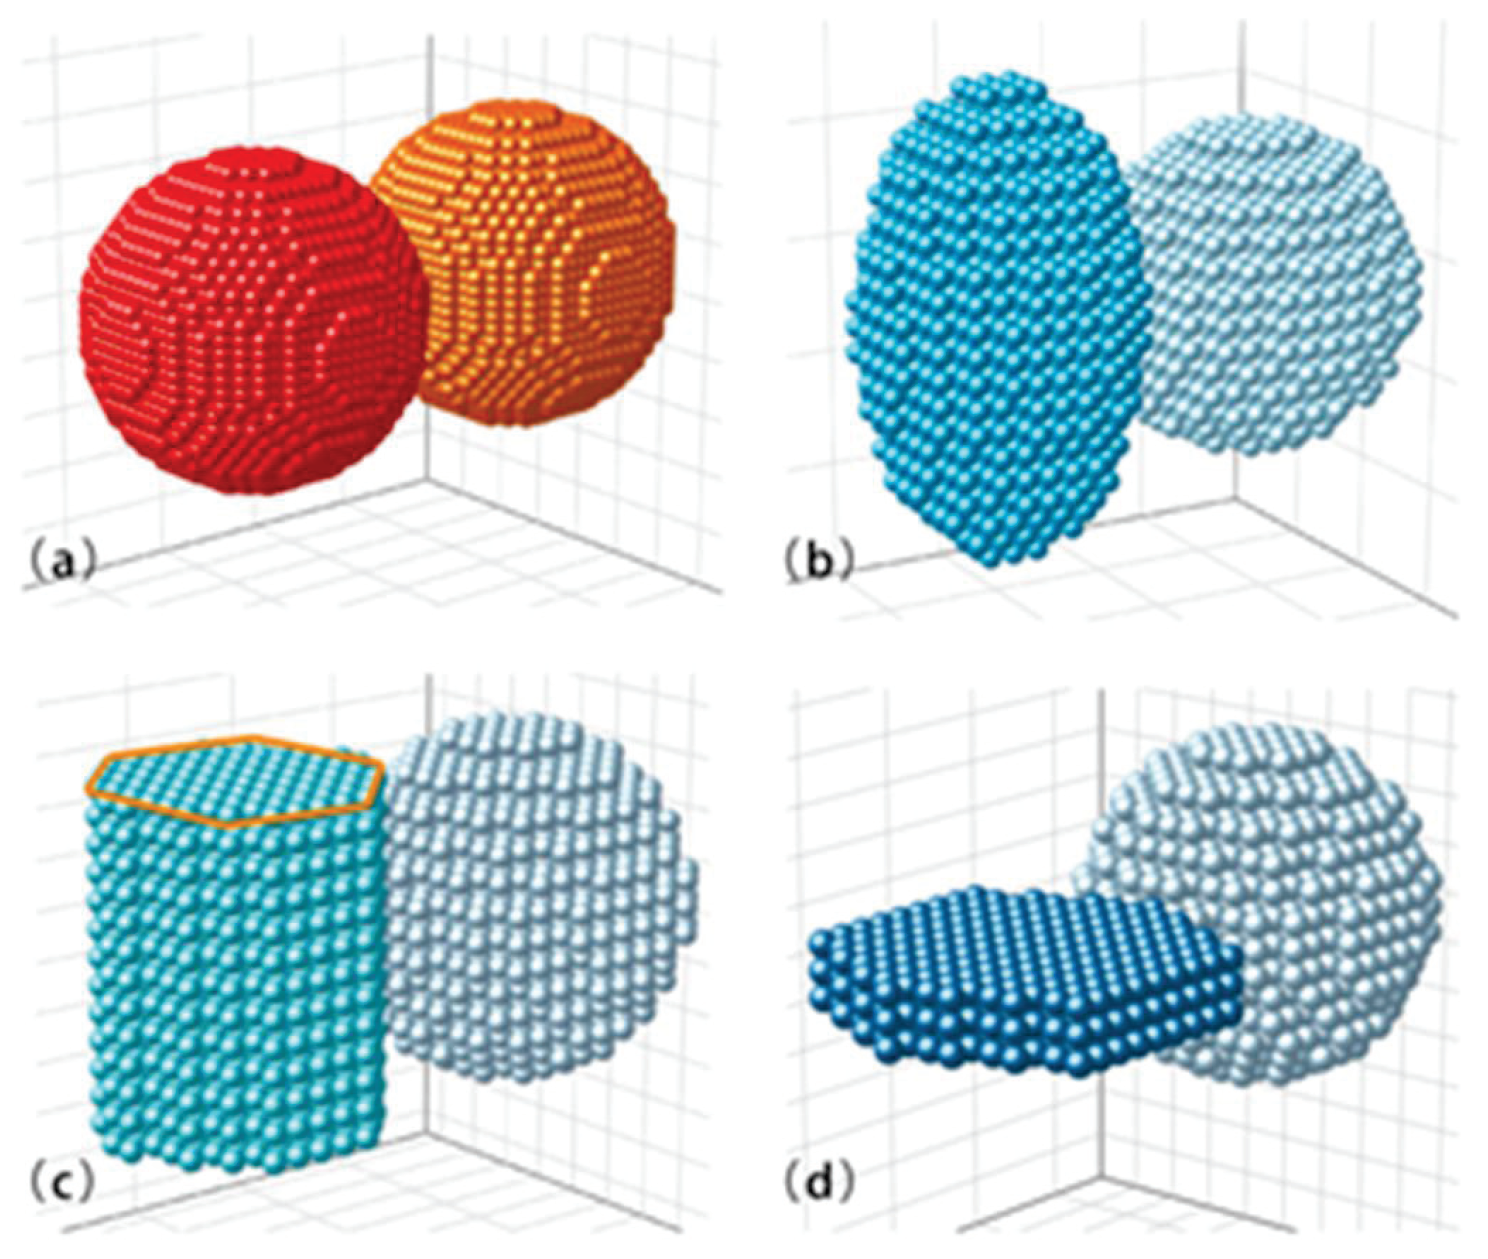
Considering the complex poly-crystal and the complex structure of damaged bullet body, the randomness of aspect ratio is large. We propose spherical and ellipsoidal approximations instead. We selected four different shapes of particle aggregation, including spheres and spheres, sphere and ellipsoid, sphere and hexagonal prism, and sphere and hexagonal plate in each group of aggregates. The choice of these four aggregates is based on the consideration that they are closer to the newly observed particles and that the random clustering of different monomers tends to cause greater irregularity. We put the two monomers in contact, so that the scattering calculation is more accurate, as shown in Figure 2.
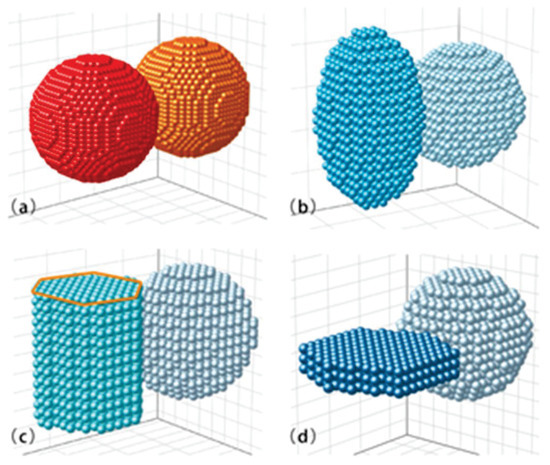
Figure 2.
Ice crystal particle model with agglomerated structure. (a) sphere–sphere; (b) sphere–ellipsoid; (c) sphere-hexagonal prism; (d) sphere-hexagonal plate.
2.3. Calculation of Scattering Characteristics
In our study, we calculated the scattering characteristics of condensed ice crystal particles by a computer with reference to DDSAT 7.3 user manual [13]. In DDA calculation, it is necessary to select the location and polarizability of the dipole points representing the clustered particles. We construct the aggregate structure by developing auxiliary codes and represent the dipole array through the input DDSCAT code. We also added part of the DDSCAT code, so that the output is no longer a single scattering intensity, but more scattering quantity, which is very useful when discussing the spatial position of particles. The scattering field of agglomerated ice particles is approximated by the radiation sum of all dipoles. In the process of computing the scattering characteristics, the Mueller matrix elements can reflect the physical properties of light scattering process, so it is commonly used to describe the scattering and absorption process of the scatterer. The specific forms of each element of the Mueller matrix are given by Rao [14]. In the present study, we also looked at the effect of the spatial orientation of the clustered particles on scattering.
3. Results and Analysis
The number of dipoles in the non-spherical agglomeration structure model was calculated to be 2300, the incident wavelength was = 1.06 µm, and the complex refractive index was ; is the light incident along the x-axis in the positive direction. The spatial position of the agglomeration particles is shown in Figure 2. For , we understand that the light is still incident in the positive direction on the x-axis, which corresponds to a counterclockwise rotation of the ice particles by about the z-axis.
3.1. Effect of Effective Size on Extinction, Absorption and Scattering Efficiencies of Agglomerated Ice Crystal Particles
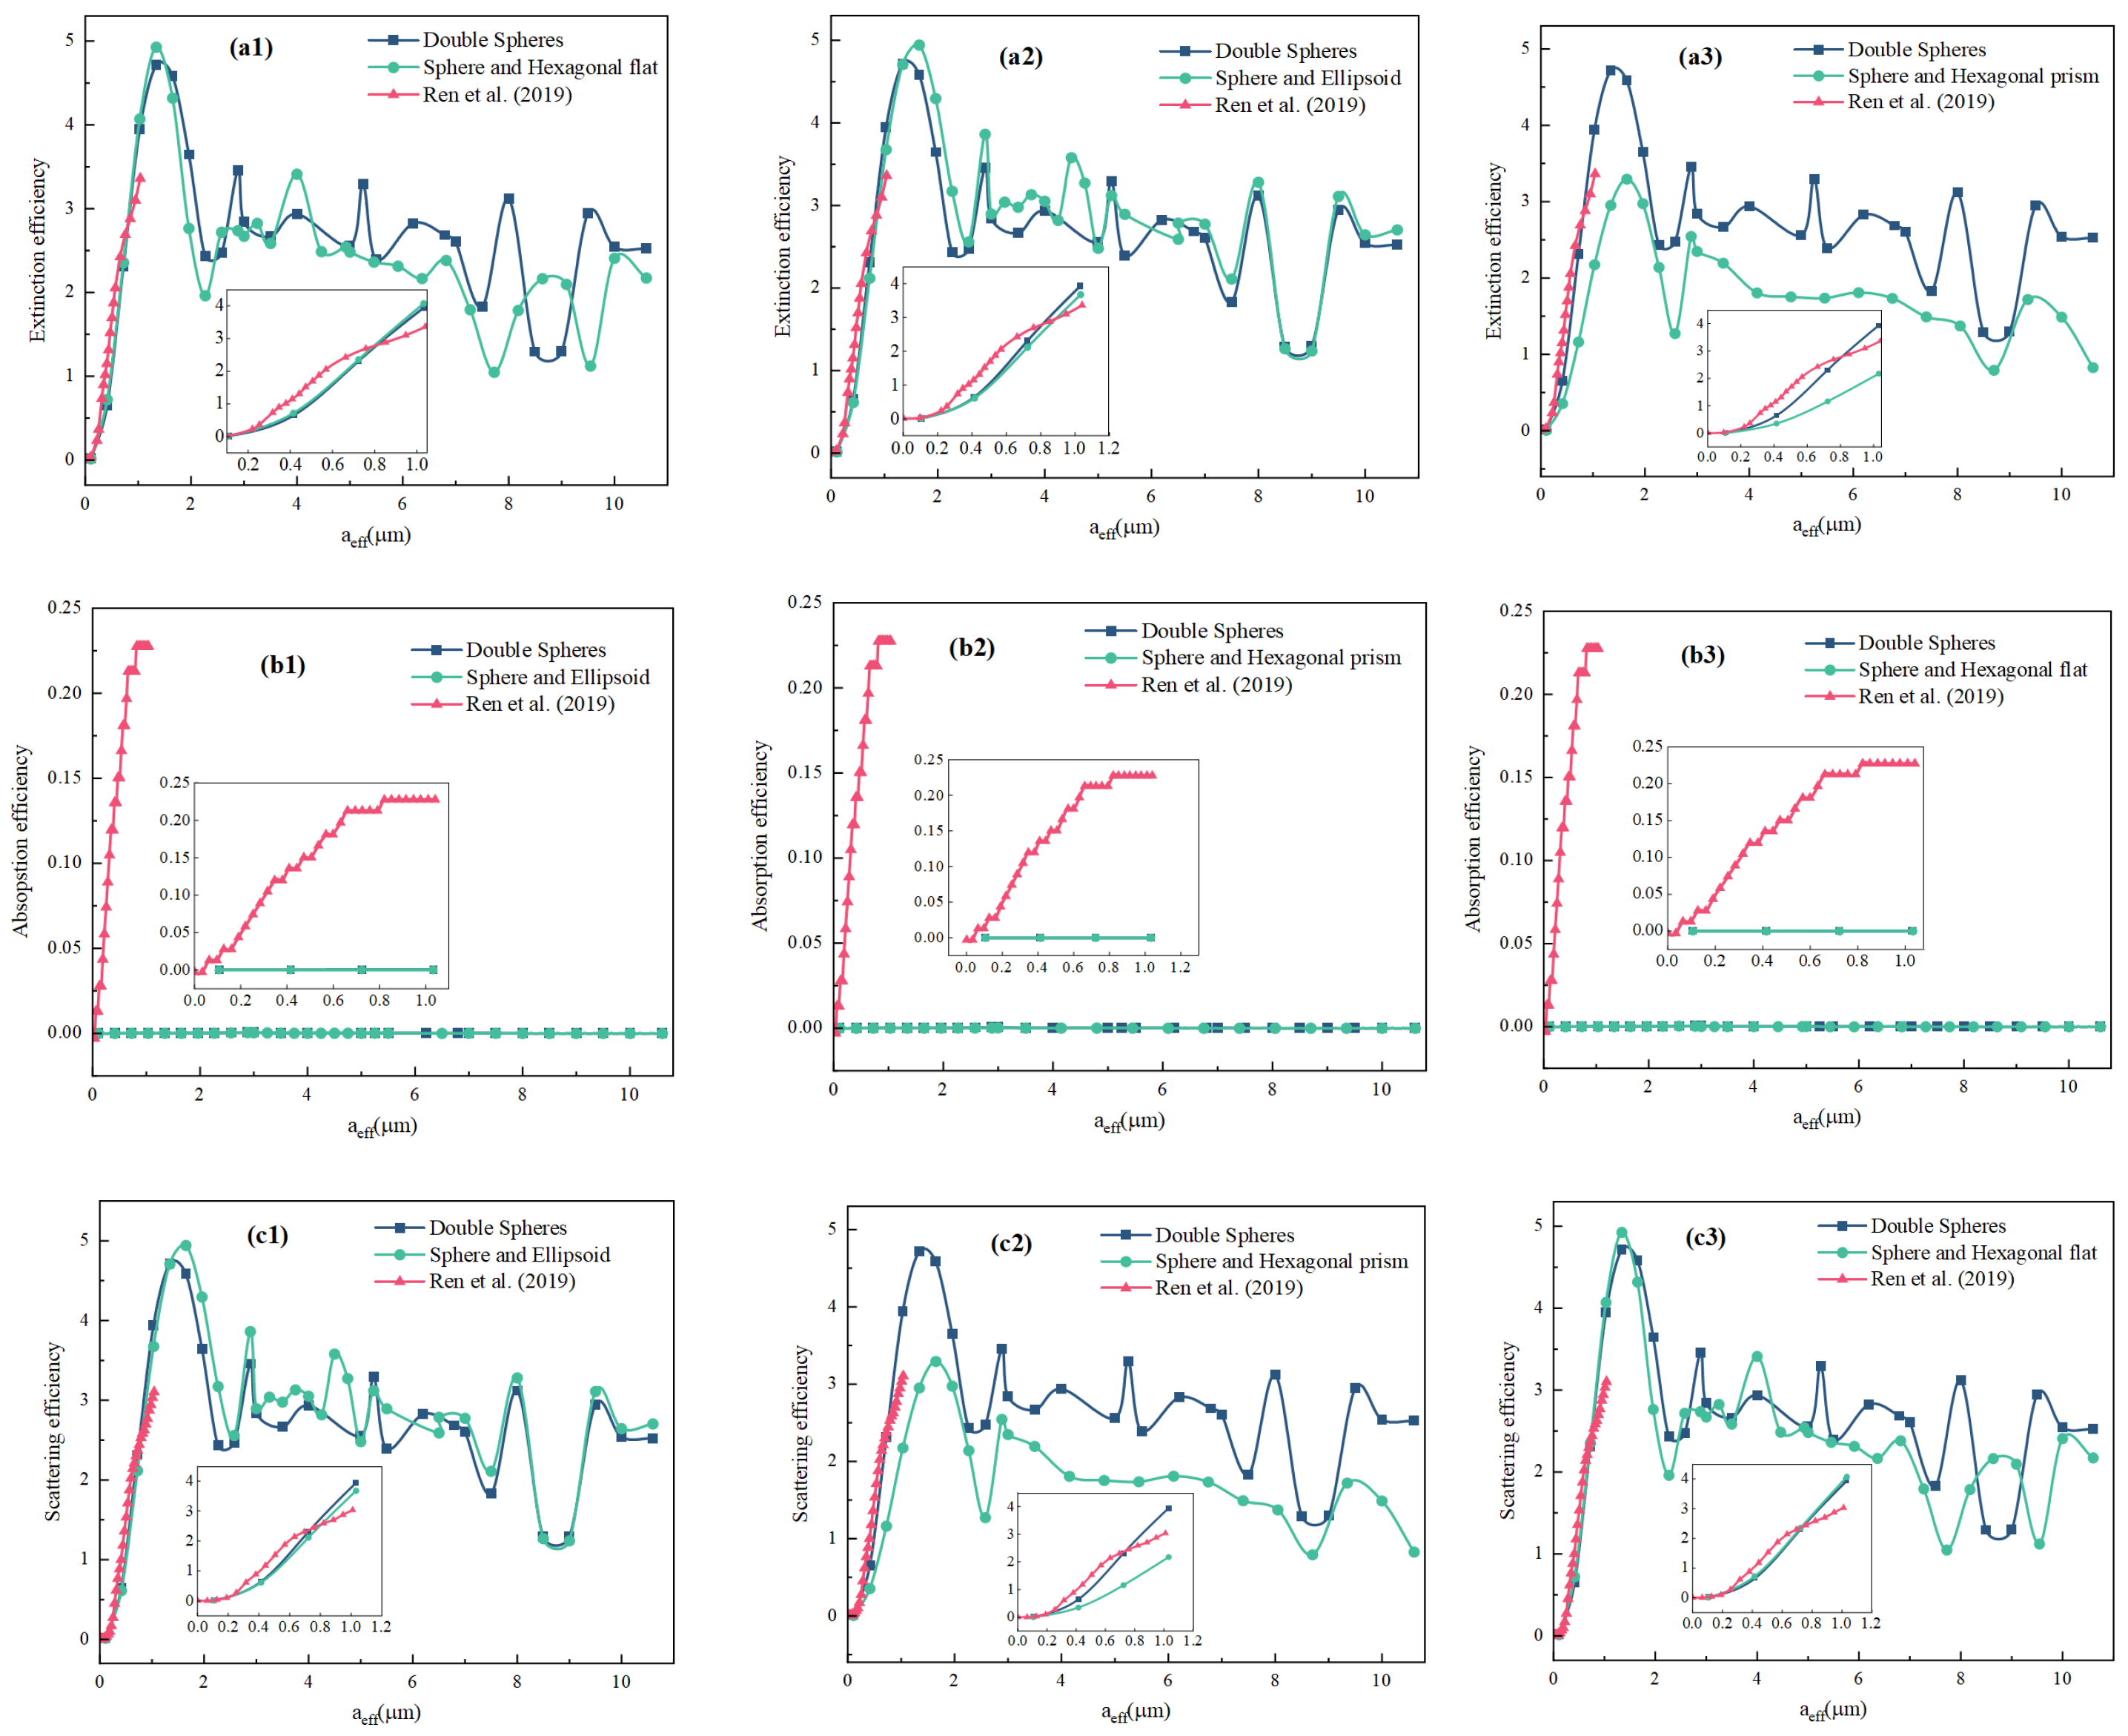
Figure 3 shows the variations in the extinction, absorption, and scattering efficiencies of the ice crystal particles in the four agglomeration models. When the effective size of the agglomerated ice crystals was increased by µm from µm, the extinction, absorption, and scattering efficiencies initially increased and then decreased in a wave pattern, the maximum value occurred at µm, and the minimum value occurred at µm. This is because the scattering effect of the ice crystal particles was the strongest when the size of the ice crystal particles was many times larger than the wavelength of the incident light. When the size of the ice crystal particles was many times larger than the wavelength of the incident light, light reflection occurred, the scattering effect of the light was weakened, and the absorption efficiency was almost zero. At this time, almost all of the laser attenuation of the agglomeration particles came from scattering. Compared with Figure 3b1–b3, the absorption efficiency value of Ren et al. [8] is significantly higher than that of the agglomeration model developed in this study. This is mainly because Ren et al. studied core–shell ice crystal particles, and the imaginary part of their complex refractive index is large, so the laser absorption characteristics of the core–shell ice crystal particles are enhanced.
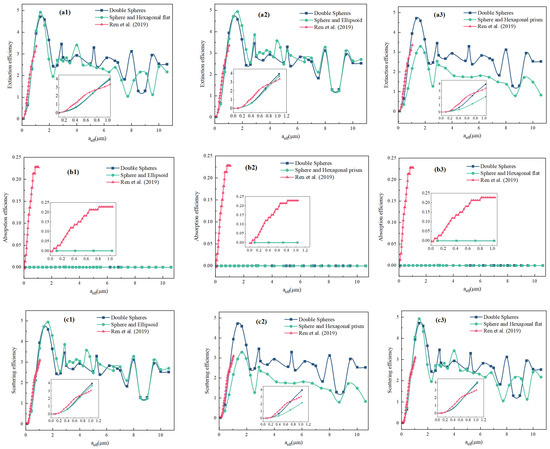
Figure 3.
Variation of the extinction efficiency, absorption efficiency, and scattering efficiency of agglomerated ice crystal particles with effective size for the different agglomeration models [8]. (a1–a3) changes in extinction efficiency; (b1–b3) changes in absorption efficiency; (c1–c3) changes in scattering efficiency.
3.2. Effect of Ice Crystal Particle Size on Laser Scattering Intensity
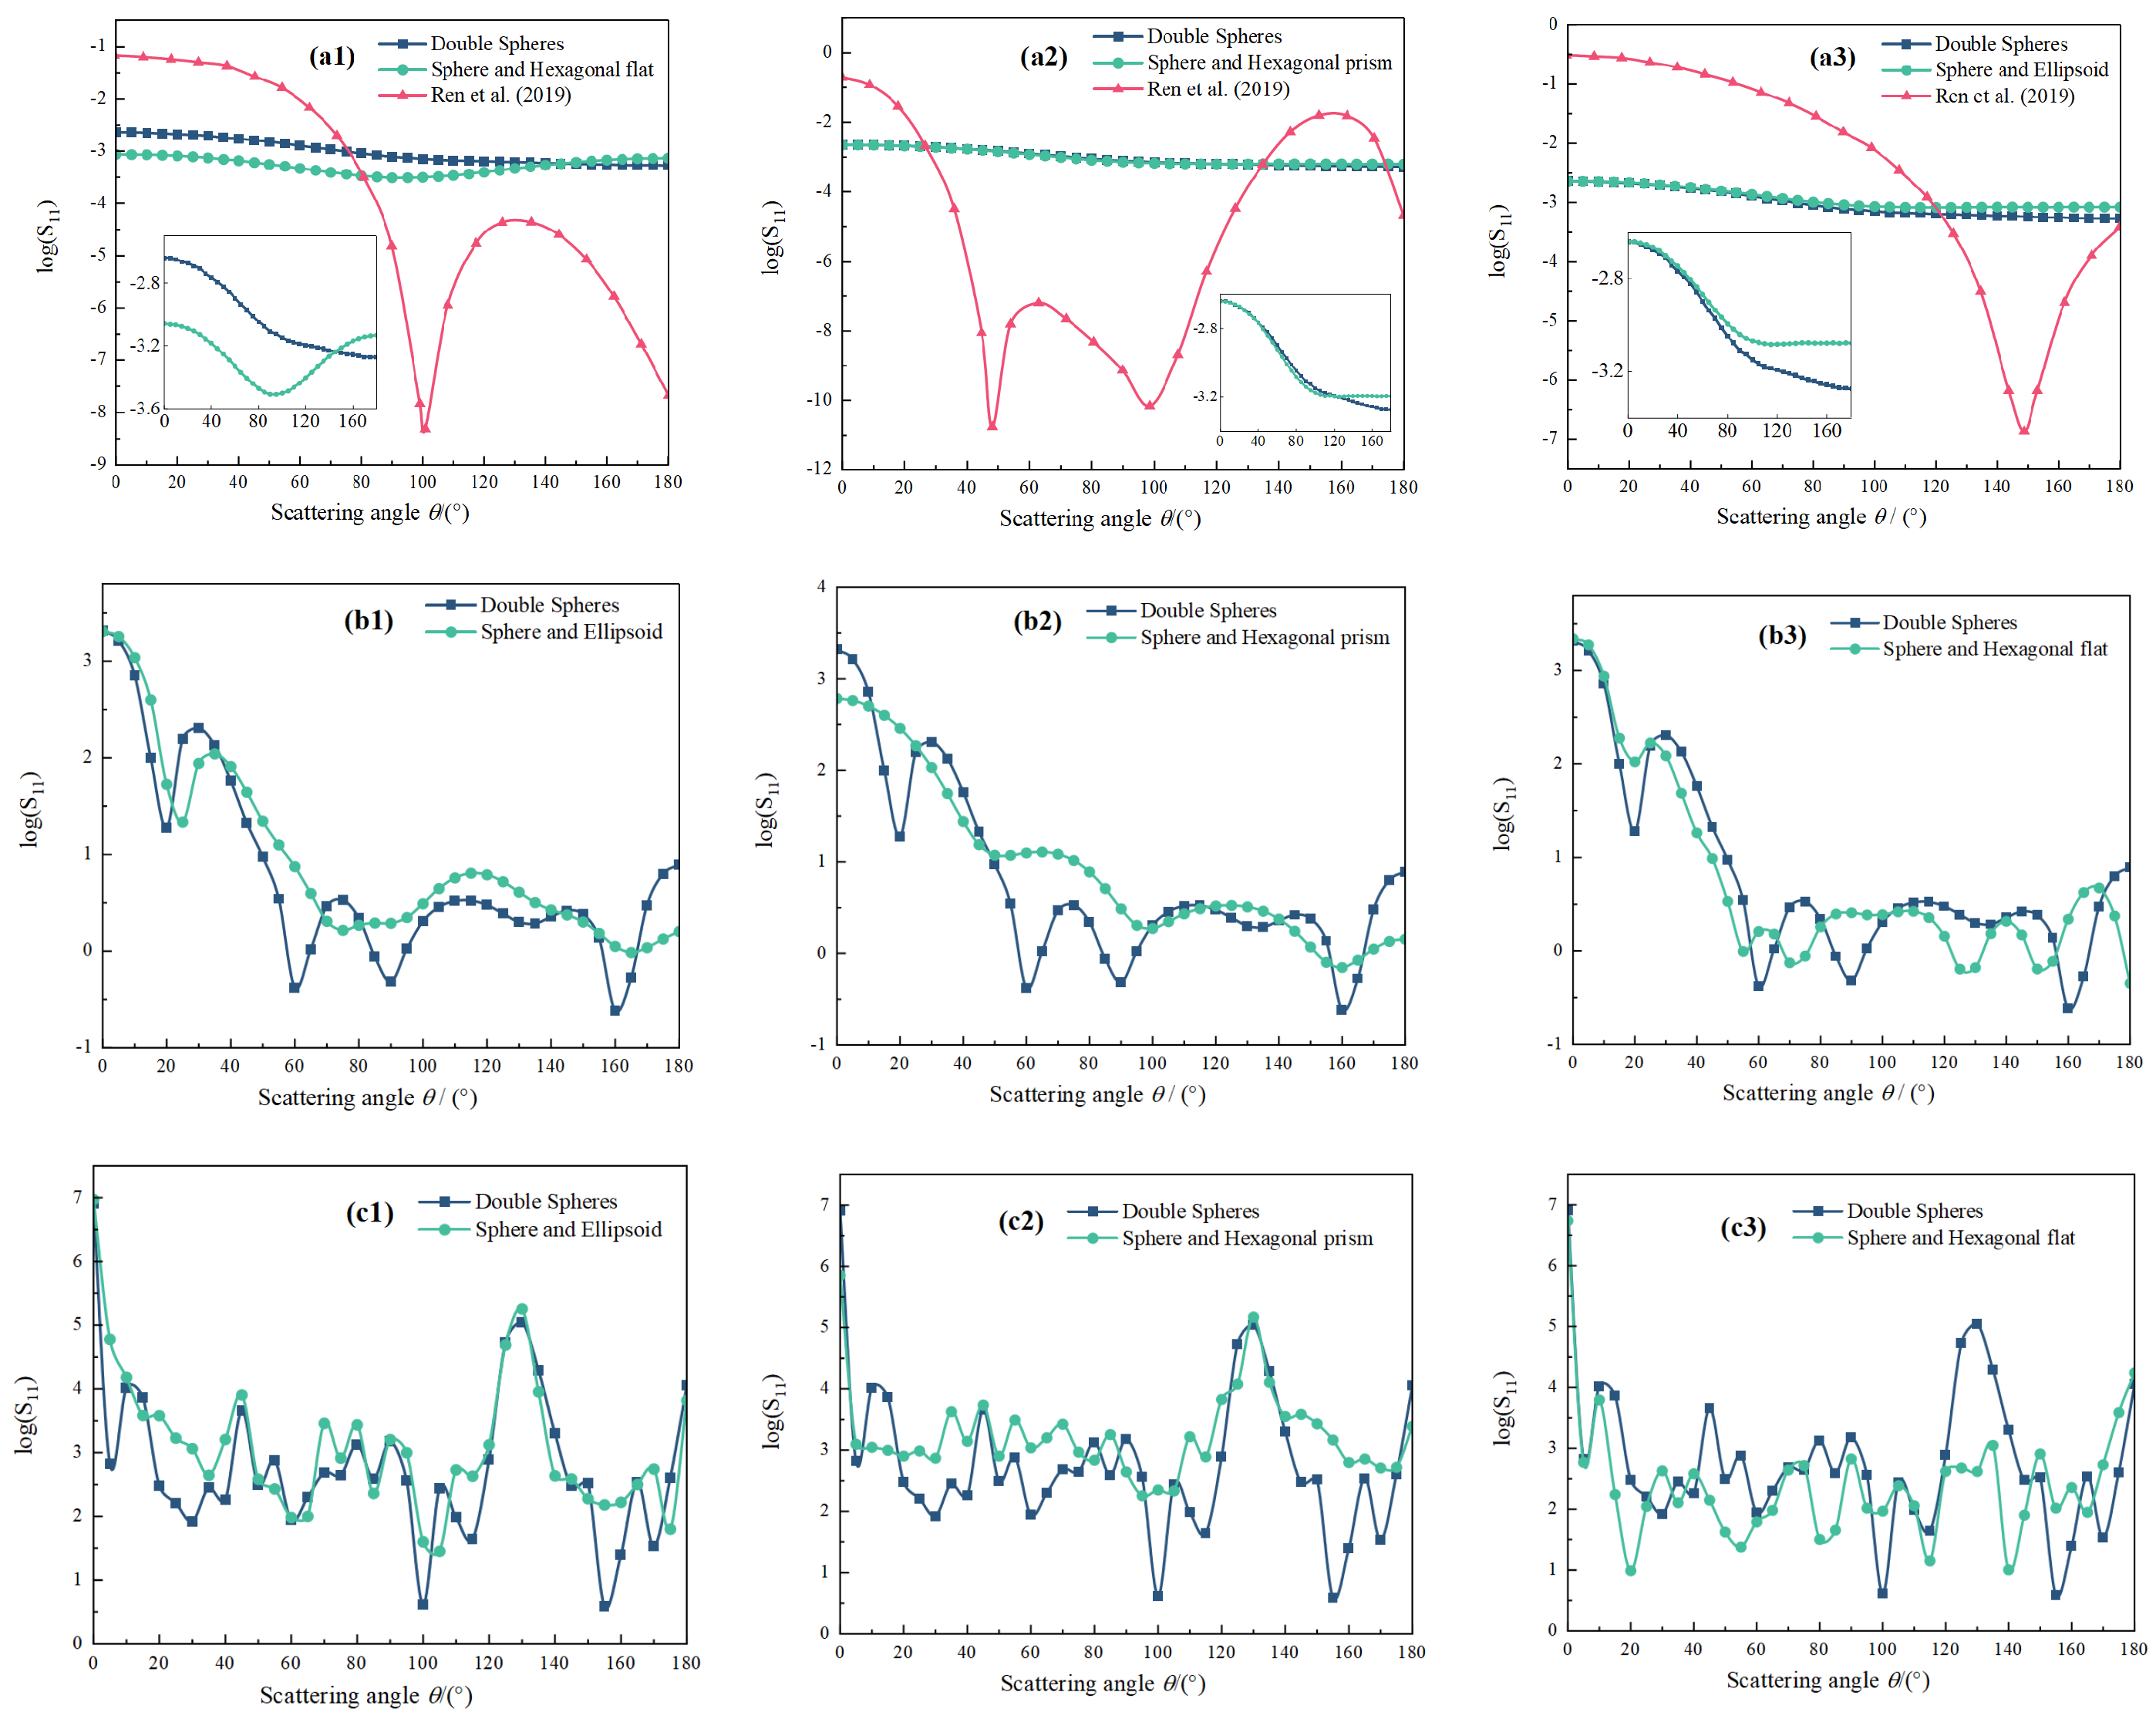
Figure 4 shows the variation in the scattering intensity of the agglomerated ice crystal particles with scattering angle under three conditions: and µm, µm and µm. Figure 4 shows that the scattering intensity of the ice crystal particles is positively correlated with the effective size. The larger the effective size of the agglomerated ice crystal particles is, the stronger the scattering direction is, and the backscattering is obviously smaller than the forward scattering. As the scattering angle and particle size increase, the scattering intensity of the agglomerated ice crystal particles increases with the amplitude fluctuation and oscillation compared with µm, and multiple extreme values appear in the middle. This is because, when the particle size is larger than , there may be interference inside the particle, and the scattered light from different directions inside the same particle may interfere because of the different phases. Compared with Figure 4a1–a3, the scattering intensity of the core–shell particles of the same species studied by Ren et al. [8] varies more widely, which is mainly due to the enhanced absorption of the core–shell particles.
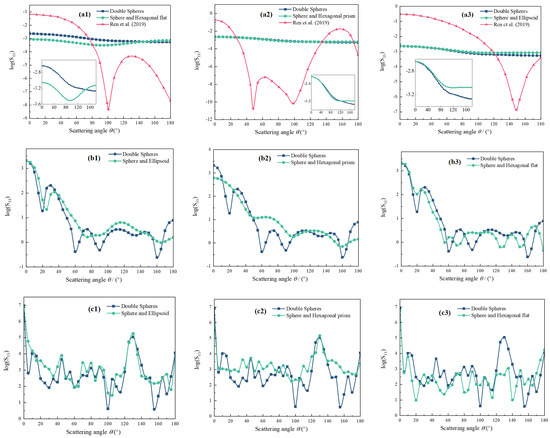
Figure 4.
Influence of the shape of the ice crystals with aggregated structures on the laser scattering intensity [8]. (a1–a3) effective radius µm; (b1–b3) effective radius µm; (c1–c3) effective radius µm.
3.3. Influence of Ice Crystal Particle Shape on Mueller Matrix Elements
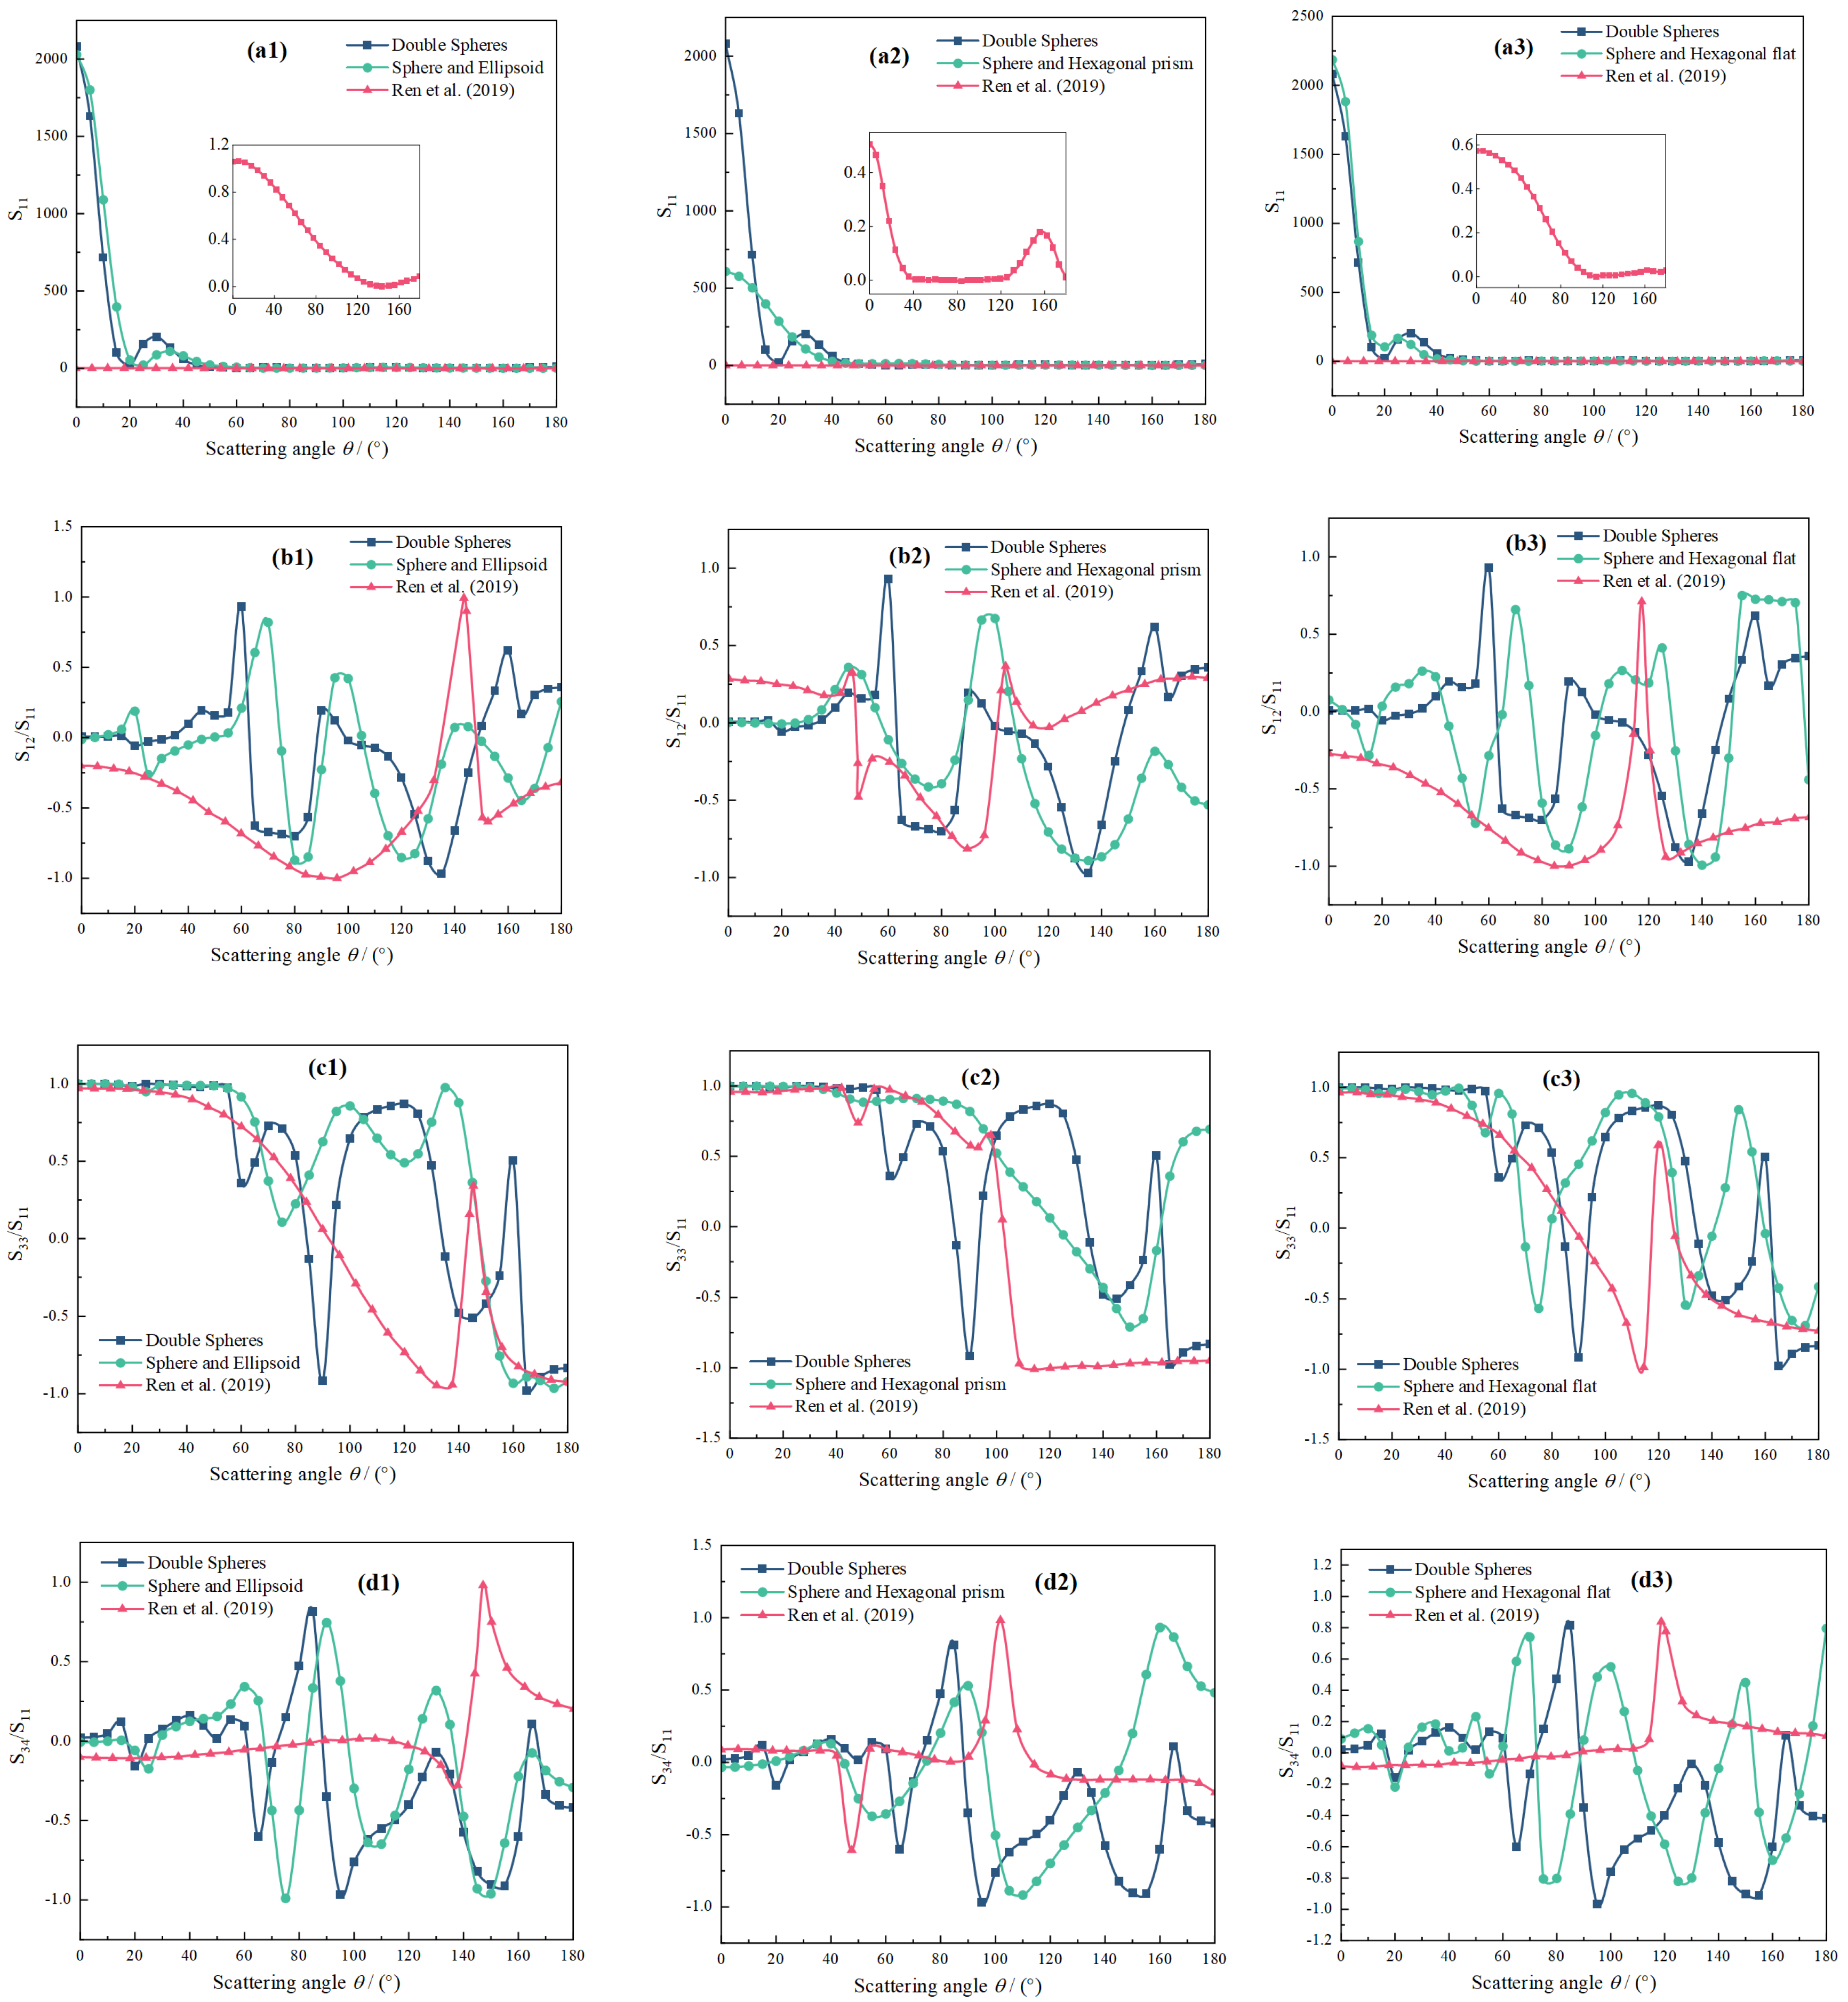
Figure 5 shows the change in the Mueller matrix elements with scattering angle at and µm. In Figure 5a1–a3, the local fluctuation of the backscattering is ignored, and the initial value of the spherical hexagonal prism particles is the smallest. Compared with the core–shell particles of the same type studied by Ren et al. [8], the initial value of the ice crystal particles is very large in the forward scattering region, indicating that the forward scattering has a great influence on the total incident field intensity of the agglomeration particles. Figure 5b1–b3 show that the different agglomerated ice crystal models differ greatly in terms of the scattering angle, exhibiting obvious oscillation, which is the result of the interaction between the agglomerated particles and the electric and magnetic multipoles. For in Figure 5c1–c3, Lei et al. [15] proposed the concept of the asymmetric ratio , which is used to define the ratio of the area under the forward scattering curve to the area under the backscattering curve. This ratio was used to further study the symmetry of the values of the forward scattering and the values of the back scattering with respect to zero value points. In this study, the of the agglomeration model tends to 1, that is, the front and back scattering curves are linearly symmetric about the zero point. Based on this, we believe that the exact value of the particle size can be determined by considering the spectral line variation of the asymmetry ratio under a certain incident wavelength after the research on the particle model is deepened. In Figure 5d1–d3, the scattering of changes significantly in the entire region, while the change in the forward scattering is not obvious at µm, and the vibration amplitude of the backscattering is large. Compared with the results of Ren et al. [8], the forward scattering and backscattering oscillations of the agglomerated particles in Figure 5b–d are significant, which is mainly related to the polarization characteristics of the incident light.
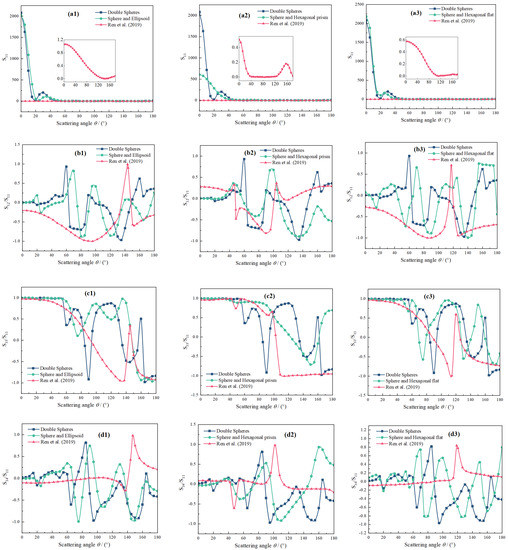
Figure 5.
Influence of shapes of ice crystals with aggregated structures on Mueller matrix elements [8]. (a1–a3) ; (b1–b3) ; (c1–c3) ; (d1–d3) .
3.4. Influence of Spatial Orientation of Agglomerated Ice Crystals on Scattering
The spatial orientation depends on the position of the particle in space. For non-spherical agglomerated ice particles, it is of great significance to study their spatial orientations and select geometric cross sections from various angles to reflect the scattering characteristics of the particles. Studies of the spatial orientation can further simulate the optical path in all directions and the physical scattering process of ice crystal particles under real laser communication conditions.
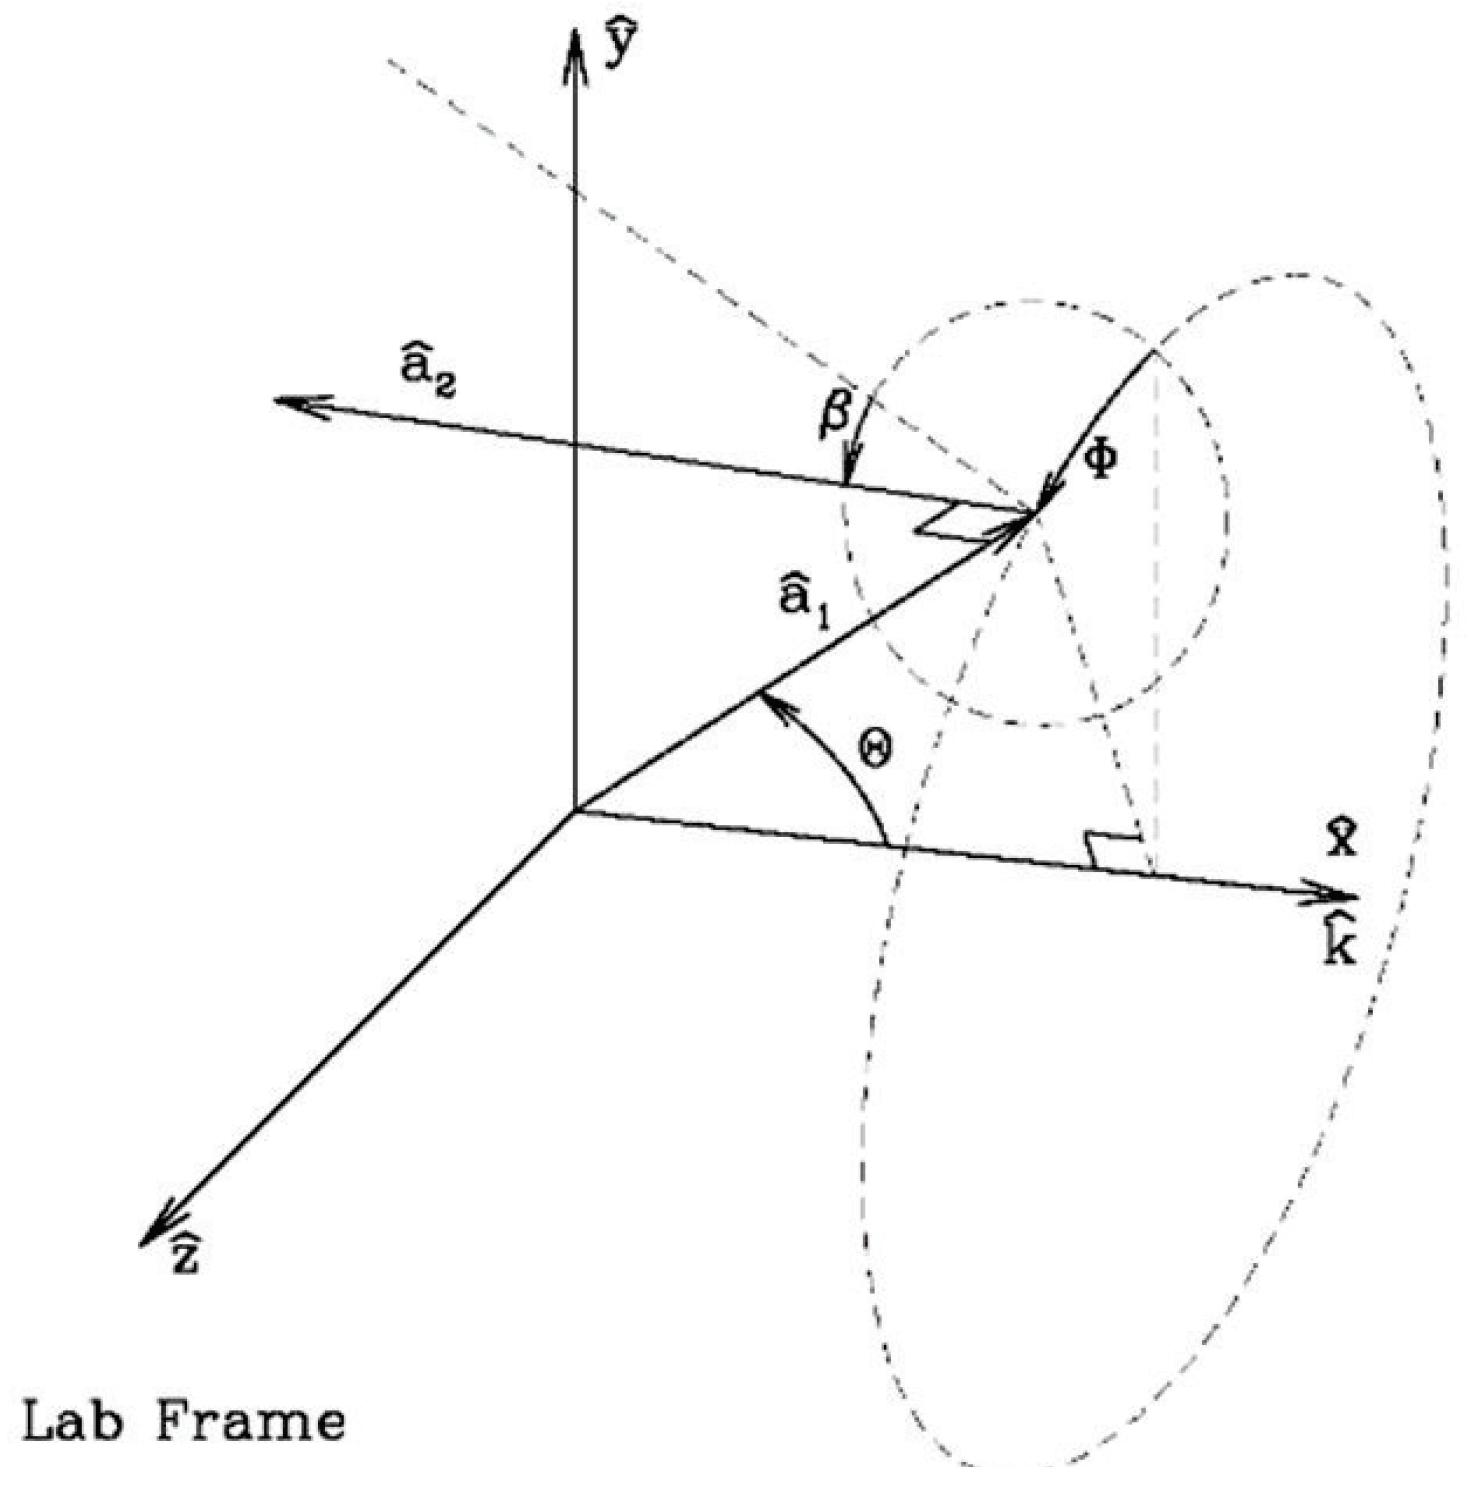
In the DDA, the spatial coordinate system includes the target coordinate system (TF) and the laboratory coordinate system (LF). As shown in Figure 6, the TF coordinate system is centered on the target object composed of a dipole lattice, and the lattice coordinate of the shape.dat file is used to indicate the location of the target object in the formula. The LF coordinate system is a Cartesian coordinate system that mainly consists of , and unit vectors. The DDA emphasizes that the positive direction of the incident plane wave is .
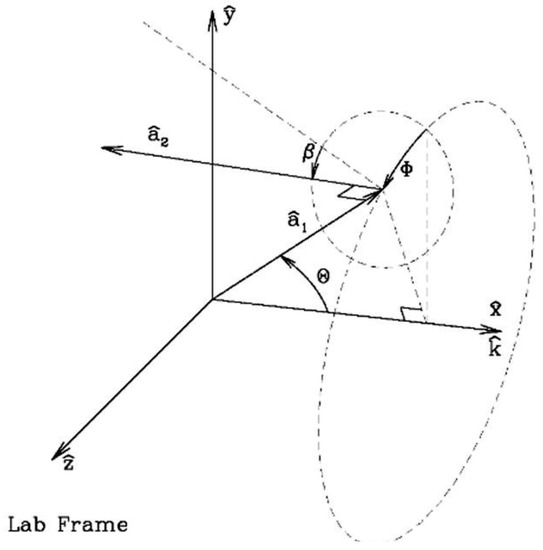
Figure 6.
Target orientation in the laboratory frame coordinate system [13].
To determine the direction of the target object, the DDA fixes the orthogonal vector group , and . is introduced to define the angle between and , is defined as the angle between the and planes. In this case, can be determined. Next, is introduced to indicate the angle between and planes and , thus fixing the direction of . Based on the above analysis, in theory, by adjusting , to correspond to ice particles moving in space, the incident light can thus cover all of the directions of the target object.
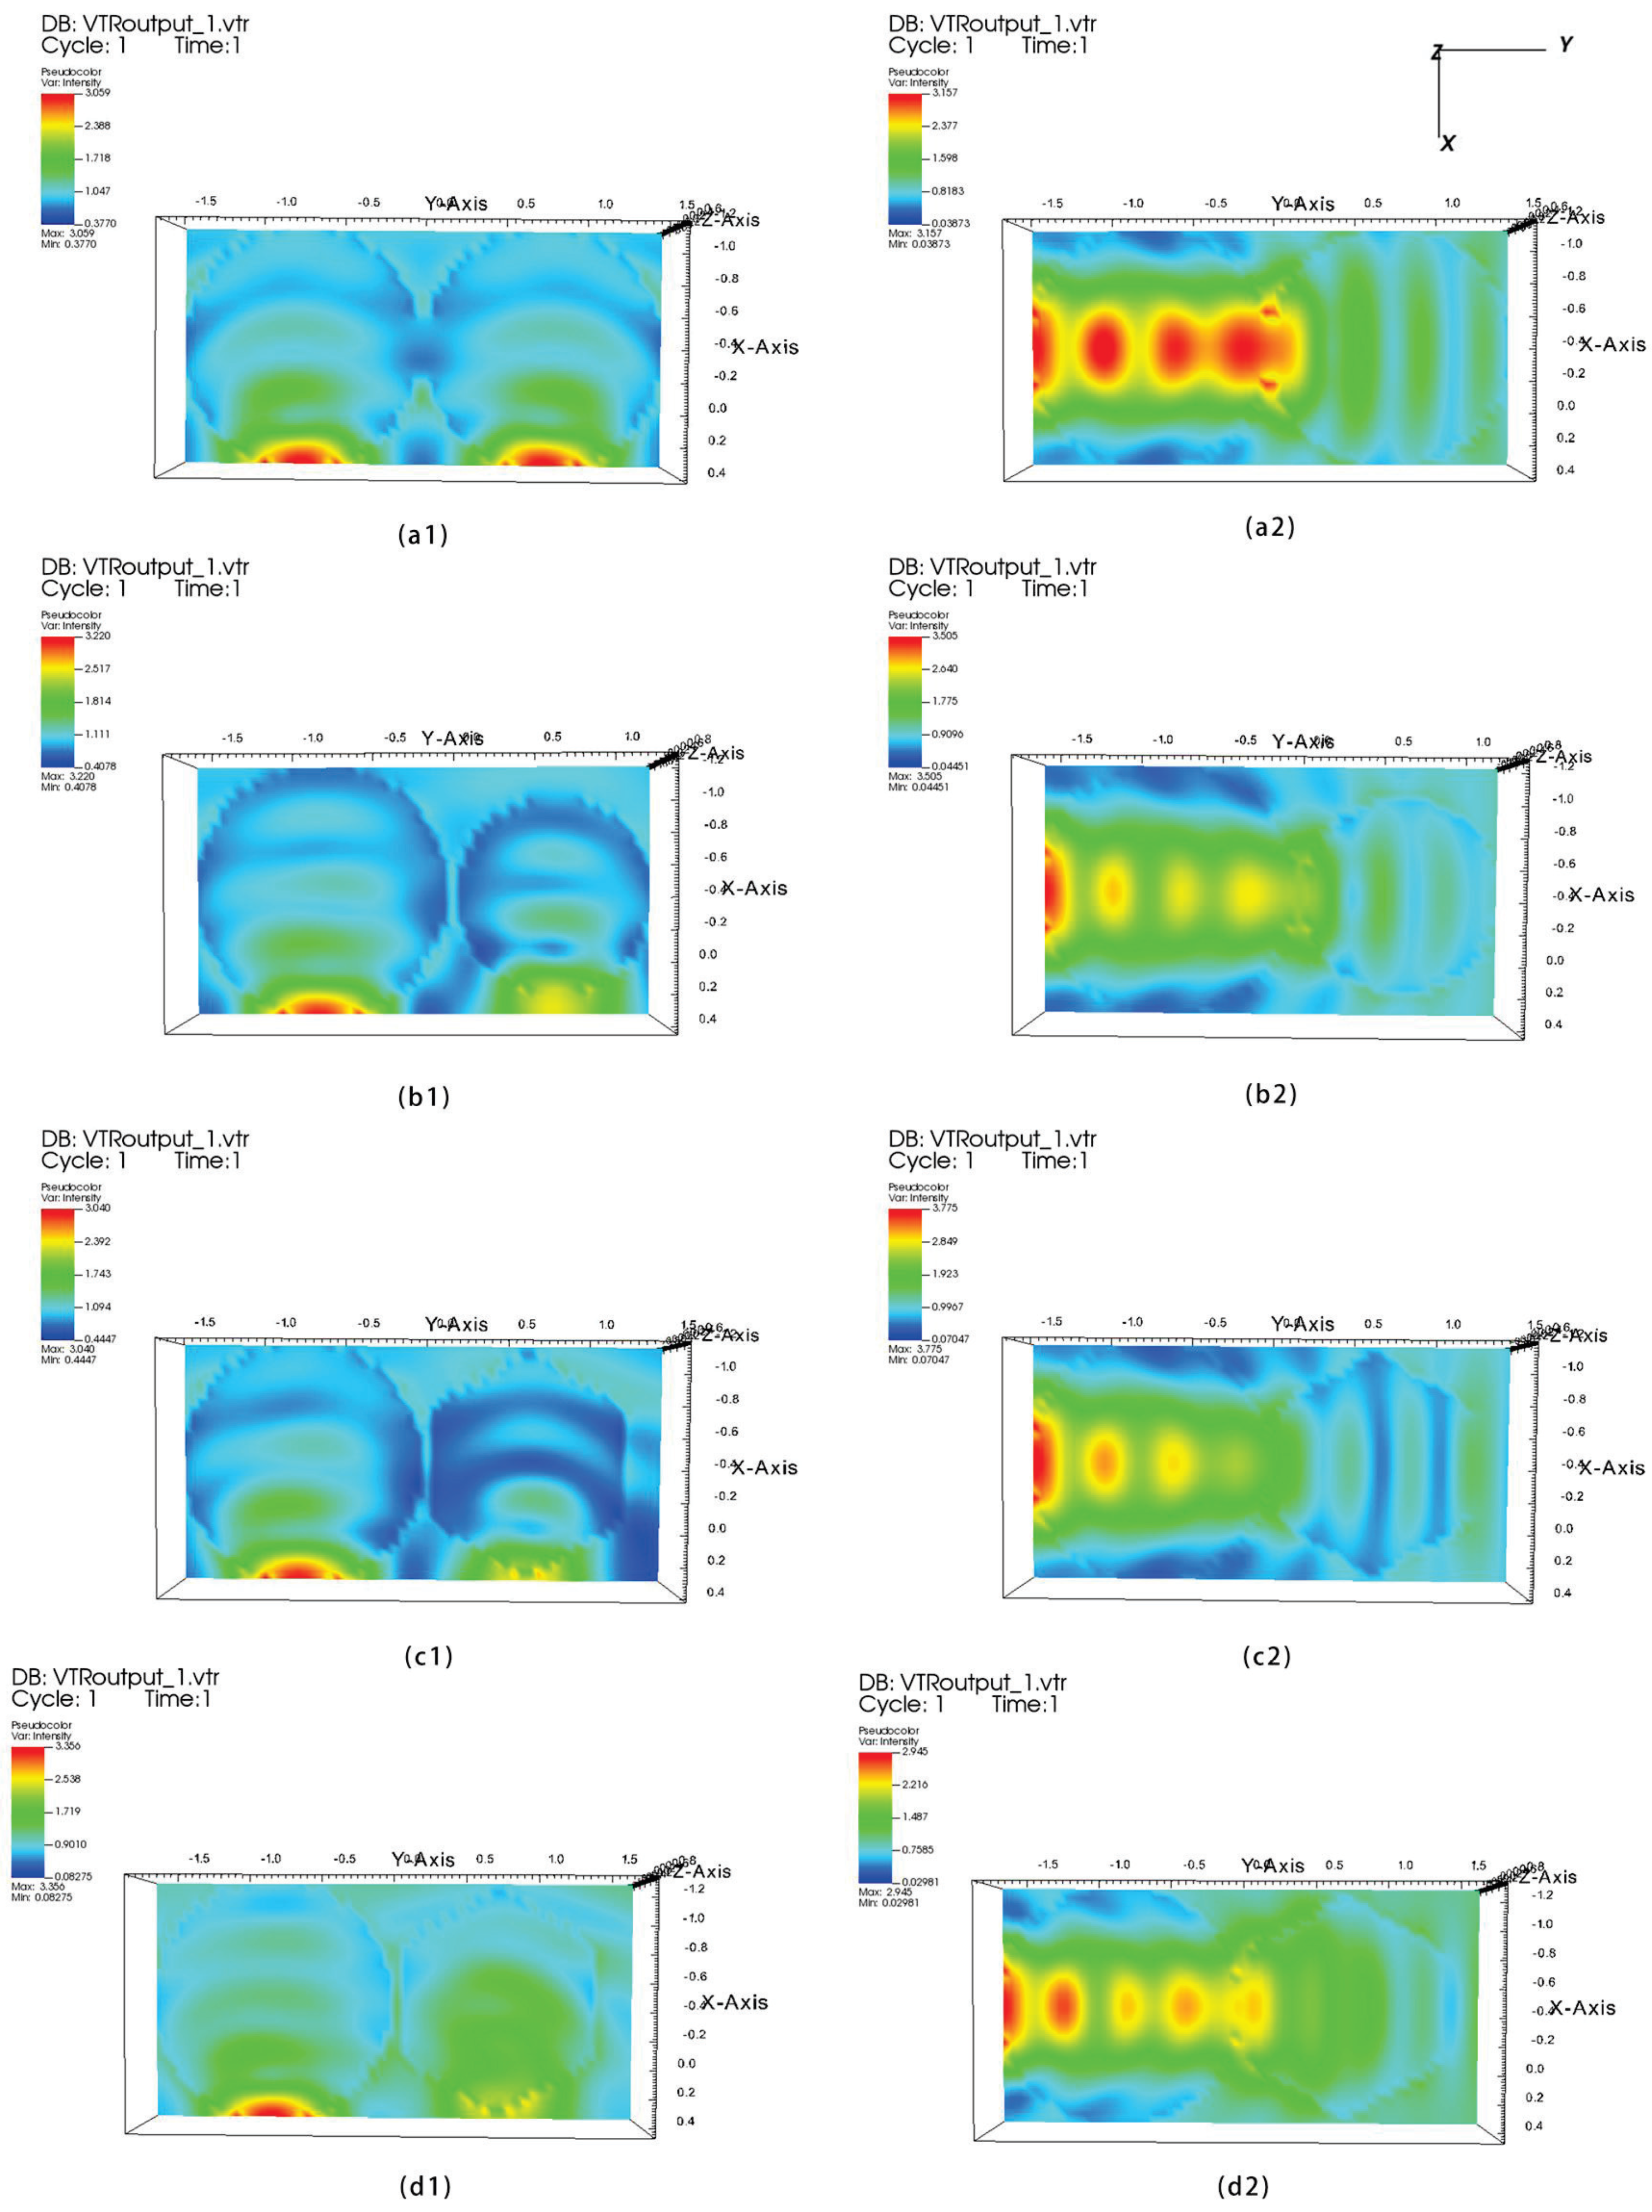
To study the influence of the spatial orientation on the extinction, absorption, and scattering efficiencies of the ice crystal particles with combined structures, we make the sample points of and evenly distributed within the range of [0, 360°], and the sample points of cos distributed within the range of [−1, 1]. We use tuples (, , ) to represent the number of samples necessary to study each of the three orientation angles. The spatial positions of particles can be determined by the statistical average of the three orientation angles, and this work is currently under study. According to the model shown in Figure 2, first we expanded from plane, and we preliminarily explored the influence of the spatial orientation by studying the angle corresponding to plane . In this study, incidence angles of and and an incident wavelength of µm were selected. Figure 7 shows the electric field distribution after the near-field calculation of the four agglomerated particle models. The electric field here refers to the macroscopic electric field , which is distinct from the microscopic electric field generated by atoms or point dipoles in Equation (1). The relationship between the two is
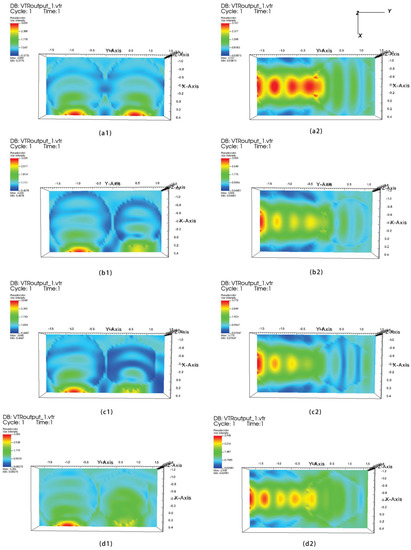
Figure 7.
Visualization of the near-field electric field distribution of the four clustered particle models. (a1) sphere–sphere ; (a2) sphere–sphere ; (b1) sphere–ellipsoid ; (b2) sphere–ellipsoid ; (c1) sphere-hexagonal prism ; (c2) sphere-hexagonal prism ; (d1) sphere-hexagonal plate ; (d2) sphere-hexagonal plate .
In Figure 7, color changes indicate the electric field intensity. The red and yellow parts with larger field intensity are initially distributed on the left and right sides. However, when the z-axis is rotated , the field intensity distribution changes, and the originally symmetrical field intensity becomes consolidated and strengthened in the horizontal direction. It can be seen from the field intensity model that the target direction has not changed, but the direction of incident light and polarization have changed.
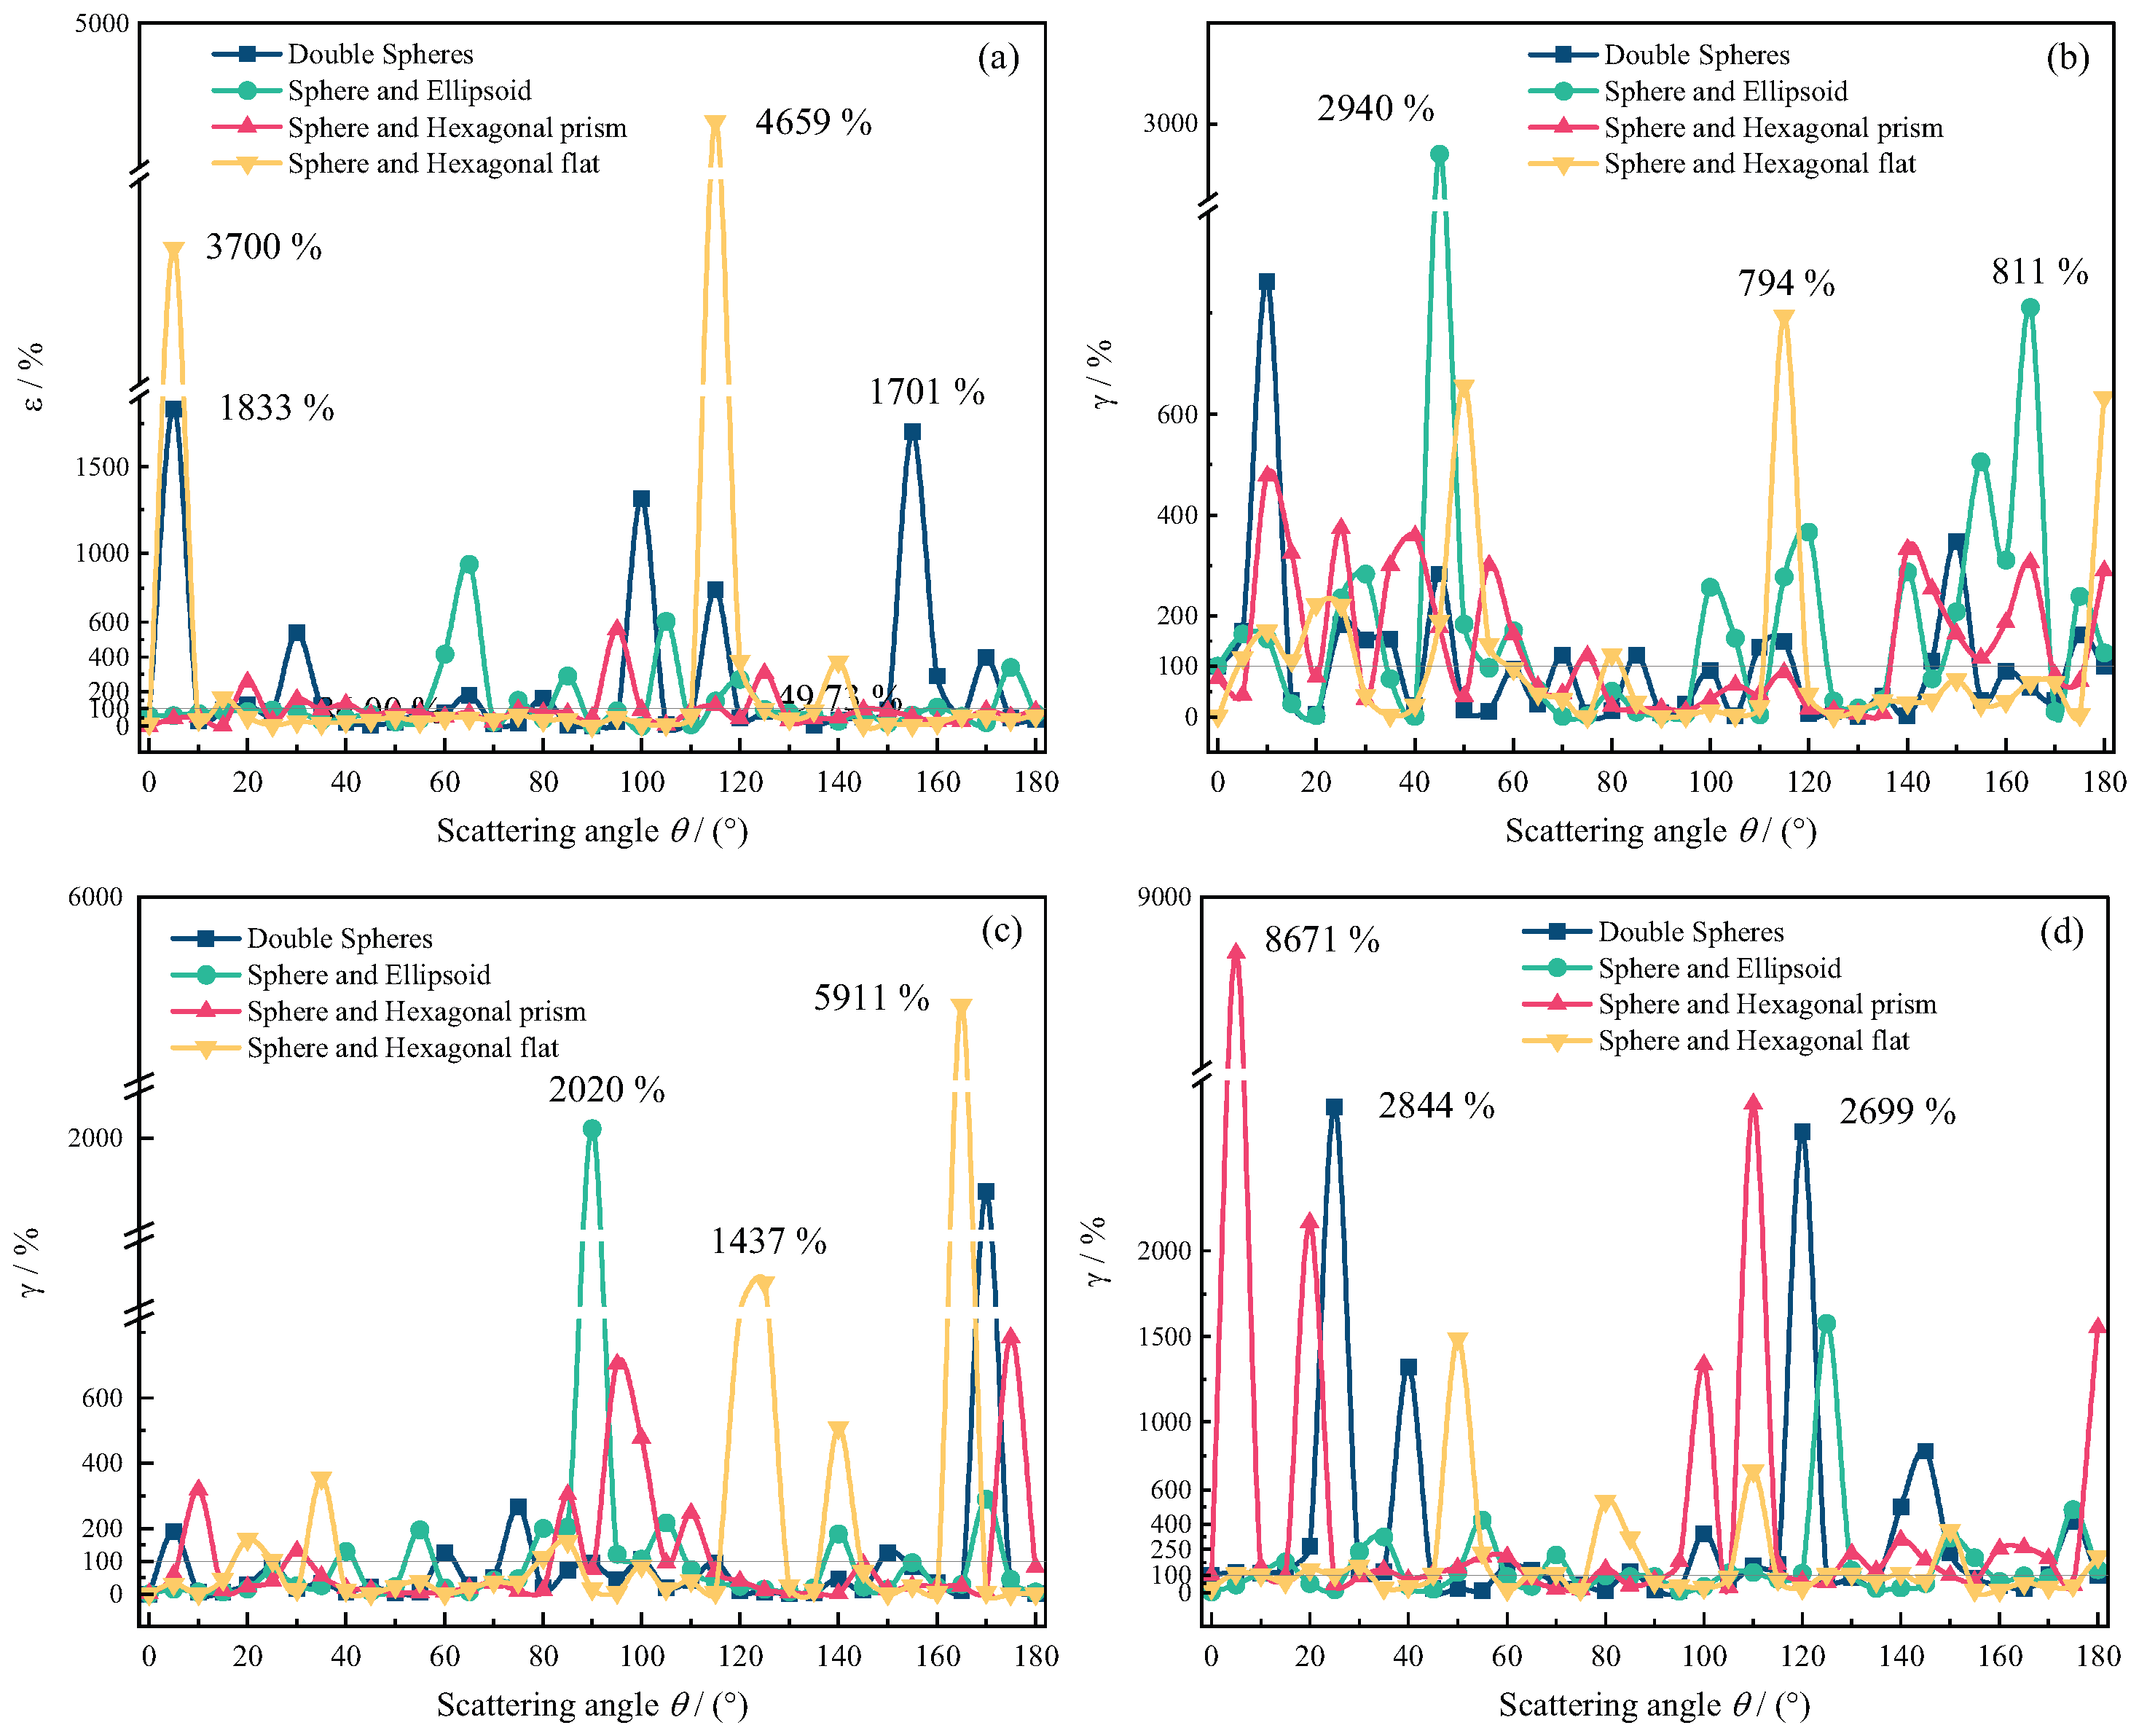
Figure 8 shows the case for µm. The variations in the extinction, absorption, and scattering characteristics of the incident agglomerated ice crystal particles for versus are expressed by the relative error:

Figure 8.
The relative errors of extinction efficiency, absorption efficiency, and scattering efficiency of ice crystal particles at and spatial position. (a) relative error of extinction efficiency; (b) relative error of absorption efficiency; (c) relative error of scattering efficiency.
According to Figure 8a,c, when the extinction and scattering efficiencies of the agglomerated particles are , the relative error exhibits an oscillating decreasing trend, and the maximum error reaches 200%. Among them, the relative error of the sphere–ellipsoid model is larger than those of the other three agglomerated models, and the relative error of the sphere-hexagonal prism model is the smallest. We speculate that, as increases, all of the efficiencies decrease to some extent. Figure 8b shows that the absorption efficiency of the agglomeration particles is relatively stable.
Figure 9 shows the changes in the elements of the Mueller matrix with respect to when the light incidence angle is . Here, we used the relative error to represent this:
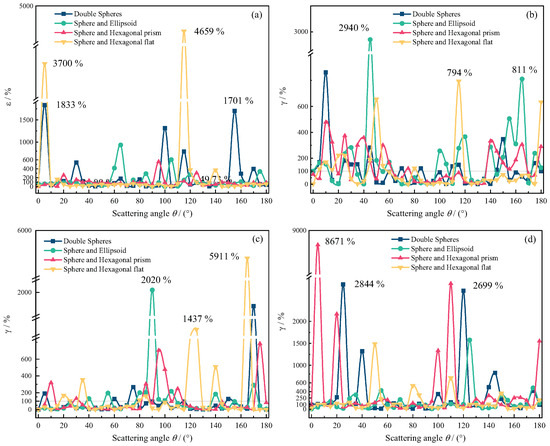
Figure 9.
The relative errors of the Mueller matrix elements of ice crystal particles at and . (a) relative error of ; (b) relative error of ; (c) relative error of ; (d) relative error of .
Equation (3) represents the relative error of , and Equation (4) represents the relative errors of , , and . It can be seen from Figure 9 that the relative errors of the elements in the Mueller matrix exhibit multiple extreme values, which is equivalent to the fact that the direction of the incident light remains unchanged and the agglomeration particles rotate along the z-axis. That is, the change in the optical cross section is caused by the change in the spatial position of the particle. Figure 9a shows the relative error of incidence between and . Among them, the relative errors of the ball-hexagonal plate model exhibit the largest variation, with two maxima of ; the relative errors of the ball-hexagonal prism model have the smallest variation, indicating that the spatial orientation of the agglomeration particles has changed, and the total incidence field intensity changes greatly before and after scattering. Figure 9b shows the relative error of incidence between and . Among them, the sphere–ellipsoid and sphere-hexagonal plate models exhibit the most obvious changes, with a maximum relative error of ; and the sphere-hexagonal prism model has the smallest relative error, indicating that the spatial orientation of the agglomeration particles has changed, and the degree of linear planning parallel to and perpendicular to the scattering plane has changed. Figure 9c shows the relative error of incidence between and . It can be seen from Figure 9 that the relative errors of the sphere-hexagonal plate and sphere–ellipsoid models exhibit the largest change, reaching 5911%, and the relative error of the sphere-hexagonal prism model exhibits the smallest change, indicating that, as the spatial orientation of the agglomeration particles changes, the change in the linearly polarized incident light relative to the linearly polarized scattered light is also significant. Figure 9d shows the relative error of incidence between and . Among them, the relative errors of the sphere-hexagonal prism, sphere-hexagonal plate, and sphere–sphere models all change obviously, and the maximum value reaches 8671%, indicating that, as the spatial orientation of the agglomeration particles changes, the circularly polarized incident light changes significantly compared with the scattered light of the circular polarization. The maximum relative error value of the elements of the Mueller matrix reaches 800-fold. Such a large error value may be caused by the spatial orientation of the aggregate or the error of the calculation method. We are doing further research on this question.
4. Conclusions
In view of the complexity of the shape and the randomness of the motion of ice crystals in high altitude cirrus clouds, four cirrus ice crystal particle models with non-spherical agglomeration structures were established. The electric field distributions of the four agglomerated particle models were calculated in the near field, and the spatially random distribution of the particles in the cirrus cloud was reconstructed more realistically. The effects of the different combinations of particle structures on the laser extinction, absorption, and scattering efficiencies, laser intensity, and Mueller matrix elements at were analyzed using discrete dipole approximation. The influence of the spatial orientation of the ice crystal particles on the laser scattering was preliminarily explored. Adjusting the direction of the incident light from to , for Mueller matrix elements, the relative error changes of extinction efficiency, absorption efficiency, and scattering efficiency are very obvious.
It was found that changes in the agglomeration structure and spatial orientation of the ice crystals lead to significant differences in the scattering and absorption characteristics, and the changes in the spatial orientation of the ice crystals introduce uncertainty into cirrus particle detection. In the future, the effect of the spatial orientation of the particles (only plane angle is studied in this paper) on laser scattering will be investigated to further reduce the non-directional motion form of the ice crystal particles in the atmosphere.
Author Contributions
Conceptualization, S.R.; methodology, S.R., Y.L., and Z.N.; software, Z.N.; investigation, Y.L.; data curation, Z.N. and Y.L.; writing—original draft preparation, S.R.; writing—review and editing, Z.N. and M.W.; visualization, Z.N.; project administration, M.W. and M.G.; funding acquisition, M.W. and M.G. All authors have read and agreed to the published version of the manuscript.
Funding
This research was supported by the National Natural Science Foundation of China (Grant No. 61771385), the Scientific Research Program Funded by the Shaanxi Provincial Education Department (Grant No. 21JK0966), the Scientific Research Plan of the Science and Technology Department of Shaanxi Province (Grant No. 2021JM-517), and the Education and Teaching Reform Project of Xianyang Normal University (Grant No. 2019Y003).
Institutional Review Board Statement
Not applicable.
Informed Consent Statement
Not applicable.
Data Availability Statement
Not applicable.
Conflicts of Interest
The authors declare no conflict of interest.
References
- Xiao, H.X.; Zhang, F.; He, Q.S.; Liu, P.; Yang, Z.P. Classification of ice crystal habits observed from airborne cloud particle imager by deep transfer learning. Earth. Space. Sci. 2019, 6, 142–149. [Google Scholar] [CrossRef]
- Mishchenko, M.L.; Travis, L.D.; Lacis, A.A. Book Review: Scattering, absorption, and emission of light by small particles/Cambridge University Press, 2002. Space Sci. Rev. 2002, 6, 442. [Google Scholar]
- Tribelsky, M.I.; Luk’Yanchuk, B.S. Anomalous Light Scattering by Small Particles. Phys. Rev. Lett. 2006, 6, 263902. [Google Scholar] [CrossRef] [Green Version]
- Wang, J.H.; Jun-Xiang, G.E.; Wei, M.; Song-Shan, G.U.; Yang, Z.X. Study of the Relationship between Iwc and z for Nonspherical Ice Particles at Millimeter Wavelength. J. Trop. Meteorol. 2016, S1, 11. [Google Scholar]
- Xie, T.; Chen, M.T.; Chen, J.; Lu, F.; An, D.W. Scattering and absorption characteristics of non-spherical cirrus cloud ice crystal particles in terahertz frequency band. Chinese. Phys. B 2020, 29, 145–152. [Google Scholar] [CrossRef]
- Yang, P.; Wei, H.; Huang, H.L.; Baum, B.A.; Fu, Q. Scattering and absorption property database for nonspherical ice particles in the near- Through far-infrared spectral region. Appl. Opt. 2005, 44, 5512–5523. [Google Scholar] [CrossRef] [PubMed] [Green Version]
- Ke, C.; Zhang, H.; Bao, X. Laser scattering properties of agglomerated nucleated shell-structured ice crystallites. Infrared. Laser Eng. 2019, 48, 805008. [Google Scholar]
- Ren, S.H.; Gao, M.; Wang, M.J.; Bao, X.J.; Li, Y. Scattering properties of non-spherical cluster core-shell structure particle laser. Infrared. Laser Eng. 2019, 49, 216–225. [Google Scholar]
- Bazhenov, O.E.; Ponomareva, S.B.; Kaul, B.V.; Samokhvalov, I.V. Physical factors determining the particle spatial orientation in ice clouds. Atmos. Ocean. Opt. C/C Opt. Atmosphy. I Okeana 2008, 21, 20. [Google Scholar]
- Magee, N.; Boaggio, K.; Staskiewicz, S.; Lynn, A.; Zhao, X.; Tusay, N.; Schuh, T.; Bandamede, M.; Bancroft, L.; Connelly, D.; et al. Captured cirrus ice particles in high definition. Atmos. Chem. Phys. 2021, 21, 7171–7185. [Google Scholar] [CrossRef]
- Flatau, P.J.; Draine, B.T. Fast near field calculations in the discrete dipole approximation for regular rectilinear grids. Opt. Express. 2012, 20, 1247–1252. [Google Scholar] [CrossRef] [PubMed]
- Purcell, E.M.; Pennypacker, C.R. Scattering and Absorption of Light by Nonspherical Dielectric Grains. Astrophys. J. 1973, 186, 705–714. [Google Scholar] [CrossRef]
- Draine, B.T.; Flatau, P.J. User Guide for the Discrete Dipole Approximation Code DDSCAT 7.3. arXiv Prepr. 2013, arXiv:1305.6497. [Google Scholar]
- Rao, R.Z. Modern Atmospheric Optics and Its Applications. J. Atmos. Environ. Opt. 2006, 1, 2–13. [Google Scholar]
- Lei, C.X.; Zhang, H.F.; Liu, H.F. Numerical calculation of Mueller matrices of randomly distributed soot cluster agglomerates. Acta Phys. Sin. 2009, 58, 7168–7175. [Google Scholar]
Publisher’s Note: MDPI stays neutral with regard to jurisdictional claims in published maps and institutional affiliations. |
© 2022 by the authors. Licensee MDPI, Basel, Switzerland. This article is an open access article distributed under the terms and conditions of the Creative Commons Attribution (CC BY) license (https://creativecommons.org/licenses/by/4.0/).

