Abstract
Low tropospheric temperature inversion is very common in the Arctic region. Based on the hyperspectral Atmospheric Infrared Sounder (AIRS) profiles from 2002 to 2020, this study provides a comprehensive analysis of the characteristics and anomalies for low tropospheric inversions in the entire Arctic, especially during the summer period. Three types of inversion are classified here, representing the inversions under the clear-sky condition (“clear” inversion), under the cloudy condition with clouds under the inversion layer top (“cloud-I” inversion), and without clouds under the inversion layer top (“cloud-II” inversion). Obvious seasonality is revealed in these three types of inversion, which is stronger in winter than in summer, as per previous studies. We further found that a “summer” peak of inversions occurs in the Arctic, notably in July. Averaged over the study region (60−90° N, 180° W−180° E), the frequencies of “cloud-I” and “cloud-II” inversions peak in July with values of about 22.1% and 34.6%, respectively. Moreover, the three inversion types all display a small “July” peak of inversion strength, ranging from 2.14 to 3.19 K. The result reveals that when the frequency and strength of summer inversions are both with high positive anomalies, there would be a drop in sea ice concentration in September. This implied that the high positive anomalies, both in inversion frequency and strength in summer, might be a predicted signal for the extreme low sea ice event in September. It is also noted that during the extreme low sea ice events in 2007 and 2020, the summer inversion has a strong positive anomaly. However, the summer inversion in 2012, when the sea ice extent also broke the low record, was not extreme as in 2007 and 2020. Further study needs to be supported by follow-up models and observations to evaluate the impact of the inversions on the sea ice.
1. Introduction
The temperature inversion is a reversal phenomenon in which the air temperature in the troposphere increases with the height. In the Arctic, the temperature inversion occurs particularly in the lower troposphere, which may have specific effects on the various climate processes. It has been reported that the inversion may contribute to the high concentrations of the air pollutants [1,2]. Moreover, its strength could affect the formation of low-level clouds and fogs [3,4,5,6]. The temperature inversion also controls the transport of moisture and heat from leads and polynyas [7], and its characteristics are essential for accurate sea-ice modeling and simulations [8,9,10,11]. Studies on temperature inversions are of great significance for the Arctic climate and environment.
The information of the atmospheric vertical structure is usually obtained from the sounding observations. For the Arctic regions, the measurements are mostly based on the coastal sites (e.g., Barrow, Alaska, USA; Ny Ålesund, Norway; Villum, Greenland, et al.), the drifting-ice stations, and some research cruises [12]. Using radiosonde data, a large number of studies have been carried out to investigate the Arctic temperature inversions (e.g., [6,13,14,15,16,17,18,19,20]). It was generally agreed that the temperature inversion is common in the Arctic and has certain seasonal variation characteristics. Strong inversions frequently occur in the Arctic winter, and most of them are ground-based inversions. In summer, the inversion frequency is lower with a shallow layer and weak strength. In the Arctic region, due to the harsh weather and environment, radiosonde data are still relatively scarce. The results are limited to the measurements from the coastal stations and specific drifting-ice stations or detailed measurement campaigns during the certain period. Especially for the area north of 80° N, it is almost a blank area for radiosonde observations.
Satellite remote sensing provides an additional source of information on the vertical air profile of the Arctic, which could greatly improve the understanding of the atmosphere over the central Arctic Ocean. Liu and Key [21] developed an empirical method to estimate the inversion strength or depth in the polar regions based on the data of the dual-infrared channels from the Moderate Resolution Imaging Spectroradiometer (MODIS). Their work provided a new idea for the studies of the high-latitude boundary layer. Furthermore, Liu et al. [22] tried to investigate the long-term trend of the temperature inversion strength in the Arctic cold season, based on the data from High Resolution Infrared Radiation Sounder (HIRS) during 1980–1996. Since the launch of the hyperspectral Atmospheric Infrared Sounder (AIRS) on board the Aqua satellite in 2002, the observational capability to quantify the vertical structure of air temperature from space has been highly improved [23]. A growing number of studies are focused on the assessments (e.g., [24,25,26,27]) and applications of the AIRS vertical air profiles (e.g., [23,28,29,30,31,32,33,34]) in the polar regions. Among these studies, Arctic temperature inversions are of great attention. Devasthale et al. [28] analyzed the characteristics of the clear-sky temperature inversions over the Arctic regions north of 70° N during summer and winter using the AIRS profiles. They also found that inversions in the summer months of 2007, the year of the Arctic extreme sea-ice minimum, were relatively stronger than other years [28]. Pavelsky et al. [29] proved that there was a strong linear relationship between the inversion strength (derived from AIRS) and the mean annual sea-ice concentration in the polar regions, which implied that the sea ice might regulate the inversion strength in winter through surface heat flux. Using the AIRS profiles from October 2002 to September 2013, Devasthale et al. [23] further found that the Arctic clear-sky temperature inversions exhibited complex seasonal and spatial heterogeneity. Up to now, AIRS has accumulated nearly 20 years of air profile data, providing an unprecedented opportunity for the long-term variations of the thermodynamic vertical structure over the Arctic-wide regions, especially for temperature inversions.
Although summer inversions are observed as weaker than winter inversions, their impact on sea ice cannot be ignored. Summer inversion anomalies were discussed by Devasthale et al. in 2010 [28] and Palo et al. in 2017 [20]. Devasthale et al. found that the summer clear-sky inversions in 2007 were much stronger than other years based on the profiles of AIRS [28]. Analyzing the data from the drifting ice station Tara, Palo et al. also found that the summer inversions of 2007 differed from the previous studies [20]. To further investigate the possible relationships between the summer inversion anomalies and the sea ice, we carried out a comprehensive analysis of the characteristics and anomalies of the temperature inversions in the Arctic region, especially focusing on the summer season, by using the profiles derived from AIRS during September 2002 to December 2020. The data and methods are described in Section 2. The corresponding results are shown in Section 3. Discussions and a short summary are provided in Section 4.
2. Materials and Methods
The dataset we used for the Arctic temperature inversion analysis is from the Atmospheric Infrared Sounder (AIRS)/Advanced Microwave Sounding Unit (AMSU)/Humidity Sounder for Brazil (HSB) (AIRS for simplicity) Version 7 (V7) Level 3 (L3) products [35]. The AIRS L3 products are derived from the AIRS level 2 (L2) swath products with quality indicators of “best” or “good”. The uncertainty stated for the global temperature profiles of V7 is 1~2 K/km for the troposphere and 2~3 K/km for the above [36]. Due to the rare ground-based observations, the validation of the AIRS L2 atmospheric vertical profiles in the central Arctic has been highly limited. Some studies have been carried out to assess the AIRS products in the Arctic. For example, the correlations for temperature retrievals are higher than 0.96 (RMS of about 1.2 K in the middle troposphere and 3.0 K near surface) between AIRS of Version 6 (V6) and soundings from Barrow from 2003 to 2014 [23]. According to the official validation report of AIRS L2 V7 products [37], the temperature and water vapor profiles of the new version have been improved over the previous version. Comparing against the radiosonde measurements from three field campaigns, the performance of the thermodynamic profiles in the central Arctic differs by seasons, effective cloud fraction, and underlying surfaces. It states that the V7 produces much smaller temperature biases below 800 hPa than the V6 in the cold seasons of Arctic (January to March) [37], which is helpful for the analysis of the thermodynamic structures in the Arctic.
The L3 products are divided into two main types, including standard and support ones with daily or monthly temporal resolution. Here, we used the temperature profiles contained in the AIRS daily standard L3 product with global coverage at 1° × 1° spatial resolutions for the following analysis. The temperature profiles are derived on 24 pressure levels. Considering that the Arctic atmospheric temperature inversion mostly occurs in the lower troposphere, the temperature profile levels for our study are selected as 1000, 925, 850, 700, 600, and 500 hPa. The dataset from ascending and descending orbits are combined to be processed and analyzed. They are all gridded on 1° × 1° cells. The temperature profiles we used here are named with suffixes of “TqJoint”. They are created by a unified L2 quality control criterion for all fields, which ensures that all data have the same ensembles for comparisons across levels or fields.
We used the data from September 2002 to December 2020 in the regions of 60–90° N, 180° W–180° E for the statistical analysis. The profile is available when the temperature values of all the mentioned levels above are valid. An inversion is defined as the temperature of the upper pressure level being higher than the temperature of the lower level (from 1000 hPa up to 500 hPa). It should be noted that the results also include multilayer inversions. According to our statistics, the proportion of the multilayer inversions is only 0.00037% of total inversions based on AIRS, so we do not make a separate analysis of the multilayer inversions here. The inversion frequency is represented by the percentage of the number of profiles with temperature inversion to the total number of valid profiles. The inversion strength is represented by the temperature difference between the levels on which the inversions occur. In the case of multilayer inversion, the inversion strength is the accumulation of the temperature difference where the inversion occurs.
In addition to the profile data, we also used the total cloud fraction (TCF) and the fine-layer cloud fraction (FCF) data as the auxiliary data for the inversion analysis. For the descriptions of these two variables, please refer to the user guide of AIRS [35,37]. The inversions here are classified into three categories, named as “clear”, “cloud-I”, and “cloud-II” inversions, respectively. The “clear” inversions represent inversions with the TCF of “0”. The “cloud-I” inversions represent inversions with the TCF marked non “0” and the FCF marked non “0” below the inversion top height. The “cloud-II” inversions represent inversions with the TCF marked non “0” and the FCF marked “0” below the inversion top height.
3. Results
3.1. Basic Characteristics
According to the previous studies [14,15,16,19], Arctic inversions are most common in winter with the strongest strength, and in summer the frequency and strength of inversions are relatively lower. The variations of monthly mean temperature inversion frequency and the strength of the three types (defined in Section 2) in the Arctic are displayed in Figure 1a,b. The results here also reveal that temperature inversion in the Arctic shows a strong seasonality. Winter is the period of high occurrence of temperature inversions with stronger strength, while the frequency and strength of inversions in May and September are relatively lower. It should be noted that July has a relatively higher frequency and strength of temperature inversions during the period from spring to autumn. According to Figure 1a, for the “clear” inversions, the frequency is generally less than 20%, which is stronger in winter (December, January, and February). The frequency of the “cloud-I” and “cloud-II” inversions is basically between 10% and 40%. Moreover, the frequency of “cloud-II” inversions is greater than that of “cloud-I” inversions except for September. In addition to the high frequency of inversions in winter, these two types of inversion both have significant peak values in summer. For “cloud-I” and “cloud-II” inversions, the inversion frequency peak in July with values of about 22.1% and 34.6%, respectively. According to Figure 1b, the three inversion types have relatively consistent seasonal variations in strength. It could be noted that there is still a small “July” peak of inversion strength ranging from 2.14 to 3.19 K. Besides, the “clear” inversions have higher strength compared with the other two types.
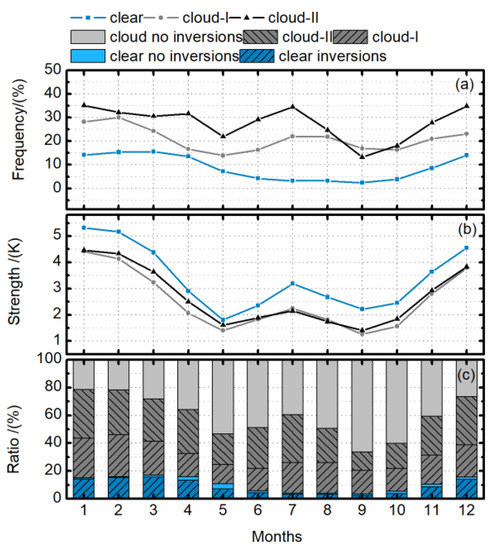
Figure 1.
Variations of monthly mean temperature inversion (a) frequency and (b) strength under “clear” (blue lines), “cloud-I” (gray lines), and “cloud-II” (black lines) conditions in the Arctic; (c) represents the ratios of “clear” inversions (blue slash bars), “clear” with on inversions (light blue bars), “cloud-I” and “cloud-II” inversions (gray slash bars), and “cloud” with no inversions (light gray bars) in all profiles.
Some studies, using data from the meteorological sites near the coast [13,15] or the drifting ice station [20], also noted the small peak of inversion strength in July. However, these results could only represent the situations of a few Arctic sites during specific periods. The descriptions of the entire Arctic still rely on extensive satellite observations. Moreover, using AIRS profile data, Devasthale et al. [28] found that the spatial distribution of the average clear-sky inversion strength appeared a small peak in July in summer during 2003–2008, with a significant positive inversion anomaly appeared in summer 2007. This is consistent with our findings.
Figure 1c displays the percent of three inversion types in all profiles. The result shows that for the Arctic region, the ratio of clear skies is low, generally less than 20%, and the lowest ratio occurs in summer and early autumn, which is between 3% and 6%. For the clear-sky conditions, the ratio of “clear” inversions is relatively high. However, for the cloudy conditions, the ratio of inversions is much lower than that under clear skies. It might suggest that the inversions are more likely to occur in the clear-sky conditions over the Arctic region.
To further study the summer peak percent of inversions, the spatial distributions of monthly mean temperature inversion frequency and strength for “clear”, “cloud-I”, and “cloud-II” types during June to August in the Arctic are shown in Figure 2 and Figure 3, respectively. It should be noted that the white-filled area in Figure 2 and Figure 3 represents that at least one level of the temperature profile in this area is invalid. The results show that there are some differences in the spatial distributions of the three types of inversion in summer. Compared with the other two cloudy types, the “clear” inversions display relative weaker temperature inversion frequency during summer (Figure 2a,c). Moreover, the frequency is nearly stable during the summer months. Only in June did “clear” inversions occur more frequently in the waters off Alaska (Figure 2a). For the “cloud-I” inversions, the high-frequency areas are mainly concentrated over the seas along the coast of Alaska, Siberia, and Greenland (Figure 2d–f). Moreover, from June to August, the areas with high frequency have increased northward gradually. The result here shows that the “July” peak in frequency is mainly due to the “cloud-II” inversions. The high-frequency regions for the “cloud-II” inversions gradually increase from the seas near Alaska and Siberia in June (Figure 2g) to almost covering the entire central Arctic Ocean in July (Figure 2h). In August (Figure 2i), the frequency for the “cloud-II” types decreases significantly, and it mainly concentrated in the sea areas north of 75° N.
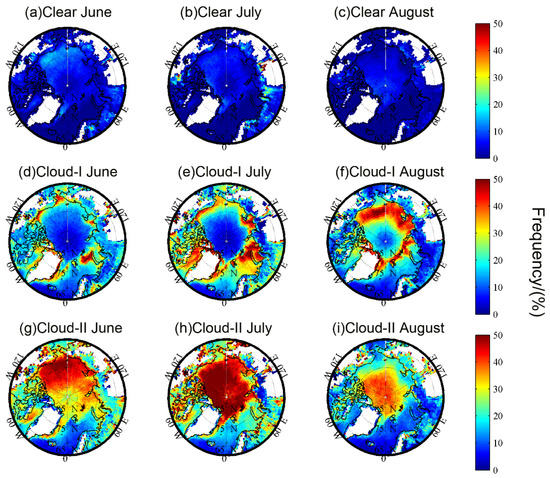
Figure 2.
Spatial distributions of monthly mean temperature inversion frequency for “clear” (a–c), “cloud-I” (d–f), and “cloud-II” (g–i) types in June (a,d,g), July (b,e,h), and August (c,f,i) over the Arctic.
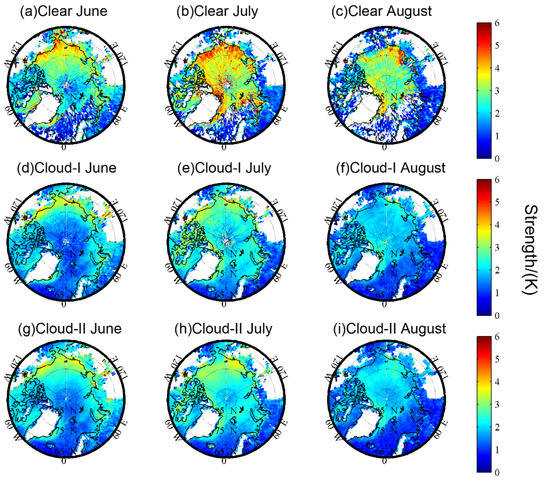
Figure 3.
Spatial distributions of monthly mean temperature inversion strength for “clear” (a–c), “cloud-I” (d–f), and “cloud-II” (g–i) types in June (a,d,g), July (b,e,h), and August (c,f,i) over the Arctic.
The spatial distributions of inversion strength shown in Figure 3 are quite different from the inversion frequency. Consistent with Figure 1, all the three inversions show higher strength in July, and the “clear” inversions are relatively stronger. For the “cloud-I” and “cloud-II” inversions, the spatial distributions of the inversion strength are nearly consistent. For the “clear” inversions, the areas with higher strength are mainly concentrated in the seas along the coast of Alaska, Siberia, and Greenland. The spatial distributions of the clear-sky inversions were also analyzed based on the AIRS profiles during the period of October 2002–September 2013 by Devasthale et al. [23]. They found that the Arctic Pacific sector showed high inversion strength in summer [23]. This is consistent with our findings.
Figure 4 displays the normalized ratios of the pressure levels where the temperature inversion peaks (or as inversion tops) in the Arctic during the summer months for three defined inversions. The results based on the AIRS profiles show that the temperature inversion top in the Arctic summer generally occurs at the levels of 925 and 850 hPa. The distribution of the inversion peak levels varies from June to August. In June, the ratios of the top at 925 hPa for all the three inversions are higher than those at 850 hPa. In July, the ratios of inversion top at 925 hPa increase significantly to about 60–80%. In August, the ratios at 925 hPa decreased for all the three inversions. Moreover, for the “clear” and “cloud-I” inversions, the ratios at 925 hPa drop below 50%, which are lower than those at 850 hPa. Generally, the “cloud-II” inversions are more likely to peak at 925 hpa in the Arctic summer. For the “clear” and “cloud-I” inversions, the inversion tops vary from June to August.
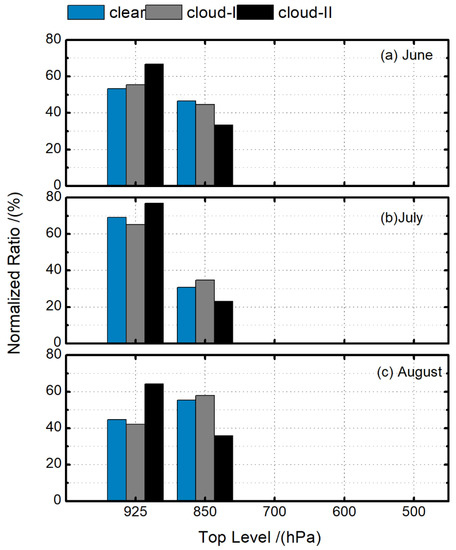
Figure 4.
Normalized ratios of the pressure levels where the temperature inversion peaks for (a) June, (b) July, (c) August for “clear” (blue bars), “cloud-I” (gray bars), and “cloud-II” (black bars) inversions in the Arctic.
The result here seems different from the previous studies, which showed that the surface-based inversion and elevated cloud-top inversion were two main types occurring in the Arctic [18,19,38], and in summer, almost all inversions were elevated [39]. For the previous conclusions, the elevated inversions generally implied that the inversion base was elevated. The results here represent the top heights of the inversions. As we mentioned in Section 2, the AIRS temperature profiles were processed on 24 pressure levels. Due to the vertical resolution of the AIRS products, above 99% of the inversion base are found located at 1000 hPa. The relatively coarse vertical resolution could also result in the underestimations of the near-surface inversions and some shallow inversions. This might be the main reason for the differences, which are further discussed in Section 4.
3.2. Time series and Anomalies
Figure 5 displays the time series and corresponding anomalies of monthly temperature inversion frequency (Figure 5a) and strength (Figure 5b) for all inversions in the Arctic. Results show that the frequency and strength of temperature inversions have tended to decrease since 2002. Especially for the inversion strength in winter, the anomalies turn from positive to negative. Moreover, it could be noted that in Figure 5, the light gray shades mark the years with obvious positive anomalies in both frequency and strength of inversions in summer (June–August), corresponding to the years of 2005, 2007, 2011, and 2020, respectively.
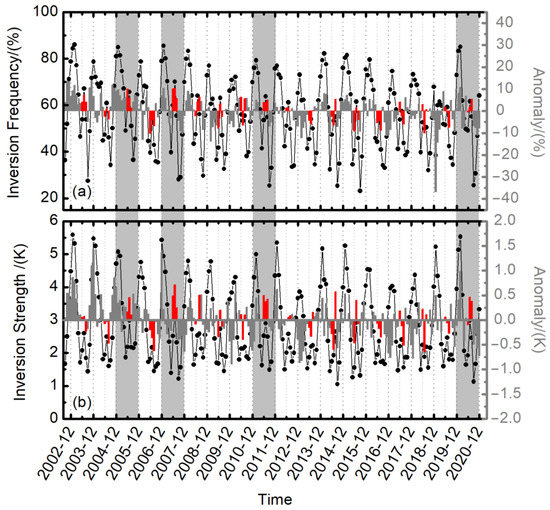
Figure 5.
Time series (dots and lines) and corresponding anomalies (bars) for monthly temperature inversion (a) frequency and (b) strength for all the inversions in the Arctic. Red bars represent the anomalies of the Arctic summer (June to August); gray bars represent the anomalies of the rest months. The light gray shades mark the years with positive anomalies of both frequency and strength during summer.
Figure 6 shows the multiyear change of the mean frequency and strength of summer inversions and the September sea ice concentration, provided by the National Snow and Ice Data Center (NSIDC) [40,41]. The result reveals that when the frequency and strength of summer inversions are both with high values (corresponding to the positive anomalies in Figure 5), there would be a drop in sea ice concentration in September. According to the monthly sea ice concentration data from NSIDC, the Arctic sea ice recorded three significant low values, in 2007, 2012, and 2020, respectively. Figure 6 shows that the frequency and strength of inversions in summer of 2007 and 2020 are both at high levels, except for the year 2012.
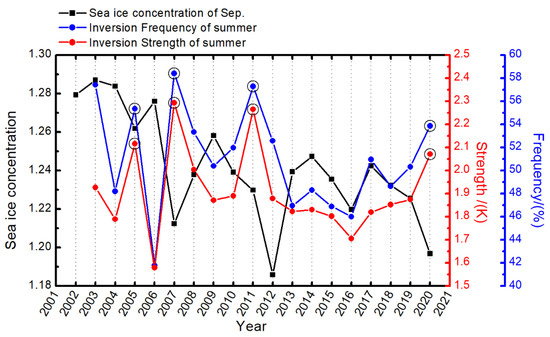
Figure 6.
Time series of sea ice concentration in September (black) and the summer temperature inversion frequency (blue) and strength (red) for all inversions in the Arctic. The black circles mark the years with great positive anomalies for both frequency and strength during summer.
Figure 7 further displays the summer temperature inversion anomalies of frequency and strength for the “clear”, “cloud-I”, and “cloud-II” inversions. The results show that the positive summer anomalies are from different inversion types. For the inversion frequency (Figure 7a), the positive summer frequency anomalies were mainly from “cloud-I” and “clear” inversions in 2007. While, in 2005 and 2020, it was dominated by “clear” and “cloud-II” types. In 2011, the positive summer anomalies were primarily due to the “cloud-II” inversions. For the inversion strength (Figure 7b), the “clear” inversion anomalies were dominant in summer in 2005, 2007, and 2011. While, in 2020, the “clear” and “cloud-II” positive anomalies were comparable.
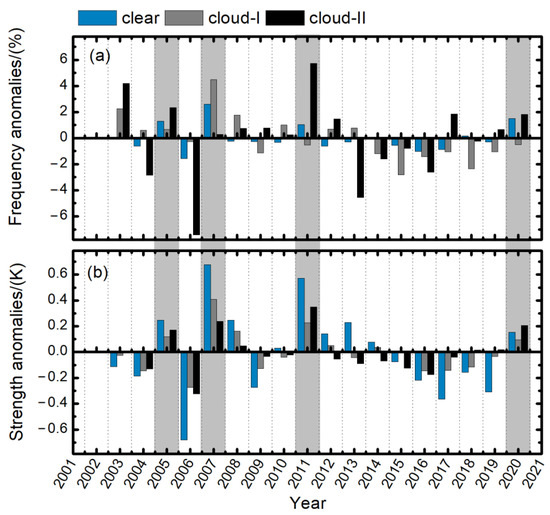
Figure 7.
Anomalies of summer temperature inversion (a) frequency and (b) strength for “clear”, “cloud-I”, and “cloud-II” inversions in the Arctic. Red bars represent the anomalies of June to August; gray bars represent the anomalies of the rest months. The yellow shades mark the years with great anomalies of sea ice extent during September.
“Summer” inversion anomalies were also proposed in the studies by Devasthale et al. in 2010 [28] and Palo et al. in 2017 [20]. Devasthale et al. found that the summer clear-sky inversions in 2007 were stronger than other years using AIRS profiles [28]. Palo et al. also found that summer 2007 inversions differed from the previous studies by the data from the drifting ice station Tara [20]. Moreover, Devasthale et al. studied the differences of the thermodynamic state of the Arctic atmosphere between 2007 and 2012 using the AIRS data from 2003 to 2012 [32]. They found that although the meteorological condition was not extreme in 2012, the preconditioning of the Arctic atmosphere (such as already thinning sea ice during the winter of 2011–2012, stronger and persistent northerly winds, and additional warming over the Canadian Basin and around regions) might lead to the melt and faster transport of sea ice [32].
Since 2002, there have been three sea ice extreme low value events, which occurred in 2007, 2012, and 2020, respectively. The results here reveal that the frequency and strength of temperature inversions continued to show positive anomalies throughout the summer (June to August), except in 2012. It should be noted that in the whole summer of 2011, the inversions also showed positive anomalies both in frequency and strength. According to the analysis of the sea ice extent from NSIDC and our results (Figure 6) here, 2011 was also a record with lower sea ice concentrations. The thinning sea ice throughout the winter of 2011–2012 might be a preconditioning factor for the extreme low sea ice in 2012, as concluded by Devasthale et al. in 2013 [32]. In addition, according to the sea ice analysis from the NSIDC [42], although 2005 was not among the top three smallest years for sea ice, its September sea ice extent was also the lower limit of the “Interdecile Range”. It could be inferred that the high positive anomalies both in inversion frequency and strength in summer might contribute positively to the decrease in sea ice in September.
The comparisons of the spatial distributions between the multi-year average and the sea ice anomaly years are also carried out. Figure 8 and Figure 9 show the results of three defined inversion types for the temperature inversion frequency and strength during June to August, respectively. The results show that in 2007, the frequency of the three inversion types is stronger than the multi-year average, but the areas with high values are quite different. For the “clear” inversions, the high frequency region in 2007 was mainly located in the seas near the Canadian archipelago and off the coast of Alaska. For the “cloud-I” inversions, the high frequency area in 2007 was mainly located in coastal waters between 70°–80° N, while for the “cloud-II” inversions, it was mainly concentrated in the central Arctic regions. In 2020, the inversion frequencies of “clear” and “cloud-II” types were relatively higher than the multi-year average, and the high-frequency areas of “cloud-II” inversions were similar to those of 2007. Meanwhile, the “clear” high-frequency regions were mainly concentrated in the central Arctic regions. As per the conclusions of Devasthale et al. [32], our results show that the inversions in 2012 were slightly stronger than the multi-year average, but not as extreme as the other two years.
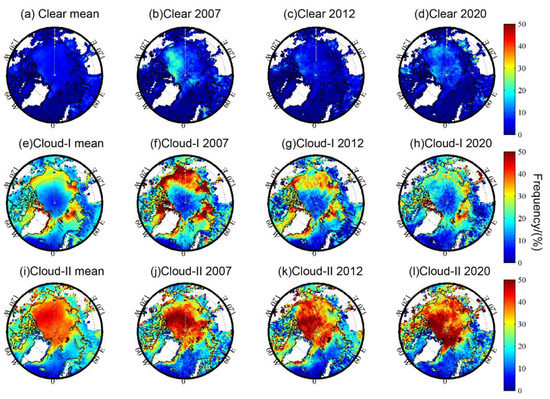
Figure 8.
Comparisons of the temperature inversion frequency from June to August in the Arctic between (a,e,i) multi-yearly mean, (b,f,j) 2007, (c,g,k) 2012, and (d,h,l) 2020; (a–d) represent the “clear” inversions; (e–h) represent the “cloud-I” inversions; (i–l) represent the “cloud-II” inversions.
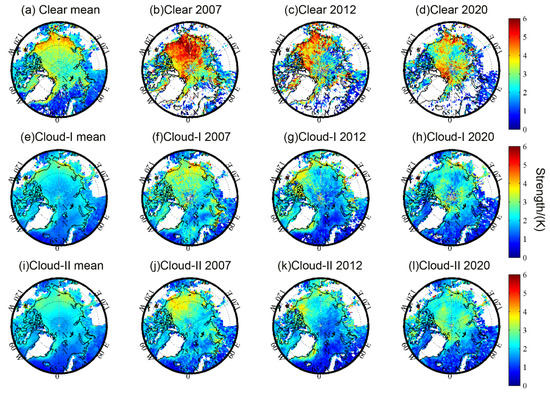
Figure 9.
Comparisons of the temperature inversion strength from June to August in the Arctic between (a,e,i) multi-yearly mean, (b,f,j) year 2007, (c,g,k) year 2012, and (d,h,l) year 2020. (a–d) represent the “clear” inversions; (e–h) represent the “cloud-I” inversions; (i–l) represent the “cloud-II” inversions.
For the spatial distributions of inversion strength, the strength of the “clear” inversions in 2007, 2012, and 2020 were significantly higher than the multi-year average. The results from the “cloud-I” and “cloud-II” inversions in these three years were slightly higher than the multi-year average in some regions. Meanwhile, the result reveals that the high strength region was not exactly consistent with the high frequency region, especially for the “clear” inversions in 2007.
4. Discussion
In this study, the spatial-temporal characteristics and anomalies of Arctic summer temperature inversions have been analyzed based on the AIRS profile data from 2002 to 2020. The inversions here are classified into three types, including “clear”, “cloud-I”, and “cloud-II” inversions. The three types of inversion represent the inversions under the clear-sky condition, under the cloudy condition with clouds under the inversion layer top, and without clouds under the inversion layer top, respectively. Obvious seasonality in these three types of inversions has also been found here. In addition to the common characteristics found in previous studies, such as stronger temperature inversion in winter and lower percent temperature inversion in summer, the results also showed that there was a “summer” peak for the inversion frequency and strength, especially in July. Moreover, the inversion frequency and strength during the entire summer (June to August) are closely correlated with the extreme events of September low sea ice. This implied that the high positive anomalies both in inversion frequency and strength in summer might be a predicted signal for the extreme low sea ice event in September.
Benefiting from the AIRS observations, the entire Arctic inversion characteristics could be obtained and analyzed here. However, due to the features of the AIRS profiles, there are still some issues that need to be noted and discussed as follows:
(1) The first issue that need to be noted is about the vertical resolution. The relatively coarse vertical resolution of AIRS profiles might lead to some different results comparing with the radiosonde data. AIRS temperature profiles are divided into 24 levels in total. The levels involving 1000 hPa, 925 hPa, 850 hPa, 700 hPa, 600 hPa, and 500 hPa are used here for the temperature inversion analysis in the lower troposphere, while the vertical resolution of the radiosonde data is far superior to the AIRS product. Although AIRS could capture most atmospheric inversions in the lower troposphere, there are still some unavoidable biases. Due to the coarse vertical resolution, AIRS might miss some shallow inversions (that is, the thin thickness of inversions). In addition, some inversions that occur close to the surface could also be missed. Moreover, due to the coarse vertical resolution, when the inversion falls between AIRS defined temperature levels, it is difficult to give accurate assessment results based on AIRS profiles only. Therefore, the estimations of the inversion thickness and the inversion top or base height might be different from the existing radiosonde observations.
(2) The second issue that need to be noted is about the inversions under “cloudy” conditions (“cloud-I” and “cloud-II” inversions). The cloud question is complicated. Here, only two main issues are discussed.
Firstly, the “cloud-I” and “cloud-II” inversions defined here are based on the total cloud fraction and the fine-layer cloud fraction data from AIRS. According to the literature (e.g., [18,23]), there are two common conditions of temperature inversions in the Arctic region, the “Clear-sky” inversions are primarily caused by the longwave radiation cooling of the surface, and the inversions under cloudy conditions are due to the longwave cloud-top cooling. Observations also showed that there were two low-level cloud regimes correlated with the Arctic inversions. One is the cloud tops capped by the inversion base, and the other is the cloud inside the inversions [4]. The “cloud-I” inversions defined here includes both two cloud regimes mentioned above, while the “cloud-II” inversions represent the clouds only above the inversion tops. That is to say, the “cloud-I” inversions here roughly represent the inversions caused by the cloud-top longwave radiation cooling. The “cloud-II” inversions represent the inversions primarily caused by the surface cooling.
Secondly, due to the influence of clouds, the accuracy of AIRS low-level profiles has certain biases in the Arctic. Studies showed that the accuracy of AIRS L3 V6 daily products was impacted by the consistent low-level clouds, and the RMSE below 600 hPa was higher than that under clear-sky condition. Here, we used the latest AIRS L3 V7 products. According to the latest AIRS official quality validation report, compared to V6, the RMS and bias in the central Arctic are significantly reduced when the effective cloud fraction is between 0.2 and 0.8. Although the accuracy of new version has been improved, it is still necessary to pay attention to the biases in the evaluations of the atmospheric thermodynamic structure under cloudy conditions compared with in situ sounding data.
(3) The last issue that needs to be noted is about the “summer” anomaly. As our results showed, both of the summer inversions in 2007 and 2020 (extreme low Arctic sea ice events) showed strong positive anomalies in frequency and strength, which implied that positive temperature inversion anomalies in summer could be used as one of the predicted signals of extreme low sea ice events. However, we found that in 2012, when the sea ice also broke the previous record, the summer inversions were not as strong as in 2007 or 2020. While in 2011, there was a strong positive anomaly of summer inversions. According to the sea ice records provided by the NSIDC, the sea ice did get to an abnormal low value, but it did not receive much attention due to the continued decline in sea ice extent in 2012. Studies suggested that the extreme low sea ice in 2012 were partly due to the thinning of sea ice experiencing the winter of 2011–2012 [32]. In addition, atmospheric circulation and wind patterns in 2012 facilitated the transfer of some sea ice out of the Arctic region, resulting in extremely low sea ice [32]. In addition, some studies also analyzed the impact of abnormal storms on the sea ice in 2012 [43,44]. As the factors affecting sea ice are very complex and interrelated, the positive anomalies of the summer inversions suggested in this study might be one of the possible predicted signals for the sea-ice extreme low events. Further studies should be carried out in combination with multi-source observations and models to evaluate the influence to sea ice.
Author Contributions
Conceptualization, J.L.; methodology, J.L. and X.W.; software, X.W. and B.Y.; validation, H.L.; formal analysis, X.W. and J.L.; investigation, X.W. and H.L.; resources, J.L.; data curation, X.W., B.Y. and H.L.; writing–original draft preparation, X.W.; writing–review and editing, J.L.; visualization, J.L.; supervision, J.L.; project administration, J.L.; funding acquisition, J.L. All authors have read and agreed to the published version of the manuscript.
Funding
This research was conducted with funding provided by the National Key R&D Program of China (2021YFC2803300,2021YFC2803303,2018YFC1407200,2018YFC1407204) and the National Natural Science Foundation of China (61531019).
Institutional Review Board Statement
Not applicable.
Informed Consent Statement
Not applicable.
Data Availability Statement
Not applicable.
Acknowledgments
The authors wish to thank the AIRS Science team and GES DISC (NASA) for providing AIRS products freely for this study. In addition, all authors wish to thank the NSIDC for providing the sea ice concentration data. Thanks to the anonymous reviewers for their valuable suggestions regarding this paper.
Conflicts of Interest
The authors declare no conflict of interest.
References
- Bridgman, H.A.; Schnell, R.C.; Kahl, J.D.; Herbert, G.A.; Joranger, E. A major haze event near point barrow, Alaska: Analysis of probable source regions and transport pathways. Atmos. Environ. 1989, 23, 2537–2549. [Google Scholar] [CrossRef]
- Shaw, G.E. The Arctic Haze Phenomenon. Bull. Am. Meteorol. Soc. 1995, 76, 2403–2414. [Google Scholar] [CrossRef]
- Schweiger, A.J.; Lindsay, R.W.; Vavrus, S.; Francis, J.A. Relationships between Arctic Sea Ice and Clouds during Autumn. J. Clim. 2008, 21, 4799–4810. [Google Scholar] [CrossRef]
- Sedlar, J.; Tjernström, M. Stratiform Cloud—Inversion Characterization During the Arctic Melt Season. Bound.-Layer Meteorol. 2009, 132, 455–474. [Google Scholar] [CrossRef]
- Gilson, G.F.; Jiskoot, H.; Cassano, J.J.; Gultepe, I.; James, T.D. The Thermodynamic Structure of Arctic Coastal Fog Occurring During the Melt Season over East Greenland. Bound.-Layer Meteorol. 2018, 168, 443–467. [Google Scholar] [CrossRef]
- Wang, D.; Guo, J.; Chen, A.; Bian, L.; Ding, M.; Liu, L.; Lv, Y.; Li, J.; Guo, X.; Han, Y. Temperature Inversion and Clouds Over the Arctic Ocean Observed by the 5th Chinese National Arctic Research Expedition. J. Geophys. Res. Atmos. 2020, 125, e2019JD032136. [Google Scholar] [CrossRef]
- Andreas, E.L.; Murphy, B. Bulk Transfer Coefficients for Heat and Momentum over Leads and Polynyas. J. Phys. Oceanogr. 1986, 16, 1875–1883. [Google Scholar] [CrossRef] [Green Version]
- Overland, J.E. Atmospheric boundary layer structure and drag coefficients over sea ice. J. Geophys. Res. Ocean. 1985, 90, 9029–9049. [Google Scholar] [CrossRef]
- Hibler, W.D.; Bryan, K. A Diagnostic Ice–Ocean Model. J. Phys. Oceanogr. 1987, 17, 987–1015. [Google Scholar] [CrossRef] [Green Version]
- Overland, J.E.; Davidson, K.L. Geostrophic drag coefficients over sea ice. Tellus A Dyn. Meteorol. Oceanogr. 1992, 44, 54–66. [Google Scholar] [CrossRef] [Green Version]
- Boé, J.; Hall, A.; Qu, X. Current GCMs’ Unrealistic Negative Feedback in the Arctic. J. Clim. 2009, 22, 4682–4695. [Google Scholar] [CrossRef] [Green Version]
- Vihma, T.; Uotila, P.; Sandven, S.; Pozdnyakov, D.; Makshtas, A.; Pelyasov, A.; Pirazzini, R.; Danielsen, F.; Chalov, S.; Lappalainen, H.K.; et al. Towards an advanced observation system for the marine Arctic in the framework of the Pan-Eurasian Experiment (PEEX). Atmos. Chem. Phys. 2019, 19, 1941–1970. [Google Scholar] [CrossRef] [Green Version]
- Kahl, J.D. Characteristics of the low-level temperature inversion along the Alaskan Arctic coast. Int. J. Climatol. 1990, 10, 537–548. [Google Scholar] [CrossRef]
- Bradley, R.S.; Keimig, F.T.; Diaz, H.F. Climatology of surface-based inversions in the North American Arctic. J. Geophys. Res. Atmos. 1992, 97, 15699–15712. [Google Scholar] [CrossRef] [Green Version]
- Kahl, J.D.; Serreze, M.C.; Schnell, R.C. Tropospheric low-level temperature inversions in the Canadian Arctic. Atmos.-Ocean 1992, 30, 511–529. [Google Scholar] [CrossRef]
- Serreze, M.C.; Kahl, J.D.; Schnell, R.C. Low-Level Temperature Inversions of the Eurasian Arctic and Comparisons with Soviet Drifting Station Data. J. Clim. 1992, 5, 615–629. [Google Scholar] [CrossRef]
- Kahl, J.D.W.; Martinez, D.A.; Zaitseva, N.A. Long-term variability in the low-level inversion layer over the arctic ocean. Int. J. Climatol. 1996, 16, 1297–1313. [Google Scholar] [CrossRef]
- Tjernström, M.; Leck, C.; Persson, O.; Jensen, M.; Oncley, S.; Targino, A. The Summertime Arctic Atmosphere: Meteorological Measurements during the Arctic Ocean Experiment 2001. Bull. Am. Meteorol. Soc. 2004, 85, 1305–1322. [Google Scholar] [CrossRef]
- Tjernström, M.; Graversen, R.G. The vertical structure of the lower Arctic troposphere analysed from observations and the ERA-40 reanalysis. Q. J. R. Meteorol. Soc. 2009, 135, 431–443. [Google Scholar] [CrossRef]
- Palo, T.; Vihma, T.; Jaagus, J.; Jakobson, E. Observations of temperature inversions over central Arctic sea ice in summer. Q. J. R. Meteorol. Soc. 2017, 143, 2741–2754. [Google Scholar] [CrossRef]
- Liu, Y.; Key, J.R. Detection and Analysis of Clear-Sky, Low-Level Atmospheric Temperature Inversions with MODIS. J. Atmos. Ocean. Technol. 2003, 20, 1727–1737. [Google Scholar] [CrossRef]
- Liu, Y.; Key, J.R.; Schweiger, A.; Francis, J. Characteristics of Satellite-Derived Clear-Sky Atmospheric Temperature Inversion Strength in the Arctic, 1980–96. J. Clim. 2006, 19, 4902–4913. [Google Scholar] [CrossRef]
- Devasthale, A.; Sedlar, J.; Kahn, B.H.; Tjernström, M.; Fetzer, E.J.; Tian, B.; Teixeira, J.; Pagano, T.S. A Decade of Spaceborne Observations of the Arctic Atmosphere: Novel Insights from NASA’s AIRS Instrument. Bull. Am. Meteorol. Soc. 2016, 97, 2163–2176. [Google Scholar] [CrossRef]
- Hearty, T.J.; Savtchenko, A.; Tian, B.; Fetzer, E.; Yung, Y.L.; Theobald, M.; Vollmer, B.; Fishbein, E.; Won, Y.-I. Estimating sampling biases and measurement uncertainties of AIRS/AMSU-A temperature and water vapor observations using MERRA reanalysis. J. Geophys. Res. Atmos. 2014, 119, 2725–2741. [Google Scholar] [CrossRef] [Green Version]
- Chang, L.; Feng, G.; Zhang, Y.; He, X. Effect of Cloud Fraction on Arctic Low-Level Temperature Inversions in AIRS Observations Over Both Land and Ocean. IEEE Trans. Geosci. Remote Sens. 2018, 56, 2025–2032. [Google Scholar] [CrossRef]
- Sedlar, J.; Tjernström, M. A Process-Based Climatological Evaluation of AIRS Level 3 Tropospheric Thermodynamics over the High-Latitude Arctic. J. Appl. Meteorol. Climatol. 2019, 58, 1867–1886. [Google Scholar] [CrossRef]
- Crewell, S.; Ebell, K.; Konjari, P.; Mech, M.; Nomokonova, T.; Radovan, A.; Strack, D.; Triana-Gómez, A.M.; Noël, S.; Scarlat, R.; et al. A systematic assessment of water vapor products in the Arctic: From instantaneous measurements to monthly means. Atmos. Meas. Tech. 2021, 14, 4829–4856. [Google Scholar] [CrossRef]
- Devasthale, A.; Willén, U.; Karlsson, K.G.; Jones, C.G. Quantifying the clear-sky temperature inversion frequency and strength over the Arctic Ocean during summer and winter seasons from AIRS profiles. Atmos. Chem. Phys. 2010, 10, 5565–5572. [Google Scholar] [CrossRef] [Green Version]
- Pavelsky, T.M.; Boé, J.; Hall, A.; Fetzer, E.J. Atmospheric inversion strength over polar oceans in winter regulated by sea ice. Clim. Dyn. 2011, 36, 945–955. [Google Scholar] [CrossRef]
- Devasthale, A.; Sedlar, J.; Tjernström, M. Characteristics of water-vapour inversions observed over the Arctic by Atmospheric Infrared Sounder (AIRS) and radiosondes. Atmos. Chem. Phys. 2011, 11, 9813–9823. [Google Scholar] [CrossRef] [Green Version]
- Sedlar, J.; Devasthale, A. Clear-sky thermodynamic and radiative anomalies over a sea ice sensitive region of the Arctic. J. Geophys. Res. Atmos. 2012, 117, D19111. [Google Scholar] [CrossRef] [Green Version]
- Devasthale, A.; Sedlar, J.; Koenigk, T.; Fetzer, E.J. The thermodynamic state of the Arctic atmosphere observed by AIRS: Comparisons during the record minimum sea ice extents of 2007 and 2012. Atmos. Chem. Phys. 2013, 13, 7441–7450. [Google Scholar] [CrossRef] [Green Version]
- Boisvert, L.N.; Stroeve, J.C. The Arctic is becoming warmer and wetter as revealed by the Atmospheric Infrared Sounder. Geophys. Res. Lett. 2015, 42, 4439–4446. [Google Scholar] [CrossRef]
- Chang, L.; Gao, G.; Li, Y.; Zhang, Y.; Zhang, C.; Zhang, Y.; Feng, G. Variations in Water Vapor From AIRS and MODIS in Response to Arctic Sea Ice Change in December 2002–November 2016. IEEE Trans. Geosci. Remote Sens. 2019, 57, 7395–7405. [Google Scholar] [CrossRef]
- Tian, B.; Manning, E.; Roman, J.; Thrastarson, H.; Fetzer, E.; Monarrez, R. AIRS Version 7 Level 3 Product User Guide. Available online: https://docserver.gesdisc.eosdis.nasa.gov/public/project/AIRS/V7_L3_Product_User_Guide.pdf (accessed on 26 January 2022).
- Manning, E.; Kahn, B.; Fetzer, E.J.; Yue, Q.; Wong, S.; Kalmus, P.; Payne, V.; Wang, T.; Olsen, E.T.; Wilson, R.C.; et al. AIRS/AMSU/HSB Version 7 Level 2 Product User Guide. Available online: https://docserver.gesdisc.eosdis.nasa.gov/public/project/AIRS/V7_L2_Product_User_Guide.pdf (accessed on 26 January 2022).
- Blaisdell, J.M.; Farahmand, A.; Fetzer, E.J.; Fishbein, E.; Griffin, E.; Iredell, L.; Irion, F.W.; Kahn, B.H.; Kalmus, P.; Manning, E.; et al. AIRS Version 7 Level 2 Performance Test and Validation Report. Available online: https://docserver.gesdisc.eosdis.nasa.gov/public/project/AIRS/V7_L2_Performance_Test_and_Validation_report.pdf (accessed on 26 January 2022).
- Sedlar, J.; Shupe, M.D.; Tjernström, M. On the Relationship between Thermodynamic Structure and Cloud Top, and Its Climate Significance in the Arctic. J. Clim. 2012, 25, 2374–2393. [Google Scholar] [CrossRef]
- Tjernström, M.; Birch, C.E.; Brooks, I.M.; Shupe, M.D.; Persson, P.O.G.; Sedlar, J.; Mauritsen, T.; Leck, C.; Paatero, J.; Szczodrak, M.; et al. Meteorological conditions in the central Arctic summer during the Arctic Summer Cloud Ocean Study (ASCOS). Atmos. Chem. Phys. 2012, 12, 6863–6889. [Google Scholar] [CrossRef] [Green Version]
- Windnagel, A. NOAA/NSIDC Climate Data Record of Passive Microwave Sea Ice Concentration, Version 3 User Guide. Available online: https://nsidc.org/sites/nsidc.org/files/G02202-V001-UserGuide.pdf (accessed on 26 January 2022).
- Meier, W.N.; Fetterer, F.; Savoie, M.; Mallory, S.; Duerr, R.; Stroeve, J. NOAA/NSIDC Climate Data Record of Passive Microwave Sea Ice Concentration, Version 3. 2017. Available online: https://nsidc.org/data/g02202/versions/3 (accessed on 14 January 2022).
- Charctic Interactive Sea Ice Graph. Available online: https://nsidc.org/arcticseaicenews/charctic-interactive-sea-ice-graph/ (accessed on 26 January 2022).
- Parkinson, C.L.; Comiso, J.C. On the 2012 record low Arctic sea ice cover: Combined impact of preconditioning and an August storm. Geophys. Res. Lett. 2013, 40, 1356–1361. [Google Scholar] [CrossRef]
- Zhang, J.; Lindsay, R.; Schweiger, A.; Steele, M. The impact of an intense summer cyclone on 2012 Arctic sea ice retreat. Geophys. Res. Lett. 2013, 40, 720–726. [Google Scholar] [CrossRef]
Publisher’s Note: MDPI stays neutral with regard to jurisdictional claims in published maps and institutional affiliations. |
© 2022 by the authors. Licensee MDPI, Basel, Switzerland. This article is an open access article distributed under the terms and conditions of the Creative Commons Attribution (CC BY) license (https://creativecommons.org/licenses/by/4.0/).