Article

Interannual and Seasonal Variation of Optical and Microphysical Properties of Aerosol in the Baikal Region

Institute of Physical Materials Science of Siberian Branch of Russian Academy of Sciences, 670047 Ulan-Ude, Russia
*
Author to whom correspondence should be addressed.
Atmosphere 2022, 13(2), 211; https://doi.org/10.3390/atmos13020211
Submission received: 1 January 2022 / Revised: 21 January 2022 / Accepted: 26 January 2022 / Published: 28 January 2022
(This article belongs to the Section Aerosols)

Abstract

:
The paper analyzes the interannual, seasonal variations of the optical and microphysical characteristics of aerosol in the Baikal region atmosphere according to measurements using the CIMEL sun photometer of the AERONET network at Tory station and according to the data of expedition measurements using the SP-9 sun photometer on the southeastern coast of Lake Baikal from 2010 to 2020. It is shown that in recent years, there has been an increase of the average monthly aerosol optical depth (AOD) values in the summer months, which is consistent with an increase in smoke emission due to annual large-scale wildfires in the boreal forests of Siberia and Yakutia in summer. Aerosol classification was carried out based on filtration and selection of the prevailing types of aerosols by analysis of aerosol optical depth and Angstrom exponent. It was revealed that in summer, the proportion of the smoke component of the aerosol optical depth increases to 30% compared to the spring. In the presence of smoke advection, the close relationship of AOD with the concentrations of the microdispersed aerosol fraction PM10 and PM2.5 was revealed. The correlation coefficients between the concentration of particulate matter (PM10 and PM2.5) and AOD were 0.87 and 0.86, respectively.

1. Introduction

Atmospheric aerosols are a complex chemical mixture of solid and liquid particles suspended in the air. They vary in size from the smallest ultrafine shape with a diameter of several nanometers to large particles with a diameter of several micrometers or more [1,2]. The impact of atmospheric aerosols on the radiative balance is still highly uncertain due to their large spatial and temporal variability, variability in composition, size distribution, particle shape and vertical distribution [3]. Research into the properties of aerosols and their spatial and temporal variability, is helping to improve knowledge about the climate change we are currently facing [4,5,6,7,8].
The main parameter for understanding the effect of aerosol on climate is the aerosol optical depth (AOD). AOD is a dimensionless parameter that indicates the extent to which radiation transmission is impeded by absorption or scattering of sunlight through aerosols in the atmosphere. AOD plays a key role in characterizing atmospheric turbidity and it is indicated by aerosol pollution [9,10,11,12].
To assess the effect of aerosols on climate, it is necessary to obtain accurate and reliable data of the optical and microphysical aerosol properties. Therefore, regular network observations of atmospheric transparency in different regions of the globe play an important role in understanding the patterns of variability of radiation-active components of the atmosphere. The global ground network of stations AERONET (Aerosol Robotic Network, http://aeronet.gsfc.nasa.gov (accessed on 8 December 2021) meets the most modern requirements for uniformity of measurements and global coverage. It numbers more than 300 stations on all continents of the planet and provides continuous monitoring of aerosol properties with high temporal resolution [13]. AERONET measures the aerosol optical depth (AOD) of the atmosphere at several wavelengths from 340 to 1020 nm and obtains other optically effective aerosol properties [14]. AERONET presents data of three levels: Level 1—preliminary; Level 1.5—after cleaning procedures from cloudiness and other distortions; Level 2.0—final data after instrument recalibration.
AERONET data allow the identification of the main classes of aerosols, using the aerosol optical depth and Angstrom exponent (AE) [15,16,17]. Knowledge of aerosols type classified according to aerosol properties is essential information for many studies related to aerosol radiative forcing, climate modeling or air pollution [18,19]. The aerosol type classification is mainly based on the categorization of the optical properties of aerosols with the size and amount of aerosol particles. The Angstrom exponent is often used as a qualitative indicator of aerosol particle size, which is dependent on the wavelength of light. The spectral curvature of the AE provides useful information on the size distribution of aerosols.
The Angstrom exponent was calculated by the formula [20]:
α = log τ λ 1 τ λ 2 log λ 1 λ 2 ,
where τλ1 is AOD at a wavelength of 440 nm, τλ2 is AOD at a wavelength of 870 nm; λ1 is the wavelength at 440 nm and λ2 is the wavelength at 870 nm.
The contribution of the aerosol component to the transparency of the atmosphere varies considerably depending on the geographic location, meteorological factors, the nature of the underlying surface, and the influence of natural and anthropogenic sources of aerosol entry into the atmosphere [21,22].
Studies of the optical and microphysical properties of aerosol in the Baikal region are especially relevant for Lake Baikal, which is a UNESCO World Natural Heritage Site. Assessment of environmental damage to the ecosystem of Lake Baikal is still an unresolved problem due to the increasing anthropogenic load and extreme natural phenomena such as forest fires. There are few such studies in the Baikal region, and they are different [23,24], because there is no integrated air pollution monitoring program that meets modern requirements. At present, experimental studies of the quantitative and qualitative composition of atmospheric impurities are mainly of an episodic nature [25].
One of the significant sources of atmospheric pollution in the Baikal region is smoke aerosol emissions from wildfires, the number of which is increasing due to climate warming in the region [26]. This article discusses long-term data on aerosol optical depth, Angstrom exponent, volume size distribution of particle (VSD) and single scattering albedo (SSA) in the Baikal region.

2. Materials and Methods

This paper presents the main characteristics of optical and microphysical properties of aerosol using long-term observational data of AERONET, including the aerosol optical depth, Angstrom exponent, single scattering albedo, volume particle size distribution and classification of the type of aerosol at Tory station and at the “Boyarsky” scientific station of the Institute of physical materials science Siberian branch of Russian academy of sciences from 2010 to 2020.
Five main classes of aerosols have been identified using aerosol optical depth and Angstrom exponent. If AOD < 0.2 and AE > 1, the type of aerosol is continental, corresponding to background conditions, with AOD < 0.2 and AE < 0.7 the aerosol type is marine, if AOD > 0.3 and AE > 1, the type of aerosol is smoke/burning biomass (BB) and for AOD > 0.6 with AE < 0.7, the type of aerosol is Desert dust (DD). The rest of the points that do not belong to any of the above groups refer to mixed (MX) types of aerosols [5,15].
Experimental measurements of the aerosol optical depth in the Boyarsky station atmosphere were carried out using an SP-9 multiwave sun photometer in the wavelength range of 340–2200 nm. The SP-9 multiwave sun photometer was developed at the Institute atmosphere optics Siberian branch of the Russian academy of sciences (Tomsk, Russia) for year-round measurements of atmospheric transparency for the subsequent determination of the aerosol optical depth and atmospheric moisture content. The error in determining the aerosol optical depth is 0.01–0.02. The process is fully automated and is carried out without the participation of an operator.
The automated mode of device operation provides for the following functions [21]:
(1)
Determination with the help of sun sensor situations of “cloudless sun”;
(2)
First, rough aiming of the photometer, then precise tracking of the sun;
(3)
Measurement and signals accumulation of atmosphere spectral transparency;
(4)
When the sun is covered by clouds—transfer of the photometer to the “parking” position;
(5)
Self-diagnostics—control of the photometer temperature, supply voltages, etc.
Ground measurements of the aerosol optical depth at the Tory station AERONET network atmosphere is carried out by a multichannel sun photometer CIMEL-318 with a field of view of 1.2° at 8 wavelengths from 340 to 1020 nm. The calculated error of AOD recovery with regular calibration of the photometer is ±0.01–0.02 in the near-infrared and visible wavelength ranges.
Measurements of meteorological parameters in the Boyarsky station atmosphere were carried out using the acoustic meteorological complex AMK-03 (OOO Sibanalitpribor, Tomsk, Russia). Meteocomplex AMK-03 provides information on the instantaneous values of wind speed (in three mutually perpendicular directions) and air temperature with a resolution of no more than 0.01 m/s for wind speed and no more than 0.01 °C for air temperature, with the frequency of measurement of these values from 10 to 160 Hz [27]. This allows the product to be used for assessing the characteristics of air turbulence, including temperature gradients (calculation based on the Monin-Obukhov similarity theory, a calculation program used by the Institute of monitoring of climatic and ecological systems Siberian branch of Russian Academy of sciences). The average ten-minute values of temperature were calculated, in which its jumps are removed, which go beyond the confidence interval of values (95%).
To measure the mass concentration of PM2.5 and PM10, the Boyarsky station used a diffusion aerosol spectrometer (DAS 2702M), developed by OOO AeroNanoTech, Moscow, Russia. The time of one measurement is from 1 min to 3 min, depending on the measurement conditions. DAS 2702M consists of diffusion batteries, a counter of condensation nuclei and a computer that controls the operation of the device. The device is equipped with a module for measuring submicron aerosol particles with sizes from 0.2 to 10 microns. The main units of the condensation nuclei counter are the condensation enlarger of aerosol particles and the optical counter of particles. In diffusion batteries, highly dispersed aerosols are deposited, the efficiency of which is determined by measuring the particle slip through each battery with a known geometry. The small size of the measured particles excludes their direct measurement by an optical counter, necessitating the use of an additional unit for preliminary aerosol enlargement, installed in front of the entrance to the optical counter of particles. After passing a fine aerosol through the zone of saturated vapors and condensation growth to an optically active size, their concentration is determined by direct measurement using an optical counter [28].
The HYSPLIT (HYbrid Single-Particle Lagrangian Integrated Trajectory) trajectory model [29,30] was used to determine the paths of air mass transfer over the Baikal region.
The analysis of the vertical aerosol distribution and determination of its type was carried out using the measurement data of the space based CALIOP lidar on the CALIPSO satellite [31].
The study of atmospheric aerosol transport and the distribution of the dominant aerosol components (sulfate aerosol, dust and fumes) was carried out using the global aerosol model NAAPS (Navy Aerosol Analysis and Prediction System) [32], which generates operational six-day forecasts for sulfates, dust, smoke, sea salt and SO2. The model quickly assimilates the filtered and corrected aerosol optical depths of MODIS [33,34]. Model outputs data are available as a 1° × 1° grid with 6-h intervals and 24 vertical levels reaching 100 mbar.

3. Results and Discussion
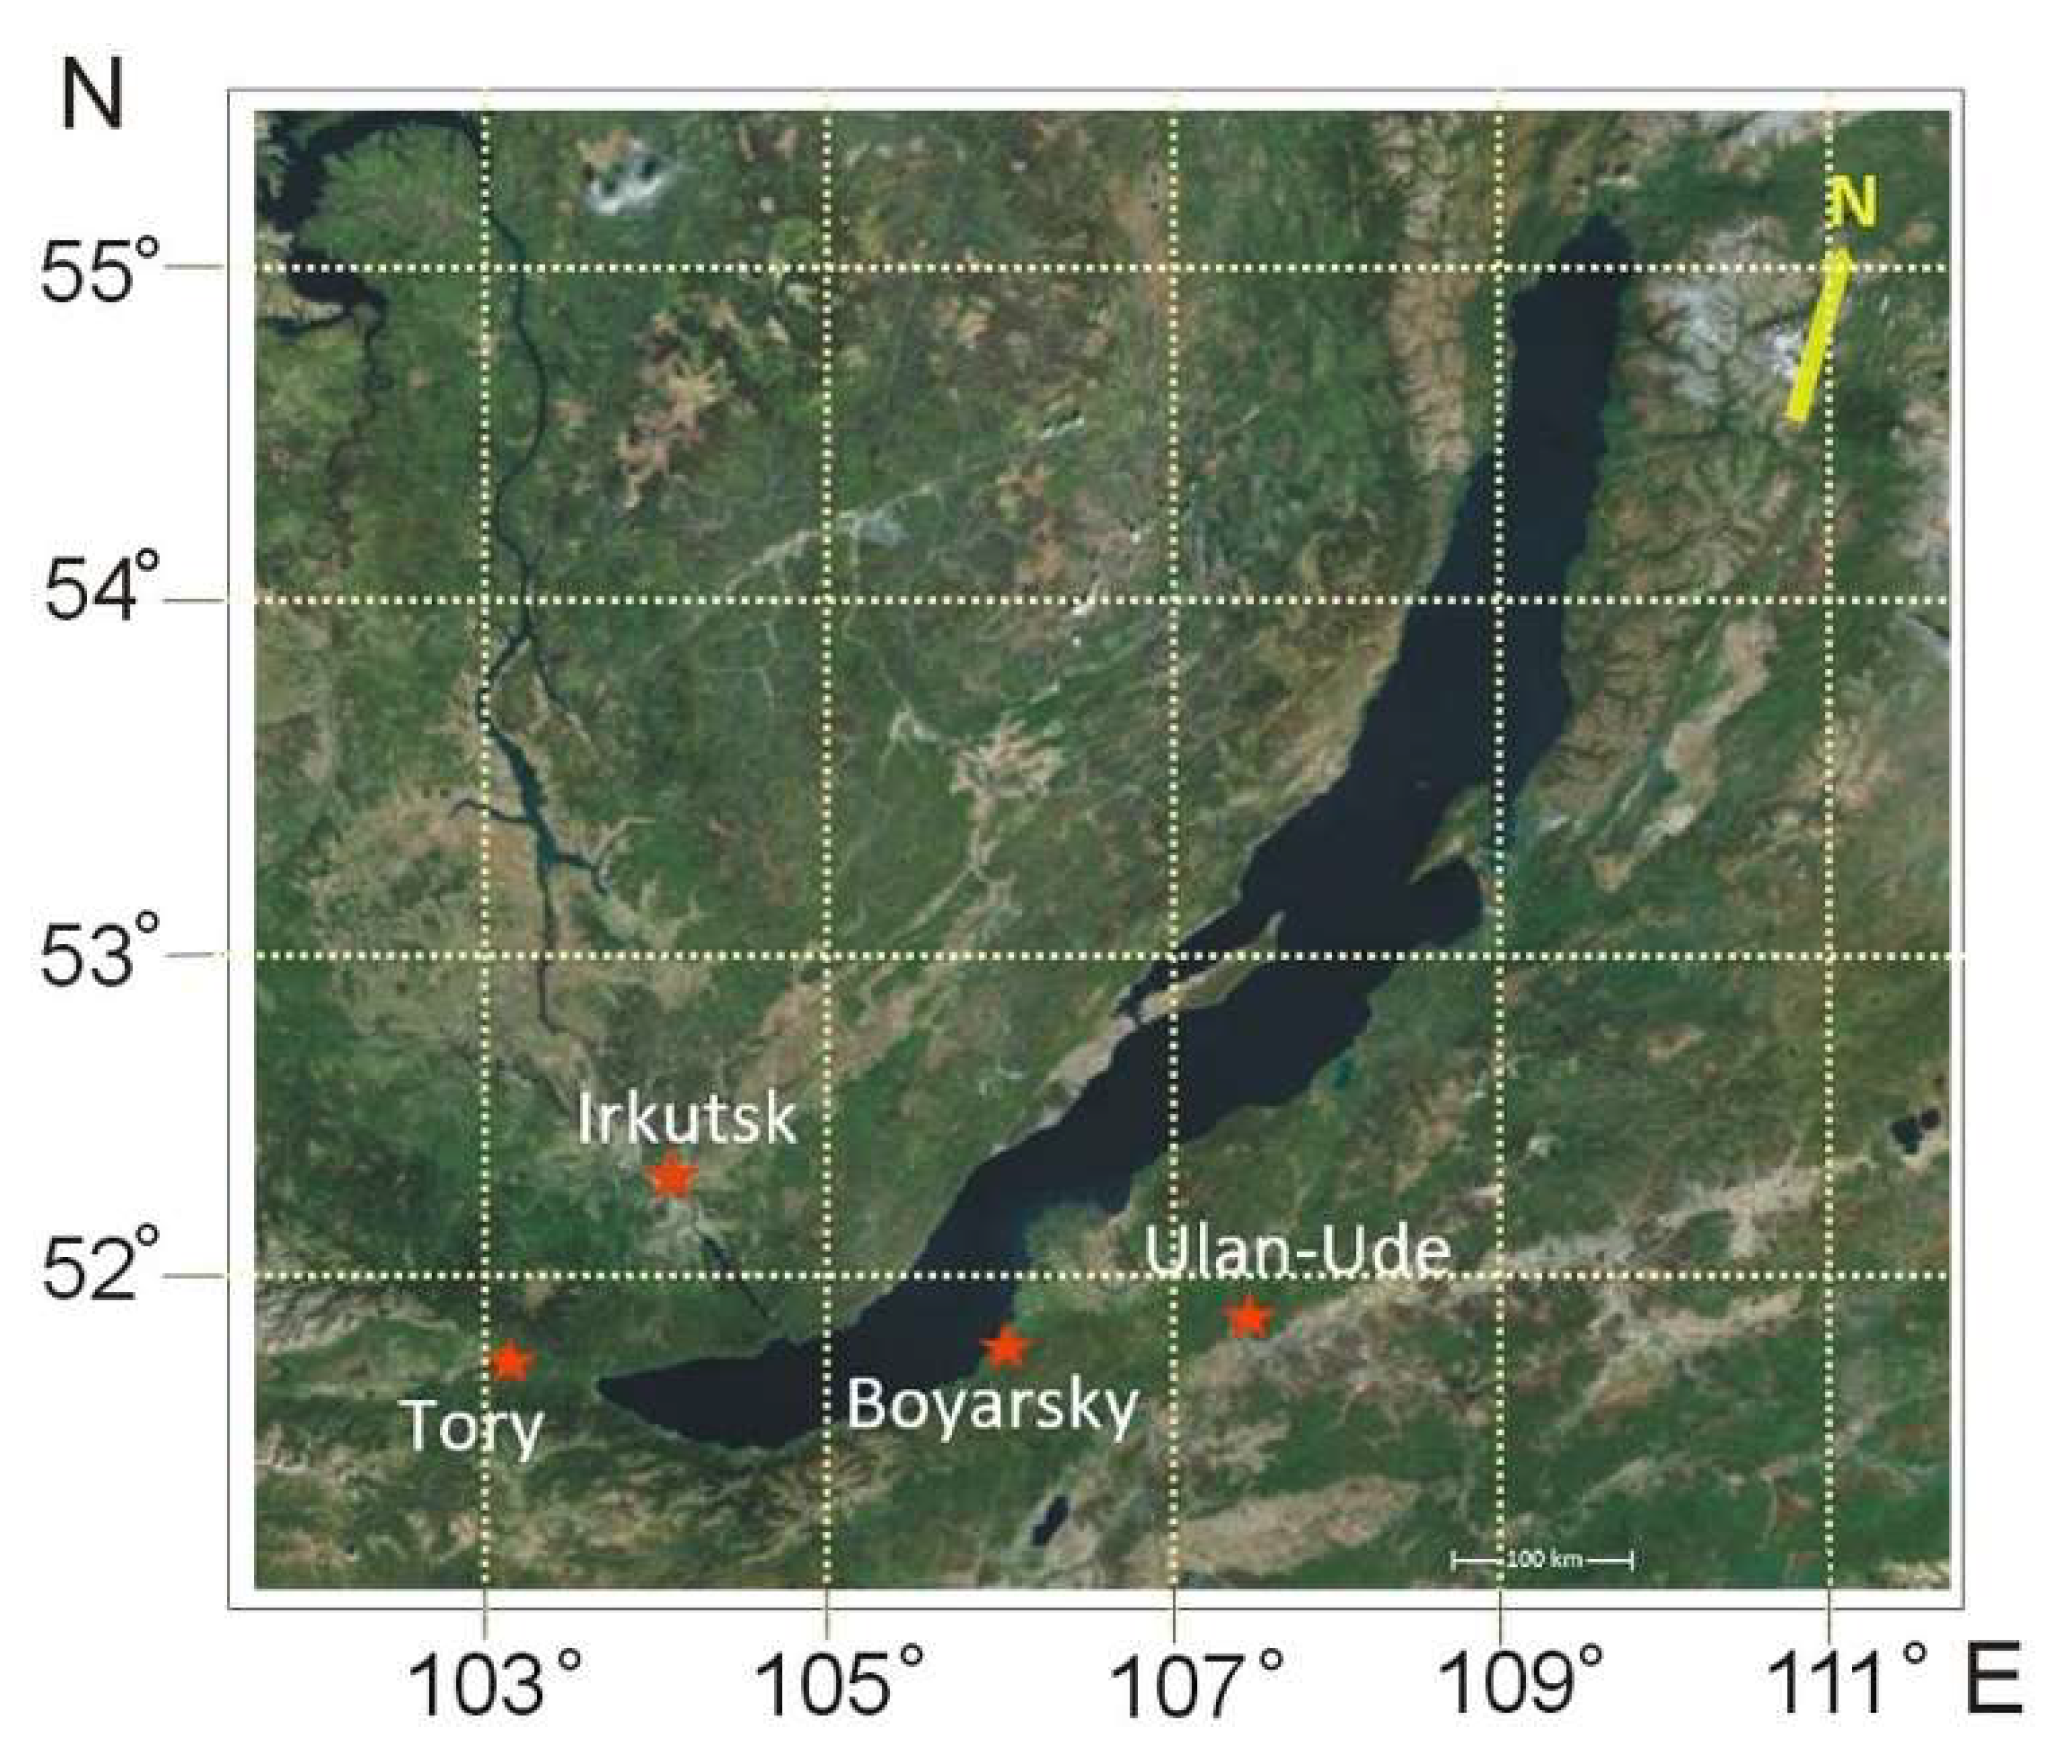
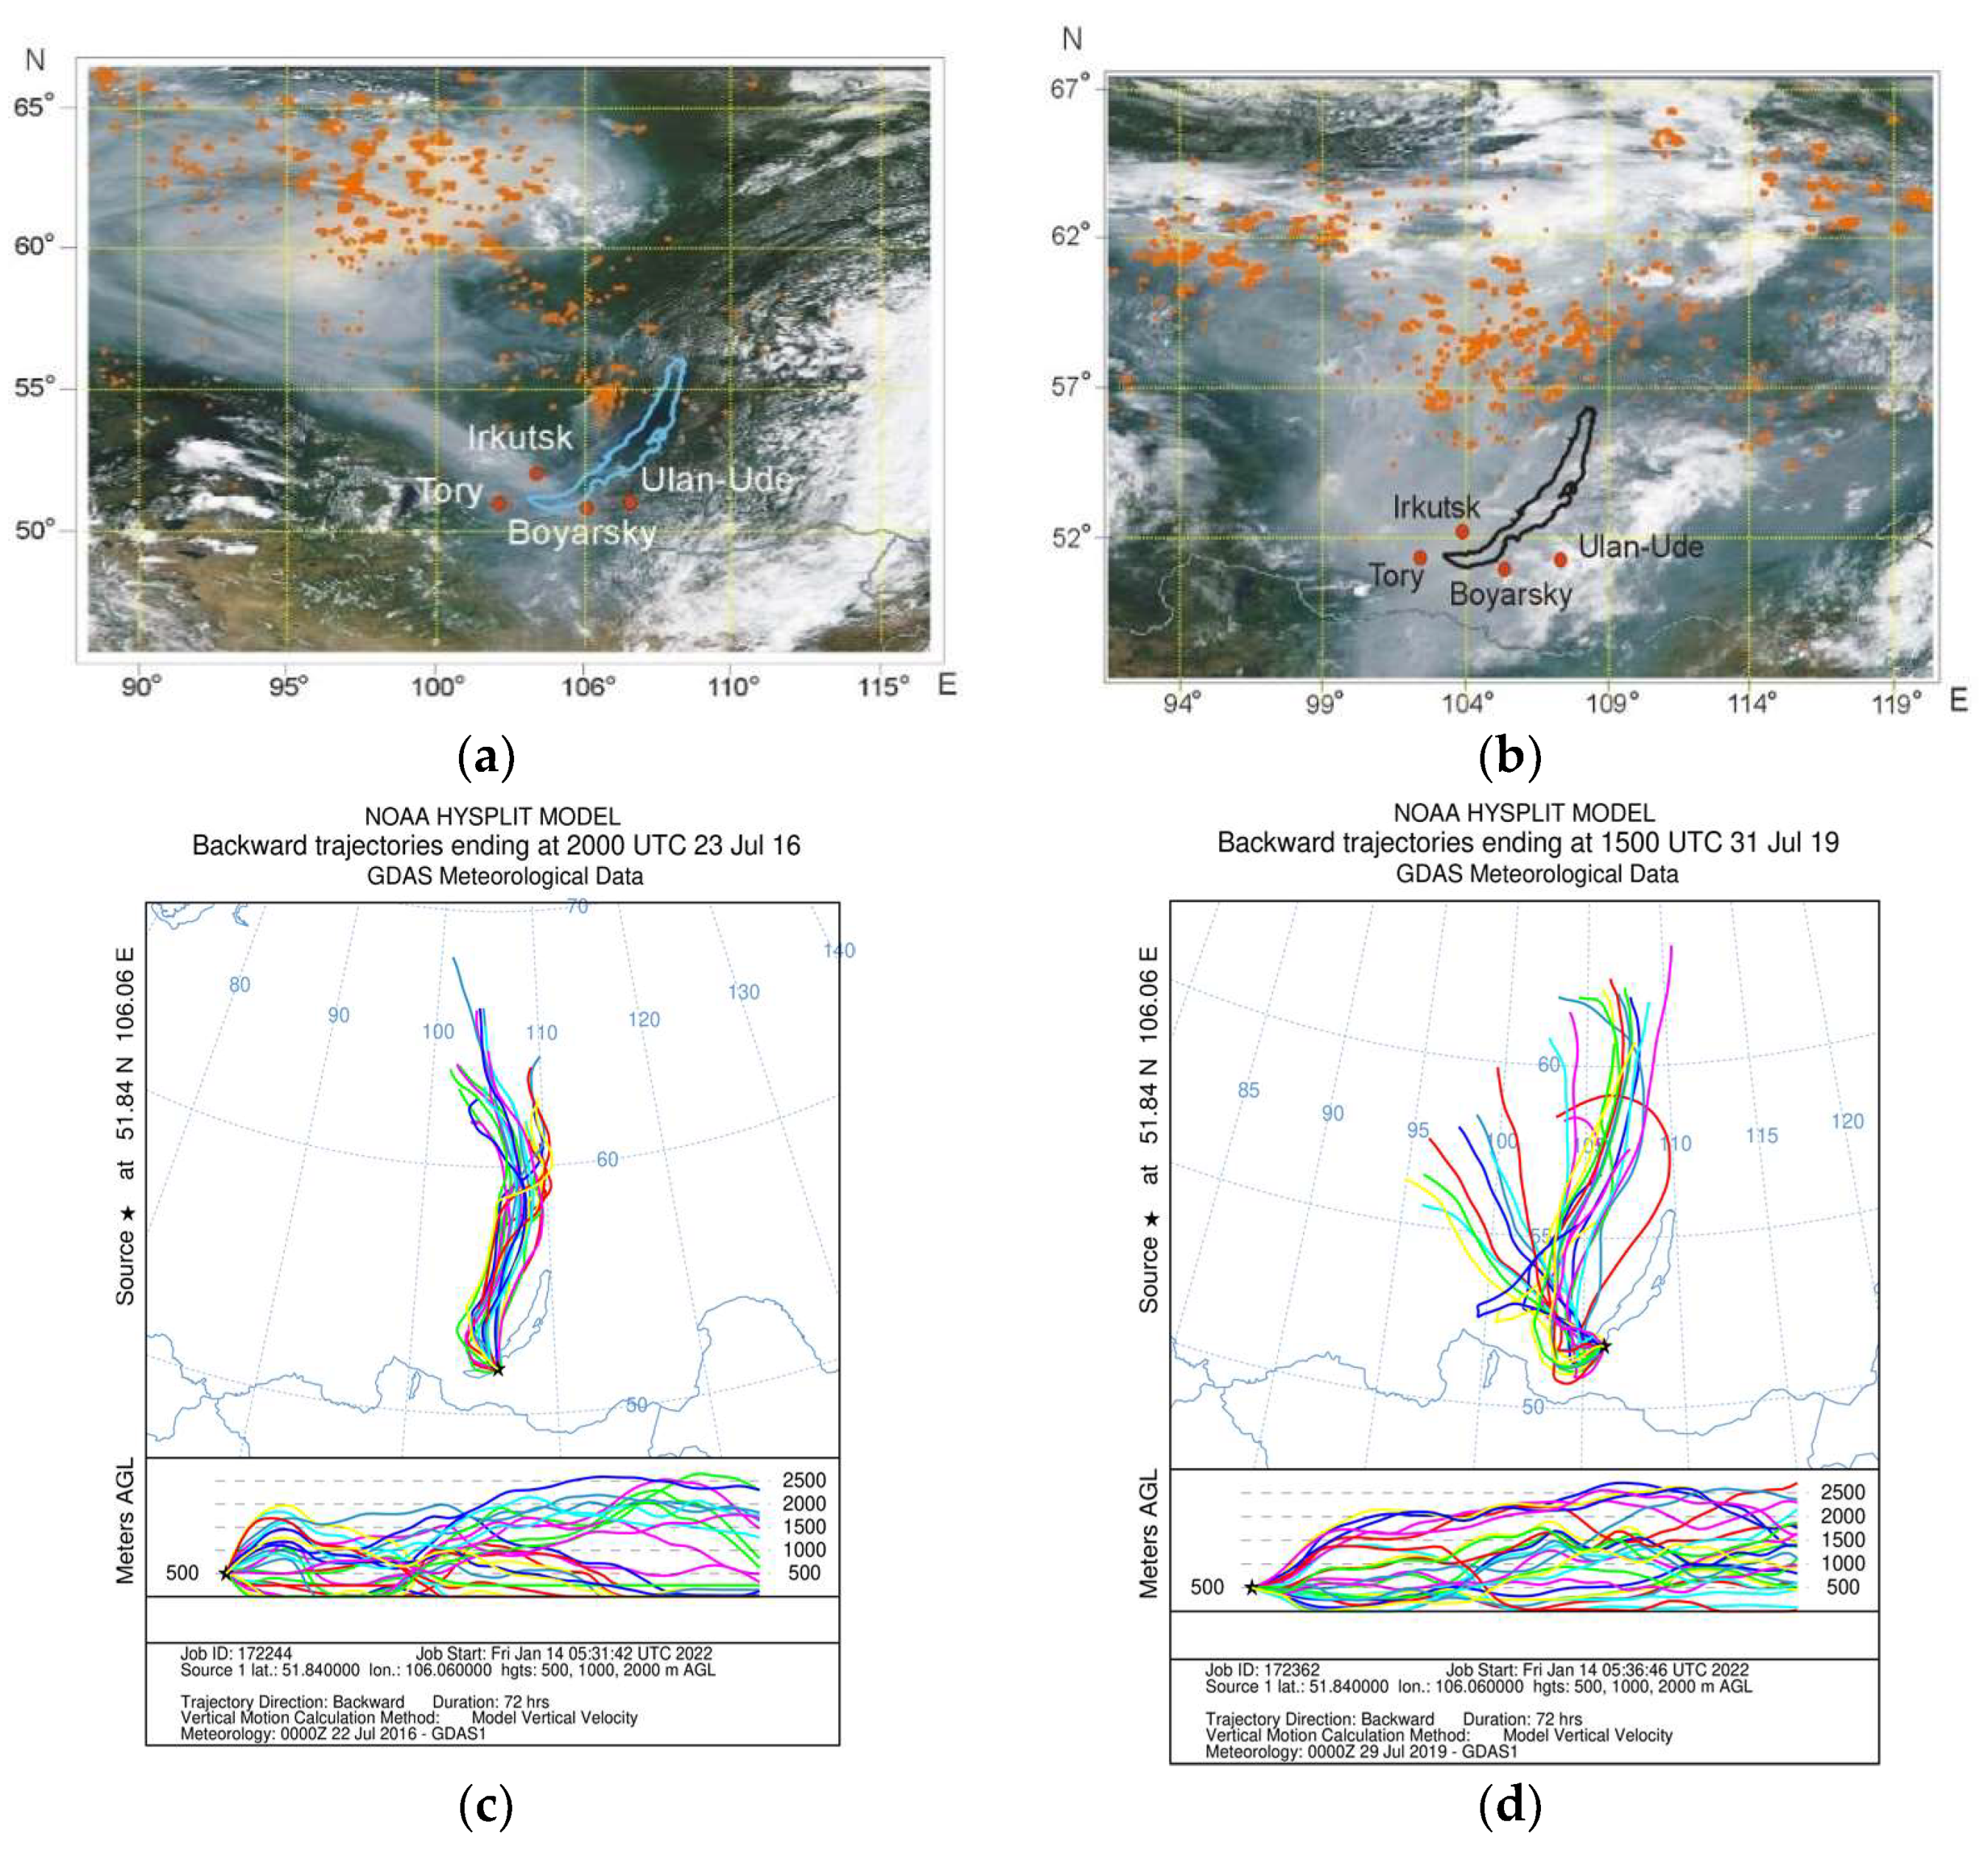
3.1. Study Area

The Tory station (51°47′15″ N; 103°00′41″ E) is the only background station of the global network AERONET in the Baikal region. The station is in the Tunkinskoy valley of the Buryatia Republic, 50 km west of Lake Baikal. The altitude above sea level is ~670 m. The climate of the valley is sharply continental, and in the cold part of the year, the Asian anticyclone dominates. In winter, clear days prevail, frosts reach −50 °C and snowfall is usually little (30–35 cm). Due to the absence of pollution, the snow cover causes increased reflection of solar radiation.
The “Boyarsky” scientific station (51°50′47″ N; 106°04′01″ E) is located 160 km from Ulan-Ude on the southeastern coast of Lake Baikal, 500 m from the shoreline. The location of Lake Baikal, surrounded by mountain ranges, creates large temperature contrasts between the lake and the adjacent territory. The station is located in the forest zone and a rather large distance (>100 km) from large cities and the sources of industrial emissions.
In Figure 1 shows the observation points of the Boyarsky station on the southeastern coast of Lake Baikal and the Tory station of the international network AERONET.

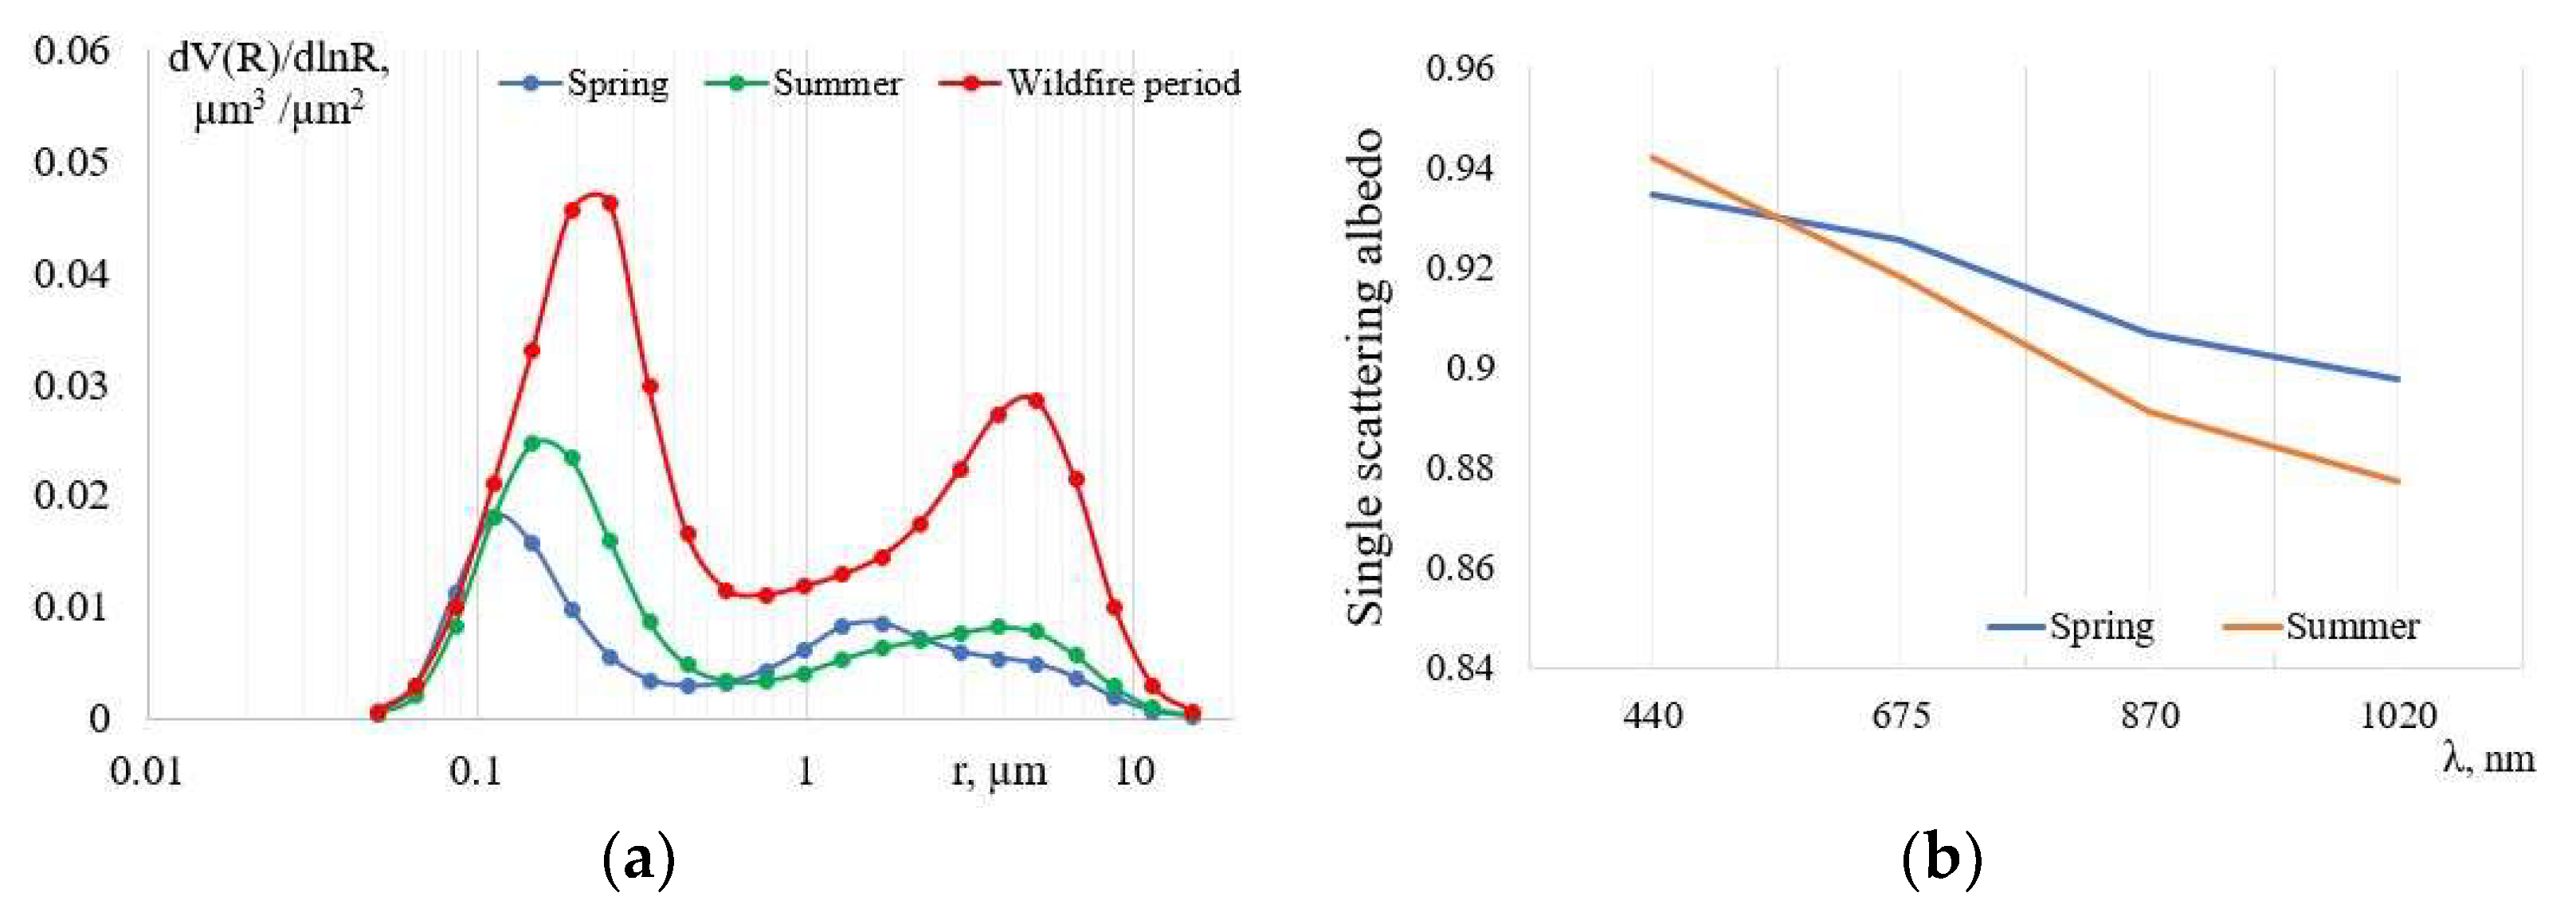
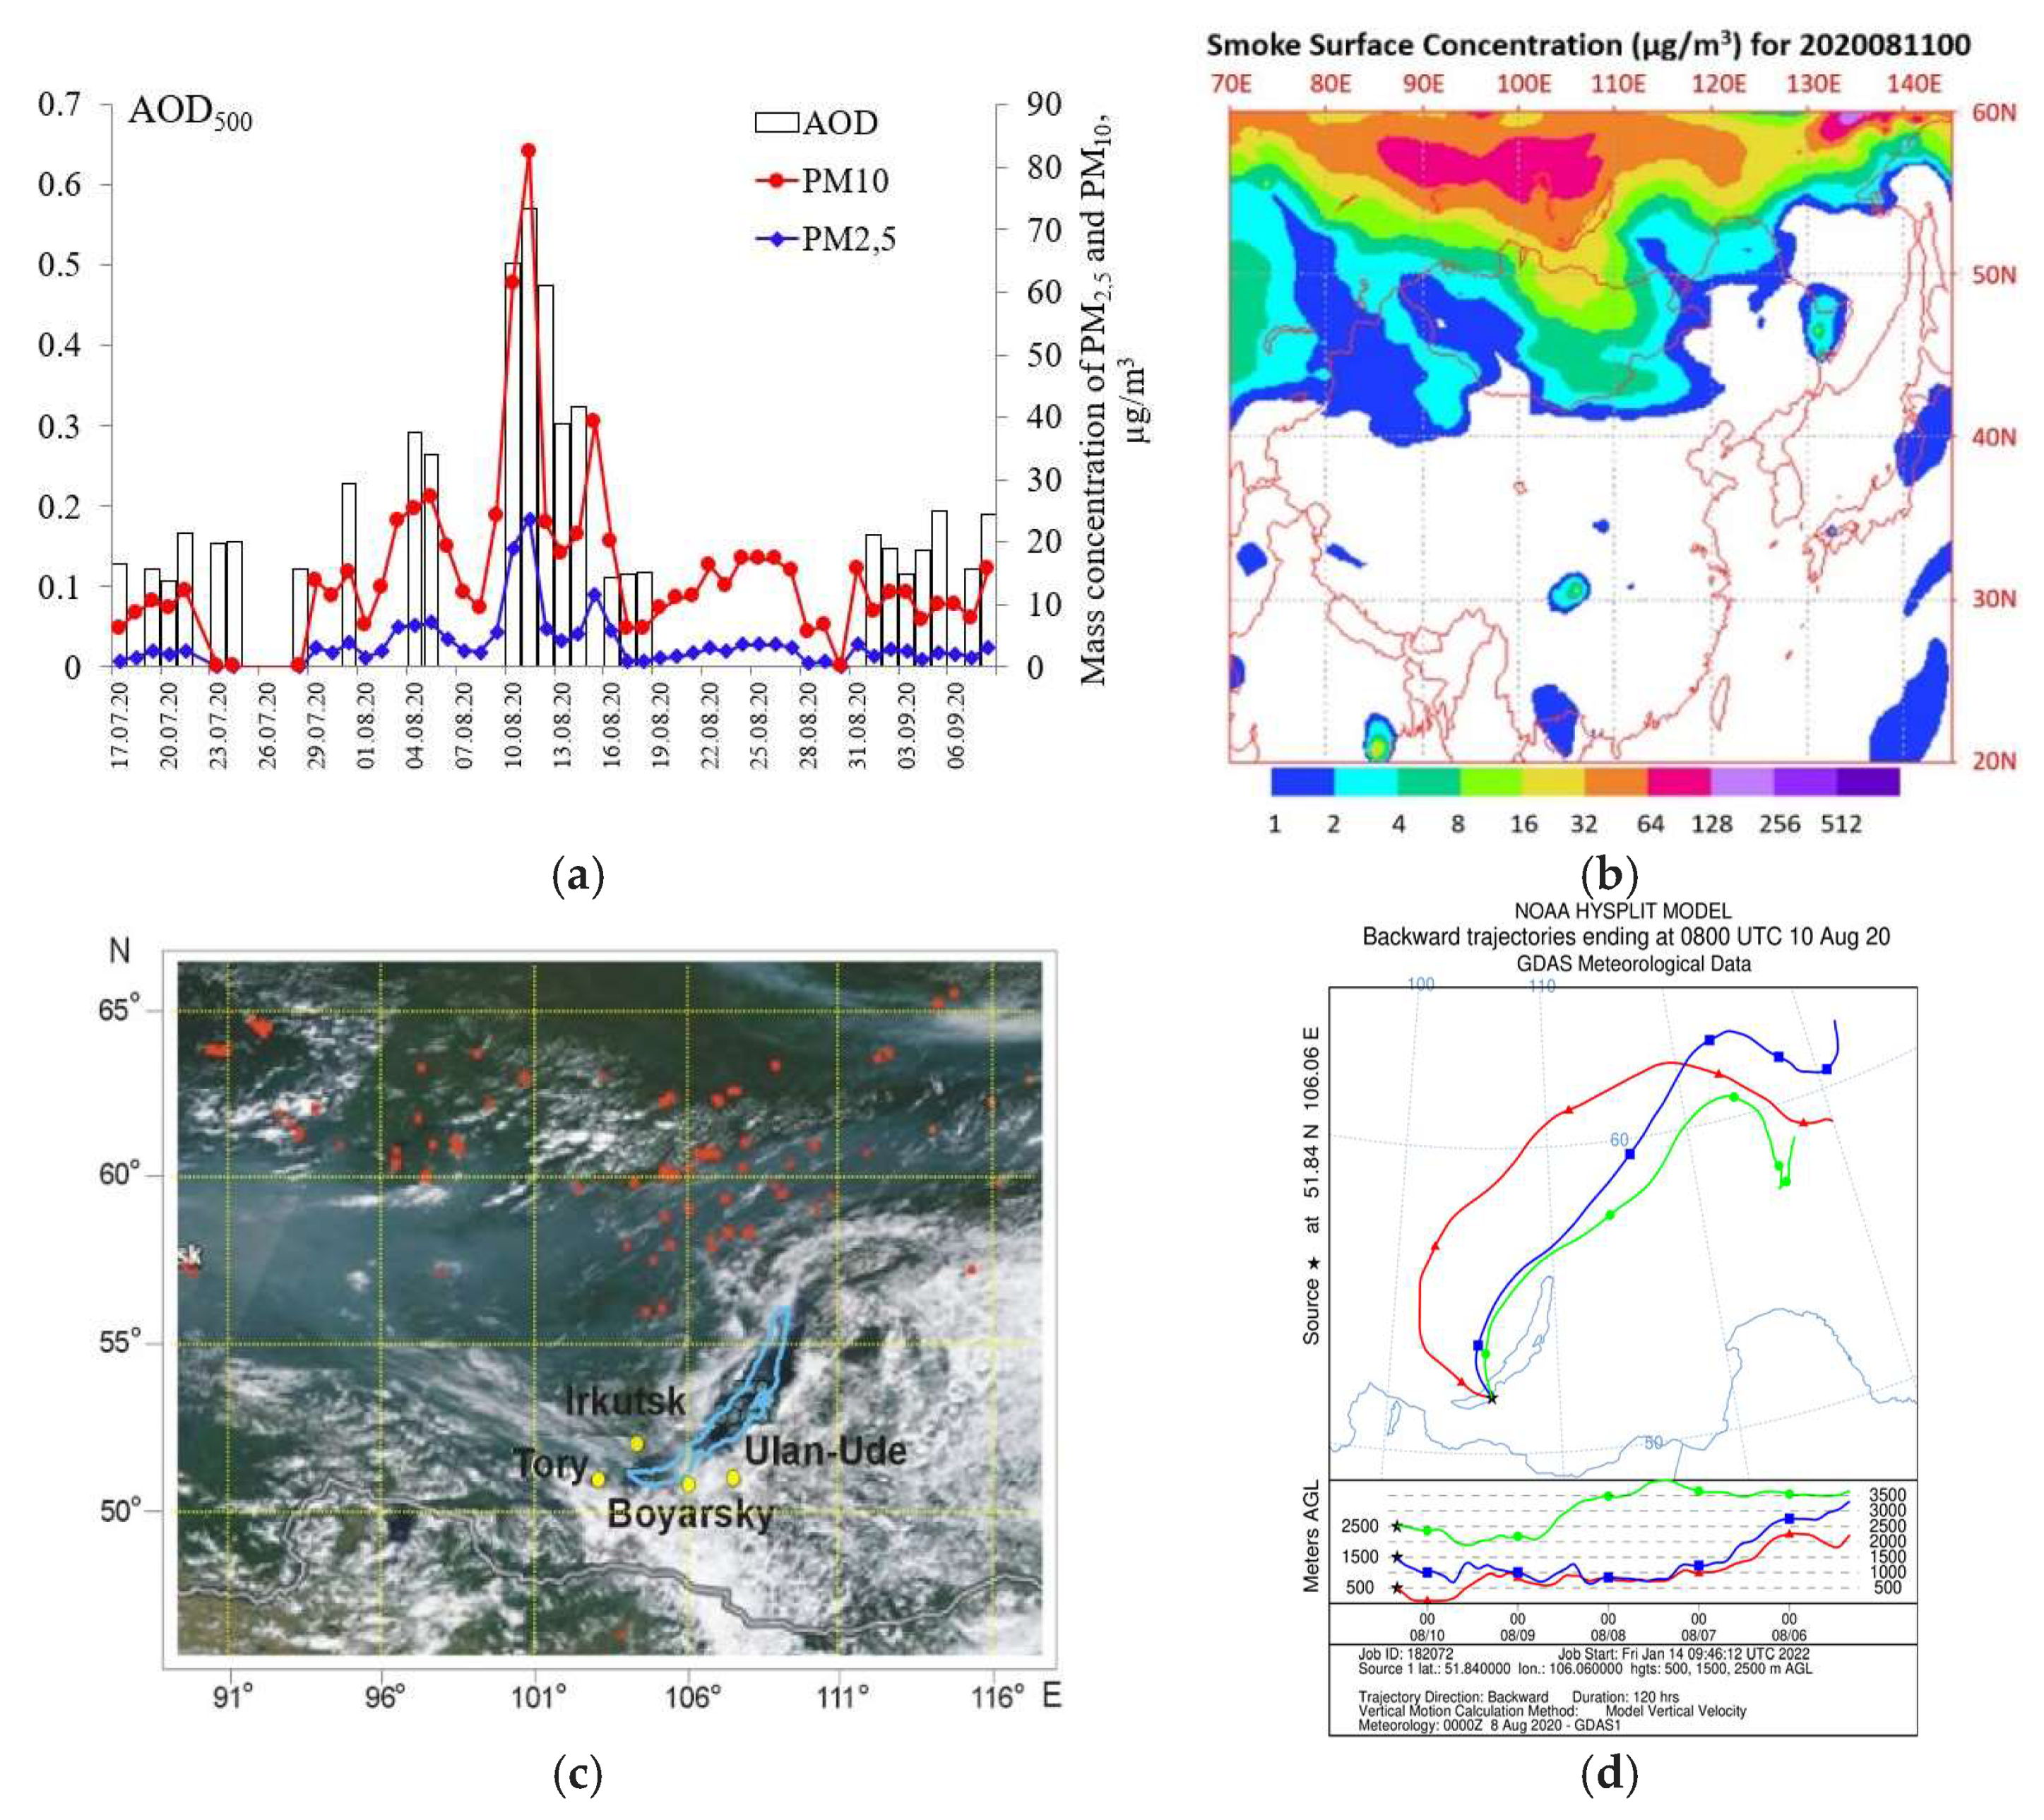
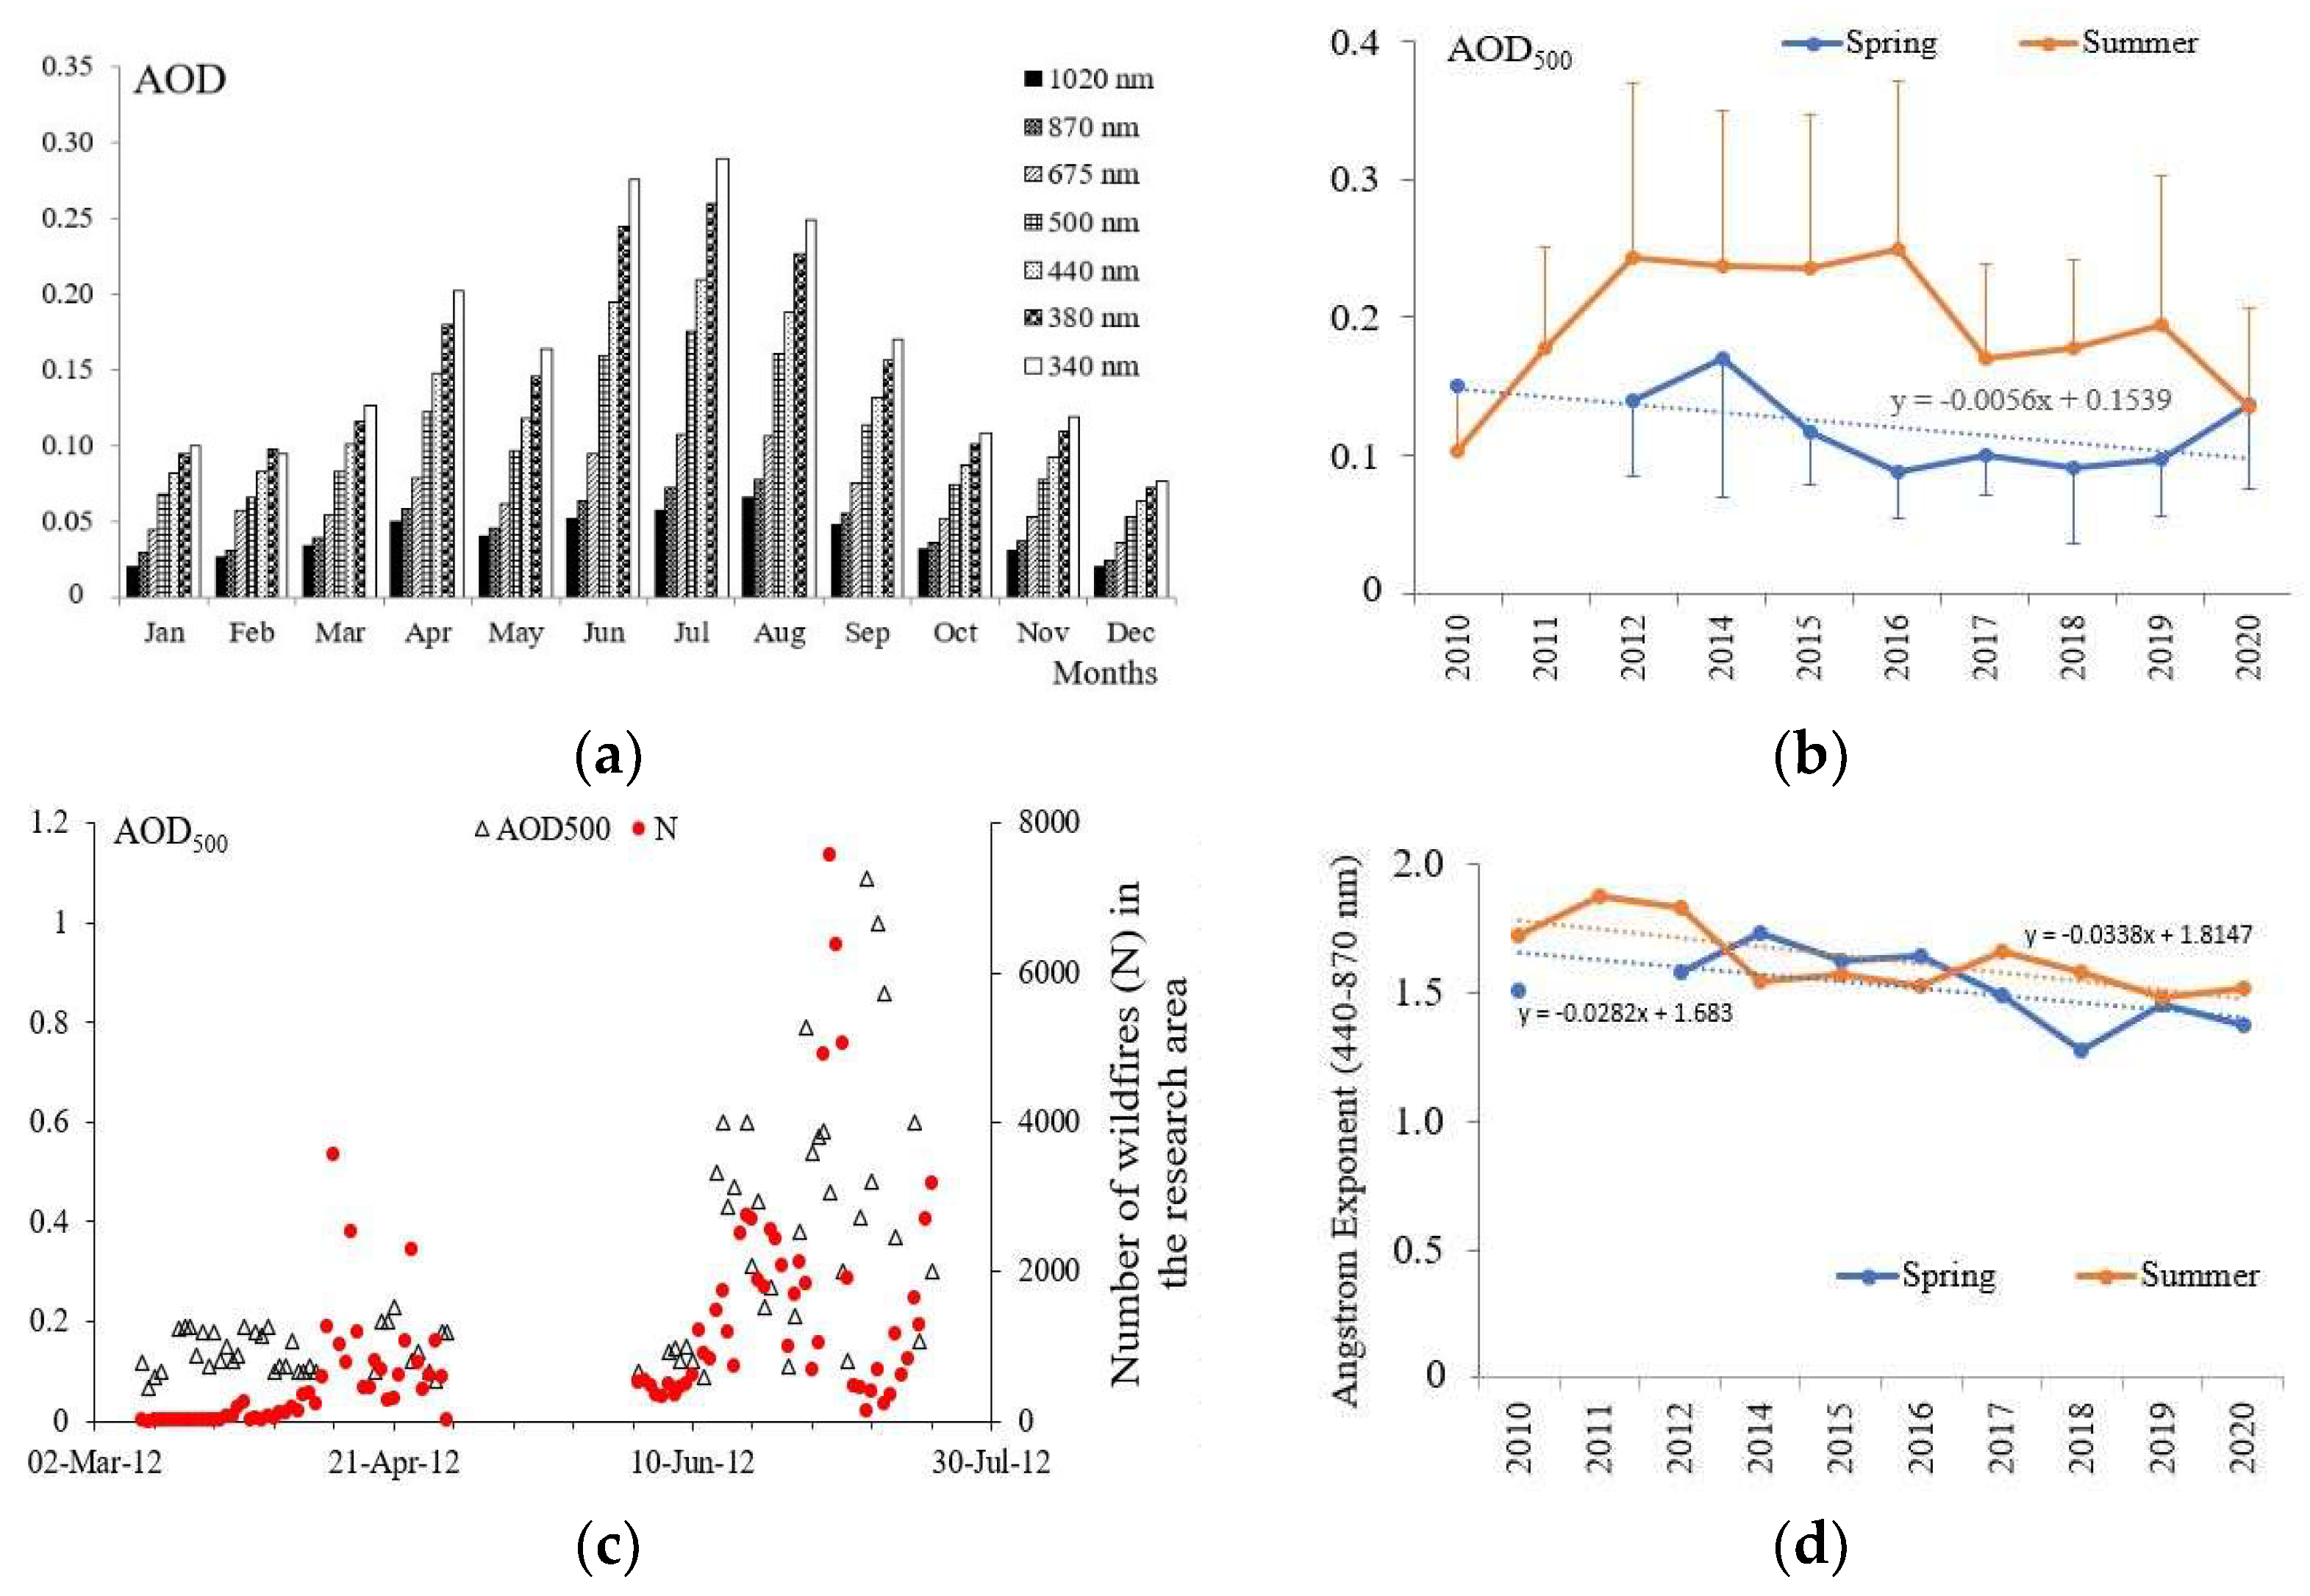
3.2. Study of Optical and Microphysical Characteristics Aerosol Properties in the Tory Station Atmosphere

We analyzed the long-term observation series at the Tory background station to assess the regional features of the interannual variability of the AOD spectral characteristics. Figure 2a shows a histogram of the monthly mean values of AOD at the Tory station according to the long-term observations of 2010–2020 at several wavelengths from 340 to 1020 nm. As can be seen from the figure, the maximum aerosol turbidity of atmosphere is observed in the summer period. In July, the AOD at a wavelength of 340 nm averages 0.29 ± 0.16. In spring, the second local maximum of the AOD is observed in April, equal to 0.2 ± 0.10. In the interannual variability of the AOD, the minimum values are observed in the winter and autumn months. Table 1 shows the mean monthly variation of the aerosol optical depth at a wavelength of 500 nm (AOD500), standard deviation, minimum and maximum values. The mean monthly variation of the AOD500 ranges from 0.05 to 0.17.
Figure 2b shows the interannual variability of the AOD in the spring–summer period according to long-term data at a wavelength of 500 nm. The average annual AOD500 fluctuations in summer vary within wide limits, from 0.1 ± 0.05 in 2010 to 0.25 ± 0.2 with a 95% level significance of ±0.003 in 2012–2016. The maximum turbidity of the atmosphere was observed from 2012 to 2016 and 2019 in summer, and the mean monthly AOD values were 0.2–0.25. On average, 63 days were processed for each year in one season, but for 2010, 2012, 2014 and 2020, this was 33 days. The bursts of the maximum value of the atmosphere AOD from 2012 to 2016 and 2019 are mainly associated with large-scale wildfires in the boreal forests of Siberia and the Republic of Sakha Republic of Sakha (Yakutia). Figure 2c shows a comparison of the average values of AOD500 with the number of wildfires in Siberia in 2012.
As can be seen from the figure, the main contribution to the AOD of the Baikal region atmosphere is made by smoke aerosol in summer and largely determines the spectral behavior of the AOD [21]. Calculations of backward trajectories of air mass transfer using the HYSPLIT model and satellite images for this period confirm the transfer of smoke from wildfires to Lake Baikal southern part. In Figure 3, for clarity, satellite images of Lake Baikal’s southern lake basin according to the HYSPLIT model are shown. According to [35], ƩPAH concentrations in the surface water microlayer of 150 to 960 ng/L confirm the impact of wildfires on Lake Baikal in 2016 and 2019. In the elemental composition of the aerosol, the predominance of components of soil-erosion origin (Al, Fe, Zn, Cr and Ba) was revealed, the concentration of which increased during periods of fire hazard by an average of 1.4–6 times [36]. In spring, there is a tendency decrease of AOD by 0.006 since 2014, although an earlier decrease was confirmed, as well as the existence of a spring maximum of the atmosphere AOD at the Tory station [21].
In contrast to the AOD, the Angstrom exponent at wavelengths of 440–870 nm (AE440–870) does not experience significant fluctuations in the spring–summer period, while the AE values exceed 1.3, which indicates the predominance of fine aerosols (Figure 2d).
Based on the analysis of the AOD500 and AE440–870 data, the types of aerosols in the Tory station atmosphere are identified. As a result of the categorization analysis of AOD500 and AE440–870 data, three types of aerosols at the Tory background station were identified. Figure 4 shows a diagram of aerosol types of distribution in the spring–summer period. The predominant types of aerosol in the spring at the Tory station is continental aerosol (88.17%), which corresponds to background conditions, mixed aerosol (8.97%) and smoke (2.85%); in summer, the predominant types are continental aerosol (70.36%), mixed aerosol (19.2%) and smoke (10.54%). During the severe wildfires in 2016, the proportion of smoke aerosol increased to 30.3%. The relatively high AOD500 values, together with the high AE440–870 values, indicate the presence of fine aerosols that form from wildfires. The results of sounding tropospheric aerosol fields using the LOSA-M2 ground-based lidar at Lake Baikal in 2013–2016 and 2019 showed uniform filling of the atmospheric boundary layer up to 3.5 km by smoke aerosol, the content of which exceeded background values [26,37].
To determine the concentration and size of aerosol particles in the Baikal region’s entire thickness atmosphere, we analyzed the optical properties of aerosol according to the data of photometric measurements at the Tory station. Figure 5a shows the volume aerosol size distribution (VSD) for 22 different radiuses from 0.05 to 15 μm. The obtained data showed the volume of all aerosol particles contained in vertical atmosphere column with the unit of measurement μm3/μm2 (Figure 5a). The volume aerosol size distribution has a bimodal logarithmically normal form with clearly identified small particles with a mode radius of 0.11–0.15 µm and large particles with a mode radius of 2.94–5.06 µm. The maximum volume concentrations in summer were 0.025 μm3/μm2 with a mode radius of 0.15 and 0.018 μm3/μm2 in spring with a mode radius of 0.11 μm. In cases of smoke plume transfer from wildfires, the modal radius of particles increases to 0.26 μm [38].
In emergency situations, such as large-scale wildfires, information on the spatial distribution of SSA becomes especially important [5]. Spectrally single scattering albedo increases with increasing wavelength for dust aerosols and decreases with increasing wavelength for organic and black carbon and shows a different dependence on wavelength in the presence of an aerosols [5,39]. Figure 5b shows the spectral distribution of the single scattering albedo for the spring–summer period according to the long-term averaged data of AOD measurements at Tory station. A decrease in the single scattering albedo with an increase in wavelength was revealed in both spring and summer, which indicates the presence of organic and black carbon [25]. At the same time, more dispersing aerosols are observed in spring compared to summer.

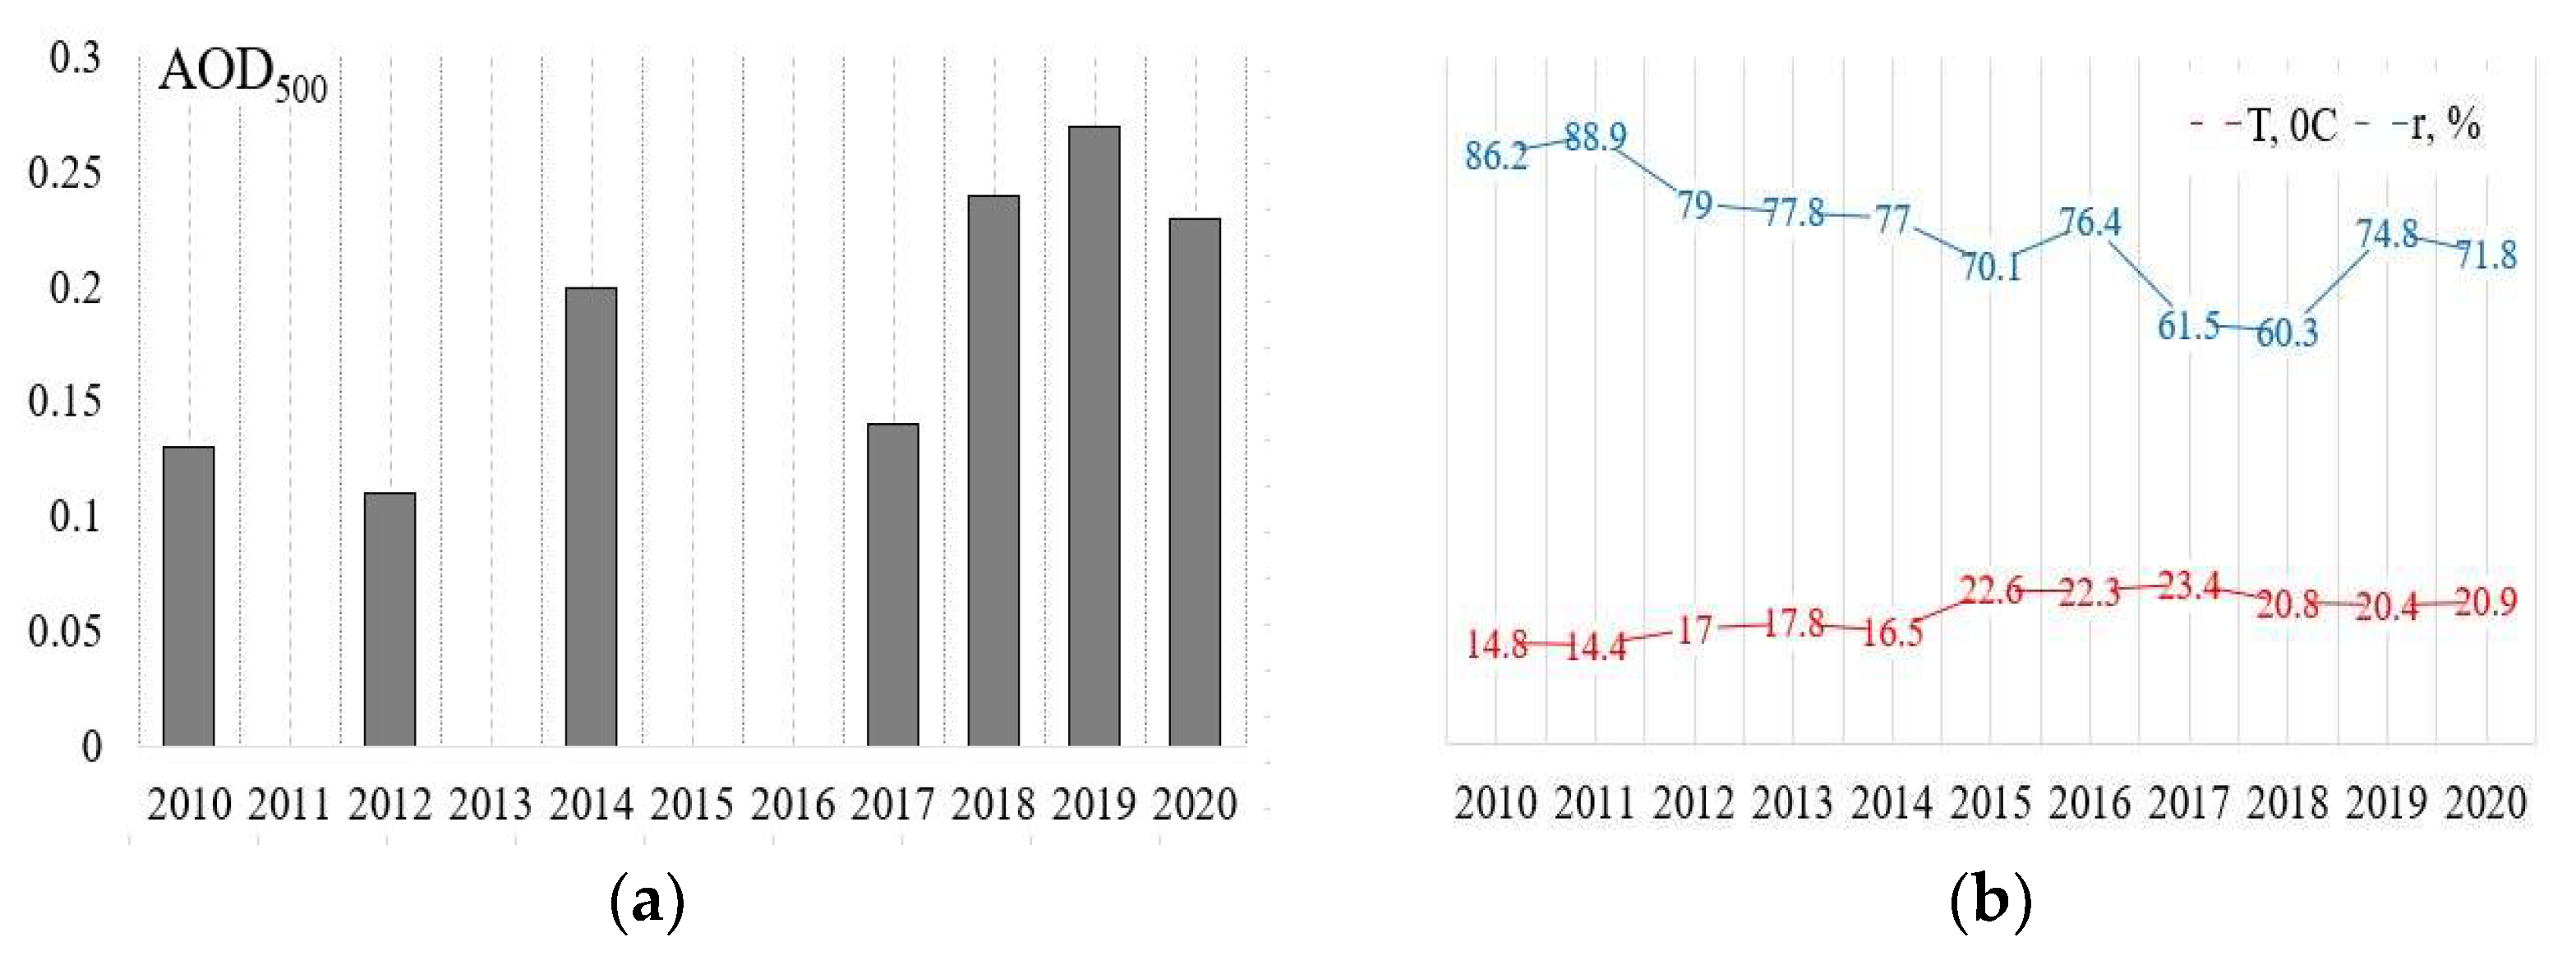
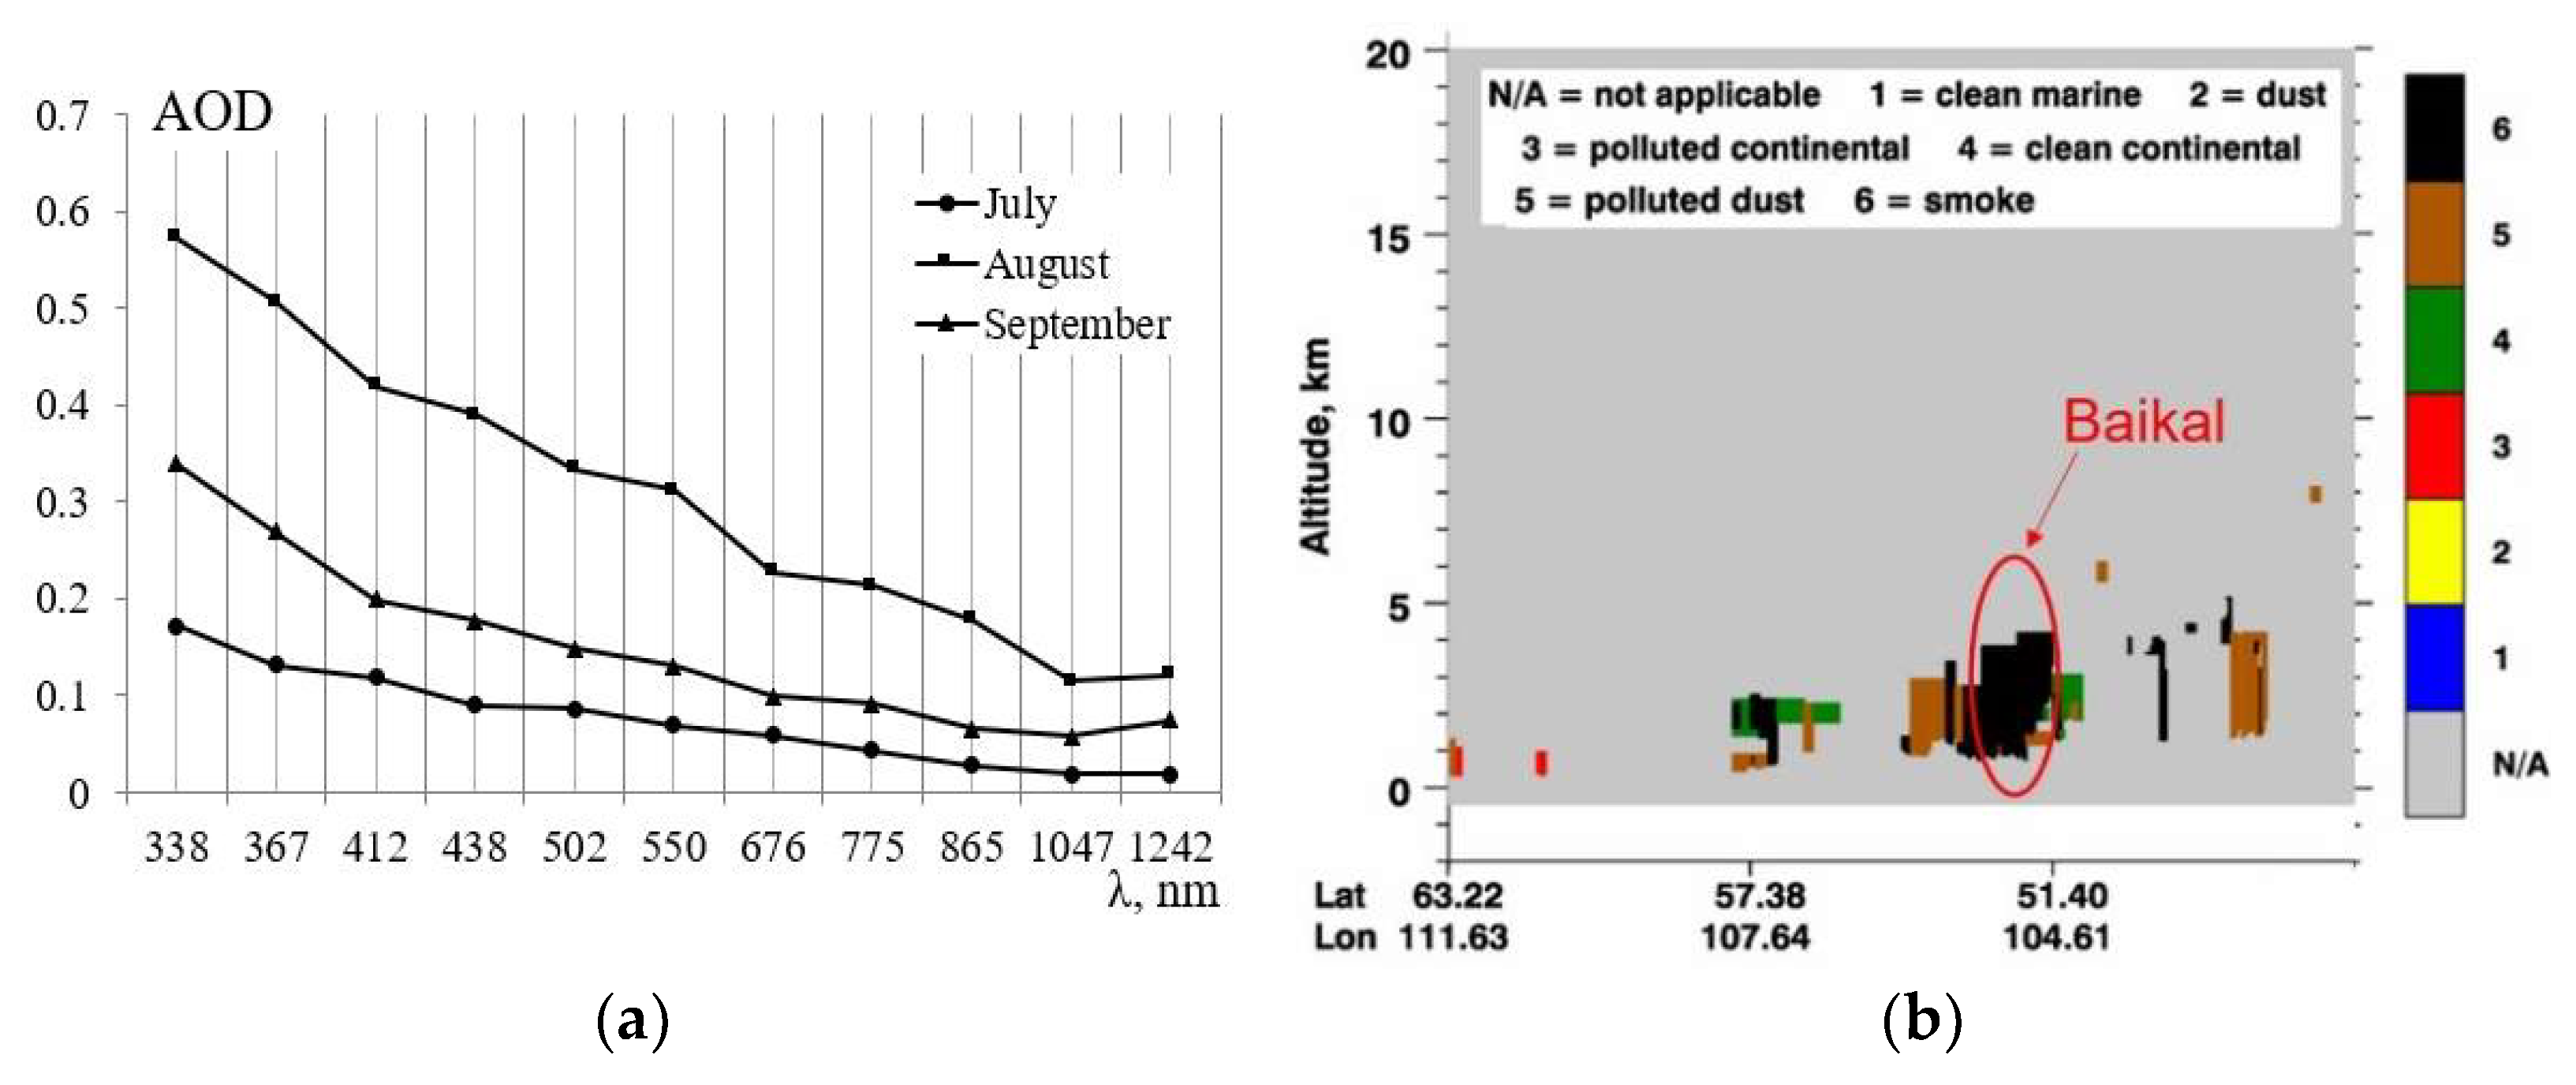
3.3. The Results of Studies of the AOD Atmosphere at the Boyarsky Station

Experimental measurements of the aerosol optical depth in the Boyarsky station atmosphere were carried out using an SP-9 multiwave sun photometer in the wavelength range of 340–2200 nm in the summer.
Figure 6a shows the interannual variability of the AOD500 atmosphere at the Boyarsky station in summer from 2010 to 2020 (measurement gaps in 2011, 2013 and 2015–2016). An increase of AOD500 by 0.013 per year was revealed, the maximum turbidity of atmosphere was observed from 2018 to 2020 and AOD500 varied from 0.22 to 0.27. The main reason for the increased aerosol load at the Boyarsky station in the past 10 years are large-scale wildfires. Accordingly, this led to a high level of aerosol load and an increase of AOD. In addition, a change in temperature and humidity conditions was noted. Earlier, in the second half of summer (July–August), cyclonic activity sharply was intensifying, leading to an increase in relative humidity and precipitation [22]. However, as can be seen from Figure 6b, in the second half of summer since 2012, an increase in the mean monthly air temperature and a decrease in the relative humidity were seen at the Boyarsky station.
Let us consider in more detail the average spectral characteristics of AOD at the Boyarsky station in 2020 during the period of wildfires. During the measurement of 2020, over the Baikal region, in most cases, there was high cloudiness and the presence of optically dense haze, which made difficult automated measurements of the spectral transparency of the atmosphere. The maximum value of the atmosphere, AOD500 = 0.09, was observed in July in the absence of clouds and smoke. In September, the turbidity of atmosphere was AOD500 = 0.15 (Figure 7a). High turbidity of the atmosphere, AOD500 = 0.33, was revealed in August due to the impact of wildfire smoke in the Irkutsk region and the Republic of Sakha Yakutia. According to the data of the vertical distribution of the aerosol attenuation coefficient measured by the space based CALIOP lidar, a uniform filling of the atmospheric thickness with smoke aerosol was observed up to 4 km above Lake Baikal (Figure 7b). A sharp increase of AOD with dense filling of the atmosphere by smoke aerosol from 10 to 14 August was noted, not only at the Boyarsky station, but also at the background station of the international network of ground-based observations AERONET Tory. According to the results of the calculations of the HYSPLIT model, the transport of air masses from the fires was carried out at an altitude of 2.5 km (Figure 8d). Moreover [35], in this period, the high concentrations of polychlorinated biphenyls (PCBs), polychlorinated dibenzo-p-dioxins and dibenzofurans were observed, which were detected in wildfire smoke. This indicate that wildfires are a potential source of organochlorine pollutants [40,41].
In August, the monthly average AE was 1.5, and the daily average ranged from 0.7 to 2.25. The predominant types of aerosols in August 2020 at Boyarsky station was the smoke aerosol BB (57.35%), CC (30.81%) and MX (11.84%).
According to [42,43], the main air pollutants emitted during wildfires are fine particles of PM10 and PM2.5 fractions. About 80–90% of the particulate matter mass consists of PM2.5, with a high content of black carbon, organic carbon and brown carbon.
Investigations of the mass concentration of the finely dispersed aerosols fraction PM2.5 and PM10 in the atmosphere of Lake Baikal coastal zone were carried out using a diffusion aerosol spectrometer, DAS 2702M.
A relationship was revealed between the variations in the spectral characteristics of the aerosol optical depth and the mass concentration of PM2.5 and PM10 during high aerosol turbidity of the atmosphere. Figure 8a shows the temporal dynamics of the atmosphere AOD and the mass concentration of PM2.5 and PM10 in July–September 2020. When analyzing the AOD data, the average daily values of the atmospheric AOD500 at a wavelength of 500 nm were taken as a basis.
In the summer of 2020, with dense filling of the atmosphere by smoke aerosol from August 10 to 14, a sharp increase in AOD (AOD500 > 0.47) was noted at the Boyarsky station to the absolute maximum on August 11 (AOD500 > 0.57). This is confirmed by the data of NAAPS model forecast maps, backward trajectories of air mass transport to the southern basin of Lake Baikal and satellite image of wildfires in Siberia in this period (Figure 8b–d). At the same time, an increase in the mass concentrations of PM2.5 (19–24 μg/m3) and PM10 (42–59 μg/m3) was recorded. The cross-correlation coefficient between the mass concentration of particulate matter (PM10 and PM2.5) and AOD500 was 0.87 and 0.86, respectively.

4. Conclusions

From the results of the aerosol optical depth measurement experiments in the Boyarsky station atmosphere using the SP-9 sun photometer from 2010 to 2020 and data of global network AERONET (Tory station), the long-term data of the optical and microphysical characteristics of aerosol were analyzed. The analysis shows that in the Baikal region, the large-scale wildfires in the boreal forests of Siberia and the Republic of Sakha Yakutia are the main reasons for the increased turbidity of the atmosphere for the last 10 years.
The maximum aerosol turbidity was observed in the summer period, while the minimum was observed in the winter and autumn months. The second local maximum of the AOD was observed in spring. The average annual AOD fluctuations in summer vary within wide limits, from 0.1 ± 0.05 in 2010 to 0.25 ± 0.2 with a 95% level significance of ±0.003 in 2012–2016. The maximum turbidity of the atmosphere was observed from 2012 to 2016 and 2019 in summer, the mean monthly AOD values were 0.2–0.25 at the Tory station. The coastal Boyarsky station revealed an increase in the AOD by 0.013 per year, the maximum turbidity of the atmosphere was observed from 2018 to 2020 and the AOD varied from 0.22 to 0.27. In the long-term change in the microdispersed component of AOD, a tendency of growth and high variations are noted due to the smoke of wildfires. The mean monthly values of the atmosphere AOD at the Tory and Boyarsky stations, since 2014, decreased in the spring, while they increased in the summer and became predominant.
The volume aerosol size distribution has a bimodal logarithmically normal form with clearly identified small particles with a mode radius of 0.11–0.15 µm and large particles with a mode radius of 2.94–5.06 µm. The maximum volume concentration in summer was 0.025 μm3/μm2 with a mode radius of 0.15 and the maximum volume concentration in spring was 0.018 μm3/μm2 with a mode radius of 0.11 μm. In cases of smoke plume transfer from wildfires, the modal radius of particles increases to 0.26 μm. During high aerosol atmosphere turbidity, a relationship was revealed between the variations in the spectral characteristics of the aerosol optical depth and the mass concentration of PM2.5 and PM10. The cross-correlation coefficient between the mass concentration of PM10 (PM2.5) and AOD was 0.87 (0.86).
Further studies of the optical aerosol characteristics are required to predict climatic changes during increasing wildfires and anthropogenic load on a regional scale.

Author Contributions

Conceptualization, G.Z. and A.Z.; methodology, G.Z. and A.Z.; software, A.D. and A.Z.; validation, G.Z. and A.D.; formal analysis, G.Z. and A.D; investigation, A.Z., A.D., V.T. and G.Z.; resources, G.Z. and A.Z.; data curation, A.D. and G.Z.; writing—original draft preparation, G.Z. and A.D.; writing—review and editing, A.D., G.Z., A.Z. and V.T.; visualization, G.Z., A.D. and V.T.; supervision, G.Z.; project administration, G.Z. and A.Z.; funding acquisition, G.Z. All authors have read and agreed to the published version of the manuscript.

Funding

This research was funded by the Russian Foundation for Basic Research (RFBR), project number 19-05-50005 «Micromir» and partly supported by budget funds for IPMS SB RAS within the State Assignment № 0270-2021-0005 in organization of the expedition on Lake Baikal.

Institutional Review Board Statement

Not applicable.

Informed Consent Statement

Not applicable.

Data Availability Statement

Not applicable.

Conflicts of Interest

The authors declare no conflict of interest.

References

  1. Ivlev, L.S. The Chemical Composition and Structure of Atmospheric Aerosols; LSU: Leningrad, Russia, 1982; 368p. [Google Scholar]
  2. Fuks, N.A. Aerosol Mechanics; Publisher of the USSR Academy of Sciences: Moscow, Russian, 1955; 349p. [Google Scholar]
  3. IPCC. Climate Change 2013: The Physical Science Basis. Contribution of Working Group I to the Fifth Assessment Report of the Intergovernmental Panel on Climate Change; Stocker, T.F., Qin, D., Plattner, G.-K., Tignor, M., Allen, S.K., Boschung, J., Nauels, A., Xia, V., Bex, P.M., Eds.; Cambridge University Press: Cambridge, UK; New York, NY, USA, 2013; 1535p. [Google Scholar]
  4. Kumar, K.R.; Boiyo, R.; Khan, R.; Kang, N.; Yu, X.; Sivakumar, V.; Devi, N.L. Multi-year analysis of aerosol optical properties and implications to radiative forcing over urban Pretoria, South Africa. Theor. Appl. Climatol. 2020, 141, 343–357. [Google Scholar] [CrossRef]
  5. Filonchyk, M.; Peterson, M.; Yan, H.; Yang, S.; Chaikovsky, A. Columnar optical characteristics and radiative properties of aerosols of the AERONET site in Minsk, Belarus. Atmos. Environ. 2021, 249, 118–237. [Google Scholar] [CrossRef]
  6. Rupakheti, D.; Rupakheti, M.; Abdullaev, S.F.; Yin, X.; Kang, S. Columnar aerosol properties and radiative effects over Dushanbe, Tajikistan in Central Asia. Environ. Pollut. 2020, 265, 114872. [Google Scholar] [CrossRef] [PubMed]
  7. Giles, D.M.; Holben, B.N.; Eck, T.F.; Sinyuk, A.; Smirnov, A.; Slutsker, I.; Dickerson, R.R.; Thompson, A.M.; Schafer, J.S. An analysis of AERONET aerosol absorption properties and classifications representative of aerosol source regions. J. Geophys. Res. 2012, 117, D17203. [Google Scholar] [CrossRef] [Green Version]
  8. Xu, X.; Xie, L.; Yang, X.; Wu, H.; Cai, L.; Qi, P. Aerosol optical properties at seven AERONET sites over Middle East and Eastern Mediterranean Sea. Atmos. Environ. 2020, 243, 117884. [Google Scholar] [CrossRef]
  9. Chubarova, N.; Smirnov, A.; Holben, B. Aerosol properties in Moscow according to 10 years of AERONET measurements at the meteorological observatory of Moscow state University. Geogr. Environ. Sustain. 2011, 4, 19–32. [Google Scholar] [CrossRef] [Green Version]
  10. Mielonen, T.; Levy, R.C.; Aaltonen, V.; Komppula, M.; De Leeuw, G.; Huttunen, J.; Arola, A. Evaluating the assumptions of surface reflectance and aerosol type selection within the MODIS aerosol retrieval over land: The problem of dust type selection. Atmos. Meas. Tech. 2011, 4, 201–214. [Google Scholar] [CrossRef] [Green Version]
  11. Ozdemir, E.; Gizem Tuna, T.; Tolga, E. Application of aerosol classification methods based on AERONET version 3 product over eastern Mediterranean and Black Sea. Atmos. Pollut. Res. 2020, 11, 2226–2243. [Google Scholar] [CrossRef]
  12. Chen, Y.; Cao, C.; Cao, Y.; Bashir, B.; Xu, M.; Xie, B.; Wang, K. Observed evidence of the growing contributions to aerosol pollution of wildfires with diverse spatiotemporal distinctions in China. J. Clean. Prod. 2021, 298, 126860. [Google Scholar] [CrossRef]
  13. Aerosol Robotic Network. Available online: http://aeronet.gsfc.nasa.gov (accessed on 8 December 2021).
  14. Holben, B.N.; Eck, T.F.; Slutsker, I.; Tanré, D.; Buis, J.P.; Setzer, A.; Vermote, E.; Reagan, J.A.; Kaufman, Y.J.; Nakajima, T.; et al. AERONET–A federated instrument network and data archive for aerosol characterization. Remote Sens. Environ. 1998, 66, 1–16. [Google Scholar] [CrossRef]
  15. Toledano, C.; Cachorro, V.E.; Berjon, A.; de Frutos, A.M.; Sorribas, M.; de la Morena, B.A.; Goloub, P. Aerosol optical depth and Angstrom exponent climatology at El Arenosillo AERONET site (Huelva, Spain). Q. J. R. Meteorol. Soc. 2007, 133, 795–807. [Google Scholar] [CrossRef]
  16. Tutsak, E.; Koçak, M. Long-term measurements of aerosol optical and physical properties over the Eastern Mediterranean: Hygroscopic nature and source regions. Atmos. Environ. 2019, 207, 1–15. [Google Scholar] [CrossRef]
  17. Ni, Y.; Wu, G.; Zhang, X.; Zhang, C.; Xu, T.; Zhu, L. Variation of aerosol optical properties from AERONET observation at Mt. Muztagh Ata, Eastern Pamirs. Atmos. Res. 2015, 153, 480–488. [Google Scholar] [CrossRef]
  18. Lee, J.; Kim, J.; Song, C.H.; Kim, S.B.; Chun, Y.; Sohn, B.J.; Holben, B.N. Characteristics of aerosol types from AERONET sunphotometer measurements. Atmos. Environ. 2010, 44, 3110–3117. [Google Scholar] [CrossRef]
  19. Regayre, L.A.; Johnson, J.S.; Yoshioka, M.; Pringle, K.J.; Sexton, D.M.H.; Booth, B.B.; Lee, L.A.; Bellouin, N.; Carslaw, K.S. Aerosol and physical atmosphere model parameters are both important sources of uncertainty in aerosol ERF. Atmos. Chem. Phys. 2018, 18, 9975–10006. [Google Scholar] [CrossRef] [Green Version]
  20. Stefan, S.; Voinea, S.; Iorga, G. Study of the aerosol optical characteristics over the Romanian Black Sea Coast using AERONET data. Atmos. Pollut. Res. 2020, 11, 1165–1178. [Google Scholar] [CrossRef]
  21. Study of Radiation of Aerosol Characteristics in the Asian Part of Russia; Sakerin, S.M. (Ed.) Publisher IAO SB RAS: Tomsk, Russia, 2012; 483p. [Google Scholar]
  22. Zayakhanov, A.S.; Zhamsueva, G.S.; Naguslaev, S.A.; Tsydypov, V.V.; Sakerin, S.M.; Kabanov, D.M.; Tashilin, M.A. Results of aerosol optical depth studies of the atmosphere in the Baikal region. Atmos. Ocean. Opt. 2010, 23, 466–470. [Google Scholar]
  23. Zhamsueva, G.; Zayakhanov, A.; Tcydypov, V.; Dementeva, A.; Balzhanov, T. Spatial-Temporal Variability of Small Gas Impurities over Lake Baikal during the Forest Fires in the Summer of 2019. Atmosphere 2021, 12, 20. [Google Scholar] [CrossRef]
  24. Golobokova, L.P.; Khodzher, T.V.; Potemkin, V.L.; Khuriganova, O.I.; Onischuk, N.A. Aerosol in the atmosphere of the Baikal region: History and contemporary research. Limnol. Freshw. Biol. 2018, 1, 49–57. [Google Scholar] [CrossRef] [Green Version]
  25. Popovicheva, O.; Molozhnikova, E.; Nasonov, S.; Potemkin, V.; Penner, I.; Klemasheva, M.; Marinaite, I.; Golobokova, L.; Vratolis, S.; Eleftheriadis, K.; et al. Industrial and wildfire aerosol pollution over world heritage Lake Baikal. J. Environ. Sci. 2021, 107, 49–64. [Google Scholar] [CrossRef]
  26. Balin, Y.S.; Klemasheva, M.G.; Kokhanenko, G.P.; Nasonov, S.V.; Novoselov, M.M.; Penner, I.E. Lidar studies of the vertical structure of aerosol fields over Lake Baikal atmosphere during wildfires. Atmos. Ocean. Opt. 2016, 29, 689–693. (In Russian) [Google Scholar]
  27. Azbukin, A.A.; Bogushevich, A.Y.; Ilichevskii, V.S.; Korolkov, V.A.; Tikhomirov, A.A.; Shelevoi, V.D. Automated ultrasonic meteorological complex AMK-03. Meteorol. Hydrol. 2006, 11, 89–97. [Google Scholar]
  28. Zagainov, V.A. Diffusion spectrometer for diagnostics of nanoparticles in the gas phase. Nanotechnology 2006, 1, 141–146. [Google Scholar]
  29. Stein, A.F.; Draxler, R.R.; Rolph, G.D.; Stunder, B.J.B.; Cohen, M.D.; Ngan, F. NOAA’s HYSPLIT atmospheric transport and dispersion modeling system. Bull. Amer. Meteor. Soc. 2015, 96, 2059–2077. [Google Scholar] [CrossRef]
  30. Draxler, R.R. HYSPLIT4 User’s Guide; NOAA Technical Memorandum ERL ARL-230; NOAA Air Resources Laboratory: Silver Spring, MD, USA, 1999.
  31. The Cloud-Aerosol Lidar and Infrared Pathfinder Satellite Observation (CALIPSO). Available online: https://www-calipso.larc.nasa.gov (accessed on 21 January 2022).
  32. Navy Aerosol Analysis and Prediction System (NAAPS). Available online: https://www.nrlmry.navy.mil/aerosol (accessed on 21 January 2022).
  33. Hogan, T.F.; Rosmond, T.E. The description of the Navy operational global atmospheric prediction system’s spectral forecast model. Mon. Wea. Rev. 1991, 119, 1786–1815. [Google Scholar] [CrossRef] [Green Version]
  34. Zhang, J.; Reid, J.S.; Westphal, D.L.; Baker, N.L.; Hyer, E.J. A system for operational aerosol optical depth data assimilation over global oceans. J. Geophys. Res. 2008, 113, D10208. [Google Scholar] [CrossRef]
  35. Gorshkov, A.G.; Izosimova, O.N.; Kustova, O.V.; Marinaite, I.I.; Galachyants, Y.P.; Sinyukovich, V.N.; Khodzher, T.V. Wildfires as a Source of PAHs in Surface Waters of Background Areas (Lake Baikal, Russia). Water 2021, 13, 2636. [Google Scholar] [CrossRef]
  36. Golobokova, L.; Khodzher, T.; Khuriganova, O.; Marinayte, I.; Onishchuk, N.; Rusanova, P.; Potemkin, V. Variability of Chemical Properties of the Atmospheric Aerosol above Lake Baikal during Large Wildfires in Siberia. Atmosphere 2020, 11, 1230. [Google Scholar] [CrossRef]
  37. Balin, Y.S.; Klemasheva, M.G.; Kokhanenko, G.P.; Nasonov, S.V.; Novoselov, M.M.; Penner, I.E.; Samoilova, S.V. Optical depth of smoke aerosol over the Lake Baikal aquatories in the period of forest fires in the summer of 2019. Proc. SPIE. 2020, 11560. [Google Scholar] [CrossRef]
  38. Dementeva, A.L.; Zhamsueva, G.S.; Zayakhanov, A.S.; Tcydypov, V.V.; Sungrapova, I.P.; Balzhanov, T.S.; Starikov, A.V. Analysis of atmospheric aerosols variability in the Baikal region. Proc. SPIE. 2020, 11560, 11560601–11560605. [Google Scholar] [CrossRef]
  39. Dubovik, O.; Holben, B.; Eck, T.F.; Smirnov, A.; Kaufman, Y.J.; King, M.D.; Tanré, D.; Slutsker, I. Variability of Absorption and Optical Properties of Key Aerosol Types Observed in Worldwide Locations. J. Atmos. Sci. 2002, 59, 590–608. [Google Scholar] [CrossRef]
  40. Smith, H.G.; Sheridan, G.J.; Lane, P.N.J.; Nyman, P.; Haydon, S. Wildfire Effects on water quality in forest catchments: A review with implications for water supply. J. Hydrol. 2011, 396, 170–192. [Google Scholar] [CrossRef]
  41. Estrellan, C.R.; Lino, F. Toxic emissions from open burning. Chemosphere 2010, 80, 193–207. [Google Scholar] [CrossRef] [PubMed]
  42. Gyawali, M.; Arnott, W.P.; Lewis, K.; Moosmüller, H. In situ aerosol optics in Reno, NV, USA during and after the summer 2008 California wildfires and the influence of absorbing and non-absorbing organic coatings on spectral light absorption. Atmos. Chem. Phys. 2009, 9, 8007–8015. [Google Scholar] [CrossRef] [Green Version]
  43. Youssouf, H.; Liousse, C.; Roblou, L.; Assamoi, E.-M.; Salonen, R.O.; Maesano, C.; Banerjee, S.; Annesi-Maesano, I. Non-accidental health impacts of wildfire smoke. Int. J. Environ. Res. Public Health 2014, 11, 11772–11804. [Google Scholar] [CrossRef] [Green Version]
Figure 1. Location of the observation points of AOD (Tory and Boyarsky stations).
Atmosphere 13 00211 g001
Figure 2. (a) Histogram of the distribution of monthly mean AOD values at the Tory station; (b) Comparison of the average daily values of the aerosol optical depth at a wavelength of 500 nm (AOD500) with daily data of the number of wildfires in the study area; (c) Interannual variation of AOD500; (d) Interannual variability of the Angstrom exponent (AE440–870) at the Tory station in the spring–summer period from 2010–2020.
Atmosphere 13 00211 g002
Figure 3. Satellite image of wildfires in Siberia in July (a) 22–23 July 2016; (b) 30–31 July 2019 and backward trajectories of air mass transport to the southern basin of Lake Baikal; (c) 23 July 2016; (d) 31 July 2019.
Atmosphere 13 00211 g003
Figure 4. Diagram of the distribution of AOD–AE by types of aerosols at Tory station: (a) spring; (b) summer.
Atmosphere 13 00211 g004
Figure 5. (a) Volume particle size distribution; (b) seasonal spectral variation of single scattering albedo, Tory station, 2010–2020.
Atmosphere 13 00211 g005
Figure 6. (a) Interannual change in the aerosol optical depth at a wavelength of 500 nm; (b) air temperature and humidity at the Boyarsky station (2010–2020).
Atmosphere 13 00211 g006
Figure 7. Average spectral characteristics of AOD in the Boyarsky station atmosphere (a); spatial section of the vertical distribution of aerosol in the Baikal region atmosphere thickness (b) on 14 August 2020.
Atmosphere 13 00211 g007
Figure 8. Temporal dynamics of atmosphere AOD and mass concentration of PM2.5 and PM10 in July–September 2020 (a); NAAPS model forecast maps (b); Satellite image of wildfires in Siberia, 10 August 2020 (c); Backward trajectories of air mass transport to the southern basin of Lake Baikal, 10 August 2020 (d).
Atmosphere 13 00211 g008
Table 1. Mean monthly variation of AOD500, standard deviation and minimum and maximum values.
MonthsAOD500
MeanStandard DeviationMinMax
January0.070.0140.040.10
February0.060.0150.031.24
March0.080.0740.031.25
April0.130.0810.021.39
May0.110.0660.030.96
June0.150.1500.031.89
July0.170.2230.022.82
August0.160.1410.031.12
September0.110.0790.030.61
October0.070.0470.010.44
November0.080.0510.020.41
December0.050.0240.020.15
Publisher’s Note: MDPI stays neutral with regard to jurisdictional claims in published maps and institutional affiliations.

