Article

Comparative Study in Software and Healthcare Industries between South Korea and US Based on Economic Input–Output Analysis

1
Department of Convergence Program for Social Innovation, Sungkyunkwan University, Seoul 03063, Korea
2
Meta Credit Group Consulting, Business Consulting Division, Seoul 07299, Korea
3
Department of Business Administration, Hankuk University of Foreign Studies, Seoul 17035, Korea
4
Climate and Air Quality Research Department Air Pollution Engineering Division, National Institute of Environmental Research, Incheon 22689, Korea
*
Author to whom correspondence should be addressed.
Atmosphere 2022, 13(2), 209; https://doi.org/10.3390/atmos13020209
Submission received: 23 December 2021 / Revised: 23 January 2022 / Accepted: 25 January 2022 / Published: 27 January 2022
(This article belongs to the Special Issue Air Quality and Public Health Effects in Korea)

Abstract

:
In the modern era, software technology is being used not only as a core technology for manufacturing but also in various industries, such as telemedicine services, and the importance of the healthcare industry is being emphasized due to the demand for improved quality of life from the increase in the general level of earnings. However, if the industry emits a lot of carbon dioxide (CO2), it is questionable whether it is a sustainable industry. This study aimed to analyze the economic linkage effect of software and healthcare industries in South Korea and the United States by applying input–output analysis and examine whether these industries are sustainable in terms of CO2 emissions. The input–output tables and CO2 emissions from 2005 to 2015 were used for analysis from OECD. As a result of the analysis, CO2 emissions from the software and healthcare industries were less than 1% in both South Korea and the United States, suggesting that these industries are well-suited for low-carbon development in these countries. The forward and backward linkage effects of the software industry are different between South Korea and the United States. Specifically, the backward linkage effect of the software industry is large in South Korea, and the forward linkage effect is large in the United States. The forward linkage effect of the healthcare industry is different in the two countries, but the backward linkage effect is not. It means that there are differences in the industrial structure of the two countries. The software and healthcare industries need to devise strategies to drive production in other industries while maintaining current low carbon emission levels.

Graphical Abstract

1. Introduction

Global CO2 emissions (1990 to 2019) continued to increase from 22.70 billion t in 1990 to 36.44 billion t in 2019 [1]. Accordingly, major countries around the world are recently responding to climate change by reducing carbon and greenhouse gas emissions [2,3]. South Korea is also making efforts for the harmonious development of the economy and the environment by introducing green technology to lay the foundation for low-carbon green growth and to realize a low-carbon society [4]. For the harmonious development of the economy and the environment, it is necessary to minimize carbon emission by industry and economic sector, and at the same time to increase the positive effect of industrial activities on the national economy. In Hungary, the industrial sector has been the main source of CO2-emitting and contributed 72% of the total emissions between 1985 and 2018 [5]. Reservoirs created for the development of agriculture and the tourism industry are also an important source of methane, a powerful greenhouse gas [6]. Agriculture has attempted to capture and recycle CO2, but challenges remain for most industrial-based utilization pathways, either associated with the high operating and supply chain costs, the low process efficiencies [7]. To this end, we need to understand the carbon dioxide emission pattern of vital industries and their economic role in the national economy to establish government policies that enable sustainable economic development.
In this digital age, one of the most important industries in the national economy and human life is the software industry. The influence of software technology is growing with the advancement of information and communication technologies (ICTs), such as artificial intelligence (AI) and block chain. ICT is the foundation of the fourth industrial revolution, and software is the most important component [8,9,10]. Recognizing the importance of the software industry, countries around the world are making efforts for the development of software technology and industry. Accordingly, the global software market has grown at a compound annual growth rate of 4.4% since 2014, reaching USD 1.34 trillion (about KRW 1500 trillion) in 2019. The software industry is an industry that supports other industries, and without software, the competitiveness of the other industries cannot be guaranteed [11]. However, the software industry emits large amounts of carbon dioxide. For example, many software companies provide their services through cloud computing technology. Cloud computing requires large data centers that consume a lot of power. Data centers are essentially operated 24 h a day and require air conditioning to cool down the heat emitted by computers. Therefore, power consumption is inevitably large. The greater the power consumption, the greater the CO2 emissions [12,13]. Therefore, the software industry provides “substantial” services but is directly or indirectly responsible for CO2 emissions [14].
Along with the software industry, one of the most necessary industries for human society and the national economy is the healthcare industry. The healthcare industry has also been recognized as a high value-added industry with high growth potential due to the increase in income and the development of medical technology, attracting attention as an industry that can drive economic growth [15,16,17]. ICT has been converged and used in all fields of the healthcare industry, and the form and scope of its application are expanding [18]. Healthcare services that incorporate ICT are already being provided by large companies, such as Apple and Samsung, as well as startups, allowing individuals to manage their health anytime, anywhere [8,19]. Fitbit’s “Wearable Band”, Google’s “Fit”, and Apple’s “Health Kit” are representative healthcare services, and data accumulated through these services can be shared between individuals and hospitals to provide telemedicine services [20,21]. The healthcare industry provides the services necessary for human life, but the healthcare industry emits large amounts of carbon dioxide. Specifically, the healthcare industry’s climate footprint represents 4.4% of global net CO2 emissions. Healthcare facilities and carbon-intensive healthcare supply chains that use many energy sources such as electricity, gas, steam, air conditioning and heating account for most of the CO2 emissions by the healthcare industry [22].
Given the importance of software industry and healthcare industry in the national economy and sustainable development of such industries for the environment, the aim of this study is to analyze the economic linkage effects of the two industries by conducting input–output (I-O) analysis and examine whether these industries are sustainable in terms of CO2 emissions. Additionally, in order to understand the results more deeply, this study compares the economic linkage effects and CO2 emissions between South Korea and the United States, one of the developed countries that pay the most attention to the global environment. No matter how high the economic linkage effect and added value, industries that emit a lot of carbon are not suitable for the global task of reducing carbon and greenhouse gas emissions. Motivated by this line of thinking, this study seeks to answer the following research questions:
RQ1: 
What is the economic linkage effect of software and healthcare industries in South Korea and the United States?
RQ2: 
What is the difference between South Korea and the United States in terms of the economic linkage effect of the software industry and the economic linkage effect of the healthcare industry?
RQ3: 
Are the software and healthcare industries sustainable in South Korea and the United States in terms of CO2 emissions?
To answer these research questions, we analyze the economic linkage effect and CO2 emissions of software and healthcare industries in South Korea and the United States by applying input–output analysis using input–output tables and CO2 emissions published by the OECD from 2005 to 2015.
This study is structured as follows. Section 2 classifies the software industry and the healthcare industry, introduces input–output and CO2 emission-related prior studies, and establishes research hypotheses. Section 3 describes research methods and data. Then, Section 4 offers the results from the data analysis and interpretation of the results. Finally, in Section 5, we discuss the implications of this study, including policy recommendations.

2. Preliminary Knowledge and Hypotheses Development

2.1. CO2 Emissions Data Using Inter-Industry Analysis

Reducing CO2 emissions due to energy consumption is no longer a matter of choice but a global and international requirement and obligation [23]. Industries that cannot achieve energy efficiency or reduce CO2 emissions are no longer be able to compete in the global marketplace. Governments should continue to make efforts to minimize CO2 emissions through investment as well as the enactment of environmental laws and regulations. To obtain the best results with limited cost and time, the government must first understand exactly which industries have the greatest impact on CO2 emissions and apply environmental policies and regulations to those with the greatest impact. To this end, many studies are being conducted to measure carbon emissions of each country and major industries by applying a methodology that considers economic linkage aspects between industries, such as inter-industry analysis [17,24,25,26,27,28,29,30].
Specifically, Malmodin and Lundén [26] estimated the energy and carbon footprint of the global ICT and E&M sector from 2010 to 2015. As a result of the analysis, despite the continued growth in data traffic in the ICT and E&M sectors, the increased carbon footprint was smaller than expected. Wu [27] analyzed the carbon footprint and economic linkage effect of the healthcare industry in China and revealed that China’s carbon emissions per unit of health expenditure were relatively high due to the overall spending structure of the economy and carbon intensity in the country, arguing that effective management was required to reduce the national carbon footprint.
The software industry and the healthcare industry are key industries for national economic development. A well-established software industry can drive future economic growth [8,11]. In addition, the application of software technology in the healthcare industry is increasing due to the development of ICT and the expansion of non-face-to-face services [16]. On the other hand, in the European Union and major countries, low carbon emissions and reducing greenhouse gas emissions are being implemented as major global policy measures. The United States announced the Climate Action Plan in 2013 to reduce carbon emissions and lead the international community’s efforts to respond to climate change [31]. For the sustainable industrial development of future core industries such as software and healthcare industries, carbon emissions of such industries must be low compared to other industries, and the economic linkage effect must be high. If an industry is the main culprit of environmental pollution due to its excessive carbon emission, it cannot be identified as a sustainable industry at the national level.

2.2. Input–Output Analysis in Software and Healthcare Industries

The global software market has grown at compound a annual growth rate of 4.4% since 2014, reaching USD 1.34 trillion in 2019, and the growth rate of the following years is expected to be slightly lower than the 2019 growth rate (6.4%) [32]. The US software market accounted for 45.3% of the global market in 2016, which has a unique position in the global software market [33]. Despite the global financial crisis in 2008, the US overcame the financial crisis well by focusing on fostering the high-tech software industry, and through steady development of the cutting-edge software industry, it has become a leading country in the fourth industrial revolution and software worldwide. In 2020, the software market in South Korea grew by 2.3% compared to the previous year, reaching a market size of USD 22.7 billion (KRW 27.0 trillion) [32]. The South Korean software market is expected to grow steadily [33]. As the importance of the software industry increases, various studies on the software industry are being conducted. In particular, the high growth rate since the 2000s, the contribution to economic development, and the characteristics of a knowledge-based industry have been highlighted as research topics. In addition, research studies on the analysis of the industrial structure and linkage effect of the software industry are also increasing gradually. These research studies mainly analyze the economic effects focusing on the linkage effect and suggest policies for the development of the software industry or the knowledge industry [8,34,35].
Globally, there is an increasing need to expand the healthcare industry and develop related technologies through the convergence of ICT and the healthcare industry. According to Statista [36], the global digital healthcare market was valued at over USD 200 billion in 2020. Accordingly, South Korea declared the bio-healthcare industry a promising industry with great future growth potential employment potential. In addition, the South Korean government announced the goal of creating 300,000 new jobs by achieving 6% of the global market share, USD 50 billion in exports, and USD 3.3 billion (KRW 4 trillion) in R&D expenses [37]. Not only South Korea but also major developed countries are establishing policies to activate the ICT convergence in the healthcare industry to solve the problems of high unemployment and increase in medical expenses due to aging [18]. The healthcare industry is forming a value chain that provides healthcare services through continuous feedback from related industries, such as the pharmaceutical industry, medical and wearable device manufacturing, and clinical trials. Through inter-industrial linkage, they influence each other and continuously create new added values. Therefore, the vitalization of the healthcare industry can enhance national competitiveness, create jobs and provide high-quality healthcare services. Therefore, the government should promote economic growth and job creation strategies by fostering the healthcare industry. Kim et al. [16] analyzed the economic linkage effect of the South Korean healthcare industry using the input–output analysis technique. As a result of the analysis, it was revealed that the healthcare industry has a strong production inducement effect, weak price sensitivity, insignificant backward and forward linkage effects compared to other industries. Additionally, the healthcare industry was found to be closely related to the electronic/electronic device industry and the precision machinery industry. Yamada and Imanaka [15] used the input–output analysis technique to analyze the economic effects of the Japanese healthcare industry and showed that the healthcare industry has similar productivity to other industries.

2.3. Hypotheses Development

The software industry is defined as a sub-industry of the information industry related to software development-, production-, production-, and distribution-related services and information system construction and operation. The UN’s International Standard Industrial Classification (ISIC) established the Information and Communication sector to classify the information, communication, and content/media industries into major categories, and the software industry could be derived from this structure. According to the OECD standards, the software industry was included in software publishing (5820), computer programming, consultancy and related activities (62), as well as data processing, hosting and related activities (6311), as shown in Table 1.
The healthcare industry (or medical industry) refers to the entire field of the economic system that provides products and services to treat, prevent, rehabilitate, and alleviate diseases. ISIC defines the healthcare industry as an industry that includes not only the services provided by skilled professionals in facilities, such as hospitals, but also all health-related activities performed in daily life, even if such specialists do not provide them. This is expressed as an industry classification code, as shown in Table 2.
The three categories include nurses, midwives, physical therapists, pathology clinics, and other health-related occupations, such as medical massage, yoga therapy, speech therapy, foot therapy, and acupuncture. The Global Industry Classification Standard classified this industry into Healthcare Equipment and Services (3510) along with Pharmaceuticals, Biotechnology and Life Sciences (3520).
The software and healthcare industries have great competitiveness compared to other industries, and after the 2008 financial crisis, the US overcame the financial crisis by intensively fostering the high-tech software industry [28,29]. The healthcare industry is attracting attention as an industry that can overcome the global economic crisis and low growth.
Input–output analysis derives the effect of inducing the production of an industry and expresses the influence of one industry on another and the degree of interdependence between industries in relative size based on the average value of all industries. It is useful to explain the linkage effect of an industry and to understand the structure of the national economy. Ye and Yin [38] used Input–output analysis as a study on the relevance and competition between industries in the UK. Chiu and Lin [39] presented the linkage effect of the transportation industry using Input–output analysis in a study on its role and effect on Taiwan’s economy. Mattioli and Lamonica [40] presented the linkage effect of the ICT industry when quantitatively analyzing its economic effects on the global economy. Morrissey and O’Donoghue [41] studied the linkage effect of the marine industry on the Irish economy. Sari and Arifin [42] studied the linkage effects of technology-intensive industries before and after Indonesia’s economic crisis. As such, this study will also use Input–output analysis to examine the linkage effects of the software and healthcare industry on the economy of each country and verify whether there is a difference in the linkage effects between South Korea and the US through several hypotheses in Table 3.

3. Materials and Methods

3.1. Data Sources

This study uses the I-O table and the CO2 emissions from the OECD. The input–output table for the last 10 years was used to examine the change in the production-inducing effect. When analyzing the production-inducing effect, the output at the basic price was used. As for CO2 emissions, data measured according to industry-specific total output (CO2 emissions embodied in final output) was used in the I-O analysis, as shown in Table 4. Using data from the last 10 years, the changes in CO2 emissions were analyzed as the production-inducing effect of the changing industry.

3.2. I-O Analysis and CO2 Emissions

The input–output table is a chart that shows how the goods and services produced by a specific industry in a country are distributed among other industries or sectors for a certain period and how many products from other industries or sectors are placed into each industry for production. The quantitative analysis of the correlations between industries using the I-O table is called inter-industry analysis or I-O analysis [43]. Since the output produced in one industry is the input as a raw material for the production of the output of another industry, each industry is directly or indirectly related. The inter-industry analysis quantitatively shows such a relationship between multiple industries. Therefore, the inter-industry analysis using the I-O table examines the relationship between input and output among industries from a structural point of view, which identifies the relationship between the primary input factor sector and the industry, as well as the transaction volume between the final output sector and each industry in Table 5.
Since inter-industry analysis is a method that analyzes the input and output relationships of each industry under the assumption that they are interrelated, a change in the input of one industry indicates a change in the output of another industry. Therefore, it can be used as a useful analysis tool for national economic forecasting or planning.
A key part of the linkage effect analysis using inter-industry analysis is the linkage effect between industries. The linkage effect refers to an output unit directly or indirectly required to satisfy changes in exogenous sectors, such as consumption, investment, and export, on the basis that the input coefficient from a specific industry is fixed. In other words, the output requirement coefficient indicates the level of production induced directly or indirectly in each sector to satisfy one unit of final demand, indicating the level of output directly or indirectly induced in each sector, which is also called the Leontief inverse matrix coefficient as the Leontief inverse matrix is used in the calculation process [43].
The industrial linkage effect presented by Hirschman [44] draws the output requirement coefficient using the industry association table and indicates the degree of industry activation through the drawn production induction coefficient. One industry directly or indirectly induces production in all industries in the country, and the larger the induced coefficient, the more revitalized the entire industry in the country. These industrial linkage effects can be divided into backward and forward linkage effects. The backward linkage effect refers to the effect of the pulling power on the entire national industry caused by the input of intermediate goods into product processing owned by the industry. The forward linkage effect is defined as the interaction that is directly induced in the structure of the industry-wide intermediary demand and supply relationship caused by the input of products by business customers [38]. It is an industry-wide production-inducing effect caused by the input of a product of the relevant industry as an intermediate product of another industry. The backward linkage effect is expressed as Equation (1), and the forward linkage effect is expressed as Equation (2) [45].
Backward linkage effect ( B L i ) = Column sum of output requirement coefficient matrix/All-industry average of the row sum of the output requirement coefficient matrix
B L j = 1 n i B i j 1 n 2 i j B i j
Forward linkage effect ( F L i ) = Row sum of the output requirement coefficient matrix/All-industry average of the row sum of the output requirement coefficient matrix
F L i = 1 n j B i j 1 n 2 i j B i j
B L i = Power of diffusion;
F L i = Level of excitement caused by diffusion;
r i j = Elements of Leontief inverse matrix;
j = 0 n r i j = Row sum of Leontief inverse matrix;
i = 0 n r i j = Column sum of Leontief inverse matrix.
This study used not only the input–output table but also the CO2 emission data, and CO2 emission data used in the analysis were analyzed by dividing them based on industrial classification standards, such as the I-O table. We calculated the total output of an industry using the sum of intermediate and final demand from the I-O table. As for CO2 emissions, the total CO2 emissions measured in the production activities of a country were divided according to the total output of a certain industry to compare the emissions generated when an industry produces the total output.

4. Results

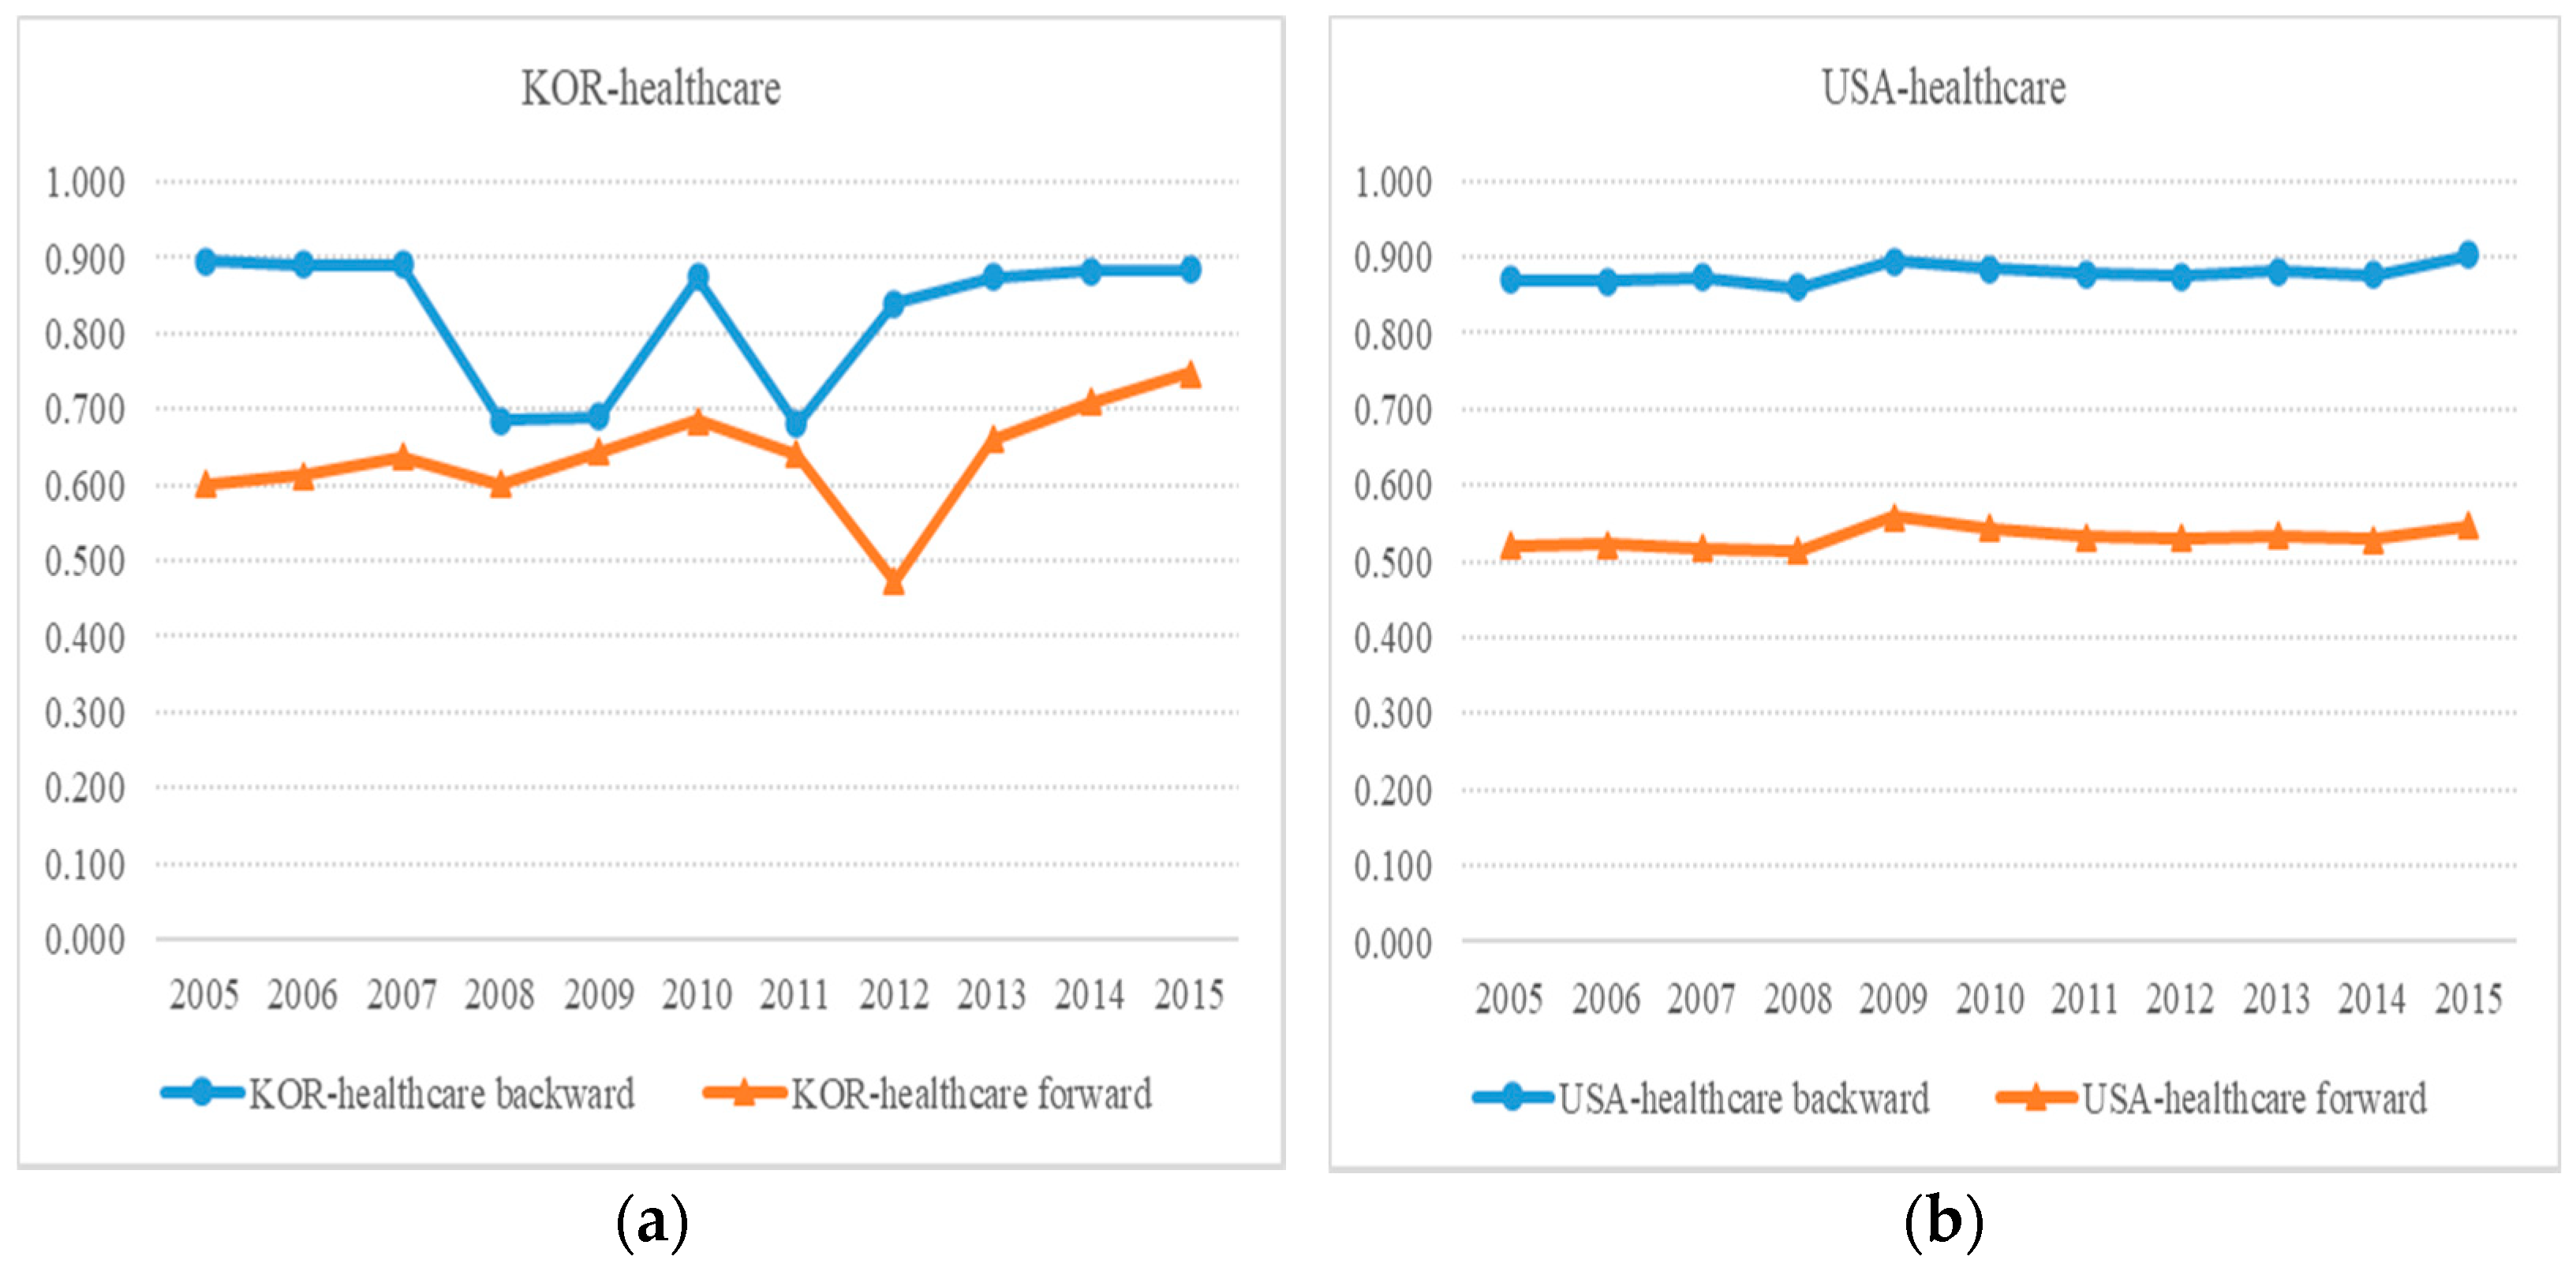
4.1. The Results of the Linkage Effects from 2005 to 2015

Table 6 and Table 7 show the forward and backward linkage effects of the software industry in Korea and the United States from 2005 to 2015.
As shown in Figure 1, for the software industry of South Korea, the average backward linkage effect from 2005 to 2015 was 0.939, which was close to 1. In contrast, the average forward linkage effect was 0.778. During the analysis, the backward linkage effect was higher than the forward linkage effect. In the years when the forward and backward linkage effects of the South Korean software industry exceeded 1, the backward linkage effect exceeded 1 in 2009 and 2011 at 1.006 and 1.023, respectively. The forward linkage effect was somewhat high at 0.8 in 2008 and 2009. This showed that there were various pressures, as well as technological competition to ensure competitiveness in an export-driven economy, along with a decrease in growth rate due to the global economic crisis. Although the software was widely used throughout the industry, it seemed that the adoption of software produced abroad, other than software produced in South Korea, increased relatively quickly.
In the US software industry, the average backward linkage effect from 2005 to 2015 was 0.851, and the average forward linkage effect was 0.848. This meant that the degree of driving other businesses, which was the economic linkage effect of investment in the US software industry, was recovering, and the impact on the production of other industries through software was increasing [46]. The year with the largest backward linkage effect on the US software industry was 2009, and the forward linkage effect was as high as 0.903 and 0.906 in 2009 and 2015, respectively. The ICT sector had the characteristics of general-purpose technologies, which were widely used in various industries [47]. In particular, if ICT convergence was strengthened at the product level, this would lead to an increase in intermediate demand for ICTs, telecommunication and broadcasting functions, and software, affecting the forward linkage effect.
In the South Korean healthcare industry, the average backward linkage effect from 2005 to 2015 was 0.826, and the average forward linkage effect was 0.638. During the analysis period, the backward linkage effect was higher than the forward linkage effect (Figure 2a). The backward linkage effect of the South Korean healthcare industry decreased to 0.685 and 0.689 in 2008 and 2009, respectively, recovered to 0.875 in 2010, and then sharply dropped to 0.681 in 2011 the following year. It was stabilized after 2012. The forward linkage effect was significantly lower than the backward linkage effect, which was significantly lower than the average of the analysis period but recovered after 2013. The healthcare industry is an end-demand industry that is demanded as a final product rather than an intermediate product in other industrial sectors [48].
For the US healthcare industry, the average backward linkage effect was 0.878, and the average forward effect was 0.532 from 2005 to 2015. During the analysis, the backward linkage effect was consistently higher than the forward chaining effect, and both the forward and backward linkage effects were the highest in 2015 (Figure 2b). These results suggested that the healthcare industry should no longer be viewed as an independent industry with low linkage to other industries but as a linked industry [49,50]. Combining the results of the forward and backward linkage effect, the influence coefficient on the software industry and the healthcare industry in South Korea and the US overall was less than 1, which meant that the industry was largely independent.
Table 8 shows the results of hypothesis testing in this study. Hypothesis 1, suggesting that the linkage effect of the South Korean and US software industries would be different, was accepted (p < 0.000). In contrast, Hypothesis 2, suggesting that the linkage effect of the South Korean and US healthcare industries would be different, was partially accepted. Hypothesis H2 of H1, suggesting that the backward linkage effect of the two industries would be different, was rejected (p < 0.088), and Hypothesis H2 of H2, suggesting that the forward linkage effect of the two industries, would be different was accepted (p < 0.000).

4.2. Contributions of Software and Healthcare Industries to CO2 Emissions

Table 9 and Table 10 show the trends of CO2 emissions in software and healthcare industries in South Korea and the US. The total CO2 emissions in the US gradually decreased from 5445.863 Mt in 2005 to 4598.403 Mt in 2015, showing a decrease of about 16% compared to 10 years ago. Average CO2 emissions in the US software industry were very low, accounting for 0.33% of the total emissions. However, despite the decrease in total CO2 emissions, the CO2 emissions of the software industry have been increasing gradually since 2006, requiring attention.
In contrast, average CO2 emissions in the US healthcare industry were very low, accounting for 0.70% of the total emissions, but it was twice the level of the software industry, a comparative industry. CO2 emissions of the healthcare industry seemed to increase gradually from 2012 to 2014 but then decrease again in 2015. As shown in Figure 3, the US software industry, as well as the healthcare industry, were analyzed as industries with small CO2 emissions and small linkage effects. Although the production-inducing effect of the two industries was small, software and healthcare industries should be recognized as sustainable industries in the US with lower CO2 emissions compared to total emissions.
In particular, total CO2 emissions increased from 2005 to 2007 and have continued gradually decreasing since then, but with an insignificant level of reduction in total CO2 emissions compared to the US. Average CO2 emissions of the South Korean software industry were very low, accounting for 0.29% of the total emissions. However, it increased steadily from 2005 to 2014 and then decreased in 2015, indicating that efforts were needed to prevent CO2 emissions from increasing again.
Average CO2 emissions of the South Korean healthcare industry were 0.02% of the total emissions at a much lower level than those of the software industry, indicating no significant change over the last 10 years. In particular, the CO2 emissions of the healthcare industry in South Korea were very different from those in the US.
As can be seen in Figure 3, when considering the linkage effects and CO2 emissions, the production-inducing effect of the South Korean healthcare industry was smaller than that of the software industry. In other words, the small amount of CO2 emissions in the healthcare industry had a small impact on other industries. This suggested that South Korea would need to devise a new strategy that could increase the production-inducing effect while maintaining the low-carbon emission structure of the healthcare industry.

5. Discussion and Conclusions

This study analyzed CO2 emission and economic linkage effect through I-O analysis to find out what role the software and healthcare industries play in the US and South Korea.
Whereas previous studies focused on the influence of an industry on other industries through input–output analysis, this study examined whether the industry is a sustainable industry by considering both the industry’s economic linkage effect and the industry’s CO2 emissions. CO2 emissions are now a direct cost. Countries have to pay to emit carbon dioxide. Even if an industry has a large impact on a country, it is necessary to reconsider whether it is an industry that should be continued if the cost is high. Therefore, analyzing both an industry’s economic linkage effect and its CO2 emissions is very important. Additionally, when comparing the two countries, OECD official data were used. These data are reliable because they are measured by the same standards.
This study provides several important implications for policymakers. First, CO2 emissions from the software and healthcare industries are less than 1% in both South Korea and the US, indicating that they are suitable as base industries for low-carbon national development. Although the carbon emission of the US has decreased by about 16% since 2005, we revealed that the carbon emission of the software industry has been gradually increasing since 2006. The healthcare industry accounted for twice as high CO2 emissions as the software industry. Its CO2 emissions stem from direct activities, such as energy-intensive hospital operations, as well as indirect activities related to healthcare, such as procurement and waste management [51,52,53,54]. The buildings for the healthcare industry (e.g., hospitals) are more energy and water-intensive than normal buildings, consume more resources, and generate a lot of waste from patient care [48]. The healthcare industry also contributes CO2 emissions from the manufacture and disposal of pharmaceuticals and biohazardous products, including inhaled anesthetics, which are themselves potent greenhouse gases (GHGs) [55,56,57]. Therefore, it is not surprising that the healthcare industry entails high CO2 emissions. As the healthcare industry is an essential field for human life, it is difficult to change because there are many institutional and customary barriers that prevent improvement. However, changes are inevitable to reduce CO2 emissions. In this digital age, the healthcare industry will be able to reduce energy use in hospital buildings by integrating advanced ICT into healthcare services such as telemedicine services, which is expected to contribute to reducing CO2 emissions.
Although the US software and healthcare industries account for small CO2 emissions compared to other industries, attention should be paid to the increase in CO2 emissions by each industry, which shows no sign of decreasing. Meanwhile, there was no significant change in South Korea’s total CO2 emissions during the period we analyzed. In addition, the CO2 emissions of the South Korean software industry was 0.3%, similar to that of the US software industry, and the CO2 emission of the South Korean healthcare industry was 0.02%, lower than that of the US healthcare industry. This result shows that the US healthcare industry emits more CO2 than the software industry, but the South Korean healthcare industry emits less CO2 than the software industry. The reason that the software industry emits more carbon dioxide than the healthcare industry in South Korea is that the power consumption of IT products has rapidly increased with the development of the Internet and the spread of smartphones. In addition, cooling costs, material costs, and electronic waste generated when disposing of IT products also contribute to an increase in carbon dioxide emissions. According to recent studies of CO2 emissions in the IT industry, the IT sector was expected to account for 2–6% of global CO2 emissions in 2020 [57]. In addition, Belkhir and Elmeligi [58] predicted that the ICT industry’s CO2 emissions will account for up to 14% of the global CO2 emissions by 2040. Therefore, policies to minimize CO2 emissions in the software industry need to be implemented. Specifically, as the number and use of auxiliary devices are expected to increase as modern software technology advances day by day, it is necessary to implement policies to minimize the CO2 emissions and energy use of such IT equipment [59].
Second, the forward and backward linkage effects of the software industry in South Korea and the US were different, indicating that there is a difference in the industrial structure. According to Miller and Blair [60], if the forward linkage effect is greater than 1, the responsiveness to the demand for intermediate goods from other industries is high, and if the backward linkage effect is greater than 1, the industry has a large influence on the supply of intermediate goods to other industries. In South Korea, the backward linkage effect was higher than the forward linkage effect from 2005 to 2015, particularly in 2009 and 2011, and the backward linkage exceeded 1 in 2009 and 2011. In contrast, in the US, the backward linkage effect was higher than the forward linkage effect from 2005 to 2008, but the forward and backward linkage effects were reversed in 2009. This means that the extent to which the economic linkage effect of investments in the US software industry, which is leading other industries, is recovering, and the impact of software on the production in other industries have been increasing since 2009 [46]. In South Korea, the forward linkage effect was quite low as most of the South Korean software companies supply finished products, not intermediate products, to other industrial sectors. The backward linkage effect, which is the effect on the production in other industries, was also not high because creative labor must be intensively input into software development.
Third, as a result of analyzing the structure of the healthcare industry in South Korea and the US, the backward linkage effect showed a similar level with no significant difference between South Korea and the US; however, the forward linkage effect of the South Korean healthcare industry is significantly higher than that of the US. In addition, during the analysis period, the backward linkage effect of the healthcare industry was consistently higher than the forward linkage effect in both South Korea and the US. This means that the healthcare industry should no longer be viewed as an independent industry but as a linked industry. In particular, the forward linkage effect of the South Korean healthcare industry was 0.472 in 2012, which was remarkably low, but it recovered to 0.660 in 2013 and rose to 0.747 in 2015, which is higher than the average of 0.638. These results indicate that the healthcare industry was in demand as a final product rather than an intermediate product in other industry sectors [34].
Software and healthcare industries are essential to the national economy and human life. Therefore, the US and South Korea need to make strategic investments that can enhance the linkage effects while maintaining the low-CO2 emission structure of both industries as it is now. The limitation of this study is that only the linkage effect was analyzed. By analyzing both the value-added inducement coefficient and the employment inducement coefficient, the role of the industry could not be presented in various aspects. Further research should be directed by analyzing these effects more in order to be helpful in establishing government policies.

Author Contributions

Conceptualization, J.M., E.Y., and J.K.; methodology, J.M. and E.Y.; software, J.M.; validation, H.C. and J.K.; formal analysis, J.M. and E.Y.; investigation, J.M.; data curation, J.M. and E.Y.; writing—original draft preparation, J.M., E.Y., and J.K.; writing—review and editing, J.M. and H.C.; supervision, J.K.; funding acquisition, J.K. All authors have read and agreed to the published version of the manuscript.

Funding

This research was supported by the National Institute of Environmental Research (NIER), funded by the Ministry of Environment (MOE) of the Republic of Korea, grant number NIER-RP2011-1436.

Institutional Review Board Statement

Not applicable.

Informed Consent Statement

Not applicable.

Data Availability Statement

The CO2 emissions data and I/O data used in this study were supplied by OECD statistics. These data are at https://stats.oecd.org/ (accessed on 20 March 2021).

Conflicts of Interest

The authors declare no conflict of interest.

References

  1. Annual CO2 Emissions. Available online: https://ourworldindata.org/co2-emissions (accessed on 9 July 2021).
  2. Cellura, M.; Longo, S.; Mistretta, M. The energy and environmental impacts of Italian households consumptions: An input–output approach. Renew. Sustain. Enengy Rev. 2011, 15, 3897–3908. [Google Scholar] [CrossRef]
  3. Long, Y.; Yoshida, Y.; Liu, Q.; Zhang, H.; Wang, S.; Fang, K. Comparison of city-level carbon footprint evaluation by applying single-and multi-regional input-output tables. J. Environ. Manag. 2020, 260, 110108. [Google Scholar] [CrossRef] [PubMed]
  4. Hwang, W.S.; Shin, J. ICT-specific technological change and economic growth in Korea. Telecommun. Policy 2017, 41, 282–294. [Google Scholar] [CrossRef]
  5. Mohammed, S.; Gill, A.R.; Alsafadi, K.; Hijazi, O.; Yadav, K.K.; Hasan, M.A.; Khan, A.H.; Islam, S.; Cabral-Pinto, M.; Harsanyi, E. An overview of greenhouse gases emissions in Hungary. J. Clean. Prod. 2021, 314, 127865. [Google Scholar] [CrossRef]
  6. Harrison, J.A.; Prairie, Y.T.; Mercier-Blais, S.; Soued, C. Year-2020 Global Distribution and Pathways of Reservoir Methane and Carbon Dioxide Emissions According to the Greenhouse Gas From Reservoirs (G-res) Model. Glob. Biogeochem. Cycles 2021, 35, e2020GB006888. [Google Scholar] [CrossRef]
  7. Ghiat, I.; Mahmood, F.; Govindan, R.; Al-Ansari, T. CO2 utilisation in agricultural greenhouses: A novel ‘plant to plant’approach driven by bioenergy with carbon capture systems within the energy, water and food Nexus. Energy Convers. Manag. 2021, 228, 113668. [Google Scholar] [CrossRef]
  8. Lee, K.; Park, Y.; Lee, D. Measuring efficiency and ICT ecosystem impact: Hardware vs. software industry. Telecommun. Policy 2018, 42, 107–115. [Google Scholar] [CrossRef]
  9. Min, L.; Wang, J.; Luo, Q. Software Industry Integration Process of Informatization and Industrialization. In 2015 International Conference on Education Technology Management and Humanities Science; Atlantis Press: Paris, France, 2015. [Google Scholar]
  10. Calero, C.; García-Rodríguez De Guzmán, I.; Moraga, M.A.; García, F. Is software sustainability considered in the CSR of software industry? Int. J. Sustain. Dev. World Ecol. 2019, 26, 439–459. [Google Scholar] [CrossRef]
  11. Min, Y.K.; Lee, S.G.; Aoshima, Y. A comparative study on industrial spillover effects among Korea, China, the USA, Germany and Japan. Ind. Manag. Data Sys. 2019, 119, 454–472. [Google Scholar] [CrossRef]
  12. Masanet, E.; Shehabi, A.; Lei, N.; Smith, S.; Koomey, J. Recalibrating global data center energy-use estimates. Science 2020, 367, 984–986. [Google Scholar] [CrossRef]
  13. Malmodin, J. The Power Consumption of Mobile and Fixed Network Data Services—The Case of Streaming Video and Downloading Large Files. Electronics Goes Green 2020. 2020. Available online: https://online.electronicsgoesgreen.org/wp-content/uploads/2020/10/Proceedings_EGG2020_v2.pdf. (accessed on 20 December 2021).
  14. Buyya, R.; Sukumar, K. Platforms for building and deploying applications for cloud computing. arXiv 2011, arXiv:1104.4379. [Google Scholar]
  15. Yamada, G.; Imanaka, Y. Input–output analysis on the economic impact of medical care in Japan. Environ. Health Prev. Med. 2015, 20, 379–387. [Google Scholar] [CrossRef] [PubMed] [Green Version]
  16. Kim, Y.J.; Kim, C.Y.; Shin, Y.J. The effects of ubiquitous healthcare service on the south Korean Economy: Using input–output analysis. Inf. Syst. Front. 2017, 19, 1149–1160. [Google Scholar] [CrossRef]
  17. Lenzen, M.; Malik, A.; Li, M.; Fry, J.; Weisz, H.; Pichler, P.P.; Chaves, L.S.M.; Capon, A.; Pencheon, D. The environmental footprint of health care: A global assessment. Lancet Plan. Health 2020, 4, e271–e279. [Google Scholar] [CrossRef]
  18. Park, S.Y. ICT Convergence Medicine Industry Trends; Convergence Research Policy Center: Seoul, Korea, 2017; pp. 1–13. [Google Scholar]
  19. Basole, R.C.; Park, H.; Barnett, B.C. Coopetition and convergence in the ICT ecosystem. Telecommun. Policy 2015, 39, 537–552. [Google Scholar] [CrossRef]
  20. Gopinath, K.; Sai, L.P. A study on the positioning of the brand variants by smartwatch manufacturers: A technometrics approach. Technol. Anal. Strat. Manag. 2021, 33, 1–15. [Google Scholar] [CrossRef]
  21. Standoli, C.E.; Guarneri, M.R.; Perego, P.; Mazzola, M.; Mazzola, A.; Andreoni, G. A smart wearable sensor system for counter-fighting overweight in teenagers. Sensors 2016, 16, 1220. [Google Scholar] [CrossRef] [Green Version]
  22. Health Care Without Harm. Climate Change: An Opportunity for Action. Available online: https://www.noharm-uscanada.org/issues/global/climate-change-opportunity-action (accessed on 20 December 2021).
  23. Martinez, S.; del Mar Delgado, M.; Marin, R.M.; Alvarez, S. Identifying the environmental footprint by source of supply chains for effective policy making: The case of Spanish households consumption. Environ. Sci. Pollut. Res. 2019, 26, 33451–33465. [Google Scholar] [CrossRef]
  24. Lee, S.; Noh, D.W.; Oh, D.H. Characterizing the difference between indirect and direct CO2 emissions: Evidence from Korean manufacturing industries, 2004–2010. Sustainability 2018, 10, 2711. [Google Scholar] [CrossRef] [Green Version]
  25. Moon, J.; Yun, E.; Lee, J. Identifying the Sustainable Industry by Input–Output Analysis Combined with CO2 Emissions: A Time Series Study from 2005 to 2015 in South Korea. Sustainability 2020, 12, 6043. [Google Scholar] [CrossRef]
  26. Malmodin, J.; Lundén, D. The energy and carbon footprint of the global ICT and E&M sectors 2010–2015. Sustainability 2018, 10, 3027. [Google Scholar] [CrossRef] [Green Version]
  27. Wu, R. The carbon footprint of the Chinese health-care system: An environmentally extended input–output and structural path analysis study. Lancet Plan. Health 2019, 3, e413–e419. [Google Scholar] [CrossRef] [Green Version]
  28. Zhou, P.A.B.W.; Ang, B.W.; Poh, K.L. Slacks-based efficiency measures for modeling environmental performance. Ecol. Econ. 2006, 60, 111–118. [Google Scholar] [CrossRef]
  29. Loefgren, A.; Muller, A. The Effect of Energy Efficiency on Swedish Carbon Dioxide Emissions 1993–2004. Sweden: 2008. Available online: http://hdl.handle.net/2077/10389 (accessed on 20 August 2021).
  30. Jaeger, C.C.; Paroussos, L.; Mangalagiu, D.; Kupers, R.; Mandel, A.; Tàbara, J.D. A New Growth Path for Europe: Generating Prosperity and Jobs in the Low-Carbon Economy. 2012. Available online: https://www.researchgate.net/publication/242071180_A_New_Growth_Path_for_Europe_Generating_Prosperity_and_Jobs_in_the_Low-Carbon_Economy (accessed on 25 August 2021).
  31. Executive Office of the President. The President’s Climate Action Plan; The White House: Washington, DC, USA, 2013; pp. 1–21.
  32. SPRI. 2020 Software Industry Outlook; Software Policy & Research Institute: Gyeonggi-do, Korea, 2020; pp. 1–99. [Google Scholar]
  33. SPRI. Annual Report in SW Industry 2015 Edition; Software Policy & Research Institute: Gyeonggi-do, Korea, 2016; pp. 1–101. [Google Scholar]
  34. Adedoyin, F.F.; Bekun, F.V.; Driha, O.M.; Balsalobre-Lorente, D. The effects of air transportation, energy, ICT and FDI on economic growth in the industry 4.0 era: Evidence from the United States. Technol. Forecast. Soc. Chang. 2020, 160, 120297. [Google Scholar] [CrossRef] [PubMed]
  35. Sung, T.K. Industry 4.0: A Korea perspective. Technol. Forecast. Soc. Chang. 2018, 132, 40–45. [Google Scholar] [CrossRef]
  36. Digital Health-Statistics & Facts. Available online: https://www.statista.com/topics/2409/digital-health/ (accessed on 9 May 2021).
  37. Ministries of Government. A Bio-Health Industry Innovation Strategy; Ministries of Government: Seoul, Korea, 2019; pp. 10–11.
  38. Ye, Z.P.; Yin, Y.P. Economic Linkages and Comparative Advantage of the UK Creative Sector. University of Hertfordshire Business School Working Paper No. UHBS, 2. Available online: https://papers.ssrn.com/sol3/papers.cfm?abstract_id=1310948 (accessed on 20 May 2021).
  39. Chiu, R.H.; Lin, Y.C. Applying input-output model to investigate the inter-industrial linkage of transportation industry in Taiwan. J. Mar. Sci. Technol. 2012, 20, 173. [Google Scholar] [CrossRef]
  40. Mattioli, E.; Lamonica, G.R. The ICT role in the world economy: An input-output analysis. J. World Econ. Res. 2013, 2, 20–25. [Google Scholar] [CrossRef]
  41. Morrissey, K.; O’Donoghue, C. The role of the marine sector in the Irish national economy: An input–output analysis. Mar. Policy 2013, 37, 230–238. [Google Scholar] [CrossRef] [Green Version]
  42. Sari, K.; Arifin, M. The linkage among technology-intensive manufacture industries in east java by input-output analysis approach. J. ST Policy RD Manag. 2014, 12, 45–54. [Google Scholar]
  43. Bank of Korea. Inter-Industry Analysis Manual; Bank of Korea: Seoul, Korea, 2014. [Google Scholar]
  44. Hirschman, A.O. The Strategy of Economic Development; Yale University Press: New Haven, CT, USA, 1958. [Google Scholar]
  45. Lin, S.J.; Chang, Y.F. Linkage effects and environmental impacts from oil consumption industries in Taiwan. J. Environ. Manag. 1997, 49, 393–411. [Google Scholar] [CrossRef]
  46. Choi, J.; Ryu, J.H. New Growth Power, Economic Effect Analysis of Software Industry. J. Inf. Technol. Appl. Manag. 2014, 21, 381–401. [Google Scholar] [CrossRef]
  47. Basu, S.; Fernald, J. Information and communications technology as a general-purpose technology: Evidence from US industry data. Ger. Econ. Rev. 2007, 8, 146–173. [Google Scholar] [CrossRef] [Green Version]
  48. Jung, H.J.; Na, K.Y.; Yoon, C.H. The role of ICT in Korea’s economic growth: Productivity changes across industries since the 1990s. Telecommun. Policy 2013, 37, 292–310. [Google Scholar] [CrossRef]
  49. Korea Health Industry Development Institute. Medicine Industry Analysis Report 2009 Edition; Korea Health industry Development Institute: Seoul, Korea, 2009. [Google Scholar]
  50. Suh, J.K. An Analysis on the Economic Effects of the Medical and Measuring Instrument Industry. Korean J. Health Ser. Manag. 2012, 6, 219–229. [Google Scholar] [CrossRef] [Green Version]
  51. Eckelman, M.J.; Sherman, J. Environmental impacts of the US health care system and effects on public health. PLoS ONE 2016, 11, 1–14. [Google Scholar] [CrossRef] [Green Version]
  52. National Health Service Sustainable Development Unit. Carbon Update for the Health and Care Sector in England 2015. London, 2016. Available online: https://www.sduhealth.org.uk/policy-strategy/reporting/nhs-carbon-footprint.aspx (accessed on 20 December 2021).
  53. Chung, J.W.; Meltzer, D.O. Estimate of the carbon footprint of the US health care sector. JAMA 2009, 302, 1970–1972. [Google Scholar] [CrossRef] [Green Version]
  54. World Bank. Climate-Smart Healthcare: Low-Carbon and Resilience Strategies for the Health Sector. Available online: http://documents.worldbank.org/curated/en/322251495434571418/Climate-smart-healthcare-low-carbon-and-resilience-strategies-for-the-health-sector (accessed on 20 December 2021).
  55. Sherman, J.; Le, C.; Lamers, V.; Eckelman, M. Life cycle greenhouse gas emissions of anesthetic drugs. Anesth. Analg. 2012, 114, 1086–1090. [Google Scholar] [CrossRef]
  56. Vollmer, M.K.; Rhee, T.S.; Rigby, M.; Hofstetter, D.; Hill, M.; Schoenenberger, F.; Reimann, S. Modern inhalation anesthetics: Potent greenhouse gases in the global atmosphere. Geophys. Res. Lett. 2015, 42, 1606–1611. [Google Scholar] [CrossRef] [Green Version]
  57. UNEP DTU Partnership. CDM Pipeline Overview. Available online: www.cdmpipeline.org/publications/CDMPipeline.xlsm (accessed on 12 April 2021).
  58. Belkhir, L.; Elmeligi, A. Assessing ICT global emissions footprint: Trends to 2040 & recommendations. J. Clean. Pro. 2018, 177, 448–463. [Google Scholar] [CrossRef]
  59. Mohankumar, M.; Kumar, M.A. Green based software development life cycle model for software engineering. Indian J. Sci. Technol. 2016, 9, 1–8. [Google Scholar] [CrossRef] [Green Version]
  60. Miller, R.E.; Blair, P.D. Input-Output Analysis: Foundations and Extensions; Cambridge university press: Cambridge, UK, 2009; pp. 1–768. [Google Scholar]
Figure 1. Backward and forward linkage effects of the software industry: (a) in Korea (left); (b) in USA (Right).
Atmosphere 13 00209 g001
Figure 2. Backward and forward linkage effects of the healthcare industry: (a) in Korea (left); (b) in the USA.
Atmosphere 13 00209 g002
Figure 3. Annual CO2 emissions and proportion of emissions of the software and healthcare industries in 2005 to 2015: (a) in the USA; (b) South Korea (right).
Atmosphere 13 00209 g003
Table 1. Definition of the software industry by ISIC.
DivisionGroupClassDescription
Division 58 Publishing activities
5825820Hospital activities
Division 62 Computer programming, consultancy and related activities
6206201Computer programming activities
6206202Computer consultancy and computer facilities management activities
6206209Other information technology and computer service activities
Division 63 Information service activities
6316311Data processing, hosting and related activities
6316312Web portals
6396399Other information service activities n.e.c.
Source: International Standard Industrial Classification of All Economic Activities (ISIC), Revision 4, by United Nations New York, 2008.
Table 2. Definition of the healthcare industry by ISIC.
DivisionGroupClassDescription
Division 86 Human health activities
8618610Hospital activities
8628620Medical and dental practice activities
8698690Other human health activities
Source: International Standard Industrial Classification of All Economic Activities (ISIC), Revision 4, by United Nations New York, 2008.
Table 3. Statistical hypotheses.
Hypotheses
Hypothesis 1 (H1)The linkage effect between the Korean software industry and the US is different.
H1The backward linkage effect between the Korean software industry and the US is different.
H2The forward linkage effect between the Korean software industry and the US is different.
Hypothesis 2 (H2)The linkage effect between the Korean healthcare industry and the US is different.
H1The backward linkage effect between the Korean healthcare industry and the US is different.
H2The forward linkage effect between the Korean healthcare industry and the US is different.
Table 4. Range of the industries corresponding to the OECD Industry Classification.
IndustrySectorSub-Sector
Software Information and communicationPublishing, audiovisual, and broadcasting activities
IT and other information services
Healthcare Human health and social workHuman health activities
Social work activities without accommodation
Source: International Standard Industrial Classification of All Economic Activities (ISIC), Revision 4, by United Nations New York, 2008.
Table 5. Format of the input–output table.
Producing SectorIntermediate Goods and ServicesTotal Intermediate DemandTotal Final DemandTotal Output
S1S2S3S4.Sn
S1X11X12X13X14.X1nSX1nD1X1
S2X21X22X23X24.X2nSX2nD2X2
S3X31X32X33X34.X3nSX3nD3X3
Quadrant ISX4nQuadrant II
…………………………
SnXn1Xn2Xn3Xn4 XnnSXnnDnXn
Total Purchase
Value Added
Total Input
Table 6. Comparison of linkage effects of software industry between Korea and the USA.
YearForward Linkage of
Software Industry
Backward Linkage of
Software Industry
KoreaUSAKoreaUSA
20050.7330.7940.949.0.850
20060.7470.7970.9320.864
20070.7620.7980.9200.851
20080.8810.8100.9840.843
20090.8810.9031.0060.877
20100.7180.8840.8850.852
20110.8780.8581.0230.846
20120.7020.8610.9300.848
20130.7420.8610.8840.848
20140.7660.8600.8970.850
20150.7460.9060.9200.831
Avg.0.7780.8480.9390.851
Table 7. Comparison of linkage effects of the healthcare industry between Korea and the USA.
YearForward Linkage of
Healthcare Industry
Backward Linkage of
healthcare Industry
KoreaUSAKoreaUSA
20050.6010.5210.8960.869
20060.6130.5230.8920.869
20070.6370.5180.8910.873
20080.6020.5150.6850.860
20090.6440.5580.6890.894
20100.6850.5450.8750.885
20110.6410.5320.6810.878
20120.4720.5300.8390.875
20130.6600.5340.8750.881
20140.7110.5290.8820.877
20150.7470.5460.8840.903
Avg.0.6380.5320.8260.878
Table 8. Statistical hypotheses.
Hypothesesp-ValueResults
Hypothesis 1 (H1)The linkage effect between the Korean software industry and the US is different.-Accept
H1The Backward linkage effect between the Korean software industry and the US is different.0.000Accept
H2The Forward linkage effect between the Korean software industry and the US is different.0.013Accept
Hypothesis 2 (H2)The linkage effect between the Korean healthcare industry and the US is different.-Partial Accept
H1The Backward linkage effect between the Korean healthcare industry and the US is different.0.088Reject
H2The Forward linkage effect between the Korean healthcare industry and the US is different.0.000Accept
Table 9. The proportion of CO2 emissions of software and healthcare industries in the USA.
YearThe Proportion of CO2 Emissions in the Software Industry (%)The Proportion of CO2 Emissions in the Healthcare Industry (%)Total CO2 Emissions (Mt)
20050.300.595445.863
20060.290.595325.436
20070.300.605378.97
20080.310.655154.128
20090.340.764840.339
20100.330.735009.381
20110.330.764781.944
20120.330.724565.141
20130.350.774686.173
20140.360.784694.472
20150.360.744598.403
Table 10. The proportion of CO2 emission of software and healthcare industries in South Korea.
YearThe Proportion of CO2 Emissions in the
Software Industry (%)
The Proportion of CO2 Emissions in the
Healthcare Industry (%)
Total CO2
Emissions (Mt)
20050.200.0113.5
20060.230.0113.9
20070.240.0115.2
20080.210.0114.2
20090.290.0210.1
20100.320.0213.1
20110.330.0113.5
20120.310.0212.1
20130.370.0211.8
20140.360.0212.8
20150.290.0212.3
Publisher’s Note: MDPI stays neutral with regard to jurisdictional claims in published maps and institutional affiliations.

