Abstract
The combined finite–discrete element method (FDEM) based on the cohesive zone model (the CZM) achieves cracking simulation by inserting cohesive elements between solid elements. In this study, three-point bending fracture tests of frozen soil were simulated by using the FDEM based on the CZM. Firstly, the sensitivity of the cohesive model parameters was analyzed. Secondly, through a series of simulations of the three-point bending test of frozen soil, it was found that the model with reasonable values of the CZM parameters had a good adaptability to the three-point bending cracking test of frozen soil, as the model not only reflects the load-displacement curve, but also has good correspondence with the fracture pattern compared with the test. Finally, the relationship between the CZM parameters and the specimens’ temperature under two loading rates of 1 mm/min and 0.1 mm/min was analyzed, and it was found that the CZM parameters had a good linear relationship with the specimens’ temperature. This paper is expected to provide a new possibility for the numerical simulation of frozen soil cracking.
1. Introduction
In recent years, many major projects have been built and operated in cold regions. However, because frozen soil is an anisotropic, inhomogeneous geological material whose mechanical properties vary dramatically with temperature, many cold-weather construction projects face serious foundation-cracking challenges. Researchers have provided theories and methods to improve the problems faced by engineering design in cold regions, including the thermal stability of permafrost engineering [1,2] and the freezing process of frozen soil [3,4,5], and have discovered the phenomenon of frozen soil cracking during freezing. Furthermore, with global warming, the cracking and sliding of rock glaciers caused by the freeze–thaw process and gravity has piqued the interest of academics [6,7,8,9]. In this regard, Yuko Yamamoto et al. conducted an experimental study on the fracture process of frozen soil and investigated the effects of loading rate, moisture content, temperature and other test conditions on the fracture mechanical behavior and damage morphology of the specimens [10]. However, obtaining the influence laws of different variables on the test results only through experiments remains a challenge because there are many factors affecting the fracture behavior of frozen soil, and the tests are not easy to conduct.
Numerical simulations can avoid the above-mentioned difficulties of physical tests and are now an alternative option for studying fracture problems in frozen soil due to their ability to repeat the study at low cost. Since the start of the 21st century, with the development of computational techniques, many modeling techniques have been developed and applied to the study of material fracture problems. Among them, the most used ones are the finite difference method (FDM) [11,12,13], the boundary element method (BEM) [14,15], and the finite element method (FEM) [16,17,18], which assume small deformation and continuity; but these assumptions make it impossible to describe the full process when it comes to problems related to material failure damage; this provides an opportunity for the development of discontinuous numerical methods. As new numerical simulation methods of discontinuous medium mechanics emerge, particle flow code (PFC) [19,20], discontinuous deformation analysis (DDA) [21,22], and universal distinct element code (UDEC) [23] represent the material as a collection of independent particles and adopt the basic assumption that structural blocks are rigid, which makes the study of the problem focus on the contact interaction between blocks after fracture damage. However, they cannot describe the deformation of the structural blocks [24]. Moreover, these methods have not been widely used, especially in large-scale calculations, due to their huge computational cost and the difficulty of determining microscopic parameters.
In general, numerical techniques based on continuous and discontinuous mechanics provide powerful tools for studying a range of scientific and engineering problems, but they are still inadequate for analyzing material deformation and crack generation and extension at the same time. Exhilaratingly, a numerical simulation technique coupling finite and discrete elements, named the combined finite–discrete element method (FDEM), was proposed by Whittaker et al. [25] for solving problems with continuous media in the far field and discontinuous media in the near field based on the elastoplastic fracture mechanics theory. In this theory, zero-thickness cohesive zone elements were inserted among the bulk elements to realize the transfer of physical field and fracture simulation of the material developed from the CZM [26]. Tijssens et al. [27] analyzed the sensitivity of the mesh size to the simulation model through four-point bending tests simulation for concrete based on the FDEM. Wu et al. [28] performed numerical simulations of a series of rock three-point bending tests based on the CZM to investigate the effects of specimen height, mesh size, material ductility, and loading rate on the fracture transition zone of rock materials. Xie et al. [29] used the method to simulate the crack closure process of the uniaxial compression tests of rocks. In summary, the FDEM method based on the CZM has been widely used for numerical fracture simulation studies of various materials, including concrete and rocks, but this method is still lacking in the simulation of frozen soil cracking.
In this study, a cohesive finite element computational model for three-point bending cracking of frozen soil was established. After the cohesive zone elements have been inserted between the solid elements and the suitable mesh section sizes have been selected, the sensitivity of the CZM parameters, the adaptability of the model to the three-point bending test, and the relationship between the model parameters and the test temperature conditions are analyzed and discussed, respectively. This study is expected to provide new research ideas for the numerical simulation of frozen soil cracking.
2. Numerical Simulation Methodology
2.1. The Basic Idea of the CZM
The basic idea of the FDEM based on the CZM is to insert zero-thickness cohesive zone elements between adjacent solid elements to control the sliding separation phenomenon between the solid elements. The cohesive zone elements and solid elements are linked in terms of mesh topology relations, but the constitutive relations are independent of each other. This feature determines that the cohesive zone element is naturally suitable for the finite element analysis framework, and it has great advantages when we are studying complex fracture damage problems. The constitutive relationship of the cohesive zone elements can be directly defined by the arbitrary traction separation law based on the CZM to realize the cracking behavior at the solid–solid interface. In this study, zero-thickness cohesive zone elements were inserted between the solid elements, and a bilinear traction separation law [30] based on the CZM was used to simulate the tensile damage process of three-point bending of frozen soil specimens. The constitutive relationship of the cohesive zone elements is shown in Figure 1.
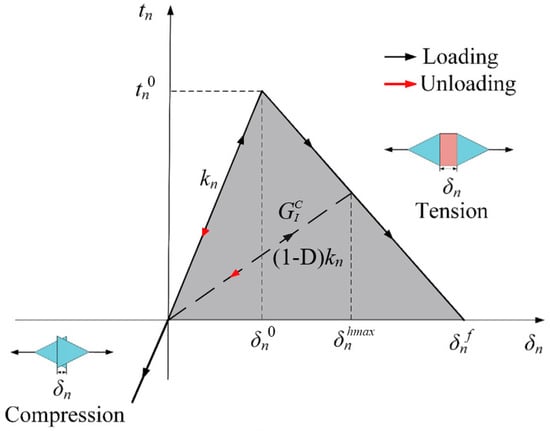
Figure 1.
Constitutive relationship of the cohesive zone element.
Figure 1 shows that the normal traction stress in the cohesive zone element increases linearly with the normal displacement ; the normal stiffness magnitude is defined as . When the normal displacement has reached , the normal traction stress reaches the initial damage stress , indicating that the cohesive zone element is beginning to damage. After that, the normal traction stress decreases linearly as the normal displacement , and the normal stiffness of the cohesive zone element begin to damage with the damage variable corresponding to the maximum normal cracking displacement in the deformation history defined as Equation (1).
The normal stiffness after cohesive zone element damage is , where when the cohesive zone element begins to damage, and when the cohesive zone element is completely damaged it is then removed from the model. The normal displacement corresponding to the cohesive zone element fracture is , which is expressed by the critical fracture energy and the initial damage stress , as shown in Equation (2).
where represents the work done by the normal traction stress on the normal displacement , which is also the area enclosed by the curve and the horizontal axis in Figure 1.
Based on the above definition, the bilinear traction separation constitutive relation of the cohesive zone element can be obtained as shown in Equation (3), which demonstrates the process that the cohesive zone element first exhibits linear elasticity, then linear damage, and finally complete cracking failure with the normal traction load increasing.
2.2. FDEM Model Based on the CZM of Three-Point Bending Test of Frozen Soil
The three-point bending test model of frozen soil was developed using ABAQUS finite element software, and its fracture state was compared with the corresponding experimental results conducted by Yuko Yamamoto et al. [10] to verify the effectiveness of the FDEM model based on the CZM in predicting the three-point bending damage test of frozen soil. The numerical model used a planar model with a specimen length of 240 mm, a height of 70 mm, and a prefabricated crack of 2 mm in width and 35 mm in height left in the middle, as shown in Figure 2. The red boundaries of the gray triangular solid elements in the figure are the cohesive zone elements inserted between the solid elements. After a trial calculation, the discrete size of the triangular mesh was determined to be 2.94 mm, which not only ensured that the calculation could reflect the real cracking situation as much as possible, but could also consider the calculation efficiency. The upper middle loading head of the specimen was loaded vertically at a constant loading rate of 0.1 mm/min and 1 mm/min, the bottom left and right supports were symmetrically distributed and remained fixed during the test, while the friction coefficients of the upper loading head, bottom supports, and specimen were set to 0.1. The model was analyzed using explicit dynamics to achieve a quasi-static loading state to ensure the stability of the calculation; the stability time step was set to 4 × 10⁻⁷ s.
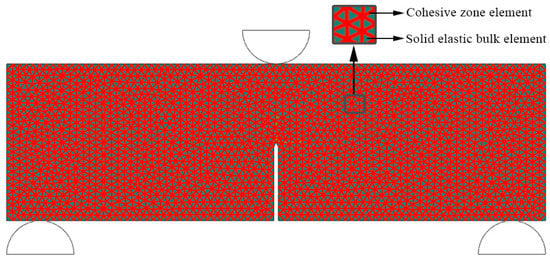
Figure 2.
Geometric model for the numerical simulation.
3. The CZM Parameter Sensitivity Analysis
As three important input parameters of the CZM, the normal stiffness , the initial damage stress and the fracture energy play a decisive role in the accurate simulation of the mechanical behavior and damage morphology of the frozen soil specimen during the three-point bending test. The essence of the FDEM model based on the CZM is a coupled finite–discrete element approach [31]. Before the relationship between microscopic and macroscopic parameters is established, the microscopic parameters can only be determined by trial calculations Therefore, we first obtained, by trial calculation, a set of input parameters of the three-point bending test for the test number B9 [10], in which equals to 7.5 × 10¹² N/m3, equals to 50 MPa and equals to 23 MJ/mm2. The sensitivity of the three important input parameters of the CZM was then analyzed using the univariate method.
3.1. Sensitivity Analysis of the Normal Stiffness
The initial damage stress was kept at 50 MPa and the fracture energy at 23 MJ/mm2; the normal stiffness was set to 5.5 × 10¹² N/m3, 6.5 × 10¹² N/m3, 7.5 × 10¹² N/m3 and 8.5 × 10¹² N/m3 respectively, and the normal load-displacement relationship curves were obtained and shown in Figure 3. It can be seen from the figure that the normal load-displacement curves corresponding to the four different normal stiffnesses are relatively close, but the slope of the normal load-displacement curve and the peak force that the model can withstand increase slightly with the increase in the normal stiffness . However, the increase amount is essentially negligible, and the change in the normal stiffness after reaching the peak force almost does not affect the shape of the curve, indicating that the sensitivity of the model to the disturbance of the normal stiffness is relatively small.
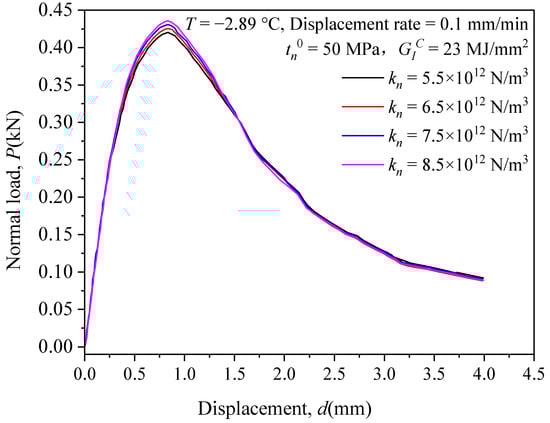
Figure 3.
Normal load-displacement relationship curves for different normal stiffnesses .
3.2. Sensitivity Analysis of the Initial Damage Stress
The normal stiffness was kept at at 7.5 × 10¹² N/m3 and the fracture energy at 23 MJ/mm2, and the initial damage stress was set to 45 MPa, 50 MPa, 55 MPa and 60 MPa, respectively; the normal load-displacement relationship curves were obtained and are shown in Figure 4. From the figure, the peak force clearly increases with the increase in the initial damage stress . Unlike the normal stiffness , the sensitivity of the fracture stage of the model to the initial damage stress is very strong. Increasing the initial damage stress will cause the slope of the curve to fall more steeply after reaching the peak force, and the corresponding residual strength will be reduced, indicating that the model is relatively more sensitive to the perturbation of the initial damage stress, which is mainly reflected in the peak stress.
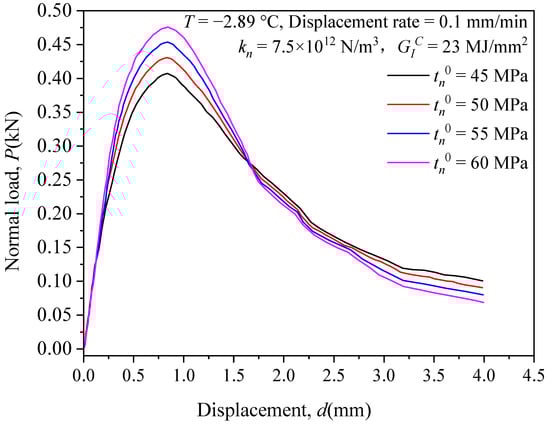
Figure 4.
Normal load-displacement relationship curves for different initial damage stresses .
3.3. Sensitivity Analysis of Fracture Energy
The normal stiffness was kept at 7.5 × 10¹² N/m3 and the initial damage stress at 50 MPa, while the fracture energy was set to 23 MJ/mm2, 25 MJ/mm2, 27 MJ/mm2 and 29 MJ/mm2, respectively; the normal load-displacement curves were obtained and are shown in Figure 5. In the figure, the change in has almost no effect on the peak force and the slope of the curve before reaching the peak force, but as the fracture energy increases, the curve after the peak force becomes flat and the corresponding residual strength increases, which is because the larger the fracture energy is, the greater will be the energy required to damage the cohesive element. The calculated results indicate that the sensitivity of the model to the perturbation in the fracture energy is relatively large, and is mainly reflected in the effect on the residual strength after damage.
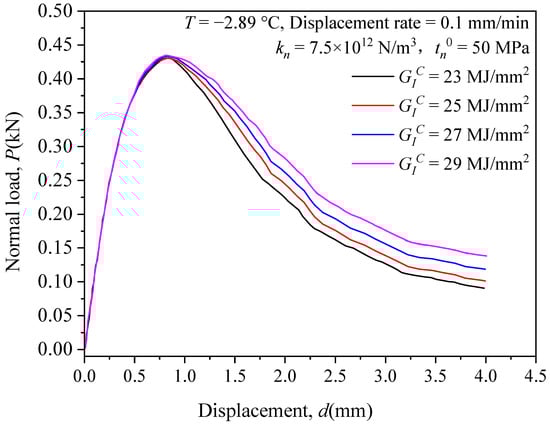
Figure 5.
Normal load-displacement relationship curves for different fracture energies .
4. Numerical Simulation of the Three-Point Bending Tests of Frozen Soil
By trial calculation, the CZM parameters were obtained and are listed in Table 1; this ensured good correspondence between numerical simulation results and experimental results [10] in respect of the normal load-displacement curve and the fracture pattern of specimens.

Table 1.
The CZM parameters used in the numerical simulation.
Based on the input of the CZM parameters in Table 1, the normal load-displacement curves obtained from the simulations at the loading rates of 1.0 mm/min and 0.1 mm/min are compared with the test results as shown in Figure 6 and Figure 7, respectively. It can be seen from Figure 6 that the normal load-displacement curves obtained by the FDEM based on the CZM can well reflect the brittle fracture characteristics of the specimens, especially the stage after the damage to the specimens when compared to the test results corresponding to the loading rate of 1.0 mm/min. In comparison to the test results for the loading rate of 0.1 mm/min shown in Figure 7, the normal load-displacement curves obtained by simulation can accurately reflect the ductile fracture characteristics of the specimens, particularly those with higher temperatures. The above results indicate that the FDEM based on the CZM can well simulate the three-point bending test of frozen soil with appropriate parameters of the cohesive elements.
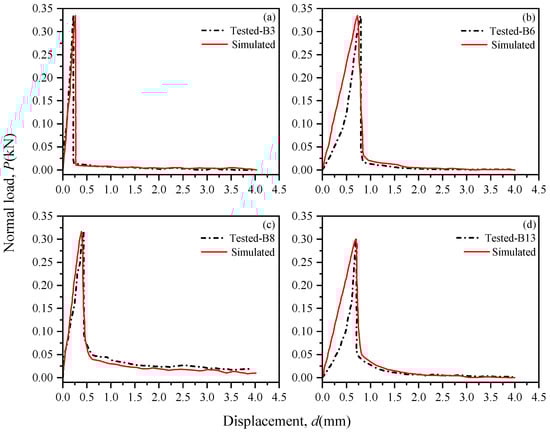
Figure 6.
Simulation and test result [10] comparison of the three-point bending test of frozen soil specimens with a 1.0 mm/min loading rate: (a) Specimen’s temperature = −3.2 °C; (b) Specimen’s temperature = −2.66 °C; (c) Specimen’s temperature = −1.7 °C; (d) Specimen’s temperature = −0.97 °C.
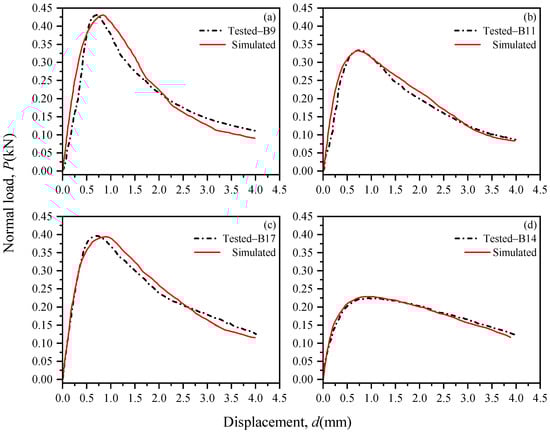
Figure 7.
Simulation and test result [10] comparison of the three-point bending test of frozen soil specimens with a 0.1 mm/min loading rate: (a) Specimen’s temperature = −2.89 °C; (b) Specimen’s temperature = −1.72 °C; (c) Specimen’s temperature = −1.56 °C; (d) Specimen’s temperature = −0.53 °C.
The final damage pattern of the three-point bending test of specimen B3 in the numerical simulation and test was compared, as shown in Figure 8, in which the blue line is the initial state of the specimen and the red line is the damage state of the specimen in the numerical simulation. The crack expansion path obtained from the simulation is essentially a symmetric expansion upward along the center of the initial crack, which is essentially consistent with the crack expansion width and height in the test. However, there is a slight discrepancy in the path of the crack expansion, which is due to the problem of non-uniformity of sample making in the test, while the numerical simulation results are relatively more idealized. In summary, the FDEM based on the CZM has good adaptability for simulating the three-point bending test of frozen soil.
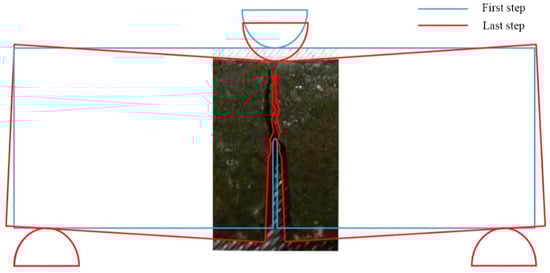
Figure 8.
The damage pattern of the three-point bending test of the specimen B3 in the numerical simulation and test.
5. Discussion of the CZM Parameters with Specimen Temperature
The comparison results between numerical simulations and tests in Figure 6, Figure 7 and Figure 8 show that the FDEM based on the CZM has good adaptability for the three-point bending test of frozen soil, but how to objectively establish the relationship between the CZM parameters and the physical parameters of the soil specimen is the key for the model to have application value. Therefore, on the basis of the parameters obtained from numerical calculations and the experimental data, the relationship between the CZM parameters in numerical simulations and the specimen temperature under two loading rates of 1 mm/min and 0.1 mm/min were analyzed under the limited experimental data of the three-point bending test of frozen soil.
Figure 9 shows the relationship between the normal stiffness and the specimen temperature under the two loading rates. The variation in the normal stiffness with temperature is essentially the same for both loading rates, which shows that the value of the normal stiffness becomes smaller as the temperature increases. It can also be seen that the larger the loading rate, the faster the change in the normal stiffness with the temperature. The decrease in the normal stiffness with an increasing temperature is mainly due to the decrease in stiffness of the cohesive ice at the boundary of frozen soil particles. Although the normal stiffness changes with the temperature, the effect of the loading rate on the normal stiffness is in the range of 1 × 10¹² N/m3 to 2 × 10¹² N/m3, which can be considered small based on the results shown in Figure 3. In other words, the normal stiffness changes slightly when the temperature difference between the specimens is small.
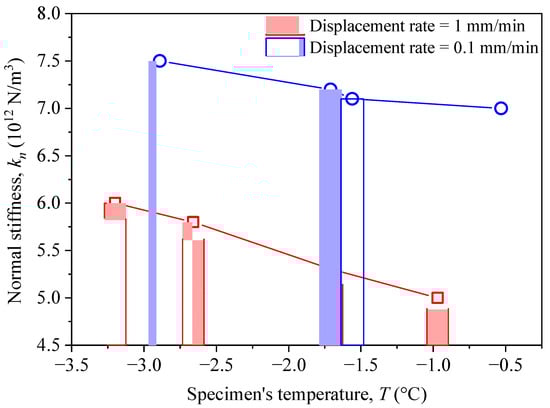
Figure 9.
The relationship between the normal stiffness and the specimen’s temperature.
Figure 10 shows the relationship between the initial damage stress and the specimen temperature under the two loading rates. The variation law of the normal initial damage stress with the temperature and the variation law of the normal stiffness with the temperature are essentially the same for both loading rates. From the change law in the normal load with displacement in Figure 6 and Figure 7, the curve reaches the peak with better linearity with the 1.0 mm/min loading rate, indicating that the specimen is in an elastic state; the brittle damage then occurs after the peak strength; on the contrary, the specimen has been damaged and has shown plasticity characteristics before reaching the peak strength with the 0.1 mm/min loading rate.
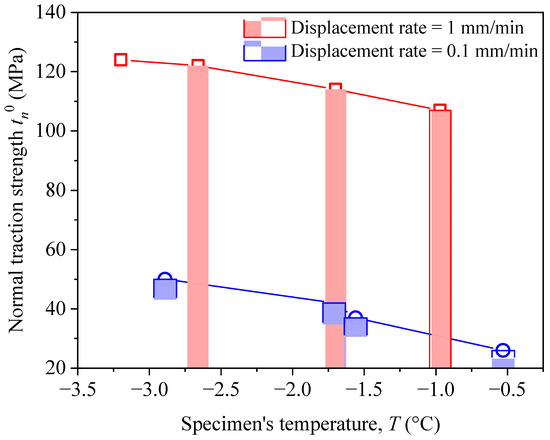
Figure 10.
The relationship between the initial damage stress and the specimen’s temperature.
Figure 11 shows the relationship between the fracture energy with specimen temperature for two loading rates. The fracture energy has a different changing law and the temperature compared to the normal stiffness and the initial damage stress . The fracture energy corresponding to a loading rate of 0.1 mm/min is about 10 times higher than that corresponding to a loading rate of 1.0 mm/min, and they all have a small variation with temperature, indicating that the fracture energy is less affected by temperature within a certain range and is mainly affected by the loading rate. This fact is mainly reflected in the persistence of residual strength in Figure 6 and Figure 7 that low loading rates are significantly better than high loading rates.
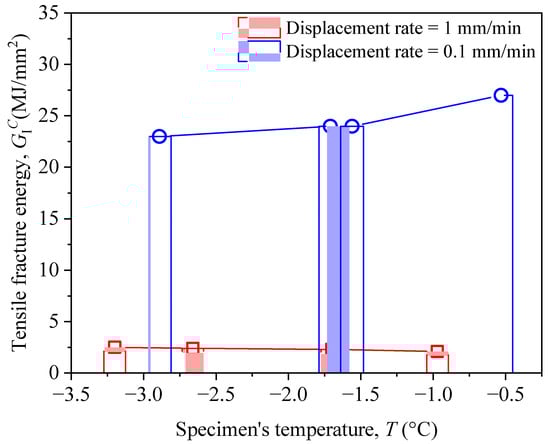
Figure 11.
The relationship between the fracture energy and the specimen’s temperature.
6. Conclusions
Using the FDEM based on the CZM, a numerical simulation study of three-point bending tests of frozen soil was conducted to analyze the sensitivity of the CZM parameters, the adaptability of the simulation model, and the relationship between the CZM parameters and the specimen temperature. The main conclusions were obtained as below.
- (1)
- The sensitivities of the numerical model to the CZM parameters were analyzed by the control variable method. It was found that the normal stiffness has good stability in the numerical model, which only influences the slope of the normal load-displacement curve before the damage to a certain extent; the initial damage stress has more influence on the peak stress; and the fracture energy has more influence on the residual strength after the specimen damage.
- (2)
- A series of simulations of three-point bending tests of frozen soil were established, and the CZM parameters were determined by the trial calculation method under the principle that the simulated normal load-displacement curves matched well with the tested ones, indicating that the FDEM based on the CZM has good adaptability in the numerical simulation of the three-point bending test of frozen soil.
- (3)
- The CZM parameters have a good linear relationship with the test temperature. Although the relationships between the CZM parameters and other material parameters, such as the material component, specimen’s density, and water content, are not discussed in this paper due to the limitation of the experimental data, the analysis results still indicate that, based on many numerical and practical tests, it is promising to directly establish the relationship between the CZM parameters and the physical parameters of the specimens. This work is expected to provide a new research method for the application of the FDEM in the fracture simulation of frozen soil.
Author Contributions
Methodology, Y.W.; Software, B.M.; Validation, L.M.; Formal analysis, B.M., W.H. and B.W.; Investigation, W.H.; Resources, W.W.; Data curation, W.H.; Writing—original draft, B.M. and W.H.; Writing—review & editing, Y.W.; Visualization, Z.M.; Project administration, Y.W.; Funding acquisition, Y.W. All authors have read and agreed to the published version of the manuscript.
Funding
This research was funded by the National Natural Science Foundation of China (No. 41901070, No. 42171131), the Science and Technology Major Project of Inner Mongolia Autonomous Region (No. 2020ZD0020), Science and Technology Project of Inner Mongolia Autonomous Region (No. 2020GG0126) and the Ordos Science & Technology Plan (2021EEDSCXQDFZ013).
Data Availability Statement
Not applicable.
Acknowledgments
We extend our gratitude to the editor and reviewers for their valuable time.
Conflicts of Interest
The authors declare no conflict of interest.
References
- Chen, L.; Lai, Y.M.; Fortier, D.; Harris, S. Impacts of snow cover on the pattern and strength of mobile air flow in air convection embankment in Sub-Arctic regions. Renew. Energy 2022, 199, 1033–1046. [Google Scholar] [CrossRef]
- Chen, L.; Voss, C.I.; Fortier, D.; McKenzie, J.M. Surface energy balance of Sub-Arctic roads and highways in permafrost regions. Permafr. Periglac. Process. 2021, 32, 681–701. [Google Scholar] [CrossRef]
- Wang, Y.T.; Wang, D.Y.; Ma, W.; Wen, Z.; Chen, S.J.; Xu, X.T. Laboratory observation and analysis of frost heave progression in clay from the Qinghai-Tibet Plateau. Appl. Therm. Eng. 2018, 131, 381–389. [Google Scholar] [CrossRef]
- Xu, X.T.; Zhang, W.D.; Wang, Y.T. Measuring and modeling the dielectric constant of soil during freezing and thawing processes: An application on silty clay. Acta Geotech. 2022, 17, 3867–3886. [Google Scholar] [CrossRef]
- Wang, Y.T.; Hua, W.H.; Xu, X.T.; Zhang, W.D.; Wang, B.Y.; Ma, B.C. Moisture migration in the Qinghai-Tibet silty clay within an added quartz sand layer under one-dimensional freezing. Cold Reg. Sci. Technol. 2022, 202, 103627. [Google Scholar] [CrossRef]
- Barsch, D. Permafrost creep and rockglaciers. Permafr. Periglac. Process. 1992, 3, 175–188. [Google Scholar] [CrossRef]
- Buchli, T.; Laue, J.; Springman, S.M. Amendments to interpretations of SAAF inclinometer data from the furggwanghorn rock glacier, Turtmann Valley, Switzerland: Results from 2010 to 2012. Vadose Zone J. 2016, 15, 1–3. [Google Scholar] [CrossRef]
- Roer, I.; Haeberli, W.; Avian, M.; Kaufmann, V.; Kääb, A. Observations and Considerations on Destabilizing Active Rock Glaciers in the European Alps. In Proceedings of the Ninth International Conference on Permafrost, Fairbanks, AK, USA, 29 June–3 July 2008; pp. 1505–1510. [Google Scholar]
- Delaloye, R.; Lambiel, C.; Gärtner, R.I. Overview of rock glacier kinematics research in the Swiss Alps. Geogr. Helv. 2010, 65, 135–145. [Google Scholar] [CrossRef]
- Yamamoto, Y.; Springman, S.M. Three- and four-point bending tests on artificial frozen soil samples at temperatures close to 0 °C. Cold Reg. Sci. Technol. 2017, 134, 20–32. [Google Scholar] [CrossRef]
- Granet, S.; Fabrie, P.; Lemonnier, P.; Quintard, M. A two-phase flow simulation of a fractured reservoir using a new fissure element method. J. Pet. Sci. Eng. 2001, 32, 35–52. [Google Scholar] [CrossRef]
- Chen, S.; Yue, Z.Q.; Tham, L.G. Digital image based approach for three-dimensional mechanical analysis of heterogeneous rocks. Rock Mech. Rock Eng. 2007, 40, 145. [Google Scholar] [CrossRef]
- Chen, S.; Yue, Z.Q.; Tham, L.G. Digital image-based numerical modeling method for prediction of inhomogeneous rock failure. Int. J. Rock Mech. Min. Sci. 2004, 41, 939–957. [Google Scholar] [CrossRef]
- Pan, E.; Chen, C.S.; Amadei, B. A BEM formulation for anisotropic half-plane problems. Eng. Anal. Bound. Elem. 1997, 20, 185–195. [Google Scholar] [CrossRef]
- Saez, A.; Domınguez, J. Dynamic crack problems in three-dimensional transversely isotropic solids. Eng. Anal. Bound. Elem. 2001, 25, 203–210. [Google Scholar] [CrossRef]
- Liang, Z.Z.; Tang, C.A.; Li, H.X.; Zhang, Y.B. Numerical simulation of 3-d failure process in heterogeneous rocks. Int. J. Rock Mech. Min. Sci. 2004, 41, 419. [Google Scholar] [CrossRef]
- Zhu, W.C.; Tang, C.A. Numerical simulation of Brazilian disk rock failure under static and dynamic loading. Int. J. Rock Mech. Min. Sci. 2006, 43, 236–252. [Google Scholar] [CrossRef]
- Liu, H.Y.; Roquete, M.; Kou, S.Q.; Lindqvist, P.A. Characterization of rock heterogeneity and numerical verification. Eng. Geol. 2004, 72, 89–119. [Google Scholar] [CrossRef]
- Cho, N.; Martin, C.D.; Sego, D.C. A clumped particle model for rock. Int. J. Rock Mech. Min. Sci. 2007, 44, 997–1010. [Google Scholar] [CrossRef]
- Yang, S.Q.; Tian, W.L.; Huang, Y.H. Failure mechanical behavior of pre-holed granite specimens after elevated temperature treatment by particle flow code. Geothermics 2018, 72, 124–137. [Google Scholar] [CrossRef]
- Jiao, Y.Y.; Zhang, H.Q.; Tang, H.M.; Zhang, X.L.; Adoko, A.C.; Tian, H.N. Simulating the process of reservoir-impoundment-induced landslide using the extended DDA method. Eng. Geol. 2014, 182, 37–48. [Google Scholar] [CrossRef]
- Shi, G.H.; Goodman, R.E. Two dimensional discontinuous deformation analysis. Int. J. Numer. Anal. Methods Geomech. 2010, 9, 541–556. [Google Scholar] [CrossRef]
- Lan, H.; Martin, C.D.; Hu, B. Effect of heterogeneity of brittle rock on micromechanical extensile behavior during compression loading. J. Geophys. Res. 2010, 115, B01202. [Google Scholar] [CrossRef]
- Morris, J.P.; Rubin, M.B.; Blair, S.C.; Glenn, L.A.; Heuze, F.E. Simulations of underground structures subjected to dynamic loading using the distinct element method. Eng. Comput. 2004, 21, 384–408. [Google Scholar] [CrossRef]
- Whittaker, B.N.; Singh, R.N.; Sun, G. Rock Fracture Mechanics: Principles, Design, and Applications; Elsevier: Amsterdam, The Netherlands, 1992. [Google Scholar]
- Barenblatt, G.I. The mechanical theory of equilibrium cracks in brittle fracture. Adv. Appl. Mech. 1962, 7, 55–129. [Google Scholar] [CrossRef]
- Tijssens, M.G.A.; Sluys, B.L.J.; Giessen, E.V.D. Numerical simulation of quasi-brittle fracture using damaging cohesive surfaces. Eur. J. Mech. 2000, 19, 761–779. [Google Scholar] [CrossRef]
- Wu, Z.; Ma, L.; Fan, L. Investigation of the characteristics of rock fracture process zone using coupled FEM/DEM method. Eng. Fract. Mech. 2018, 200, 355–374. [Google Scholar] [CrossRef]
- Xie, H.; Chen, S.B.; Huang, Y.L.; Sun, X.T.; Han, J.; Cao, Y.X. Mesh size and parameter sensitivity analysis based on cohesive zone model. J. Shandong Univ. Eng. Sci. 2021, 51, 111–118, 128. [Google Scholar] [CrossRef]
- Camanho, P.P.; Davila, C.G. Mixed-Mode Decohesion Finite Elements for the Simulation of Delamination in Composite Materials; NASA/TM-2002-21173; NASA Langley Research Center: Hampton, VA, USA, 1 June 2002.
- Mahabadi, O.K.; Lisjak, A.; Munjiza, A.; Grasselli, G. Y-Geo: New combined finite-discrete element numerical code for geomechanical applications. Int. J. Geomech. 2012, 12, 676–688. [Google Scholar] [CrossRef]
Publisher’s Note: MDPI stays neutral with regard to jurisdictional claims in published maps and institutional affiliations. |
© 2022 by the authors. Licensee MDPI, Basel, Switzerland. This article is an open access article distributed under the terms and conditions of the Creative Commons Attribution (CC BY) license (https://creativecommons.org/licenses/by/4.0/).