Abstract
Surface ozone (O3) pollution has become one of the top environmental issues in recent years around the world and can be influenced by meteorological processes on multiple scales. Understanding the meteorological mechanism and contributions of O3 pollution is of great importance for O3 mitigation. In this study, we explored the impacts of meteorological conditions on O3 concentrations in a coastal city in Southeast China, with a particular focus on O3 pollution episodes inspringtime. A significant increase in the O3 pollution ratefrom 2015 to 2020 was observed (41.7% year−1) and the seasonal characteristics of O3 concentrations showed a two-peak pattern. We selected 12 pollution episodes during the springtime of 2015 to 2020 and identified four dominant synoptic weather patterns (SWPs) that could cause O3 pollution. The local meteorological conditions and vertical dynamic structures under different SWPs were analyzed. The results showed that high O3 levels tend to be associated with high temperature, weak wind, low relative humidity, and deep vertical sinking motion. We also established a quantitative linkage between the O3 values and meteorological factors. Based on meteorological conditions, 60.8~80.8% of the variation in O3 can be explained.
1. Introduction
Surface ozone (O3) is an important air pollutant that is mainly produced through photochemical reactions of key precursors (volatile organic compounds (VOC) and nitrogen oxides (NOx)) [1,2,3,4]. High concentrations of O3 are harmful to human health, ecosystems, and climate change [5,6,7,8]. Ozone is harmful to breathe. Ozone aggressively attacks lung tissue by reacting chemically with it. Miloš et al. [9] found the enlargement of intercellular space in mesophyll parenchyma after the ozone exposure of trees. Stanislav et al. [10] suggested that almost all species examined are damaged to some extent by ozone at the concentrations that often prevail in all regions of the world. In addition, as a short-lived greenhouse gas, O3 has an effect on global warming [11]. Since the implementation of the “13th Comprehensive Work Plan for Energy Saving and Emission Reduction in China”, the annual average concentration of particulate matter (PM2.5) has decreased by 21.7% [12]. However, O3 values have been increasing in recent years globally [13]. Therefore, O3 has become one of the most concerning pollutants for governments and researchers [14,15,16].
The impact of meteorology on ozone has been studied in many studies. Some have attributed meteorology as the dominant factor in ozone trends [17,18] and some have claimed other factors, such as emission ratios and PM [19]. Meteorological conditions play an important role in the generation, deposition, transport, and dilution of O3 by affecting the transport path of O3 and the interaction of precursors [20,21,22,23,24]. Many studies have focused on the meteorological impact on O3 variability [25,26,27,28,29]. It was found that O3 levels could be affected by solar radiation [30], the East Asian Monsoon [31], and downward transport from the stratosphere or troposphere. Since local meteorological factors are greatly determined by synoptic weather patterns (SWPs), analyzing the influence of SWPs on O3 concentrations is crucial for the study of the meteorological mechanism of O3 pollution [32]. Liang et al. [33] analyzed the relationship between O3 concentrations, meteorological factors, and SWPs using a stepwise regression model and obtained an O3 concentration forecast equation. Notero et al. [34] suggested that the meteorology described by the regression model can explain most of the O3 variability in central and northwestern Europe. Fujian Province, which is located on the southeast coast of China, also faces O3 pollution problems, although the precursor emissions are relatively low compared to the Beijing–Tianjin–Hebei region and Pearl River Delta [13,35]. Putian City is located on the coast of central Fujian, surrounded by large industrial areas, and was proven to have the highest O3 annual value and the largest number of polluted days in Fujian [13,35]. Surface O3 has been a major pollutant in the region, especially during the spring season. Previous studies suggested that the characteristics of O3 distribution and influencing factors varied significantly in different regions due to the different emission levels, geographical environment, and meteorological conditions [36,37,38], and meteorological conditions could have greater impacts on O3 variability in relatively clean regions [13]. Thus, studying the meteorological impacts on O3 pollution in the region is of great importance for understanding the mechanism of O3 evolution.
In this work, surface O3 concentrations from 2015 to 2020 in the study area were analyzed. We focused on springtime with the highest O3 concentrations and selected 12 typical O3 pollution episodes over six years. Weather classification was applied to identify the predominant SWPs. The local meteorological variables and vertical dynamic structures under different SWPs were analyzed to explore the relationship between O3 values and meteorological conditions. In addition, we established a quantitative linkage between the O3 concentrations and meteorological factors by developing a stepwise multiple linear regression (MLR) model. This study will provide a scientific basis for O3 pollution forecasting, ozone pollution prevention, and the control and mitigation of global warming.
2. Materials and Methods
2.1. Meteorological and Surface O3 Datasets
Putian (PT), a coastal city in central Fujian Province, was selected for the analysis of surface O3 concentrations and meteorological conditions in this study. Hourly surface O3 measurements from the four monitoring sites and meteorological data from the meteorological station were used. The locations of the city and monitoring stations are shown in Figure 1.
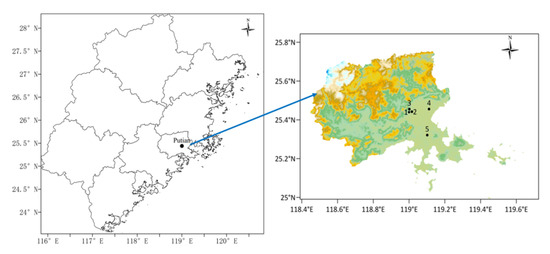
Figure 1.
Distribution of meteorological station and environmental monitoring station in Putian (1. Meteorological Station; 2. Canghou Road; 3. Environmental monitoring station of Putian; 4. Hanjiang No. 6 middle school; 5. Xiuyu district government).
The hourly meteorological data from the Putian Meteorological Observatory (No. 58946, 25.44° N, 119.00° E, 81.9 m) were adopted, including pressure (hPa), temperature (°C), precipitation (mm), sunshine hours (h), relative humidity (%), wind speed (ms−1), and visibility (m). The daily mean data were calculated based on the data from 01:00 to 24:00, and the sunshine hours along with precipitation were analyzed as daily sums. Geopotential, vertical velocity, and divergence from 1000 to 100 hPa (27 levels) along with the sea-level pressure were obtained from the European Centre for Medium-Range Weather Forecasts (ECMWF) ERA5 hourly reanalysis dataset.
The maximum daily 8 h average (MDA8) O3 concentrations were calculated based on the hourly data from 2015 to 2020, according to the Ambient Air Quality Standard of China. An O3 pollution episode was defined as one or several consecutive days with MDA8 O3> 160 μg m−3. In order to increase the number of samples and reliability, data from one day before and one day after the episode were also included in the analysis of meteorological factors and vertical structures if the concentrations exceeded 150 μg m−3.
2.2. Weather Classification
Weather conditions and meteorological conditions not only affect the transport pathways of O3 but also influence the interaction of O3 precursors, which play an important role in the dispersion, dilution, and accumulation of pollution. The analysis of the influence of meteorological conditions on ozone concentration under different weather patterns is essential for the study of the meteorological mechanisms for O3 pollution. There are three major groups of weather classification approaches: Subjective, hybrid, and objective, depending on the automatic degree during the classification process [39]. The subjective method is easy to operate and has good accuracy. Here we adopted the subjective method, and weather classification was applied to the mean sea-level pressure field and 500 hPa geopotential height field of each polluted day.
2.3. Statistical Method
We applied a stepwise multiple linear regression (MLR) model (Equation (1)), which has been widely used in environmental and meteorological studies [40,41,42], to objectively define and weight the meteorological factors, including temperature, relative humidity, wind speed, visibility, precipitation, sunshine hours, and pressure. The MLR model is able to overcome the multicollinearity of meteorological factors and runs fast with large amounts of data as the model does not need complex calculations.
where O3 represents the predicted O3 concentration for each SWP, is a constant, is the coefficient of the meteorological factor , and n is the number of independent meteorological factors. If the correlation coefficient between the observed O3 concentrations and a meteorological factor was statistically significant at the 95% confidence level, this meteorological factor would be selected. MLR model shows whether an independent variable has a significant effect on the dependent variable according to the t-test. If p < 0.05, the independent variable was entered; otherwise, the independent variable was removed. The threshold for the variance inflation factor (VIF = 10) was used to minimize the influence of the correlations between the meteorological factors. The adjusted coefficient of determination (RE2) of an equation quantifies the proportion of the dependent variable’s variability that can be explained by the independent variable’s variability.
3. Results
3.1. Overview of Regional Ozone Pollution and Meteorological Conditions
3.1.1. Characteristics of O3 Concentrations
The inter-annual variation of O3 concentrations in PT is shown in Table 1. From 2015 to 2020, the annual 90th percentile of surface O3 concentrations in PT ranged from 118 to 158 μg m−3 with a significantly increasing trend. The 90th MDA8 O3 concentrations in 2017−2018 (156−158 μg m−3) were much higher than in 2015−2016 (118−129 μg m−3). The concentrations declined in 2019−2020 (138−140 μg m−3) but were still higher than in 2015–2016. From 2015 to 2020, the total number of O3-polluted days in PT was 87 days. The highest frequency of O3−polluted days occurred in 2017 (35 d, 9.6%), followed by 2018 (25 d, 6.8%), and the MDA8 O3 concentration peaked on 30 April 2017 (216 μg m−3). During the six years, the frequency of O3−polluted days increased by 41.7% per year, indicating that surface O3 pollution has aggravated in the region.

Table 1.
The inter-annual variation of surface O3 in PT during 2015–2020.
Figure 2 shows the monthly and hourly concentrations of surface O3 in PT from 2015 to 2020. There were two peaks of O3 concentrations that occurred in April to May (spring) and September to October (autumn), respectively (Figure 2a). O3 concentrations tended to be relatively low from November to February and June to August. As shown in Figure 2b, O3 values were higher at noon and lower at night. During the six years, O3 hourly concentrations peaked at 14:00 and then dropped to the lowest at 7:00. The hourly O3 concentrations from 2015 to 2016 were significantly lower than in 2017 to 2020, indicating the increasing trend of surface O3 levels in recent years.
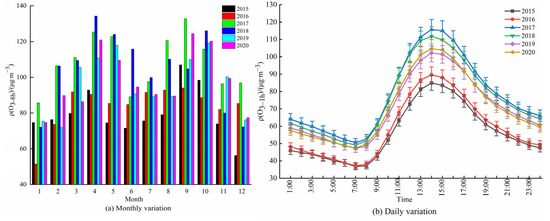
Figure 2.
Monthly (a) and hourly (b) concentrations of surface O3 in PT from 2015 to 2020.
3.1.2. Predominant Synoptic Weather Patterns
Based on weather classification, five SWPs in spring from 2015 to 2020 were obtained and the results are shown in Table 2. It was found that Type CU occurred most often (208 d) but there were no O3−polluted days due to the frequent precipitation. In total, 12 O3 pollution episodes (36 d) were observed under the other four SWPs. Type FS had a total of 59 d and 11 O3 polluted days, which had the highest frequency of O3−polluted days (18.6%) and the highest O3 concentrations (176.5 μg m−3). Type GN had the lowest frequency of polluted days (6.3%) and the lowest O3 concentrations (167.0 μg m−3). The frequency of O3−polluted days under Types GS and BB was 9.9% and 10.5, respectively. To better understand the meteorological mechanisms of O3 pollution, the four SWPs that could cause O3 pollution (including Types FS, GN, GS, and BB) will be analyzed specifically.

Table 2.
Number of days and the O3 concentrations for O3 pollution in PT during spring under different SWPs from 2015 to 2020.
The mean sea−level pressure field and wind field at 925 hPa for the four SWPs are shown in Figure 3. As shown in Figure 3a, a cold front or a stationary front existed to the north under Type FS, and the study area was in a warm frontal area with sparse ground isobars and weak wind. There was a convergence of southwesterly and southeasterly winds in the central part of the coast at 925 hPa, which is favorable for O3 accumulation. Under Type GN, there was a high-pressure center in the northwest of the study area with 1027.5 hPa (Figure 3b). The surface isobars were dense, and the pressure gradient was large. The study area was influenced by the northeast airflow at 925 hPa and the wind speed was high, reaching 8 m s−1. It was suggested that moderate winds could transport the pollutants upstream of the region, resulting in increased O3 concentrations [43]. Under Type GS, the high-pressure center was located at sea and the study area was at the rear or bottom of the high (Figure 3c). The study area was influenced by the east–southeast airflow of 4.0–6.0 m s−1 at 925 hPa. Due to a large number of chemical plants and industrial parks in the eastern and southern parts of the study area, the surface easterly and southeasterly winds could transport the O3 precursors to the study area, leading to higher O3 levels. Under Type BB, the study area was on the edge of the western Pacific subtropical high and was affected by the southwest airflow at 925 hPa (Figure 3d). Due to the unfavorable photochemical reaction conditions, the number of polluted days under this type is the lowest.
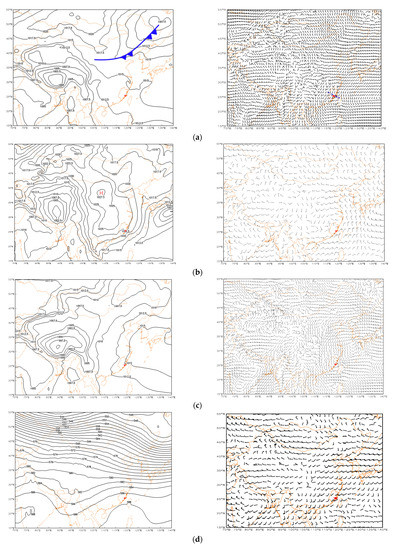
Figure 3.
The mean sea-level pressure field and wind field at 925 hPa for each SWP during the polluted days from 2015 to 2020. Sea-level pressure ((a–c) left); 925 hPa wind ((a–c) right) 500 hPa geopotential height ((d) left); 925 hPa wind ((d) right); the star represents the study area. (a) Warm sector ahead of front—Type FS; (b) cold high-pressure ridge—Type GN; (c) transformed surface cold high—Type GS; (d) edge of subtropical high pressure—Type BB.
3.2. Synopticimpacts on Regional Ozone Pollution
3.2.1. Influence of Meteorological Factors on Regional Ozone Pollution
To summarize the typical meteorological characteristics of O3-polluted days, we analyze the meteorological variables under the four SWPs (Table 3).

Table 3.
The meteorological conditions in PT under each SWP during the springtime of 2015–2020.
Type FS had a moderate daily max temperature (26.3 °C) and relative humidity (69.9%), along with weak wind (1.7 m s−1). The solar radiation (13.2 MJ m−2) and sunshine hours (5.4 h) were the lowest and precipitation existed. It is notable that the temperature inversion layer appeared below 850 hPa on the polluted days. Temperature inversions could cut off the mass exchange between the lower and upper layers and result in the accumulation of O3 on the surface [44]. These created meteorological conditions that are unfavorable for O3 generation and accumulation.
Type GN had the strongest solar radiation (24.9 MJ m−2) and the longest sunshine hours (10.3 h). The air was dry (54.1%), and the wind speed was high (2.1 m s−1). The sunny and dry weather with strong northerly winds was conducive to both the local photochemical reaction and regional transport, resulting in O3 pollution.
The temperature in Type GS was high (26.3 °C), the solar radiation was 22.4 MJ m−2, and the sunshine hours were 8.5 h, which was favorable for the photochemistry generation of O3.
The highest temperature appeared in Type BB (31.4 °C). Similar to Type GS, the strong solar radiation (24.7 MJ m−2) and long sunshine hours (9.9 h) created favorable conditions for O3 generation. In addition, the existence of the temperature inversion layer prevented the diffusion of O3.
3.2.2. Influence of Vertical Structure on Regional Ozone Pollution
In addition to chemical formation and horizontal transportation, the vertical structure is also a crucial dynamic factor in O3 levels as it has a significant effect on the vertical diffusion of pollutants [44]. In order to understand the influence of the vertical dynamic mechanism of O3 pollution, the physical variables (vertical velocity and divergence) at different pressure levels representing dynamic conditions were analyzed (Figure 4).
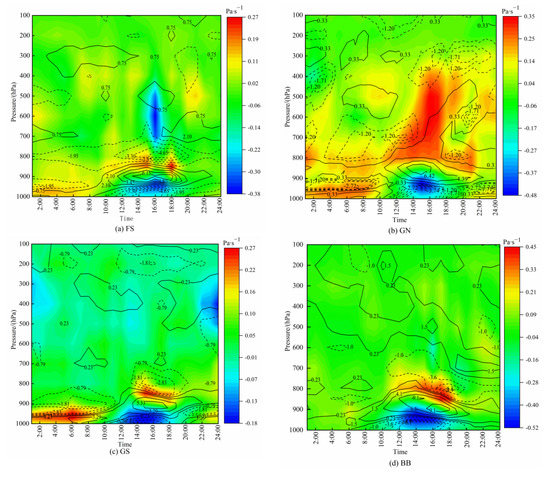
Figure 4.
Vertical velocity (the shaded, unit: Pa s−1) and divergence (black line, the dotted lines mean convergence and solid lines mean divergence, unit: 10 s−5) at different pressure levels for each SWP. (a) Warm sector ahead of front—Type FS; (b) cold high-pressure ridge—Type GN; (c) transformed surface cold high—Type GS; (d) edge of subtropical high pressure—Type BB.
Under Type FS, there existed a weak sinking motion (the vertical velocity was 0.13 Pa s−1) and divergence on the ground from 1:00 to 8:00. Due to the enhanced radiation and increased temperature at noon, 1000–900 hPa had an ascending motion with −0.34–0.22 Pa s−1 from 12:00 to 16:00, and the highest vertical velocity appeared near 950 hPa along with divergence. The ascending motion weakens with the increase in height, and a deep sinking motion appeared at 900–750 hPa. This vertical structure compresses the atmosphere in the boundary layer and favors O3 accumulation [45].
Influenced by the northeast airflow in front of the high-pressure ridge, a deeper sinking motion than in Type FS was shown in Type GN, with the highest vertical velocity appearing at 600 hPa (0.35 Pa s−1). Different from Type FS, a divergence–convergence structure was found from noon to night: A divergence of 4.39–6.42 × 10⁻⁵ s−1 under 850 hPa and a convergence of −1.71–1.3 × 10⁻⁵ s−1 at 300 hPa. It was suggested that this structure promotes the downward transport from the stratosphere to the troposphere [46], and this may be the key driver of O3 pollution under Type GN with a moderate daily temperature of 22.5 °C.
Similar to Type GN, there was a sink-ascending sink structure under Type GS, being favorable for O3 generation and accumulation. Different from the other three SWPs, there was no obvious sinking motion during 1:00–10:00 near the ground in Type BB. In the afternoon, the air below 900 hPa turned into an updraft, and the strongest rising speed of −0.52 Pa s−1 appeared near 950 hPa. The rising speed decreased with the rise of height, and there was a vertical speed zero value near 900 hPa. A deep sinking motion occurred at 900–700 hPa and the sinking speed increased with the height. There was the highest sinking speed of 0.45 Pa s−1 at 850 hPa, along with a divergence area at 900–850 hPa. During 11:00–17:00, there was a divergence at 900–700 hPa. This structure created favorable conditions for pollutants to accumulate near the surface, leading to O3 pollution in Type BB.
Figure 5 shows the diurnal variation of the O3 concentration for four SWPs. It was found that from 12:00 to 16:00 when the photochemical reaction is strong, the peak O3 concentration was the highest under the SWP with the highest Tmax. In addition, the valley value of the O3 concentration at night was related to the vertical velocity. Without any sinking motion during this period, the O3 concentration was lowest under Type BB (46.8 μg m−3 at 7:00). Due to the deep sinking motion under Type GN (0.25 Pa s−1) and Type GS (0.27 Pa s−1), the pollutants tended to accumulate near the surface and resulted in the higher valley value of O3 (72.6 μg m−3 and 101.0 μg m−3, respectively).
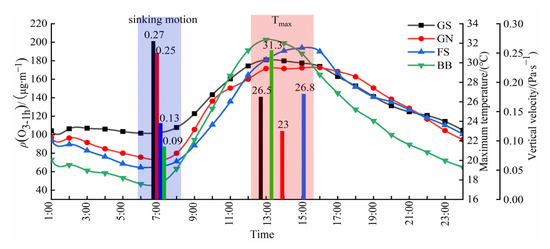
Figure 5.
Diurnal variation of the O3 concentration for four SWPs in PT during spring from 2015 to 2020.
3.3. Quantifying the Contributions of Meteorological Conditions
In order to quantitatively assess the effect of meteorological conditions on O3 variation, stepwise MLR models were applied to different SWPs, and the results are shown in Table 4.

Table 4.
Equations of the stepwise MLR for each SWP in PT during the springtime of 2015–2020.
All of the regression equations for the four SWPs passed the F test and the T test, indicating the method was effective and the results were believable. The predicted versus observed O3 concentrations for the validation are shown in Figure 6. It was suggested that the contributions of meteorological factors to the O3 variations can be evaluated by the explained variance (RE2) calculated from the models [40]. As shown in Table 4, the local meteorological factors explained 60.8–80.8% of the O3 variations, which were much higher than in other regions with higher emissions (44–70% in northern China) [42]. The RE2 for Type BB and Type GN were the highest at 80.8% and 80.6, respectively, indicating the crucial effect of meteorological conditions on O3 variations in the two SWPs. In addition, the meteorological drivers were different in different SWPs. Wind speed, relative humidity, daily max temperature, and sunshine hours played important roles in all four SWPs. The pressure was a key driver of O3 levels in Types FS, GS, and BB, and the O3 concentrations in Type GN were associated with visibility.
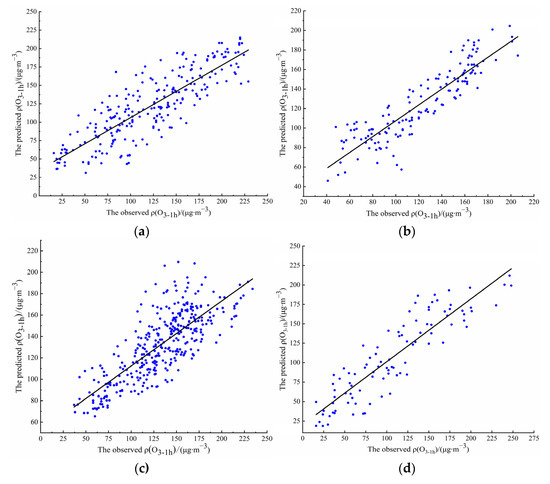
Figure 6.
Scatterplots of predicted versus observed O3 concentrations for the four SWPs. (a) Type FS; (b) Type GN; (c) Type GS (d); Type BB.
4. Discussion
- The 90th MDA8 O3 concentration in PT ranged from 118 μg m−3 to 158 μg m−3 with a significantly increasing trend from 2015 to 2020. In the past 6 years, the total number of O3-polluted days was 87 d, and the most occurred in 2017 (35 d). The frequency of O3-polluted days increased from 0.5% in 2015 to 9.6% in 2017, indicating the increasing severity of O3 pollution in the coastal cities in Southeast China. The annual variation of O3 concentrations presents a double-peak pattern, with the peaks appearing in spring and autumn [43,47]. The diurnal variation shows a single-peak pattern, with the peak at 14:00 and the valley at 7:00 [20].
- Based on the weather classification method, five SWPs in total (including Types CU, FS, BB, GS, and GN) were clustered in the springtime from 2015 to 2020. Type FS was associated with low O3 levels due to frequent precipitation. The frequency of O3-polluted days was highest in Type FS (18.6%) and the O3 concentration was also the highest (175 μg m−3), followed by Type BB (10.5%, 174.0 μg m−3), Type GS (9.9%, 174.2 μg m−3), and Type GN (6.3%, 167.0 μg m−3).
- The meteorological mechanisms of O3 pollution under the four SWPs were different. Type FS was associated with weak wind (1.7 m s−1), high RH (69.9%), frequent temperature inversion (100%), weak solar radiation (13.2 MJ m−2), and short sunshine hours (5.4 h). The stable weather along with the convergence of southwest wind and southeast wind near the surface was favorable for pollutants to accumulate in the region. Type GN was associated with strong solar radiation (24.9 MJ m−2), long sunshine hours (10.3 h), and dry air, which promoted the photochemical formation of O3. In addition, the high wind speed was conducive to the regional transport of O3. The strong photochemical reaction was the main reason for the O3 pollution in Type GS and Type BB due to the high temperature (26.3 °C and 41.4 °C, respectively), strong solar radiation (22.4 MJ m−2 and 24.7 MJ m−2, respectively), and long sunshine hours (8.6 h and 9.9 h, respectively).
- The vertical dynamic structure under four SWPs was analyzed. There was zero vertical velocity at the lower level in all four SWPs [45]. There was an ascending motion along with convergence under the height and a sinking motion along with divergence above the height. The vertical structure of divergence at the lower level and convergence at the higher level could lead to the downward transmission of O3 from the stratosphere [46]. The order of the O3 valley values in the four SWPs was consistent with that of downdraft velocity, indicating that a deep sinking motion was the crucial driver for O3 accumulation at night [41].
- Based on the stepwise MLR model, we quantified the meteorological contributions of O3 variations under different SWPs and the developed model captured 60.8% to 80.8% of O3 variations, which were much higher than in other regions [41,42,48]. This indicated the important roles of meteorological conditions in the study area and the difficulties for local governments to reduce O3 pollution.
This study explored the influence of meteorological conditions on ozone concentrations using weather classification and the MLR model. Results revealed that ozone excess days in PT were often accompanied by low relative humidity, high temperature, strong solar radiation, less total cloud cover, specific wind conditions, and vertical dynamic structures. This is consistent with what has been found in previous research [17,18,21,28,30,41]. Gong et al. [17,18] indicated that synoptic circulation and key weather elements play a critical role in ozone pollution. In contrast, Li et al. [19] found that meteorological conditions are not the major driver of the increase in late winter in the North China Plain. Due to the non-linear relationship between meteorological conditions and ozone formation, the interaction between meteorological factors and ozone precursors should be investigated in future research.
Author Contributions
Conceptualization, S.R. and H.W.; data curation, S.R. and X.Z.; formal analysis, S.R. and X.J.; funding acquisition, S.R. and H.W.; investigation, S.R. and H.W.; methodology, S.R. and H.W.; resources, M.H. and H.L.; software, S.R. and X.Z.; supervision, S.R. and H.W.; validation, X.Z.; writing—original draft, X.J.; writing—review and editing, S.R. and X.J. All authors have read and agreed to the published version of the manuscript.
Funding
This study was supported by the Natural Science Foundation of Fujian Province (2021J01453; 2021J01463) and the Environmental Protection Technology Project of the Fujian Province Environmental Protection Technology Project (2021R002).
Institutional Review Board Statement
Not applicable.
Informed Consent Statement
Not applicable.
Data Availability Statement
The ERA-5 data can be found here: https://cds.climate.copernicus.eu/#!/search?text=ERA5&type=dataset (accessed on 8 October 2022).
Acknowledgments
The authors acknowledge the free use of the data of ozone concentrations provided by the Fujian Provincial Department of Ecology and Environment and the meteorological data provided by the Putian Meteorological Bureau. We also appreciate the anonymous reviewers for their constructive comments and thoughtful suggestions.
Conflicts of Interest
The authors declare no conflict of interest.
References
- Li, H.; Peng, L.; Bi, F.; Li, L.; Bao, J.; Li, J.; Zhang, H.; Chai, F. Strategy of coordinated control of PM2.5 and Ozone in China. Res. Environ. Sci. 2019, 32, 1763–1778. [Google Scholar]
- Wang, Y.; Luo, H.; Jia, L.; Ge, S. Effect of particle water on ozone and secondary organic aerosol formation from benzene-NO2-NaCl irradiations. Atmos. Environ. 2016, 140, 386–394. [Google Scholar] [CrossRef]
- Moghani, M.; Archer, C.L.; Mirzakhalili, A. The importance of transport to ozone pollution in the USA Mid-Atlantic. Atmos. Environ. 2018, 191, 420–431. [Google Scholar] [CrossRef]
- Pan, X.; Kanaya, Y.; Tanimoto, H.; Inomata, S.; Wang, Z.; Kudo, S.; Uno, I. Examining the major contributors of ozone pollution in a rural area of the Yangtze River Delta region during harvest season. Atmos. Chem. Phys. 2017, 15, 6101–6111. [Google Scholar] [CrossRef]
- Health Effects Institute. State of Global Air, 2020. In Global Burden of Disease Study, 2019; IHME: Washington, DC, USA, 2020; pp. 1–28. [Google Scholar]
- Fishman, J.; Creilson, J.K.; Parker, P.A.; Ainsworth, E.A.; Vining, G.G.; Szarka, J.; Xu, X. An investigation of widespread ozone damage to the soybean crop in the upper Midwest determined from ground-based and satellite measurements. Atmos. Environ. 2010, 44, 2248–2256. [Google Scholar] [CrossRef]
- Geng, C.; Wang, Z.; Ren, L.; Wang, Y.; Wang, Q.; Yang, W.; Bai, Z. Study on the impact of elevated atmospheric ozone on crop yield. Res. Environ. Sci. 2014, 27, 239–245. [Google Scholar]
- Guohao, L.; Wei, W.; Feng, W.; Shuiyuan, C.; Wei, W.; Gang, W. Diurnal variations of ozone and its precursors and ozone formation potential of VOCs at the boundary of a coking plant during summer and autumn. Chin. J. Environ. Eng. 2014, 8, 1130–1138. [Google Scholar]
- Zapletal, M.; Juran, S.; Krpes, V.; Michna, K.; Cudlin, P.; Edwards, M. Effect of Ozone Flux on Selected Structural andAntioxidant Characteristics of a Mountain Norway Sprude Forest. Balt. Foresrry 2018, 24, 261–267. [Google Scholar]
- Juráň, S.; Grace, J.; Urban, O. Temporal Changes in Ozone Concentrations and Their Impact on Vegetation. Atmosphere 2021, 12, 82. [Google Scholar] [CrossRef]
- Pachauri, R.K.; Reisinger, A. Climate Change 2007:Synthesis Report, Contribution of Working Groups I, II and III to the Fourth Assessment Report of the Intergovernmental Panel on Climate Change. IPCC 2007, 4, 339–343. [Google Scholar]
- China’s Air Quality Improved Significantly (13th Five-Year Period China Impression (11)) [EB/OL]. People’s Daily Online-People’s Daily Overseas Edition, Beijing. Available online: http://sn.people.com.cn/n2/2020/1119/c378287-34424038.html (accessed on 19 August 2022).
- Wang, H.; Zheng, Q.; Wen, Z.; Huang, Y. Influence of ENSO cycle on change of ozone concentration near surface in Fujian province. J. Trop. Meteorol. 2021, 37, 145–153. [Google Scholar]
- Wu, L.; Xue, L.; Wang, W. Review on the observation-based methods for ozone air pollution research. J. Earth Environ. 2017, 8, 479–491. [Google Scholar]
- Liang, Y.; Liu, Y.; Wang, H. Regional characteristics of ground-level ozone in Shanghai based on PCA analysis. Acta Sci. Circumstantiae 2018, 38, 3807–3815. [Google Scholar]
- Wang, T.; Xue, L.; Brimblecombe, P.; Lam, Y.F.; Li, L.; Zhang, L. Ozone pollution in China: A review of concentrations, meteorological influences, chemical precursors, and effects. Sci. Total Environ. 2017, 575, 1582–1596. [Google Scholar] [CrossRef] [PubMed]
- Gong, S.; Zhang, L.; Liu, C.; Lu, S.; Pan, W.; Zhang, Y. Multi-scale analysis of the impacts of meteorology and emissions on PM2.5 and O3 trends at various regions in China from 2013 to 2020 2. Key weather elements and emissions. Sci. Total Environ. 2022, 824, 153847. [Google Scholar] [CrossRef]
- Gong, S.; Liu, Y.; He, J.; Zhang, L.; Lu, S.; Zhang, X. Multi-scale analysis of the impacts of meteorology and emissions on PM2.5 and O3 trends at various regions in China from 2013 to 2020 1: Synoptic circulation patterns and pollution. Sci. Total Environ. 2022, 815, 152770. [Google Scholar] [CrossRef]
- Li, K.; Jacob, D.J.; Liao, H.; Qiu, Y.; Shen, L.; Zhai, S.; Kuk, S.K. Ozone pollution in the North China Plain spreading into the late-winter haze season. Proc. Natl. Acad. Sci. USA 2021, 118, e2015797118. [Google Scholar] [CrossRef]
- Yan, X.; Gou, X.; Yang, J.; Zhao, W.; Xu, Q.; Liu, Y. The variety of ozone and its relationship with meteorological conditions in typical cities in China. Plateau Meteorol. 2020, 39, 416–430. [Google Scholar]
- Yi, R.; Wang, Y.; Zhang, Y.; Zhang, Y.; Shi, Y.; Li, M. Pollution characteristics and influence factors of ozone in Yangtze River Delta. Acta Sci. Circumstantiae 2015, 35, 2370–2377. [Google Scholar]
- Yang, Y.; Hao, J.; Yang, L.; Wang, S.; Zhang, J. Analysis of meteorological conditions of a continuous ozone pollution process in Xingtai of Hebei Province. J. Arid. Meteorol. 2020, 38, 448–456. [Google Scholar]
- Kalabokas, P.; Hjorth, J.; Foret, G.; Dufour, G.; Eremenko, M.; Siour, G.; Beekmann, M. An investigation on the origin of regional springtime ozone episodes in the western Mediterranean. Atmos. Chem. Phys. 2017, 17, 3905–3928. [Google Scholar] [CrossRef]
- Deng, T.; Wang, T.; Wang, S.; Zou, Y.; Yin, C.; Li, F.; Wu, D. Impact of typhoon periphery on high ozone and high aerosol pollution in the Pearl River Delta region. Sci. Total Environ. 2019, 668, 617–630. [Google Scholar] [CrossRef] [PubMed]
- Liu, J.; Wu, D.; Fan, S.; Liao, Z.; Deng, T. Impacts of precursors and meteorological factors on ozone pollution in Pearl River Delta. China Environ. Sci. 2017, 37, 813–820. [Google Scholar]
- Cheng, L.J.; Wang, S.; Gong, Z.Y.; Yang, Q.; Wang, Y.Q. Pollution trends of ozone and its characteristics of temporal and spatial distribution in Beijing-Tianjin-Hebei region. Environ. Monit. China 2017, 33, 14–21. [Google Scholar]
- Hu, Z.; Zhou, G.; Ge, Z.; Wang, J. Ozone pollution assessment and a continuous pollution process analysis in Bengbu. Acta Sci. Circumstantiae 2021, 37, 145–153. [Google Scholar]
- Yang, J.; Zhao, X.; Tao, Y.; Cheng, X.; Xiao, D.; Zhang, C.; Geng, W. Characteristics of ozone weather in Chengdu during summer of 2016–2019. Res. Environ. Sci. 2021, 34, 254–262. [Google Scholar]
- Wang, H.; Lyu, X.; Guo, H.; Wang, Y.; Zou, S.; Ling, Z.; Shen, J. Ozone pollution around a coastal region of South China Sea: Interaction between marine and continental air. Atmos. Chem. Phys. 2018, 18, 4277–4295. [Google Scholar] [CrossRef]
- Zhao, W.; Gao, B.; Liu, M.; Lu, Q.; Ma, S.; Sun, J.; Chen, L.; Fan, S. Impact of meteorological factors on the ozone pollution in Hong Kong. Environ. Sci. 2019, 40, 55–66. [Google Scholar]
- Liu, S.; Cheng, Y.; Li, B.W.; Wang, Y.L.; Xiao, B.; Yan, L.; Liu, S.T. Characteristics of temporal and spatial variations of ozone and it’s influencing factor over Xi’an during 2013–2016. J. Earth Environ. 2017, 8, 541–551. [Google Scholar]
- Liao, Z.; Gao, M.; Sun, J.; Fan, S. The impact of synoptic circulation on air quality and pollution -related human health in the Yangtze River Delta region. Sci. Total Environ. 2017, 607–608, 838–846. [Google Scholar] [CrossRef]
- Liang, Z.; Gu, T.; Yang, X.; Zhong, H.; Qi, B. Study on circulation classification based surface ozone concentration predictionmodel. China Environ. Sci. 2017, 37, 4469–4479. [Google Scholar]
- Otero, N.; Sillmann, J.; Schnell, J.L.; Rust, H.W.; Butler, T. Synoptic and meteorological drivers of extreme ozone concentrations over Europe. Environ. Res. Lett. 2016, 11, 024005. [Google Scholar] [CrossRef]
- Wang, H.; Zheng, Q.; Hong, Z.; Huang, Y. Analysis of a springtime high surface ozone event over Fujian coastal areas. Res. Environ. Sci. 2020, 33, 36–43. [Google Scholar]
- Zhu, J.; Chen, L.; Liao, H.; Dang, R. Correlations between PM2.5 and ozone over China and associated underlying reasons. Atmosphere 2019, 10, 352. [Google Scholar] [CrossRef]
- Wang, Z.B.; Li, J.X.; Liang, L.W. Spatio-temporal evolution of ozone pollution and its influencing factors in the Beijing-Tianjin-Hebei Urban Agglomeration. Environ. Pollut. 2019, 256, 113419. [Google Scholar] [CrossRef]
- Huang, X.G.; Shao, T.J.; Zhao, J.B. Spatio-temporal differentiation of ozone concentration and its driving factors in Yangtze River Delta urban agglomeration. Resour. Environ. Yangtze Basin 2019, 28, 1434–1445. [Google Scholar]
- Huth, R.; Beck, C.; Philipp, A.; Demuzere, M.; Ustrnul, Z.; Cahynová, M.; Kyselý, J.; Tveito, O.E. Classifications of atmospheric circulation patterns: Recent advances and applications. Ann. N. Y. Acad. Sci. 2008, 1146, 105–152. [Google Scholar] [CrossRef] [PubMed]
- Renhe, Z.; Li, Q.; Zhang, R. Meteorological conditions for the persistent severe fog and haze event over eastern China in January 2013. Sci. China Earth Sci. 2014, 44, 27–36. [Google Scholar] [CrossRef]
- Mao, J.; Wang, L.; Lu, C.; Liu, J.; Li, M.; Tang, G.; Ji, D.; Zhang, N.; Wang, Y. Meteorological mechanism for a large-scale persistent severe ozone pollution event over eastern China in 2017. J. Environ. Sci. 2020, 92, 187–199. [Google Scholar] [CrossRef] [PubMed]
- Liu, J.; Wang, L.; Li, M.; Liao, Z.; Sun, Y.; Song, T.; Gao, W.; Wang, Y.; Li, Y.; Ji, D.; et al. Quantifying the impact of synoptic circulation patterns on ozone variability in northern China from April to October 2013–2017. Atmos. Chem. Phys. 2019, 19, 14477–14492. [Google Scholar] [CrossRef]
- Pu, Y.; Wu, S.; Ye, L.; Gao, L.; Wang, W. Variation characteristics and meteorological factors of ozone concentration in the urban area of Jiangmen. J. Trop. Meteorol. 2020, 36, 650–659. [Google Scholar]
- Liao, G.; Zheng, F.; Zeng, P.; Mo, Y. Weather types of haze days in Guangxi. Meteorol. Sci. Technol. 2018, 46, 149–153. [Google Scholar]
- Wu, J.; Li, C.; Ma, Z.Q.; Sun, Z.B.; Zhu, X.W.; Dong, F. Influence of meteorological conditions on ozone pollution at Shangdianzi station based on weather classification. Environ. Sci. 2020, 11, 4864–4873. [Google Scholar]
- Zhao, K.; Bao, Y.; Huang, J.; Zhang, X.; Liu, C.; Qi, H.; Xu, W. A modeling study of the impact of stratospheric intrusion on ozone enhancement in the lower troposphere in South China. Chin. J. Atmos. Sci. 2019, 43, 75–86. [Google Scholar] [CrossRef]
- Chen, L.; Xiao, H.; Zhu, L.; Guo, X.; Wang, W.; Ma, L.; Guo, W.; He, J.; Wang, Y.; Li, M.; et al. Characteristicsof Ozone Pullution and the Impacts of Related Meteorological Factors in Shanxi Province, China. Atmosphere 2022, 13, 1729. [Google Scholar] [CrossRef]
- Zhao, W.; Fan, S.; Guo, H.; Gao, B.; Sun, J.; Chen, L. Assessing the impact of local meteorological variables on surface ozone in Hong Kong during 2000–2015 using quantile and multiple line regression models. Atmos. Environ. 2016, 144, 182–193. [Google Scholar] [CrossRef]
Publisher’s Note: MDPI stays neutral with regard to jurisdictional claims in published maps and institutional affiliations. |
© 2022 by the authors. Licensee MDPI, Basel, Switzerland. This article is an open access article distributed under the terms and conditions of the Creative Commons Attribution (CC BY) license (https://creativecommons.org/licenses/by/4.0/).