Abstract
In recent years, the indoor air quality (IAQ) of educational buildings has attracted people’s attention. As a resting place, the dormitory occupies more than half of the students’ time in school. During sleep, the IAQ in dormitories is easily affected by breathing, which in turn affects the sleep quality and mental state of students. In order to study the relevant IAQ during sleep, this paper selected the dormitories of graduate students of different grades in a university in northern China, and monitored the temperature, humidity, CO2, PM2.5, HCHO and TVOC for two weeks during the changing seasons of autumn and winter. In addition, by issuing questionnaires, students made a subjective evaluation of the IAQ. According to the results of objective monitoring data and subjective evaluation, the IAQ changes in student dormitories of different grades, genders, and locations are statistically analyzed, and the correlation between environmental parameters is discussed. The research results show that temperature and humidity basically meet the national standards; indoor PM2.5 is positively correlated with outdoor PM2.5; and HCHO and TVOC are positively correlated with indoor temperature and humidity. Most dormitories lack natural ventilation, and the concentration of CO2 during sleep is too high, which affects the quality of sleep and mental state.
1. Introduction
People usually spend more than 90% of their time in the indoor environment [1,2]. The indoor environment has become the main exposure environment for people, and the sleep time in the bedroom accounts for half of the indoor life. Many important physiological regulations, such as neural activity and metabolism, occur in the process of sleep [3]. Therefore, the IAQ during sleep affects people’s growth and health. A good sleep environment has become an important guarantee for people’s life, study and work [4,5]. With the development of modern industry and city, the pace of people’s life has been accelerated, and the comfort and health of life has attracted more and more attention of the public. It’s easy to find that social development provides people with convenient and efficient services, while at the same time, environmental problems are subtly affected [6]. It’s urgent to pay attention to IAQ and environmental pollution.
A large number of previous studies have shown that poor indoor environment can easily lead to building syndrome, such as sensory stimulation, headache, allergic reaction, memory loss, fatigue and so on, which has become a global challenge [7]. In general, the following factors are considered to be the cause of the discomfort. First of all, chemical pollution from the outside, such as vehicle engine emissions, is part of the reason [8,9,10]. And haze, as one of the products of traffic pollution, also affects IAQ. The economic and social activities of high density population will inevitably emit a large number of inhalable fine particles (PM2.5), and the continuous accumulation of PM2.5 in the air will produce a certain range of haze. During the cold season, Nuno et al. [11] sampled the bedrooms of 10 apartments (including only one couple) in a typical Portuguese residence for three months, and confirmed that during sleep, the average PM2.5 (15.3 ± 9.1 μg/m3) in 7 apartments exceeded the WHO criterion of 10 μg/m3. According to the “Environmental performance index 2018” jointly released by Yale University, Columbia University and the world Economic Forum, China ranks fourth from the bottom in the environmental quality assessment involving PM2.5 [12]. In addition, PM2.5 may carry bacteria, fungi and DNA viruses, increasing the impact of pollution [13]. Therefore, the presence of PM2.5 may promote the spread of influenza in winter. In early March 2020, the World Health Organization (WHO) announced that COVID-19 was a global pandemic. Based on the public data of the environmental pollution Agency (EPA), Muhammad et al. [14] found that environmental pollutants (such as PM2.5, etc.) were significantly correlated with the prevalence of COVID-19 in California. And the appearance of COVID-19 affects people’s behavior, leading to poor ventilation [15].
On the other hand, indoor chemical pollutants are also important causes of sick building syndrome (SBS) [7]. The common pollutants include HCHO and TVOC. In [16,17], it was found that HCHO and TVOC are highly toxic substances and carcinogens that can cause respiratory diseases. Through long-term monitoring of six households in Northeast China, Huang et al. [18] found that the daily average concentration of HCHO was higher in winter, which was more significant under airtight conditions, and higher indoor temperature would increase HCHO, while reasonable natural ventilation would help to weak or even eliminate the impact of temperature on HCHO. Huang et al. [19] reviewed the indoor HCHO concentration of 39 cities in China (the sum of the investigated cities in the South and the North), and found that the median formaldehyde concentration of newly decorated houses was 125 μg/m3, higher than 100 μg/m3 of WHO guidelines, and the higher formaldehyde concentration in winter in the north can be attributed to the space heating policy to a large extent. Pei et al. [20] monitored the long-term gas pollutant concentration changes in 14 student dormitories equipped with new beds, desks, and closets in the summer and autumn transition seasons, analyzed the influence of furniture density and room location on TVOC emission rate, and verified that the new furniture produced higher TVOC, and the pollutant concentration decreased significantly after 3 months of natural ventilation. In addition, indoor temperature and humidity have a related impact on HCHO and TVOC emissions of building materials, which has been confirmed in [21,22]. Therefore, there is a certain correlation between temperature and humidity and SBS [23]. Moreover, the problem of insufficient fresh air in buildings still exists [24]. CO2 produced by passengers during sleep has become one of the important pollutants in the indoor exposure environment. Canha et al. [25] evaluated the IAQ of a 20 m2 bedroom with only one person by setting different ventilation scenarios during sleep. The data showed that the content of CO2 is significantly higher than the indoor air guidance value. Strom-tejsen et al. [26] studied the effects of bedroom IAQ on sleep and the second day performance in an intervention experiment in single student dormitory through online survey report. The results showed that after improving the IAQ of the bedroom, the sleep quality, the concentration the next day and the logical thinking test of the subjects were greatly improved. Laverge et al. [27] and Lei et al. [28] measured the whole process of CO2 concentration, air temperature and relative humidity in a number of student dormitories, and provided a questionnaire survey of thermal comfort and mental state. The combination of subjective and objective research strategies has made a great contribution to educational architecture, but the setting of switching windows in the experiment is a human intervention factor. Students may know in advance, thus resulting in errors in filling in the questionnaire.
Through the above analysis of the literature, we can see that most of the literature is keen on the research of the family bedroom in the residence, and pay less attention to the education building, especially the research of the IAQ in the student dormitory with many people living in. As a special group, college students spend most of their lives in dormitories except for class time. As one of the close contact environments of college students, because the overall area of each dormitory is generally small, and the number of residents is generally 4–6, the room area varies from 15 m2 to 30 m2, and less area per capita is easy to cause air pollution. Especially during sleep, the concentration of CO2 produced by people’s breathing will reach a high value quickly, and the heat and ventilation behavior produced by people affect the indoor thermal comfort. The change of temperature and humidity may have a potential impact on other pollutants. In school buildings, IAQ directly affects students’ learning abilities [29]. Since there is no activity in the middle of a deep sleep, the behavior before going to bed determines the IAQ of the whole night. And the winter is cold, students tend to close the doors and windows in warm rooms to sleep, making the dormitory lack natural ventilation, so the degree of air pollution and thermal comfort in the dormitory is worthy of attention, which can affect students’ learning state the next day. In northern China, the climate is cold and dry in winter. Despite the rapid development of clean energy and other renewable energy with environmental benefits, such as sewage source heat pumps, coal-fired heating is still the main supply for schools. This kind of necessary heating mode becomes the source of outdoor air pollution, which leads to the pollutants exceeding the standard seriously, thus affecting the IAQ through the way of penetration and the behavior of passengers opening windows.
This study was carried out before and after central heating in a university in northern China in the cold winter of 2020. Four graduate dormitories of different grades were selected for 2-week monitoring. The purpose was to obtain the IAQ changes of students during sleep without intervention. Through the combination of field experimental measurement and questionnaire survey, this study was guided. The main parameters monitored were indoor temperature, humidity, CO2, PM2.5, HCHO and TVOC. Referring to ASHRAE’s PMV standard of −3 to +3, a questionnaire was designed to determine the thermal comfort and the relationship between IAQ and passengers’ subjective feelings. The contributions of this paper are as follows:
- The changes of IAQ and subjective evaluation of different grades and genders of graduate students’ dormitories during sleep are studied, and the renovation of the houses is considered.
- Combined with the change of the outdoor environment, the correlation between environmental parameters is analyzed.
- The sleep duration and study time of graduate students are discussed, which is used to analyze their living habits and learning status, so as to reflect their academic pressure.
The structure of the paper is as follows. In Section 2, the selected case studies are defined, including their characterization and data collection procedures, and then the monitoring activities are described. The results are provided and evaluated in Section 3, and the data are organized according to the two periods before and after heating. The related discussion is also given in this section. Finally, the conclusion is drawn in Section 4.
2. Materials and Methods
2.1. Case Features
The experimental site is located in Dalian, a coastal city in northern China (latitude: 39°01′ N, longitude: 121°44′ E). The region has a typical temperate monsoon climate, and the winter (November to March) is cold and dry. The residential quarters are centrally heated, which usually uses coal as the main energy source. As shown in Figure 1, cases N1–N4 are the monitored dormitories, which are all graduate dormitories distributed in different locations of Dalian University of technology. Among them, N1 and N2 are located outside the school and close to the traffic road; N3 and N4 are located inside the school and there is no crowded traffic flow nearby. What they have in common is that there are no chemical plants and thermal power plants around them to avoid the interference of other environmental factors.

Figure 1.
Geographical location of the experiment.
Figure 2 shows the internal layout of the graduate dormitory, which is divided into two types: three-bedroom residence and four-bedroom residence. The total area of the two types is roughly the same, ranging from 21 to 23 m2. This kind of design mode is a typical student apartment for multiple-person in China. The dormitory for four people can be divided into three areas, as shown in the mark A/B/C in Figure 2b, where A is the bedroom; B is the washroom; C is the toilet, and the areas are connected by wooden doors. The washroom in the dormitory where three people live is directly connected to the toilet, as shown in Figure 2a. Although there are differences in the internal structure, the size of the bedroom is basically the same. The exact location of the measuring equipment is indicated by an isolated red dot with a fixed height of 1.20 m in the middle of the bedroom, away from the windows and radiator. Since these dormitories are not equipped with a mechanical ventilation system, fresh air can only be obtained through infiltration and window opening. As the only heating system of a dormitory, a steel aluminum composite radiator is usually installed under the push-pull glass window to reduce the influence on occupant baking due to the narrow area of the dormitory and the distance from the bed. To a certain extent, it is conducive to air convection and heating the cold air from the window. Since the hot water in the radiator is uniformly delivered by the school, it can be considered that the radiator in each dormitory provides the same amount of heating to the room.
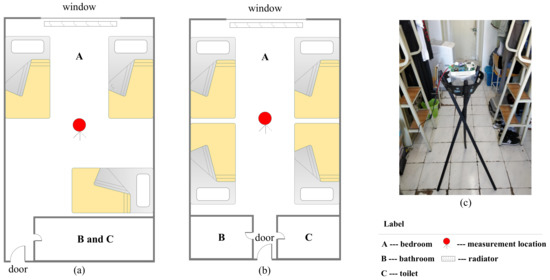
Figure 2.
Plane structure of c graduate dormitory: (a) three-bedroom; (b) four-bedroom; (c) site situation.
Table 1 details the characteristics of the dormitories and occupants of the case study. As for the residents, they are first-year and second-year graduate students, including male and female groups, aged between 21 and 23 years old, in good health, without smoking and sleeping drugs. All the dormitories studied are not at the bottom or top of the building to avoid the influence of too humid environment. Except for the room in case N3, the other rooms are facing the sun. In addition, case N2 is a dormitory renovated from June to August 2020. The main decoration methods are latex paint walls, new tiles and new furniture. After about one month of ventilation and drying, the residents begin to move in September. In other cases, there was no renovation or decoration in the past two years, and the crew continued to live.

Table 1.
Characteristics of residences and occupants for each case study.
2.2. Monitoring Experiment
The field monitoring experiment was carried out in two separate stages. During the transition season between autumn and winter, a continuous monitoring experiment was carried out for 7 days, and both working days and weekends were taken into consideration. One is in November 2020 without heating (before heating), and the other is in December 2020 with central heating (after heating), so as to compare the changes of indoor air quality and thermal comfort before and after heating. This paper focuses on the changes of air quality in dormitory during sleep, that is, the period from 20:00 p.m. to 08:00 a.m. the next morning. In addition, in order to study the influence of indoor air quality on students’ sleep duration and study time, the experimental equipment was operated 24 h a day in two 7-day periods.
The experiment has obtained the permission of the residents in advance. Each dormitory is equipped with an environmental monitoring equipment for measurement, and the function of the equipment is informed, and they are willing to cooperate with the debugging. They are also required to live a normal life in the dormitory. Because they don’t understand the purpose and stage of the experiment, this study can be regarded as the changes of graduate students’ living conditions and indoor air quality in the actual scene without intervention.
In this test, the equipment integrating various environmental sensors is used for field measurement. The prototype is developed based on the equipment described in [30]. The environmental monitoring equipment is shown in Figure 3. The stability of its long-term monitoring has been verified by previous experiments. We investigated the concentration changes of temperature, humidity, CO2, PM2.5, HCHO and TVOC in these dormitories. All the measured data were automatically collected and uploaded to the database every minute, and the data were exported through the developed supporting cloud platform software. The outdoor temperature, humidity and PM2.5 concentration during the measurement period were also recorded for comparison and correlation analysis. The outdoor data came from a nearby government environmental monitoring station. Table 2 shows the properties of the sensor corresponding to the above environmental parameters. In addition to the environmental parameters that need to be concerned, light sensors are also added to reflect the sleep duration and study time of each dormitory. At the same time, the results of the questionnaire survey are also used as a supplement to this research.
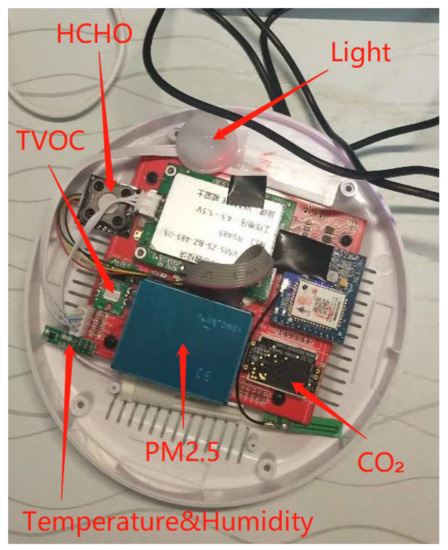
Figure 3.
Environmental monitoring equipment.

Table 2.
Properties of environmental sensors.
2.3. Questionnaire Survey
To improve buildings and their characteristics, the feedback provided directly by users is generally fundamental in order to be able to adapt the technical and structural functions to the well-being of users [31]. To assess subjective perception, participants in all case studies answered a short questionnaire at 11.00 a.m. each day. The questionnaire is filled in online, which is distributed and collected on the same day, and can only be answered once a time. Since the subjects are all highly educated students, it can be considered that they are rational in answering the questionnaire. The content involves the ventilation frequency and lifestyle during the measurement. There are three key items in the questionnaire, namely subjective feeling of IAQ, thermal comfort level and mental state after sleep. The IAQ was divided into four grades: excellent, good, general and poor, and the scoring range was provided for the participants to make a reasonable evaluation. According to ASHRAE’s PMV standard of −3 to +3 and the human thermal comfort model proposed by Fanger [32], the thermal comfort is divided into seven levels. The mental state in the questionnaire is divided into four levels, including sober, good, general and sleepy. The classification standards correspond to 90%, 70%, 50% and less than 50% of their energy respectively, which are used to investigate the mental state of the participants in the new morning after a night’s sleep, so as to verify the impact of IAQ during sleep on people.
Finally, these questions also include information such as wake-up time and off-duty time. This information is helpful to confirm that the participants studied in the classroom and laboratory almost all the daytime during the two weeks of the measurement. This is in accord with the habit explained above, that is, graduate students of different grades have different tasks, different pressure, and different sleep duration and study time. The detailed survey indicators in the questionnaire are shown in Table 3. Through two stages of the questionnaire survey, on the one hand, the consistency between objective measurement and subjective views is checked; on the other hand, the change of IAQ before and after heating and its relationship with students’ mental state are focused on.

Table 3.
Indicators of the questionnaire survey.
2.4. Statistical Analysis
In order to protect human health, prevent and control indoor air pollution, the State Environmental Protection Administration of China issued “Indoor air quality standard (GB/T18883-2020)”, and pointed out that this standard is applicable to residential and office buildings. Based on this standard, this paper studies and analyzes the IAQ in the dormitory, and the main indicators related to this paper are shown in Table 4.

Table 4.
IAQ standards in winter in China.
Excel was used to make statistics on the measured data and questionnaire data. OriginPro (OriginLab Corporation) was used to draw the results. The changes of environmental parameters during sleep and the subjective feelings of passengers were comprehensively analyzed by line chart and box chart. At the same time, Pearson correlation analysis was used to study the significant differences between the parameters, p < 0.05, with statistical significance.
3. Results and Analysis
3.1. Field Experiment Results and Analysis
3.1.1. Temperature
The trend of indoor temperature during sleep in the four dormitories before and after heating is shown in Figure 4. Considering the temperature reference standard shown in Table 4, that is, the indoor thermal comfort range in a winter environment. Therefore, before heating only the two dormitories N2 and N4 were within this temperature range. The temperature in the dormitory of N1 and N3 fluctuated around 16 °C, which is because the windows of them were not completely closed during sleep, and the fluctuation range of N1 was large, which indicates that they prefer to open windows for ventilation. Although the average outdoor temperature during the measurement period was 13.1 ± 1.7 °C, the temperature of all dormitories during the occupancy period was higher than this value, indicating that before heating, the heat generated by people in the narrow space can make the dormitories warm up, and the heating effect is better when the windows are closed than when the windows are opened. Furthermore, the indoor temperature was significantly improved after heating, and the temperature of almost all dormitories was within the thermal comfort range during sleep.
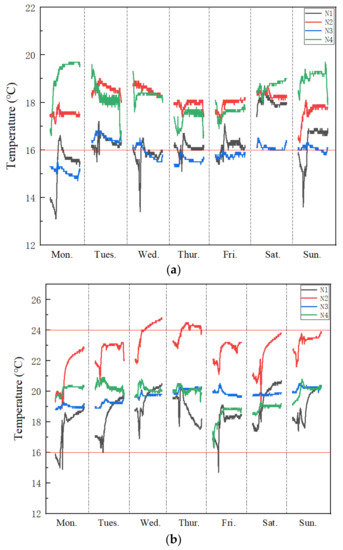
Figure 4.
Temperature measurement results. (a) Before heating, (b) After heating.
Figure 5 shows the temperature values recorded during sleep in four dormitories. The average value before heating was 17.1 ± 1.3 °C, ranging from 15.9 ± 0.4 °C (dormitory N3) to 18.4 ± 0.8 °C (dormitory N4). The average value after heating was 20.3 ± 1.8 °C, ranging from 22.9 ± 1.2 °C (dormitory N2) to 18.7 ± 1.2 °C (dormitory N1). N2 has the best heating effect, on the one hand due to their lower frequency of opening windows, and on the other hand because of the newly equipped dormitory furniture, including new radiators. Although the temperature in the N1 has increased, it is still the lowest among all dorms. This is related to their habit of opening windows for ventilation.
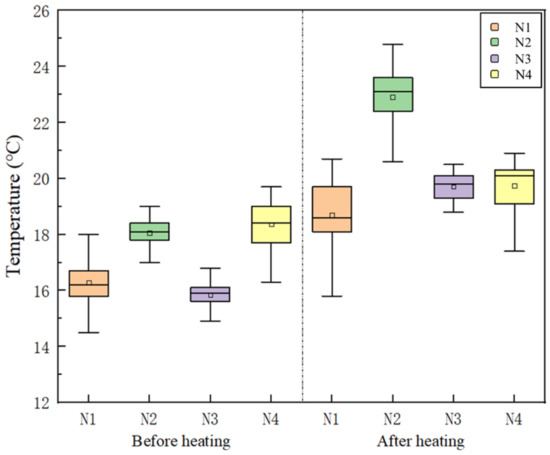
Figure 5.
Box diagram of temperature.
3.1.2. Humidity
The change trend of indoor humidity during sleep in four dormitories before and after heating is shown in Figure 6. It can be seen from the whole that the indoor humidity of N1, N2, and N4 is within the standard range in most cases, no matter before or after heating, while N3 is beyond the standard, showing a relatively humid environment. This is because the orientation of N1, N2, and N4 is the sunny side, which can obtain direct sunlight in the daytime. Better daylighting is conducive to eliminating the influence of water vapor in the washroom. N3 is the shady side, which is more humid due to the influence of light shielding. In addition, the central heating reduces the indoor humidity to a certain extent, and from the comparison of the red curve before heating and after heating, it can be seen that the indoor humidity of N2 is significantly reduced due to the better heating performance provided by new radiator.
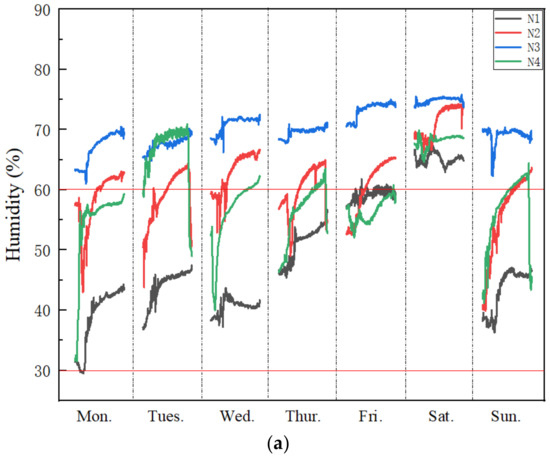
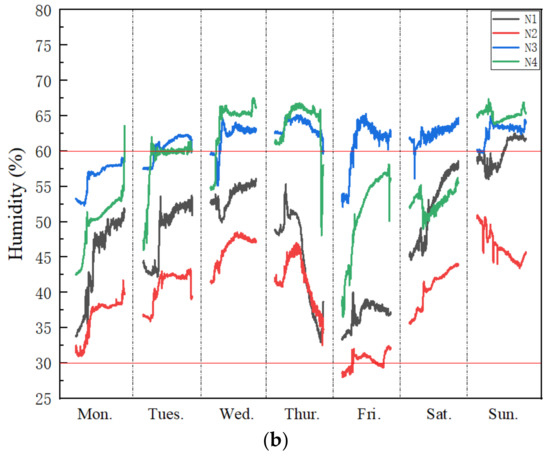
Figure 6.
Humidity measurement results. (a) Before heating, (b) After heating.
Figure 7 shows the humidity values recorded during sleep in four dormitories. The average value before heating is 59.9 ± 10.3%, ranging from 48.9 ± 9.6% (dormitory N1) to 70.4 ± 3.0% (dormitory N3). The winter weather in northern China is relatively dry, and the average outdoor humidity is 40.7 ± 3.8% during the measurement period. Due to frequent ventilation, the indoor humidity of N1 is close to outdoor. The humid environment is good for the growth of bacteria, so students who live in N3 for a long time may suffer from cold and rheumatoid arthritis in winter. According to the experience of humidity change in N1, ventilation can balance humidity to a certain extent. Therefore, it is suggested that students living in the shady side should open more windows for ventilation and strengthen exercise. The average value after heating is 52.0 ± 10.3%, ranging from 40.3 ± 5.7% (dormitory N2) to 61.3 ± 2.9% (dormitory N3), which is lower than that before heating.
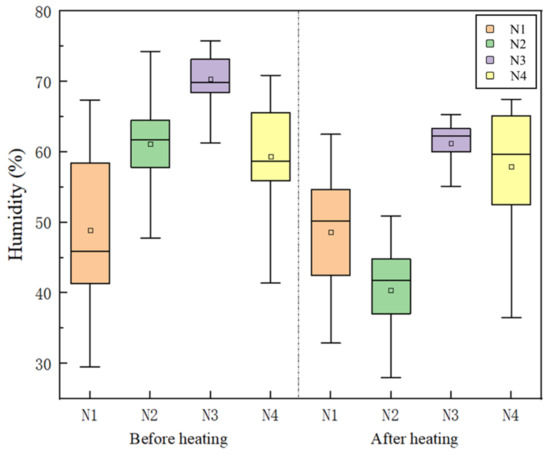
Figure 7.
Box diagram of humidity.
3.1.3. CO2
The change trend of indoor CO2 in four dormitories before and after heating is shown in Figure 8. It can be seen from the two figures that in most cases, the indoor CO2 concentration will exceed the standard limit of 1000 ppm in a short time during sleep, and the indoor CO2 concentration will gradually increase with the progress of sleep. The slope of red and green curves is larger, which indicates that the CO2 concentration has a very fast rising speed without windows opened, while the slope of blue and black curves is smaller and the corresponding coordinate axis value is lower, which indicates that the rising speed of CO2 is slower with windows opened, and the degree of CO2 accumulation is lower than former with time. Furthermore, the change of CO2 concentration is related to the gap size of the opening window. When the window opening degree is large, the CO2 concentration can be kept below 1000 ppm, as shown in the black curve in the figure. This is similar to the research results of the literature [28]. The researchers measured the CO2 concentration in the bedroom during sleep by controlling the opening degree of the window. The quantitative results showed that when the opening area of the window is 0.055 m2, the indoor CO2 concentration will get the maximum improvement without affecting the thermal comfort. At the end of the curve in Figure 8a,b, corresponding to around 8:00 in the morning, the CO2 concentration dropped sharply, which indicates that the occupants in the dormitory are active or open the window at this time. This mutation can be used as one of the supporting materials to judge their wake-up time. In addition, the CO2 concentration at the beginning of the curve is lower than the limit value, which indicates that ventilation before sleep has been carried out for a period of time, and ventilation before sleep can help to alleviate the accumulation of CO2 during sleep.
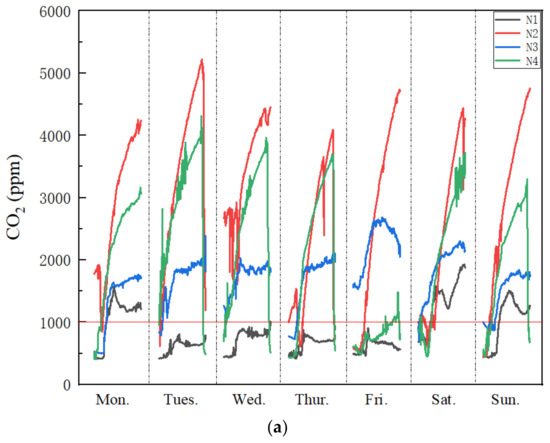
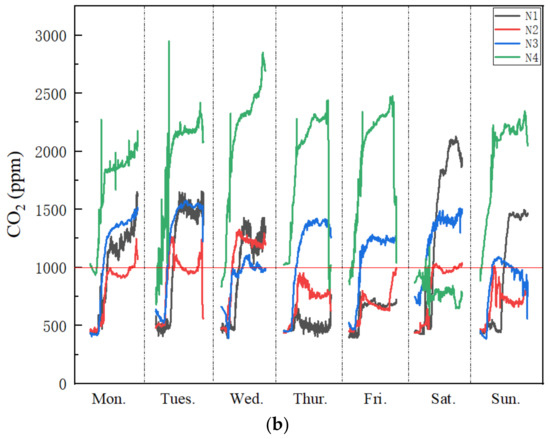
Figure 8.
CO2 measurement results. (a) Before heating, (b) After heating.
Figure 9 shows the CO2 values recorded during sleep in four dormitories, with the highest value exceeding 5000 ppm, indicating that if the ventilation and permeability of doors and windows are poor, the CO2 in dormitories will seriously exceed the standard, and may affect the mental state of the next day. Literature [33] describes that when the concentration of carbon dioxide is over 5000 ppm for a long time, it will cause permanent brain injury and coma. The average value before heating is 1879 ± 1140 ppm, ranging from 857 ± 363 ppm (dormitory N1) to 2850 ± 1273 ppm (dormitory N2). Another study conducted in Chinese student dormitories reported that the nighttime CO2 concentration tended to increase and remain stable, with an average of 1750 ppm, and the IAQ satisfaction of occupants was poor [34]. The average value after heating is 1148 ± 567 ppm, ranging from 813 ± 240 ppm (dormitory N2) to 1759 ± 584 ppm (dormitory N4). The mean CO2 concentration after heating is lower than that before heating, which indicates that students are more willing to open windows for ventilation after the indoor temperature rises.
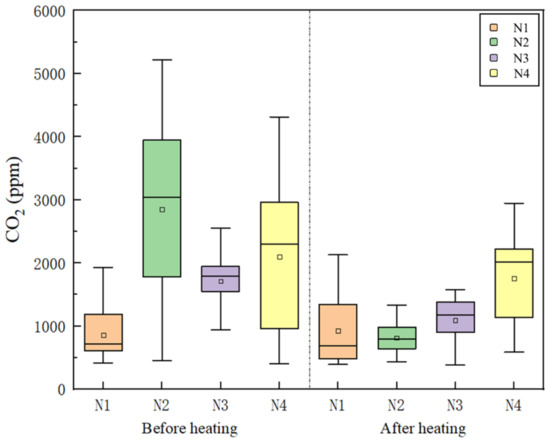
Figure 9.
Box diagram of CO2.
3.1.4. PM2.5
Figure 10 depicts the trends of indoor PM2.5 during sleep in four dormitories before and after heating. In general, PM2.5 was basically below the standard value of 75 μg/m3 in most cases. At the beginning of the sampling point, the PM2.5 concentration in the dormitory increased, which was related to the behavior of occupants who had just returned to the dormitory from the outside to open windows for ventilation, and the PM2.5 concentration did not show an upward trend with the progress of sleep time, but gradually decreased, indicating that some particles entered the human body through the respiratory system. Therefore, if the lack of consideration of outdoor PM2.5 environment, and improper ventilation makes indoor PM2.5 concentration higher, it will affect human health during sleep. It should be noted that on the Sunday after heating (as shown in Figure 10b), the PM2.5 concentration of the four dormitories was significantly higher than other times, which was related to the increase of outdoor PM2.5 concentration. During the measurement, the indoor PM2.5 concentration of the dormitory on the shade side was lower than that on the sunny side, indicating that the orientation of the room affected the concentration of indoor particulate matter. In addition, although N1 and N2 are close to the traffic road, it is not affected by vehicle exhaust pollution, and there is no significant difference in PM2.5 concentration between N1, N2 and N3, N4, which may be related to the decrease of vehicle flow at night.
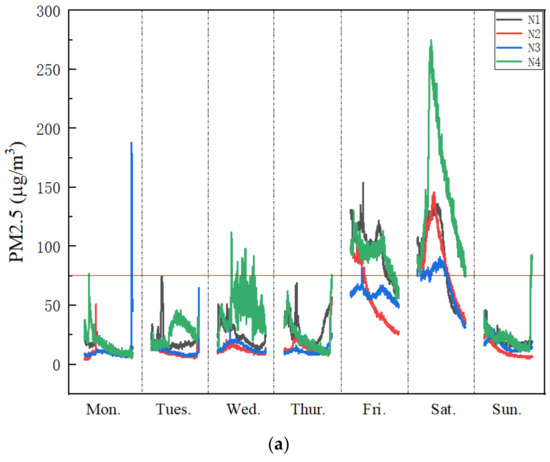
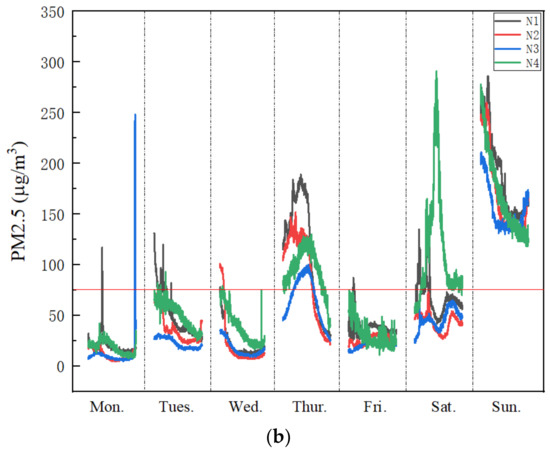
Figure 10.
PM2.5 measurement results. (a) Before heating, (b) After heating.
Figure 11 shows the PM2.5 values recorded during sleep in four dormitories. The average value before heating is 38.0 ± 39.0 μg/m3 (the average value of outdoor PM2.5 is 39.3 ± 33.6 μg/m3), ranging from 27.5 ± 25.2 μg/m3 (dormitory N3) to 54.0 ± 51.2 μg/m3 (dormitory N4). The average value after heating is 62.8 ± 58.3 μg/m3 (the average value of outdoor PM2.5 is 62.8 ± 72.6 μg/m3), ranging from 48.8 ± 49.2 μg/m3 (dormitory N3) to 74.8 ± 58.3 μg/m3 (dormitory N4). From the comparison of the average values, the indoor PM2.5 concentration is nearly increased by 65% due to the influence of school and urban central heating in winter, but it is still below the standard value, which is acceptable. Furthermore, considering that the occupants have no smokers, there is no kitchen and other facilities in the dormitory, and the permeability of the external air cannot reach 100%, but the indoor PM2.5 concentration is almost the same as that of the outdoor, which indicates that some dormitories are dusty, and the dust contains particles close to the diameter of PM2.5.
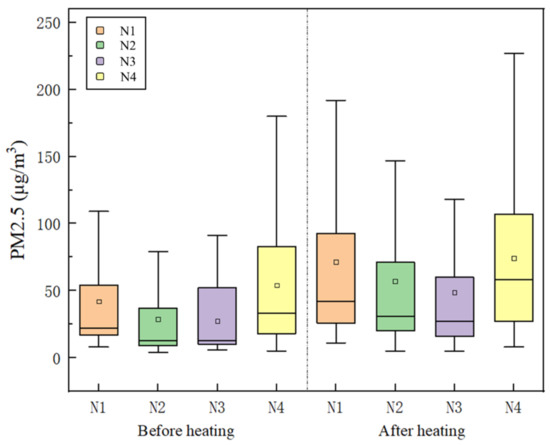
Figure 11.
Box diagram of PM2.5.
Figure 12 shows the correlation between indoor PM2.5 and outdoor PM2.5. Pearson coefficient is 0.956, p value is less than 0.05. This indicates that the concentration of indoor PM2.5 is significantly positively correlated with outdoor PM2.5. With the increase of outdoor PM2.5 concentration, indoor PM2.5 concentration gradually increased. Therefore, outdoor pollution should be paid attention to when opening windows for ventilation before going to bed.
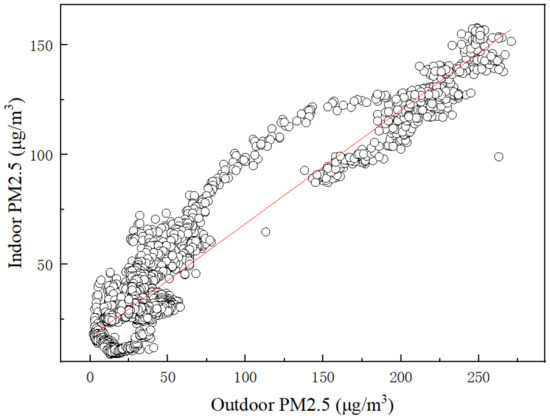
Figure 12.
Correlation between indoor PM2.5 and outdoor PM2.5.
3.1.5. HCHO
Figure 13 shows the change trend of HCHO in four dormitories before and after heating. Overall, the HCHO concentration in the dormitory after heating is lower than that before heating. Except for N4, the other dormitories were all below the standard value of 0.08 mg/m3. The HCHO in N1 and N3 are almost constant around 0, because there has been no decoration in the past two years, and the HCHO has been completely released. Since N2 was renovated 4 months before the test and equipped with new furniture, even though it was ventilated and exhausted for 2 months after the renovation, and students moved in for the next 2 months. Furthermore, with the progress of sleep, HCHO concentration showed an upward trend, which was related to the influence of other indoor environmental factors. The change of HCHO in N4 was almost the same as that in N2, but the concentration was much higher than in N2 during sleep. However, due to the same decoration history as N1 and N3, it can be judged that there is a strong release source of HCHO in N4, and the source of release may be related to girls’ spray, perfume and other cosmetics.
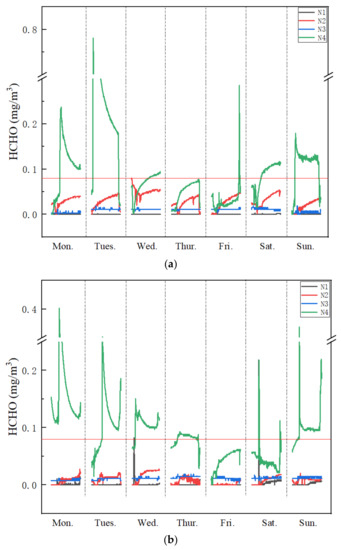
Figure 13.
HCHO measurement results. (a) Before heating, (b) After heating.
Figure 14 shows the HCHO values recorded during sleep in four dormitories. The average value before heating is 0.032 ± 0.060 mg/m3, ranging from 0 mg/m3 (dormitory N1) to 0.093 ± 0.094 mg/m3 (dormitory N4). The average value after heating is 0.026 ± 0.044 mg/m3, ranging from 0 mg/m3 (dormitory N1) to 0.084 ± 0.056 mg/m3 (dormitory N4). After heating, the average HCHO in the dormitory decreased by 19% compared with that before heating. In addition, the unfurnished dormitory N4 has the highest concentration of HCHO compared to the newly decorated N2, indicating that the release of cosmetic odor is a greater environmental threat.
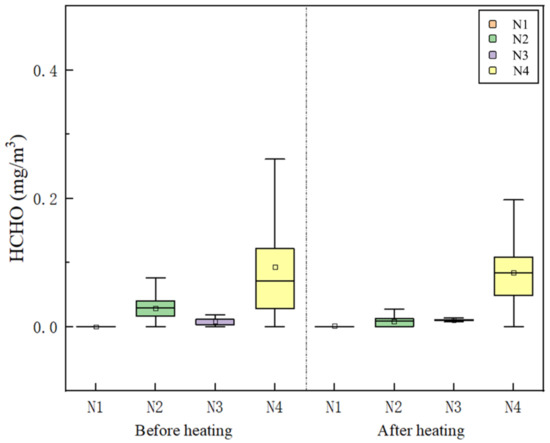
Figure 14.
Box diagram of HCHO.
Figure 15a,b show the correlation between HCHO and indoor temperature and humidity, with Pearson coefficients of 0.275 and 0.063, respectively, and p values less than 0.05, indicating that HCHO concentration is significantly positively correlated with indoor temperature and humidity. These results are contrary to the conclusion of the literature [18], because they controlled the room ventilation by opening windows during the measurement period, and explained that higher indoor temperature and humidity can help to increase indoor HCHO, but its effect has been eliminated by the influence of window ventilation. Therefore, the airflow caused by ventilation has a significant effect on reducing HCHO concentration. This point can be used to answer the above-mentioned HCHO value after heating is lower than before heating, indicating that heating has brought about an increase in temperature, and the ventilation frequency of occupants has also increased, thereby improving the indoor HCHO concentration. Figure 15c shows the correlation between HCHO and CO2, with the Pearson coefficient of 0.439, and the p value is less than 0.05, which indicates that the concentration of HCHO is significantly positively correlated with the concentration of CO2. The increase of CO2 concentration during sleep aggravated the release of HCHO from indoor pollution sources.
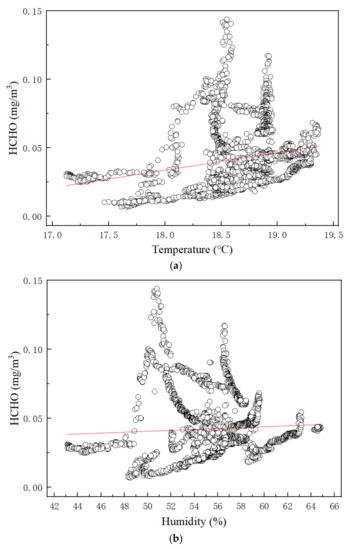
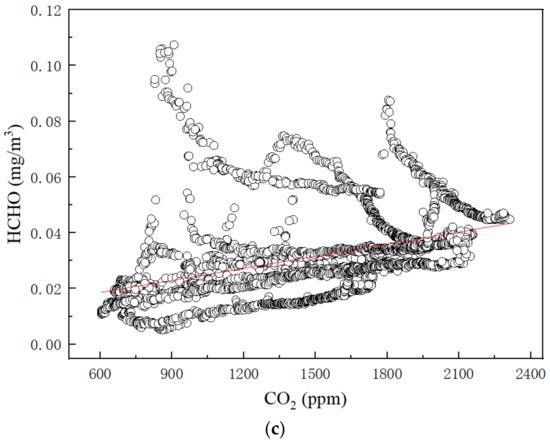
Figure 15.
Correlation between HCHO and other parameters. (a) Correlation between HCHO and temperature. (b) Correlation between HCHO and humidity. (c) Correlation between HCHO and CO2.
3.1.6. TVOC
Figure 16 shows the change trend of indoor TVOC in four dormitories before and after heating. In general, the indoor TVOC concentration gradually increased during sleep before and after heating, and may exceed the standard value of 0.6 mg/m3, indicating that there may be an uncomfortable odor in the dormitory when waking up in the morning. As shown in Figure 16a, the gap between the beginning and the end of the green curve is the largest, showing that the TVOC concentration at wake-up can increase by up to four times compared with that before sleep. At the beginning of sampling, the concentration of TVOC in each dormitory was generally about 0.2 mg/m3, including N2 with new decoration and furniture. With the occupation of personnel, the concentration of TVOC gradually increased, which indicates that the main reason for TVOC is personnel and their behavior activities, not the release of wall paint and furniture. After heating, the indoor TVOC concentration was improved, which was basically below the standard value.
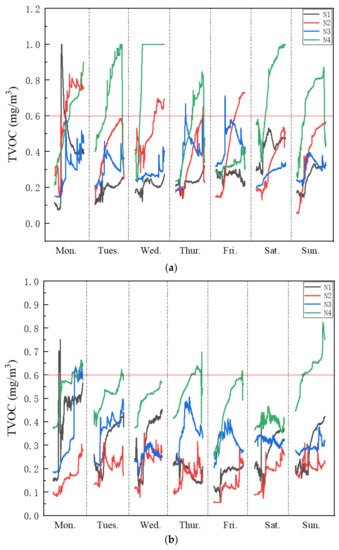
Figure 16.
TVOC measurement results. (a) Before heating, (b) After heating.
Figure 17 shows the TVOC values recorded during sleep in four dormitories. The average value before heating is 0.42 ± 0.22 mg/m3, ranging from 0.28 ± 0.13 mg/m3 (dormitory N1) to 0.62 ± 0.25 mg/m3 (dormitory N4). The average value after heating is 0.32 ± 0.15 mg/m3, ranging from 0.18 ± 0.05 mg/m3 (dormitory N2) to 0.51 ± 0.09 mg/m3 (dormitory N4). The reason for the decrease of TVOC concentration in each dormitory after heating is the same as HCHO discussed before, which may be related to the increase of ventilation frequency of indoor occupants after the rise of room temperature, and the TVOC concentration in the dormitory with high HCHO concentration is also high.
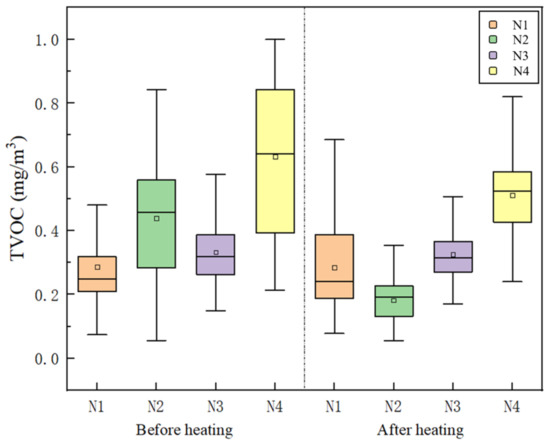
Figure 17.
Box diagram of TVOC.
Figure 18a shows the correlation between TVOC and indoor temperature. The Pearson coefficient is 0.545 and the p value is less than 0.05, which shows that the concentration of TVOC is significantly positively correlated with indoor temperature. Figure 18b demonstrates the correlation between TVOC and indoor humidity, with a Pearson coefficient of 0.467 and a p value of less than 0.05, which indicates that the concentration of TVOC has a prominent positive correlation with indoor humidity. Therefore, except for increasing the ventilation frequency, the release of TVOC can be prevented by controlling indoor temperature and humidity.
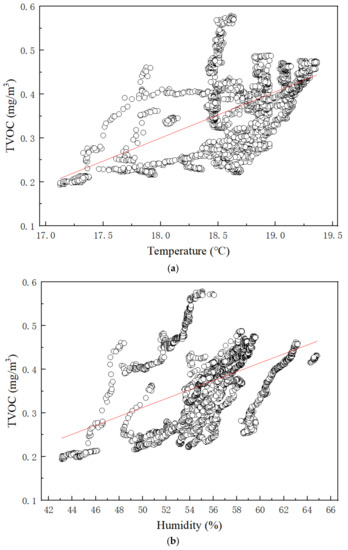
Figure 18.
Correlation between TVOC and other parameters. (a) Correlation between TVOC and temperature. (b) Correlation between TVOC and humidity.
3.2. Questionnaire Survey Results and Analysis
3.2.1. Thermal Comfort Evaluation
Figure 19 reveals the subjective evaluation results of occupant thermal comfort. Before heating, 83% of the occupants felt that the temperature in the dormitory was low, and only 17% felt that the temperature was acceptable, and the thermal comfort was neutral and slightly warm. After heating, the indoor temperature is increased, which improves the thermal comfort of indoor occupants. More than 61% of people feel that the temperature in the dormitory is comfortable, and the PMV vote is medium or above, indicating that central heating can meet the needs of most people, and even 23% feel that the room is warm. These students come from N2, which is consistent with the results of objective measurement, that is, the average temperature of their dormitory is the highest in all dormitories. There is no vote of hot in the evaluation results, which indicates that the energy consumption of the school heating system is relatively moderate, avoiding the output of heat beyond the people’s demand. 7.6% of students still feel that the indoor thermal comfort is cold after heating, which is related to the sensitivity of personal physique to room temperature. These students need to pay attention to wearing more clothes indoors to prevent infection of influenza in winter.
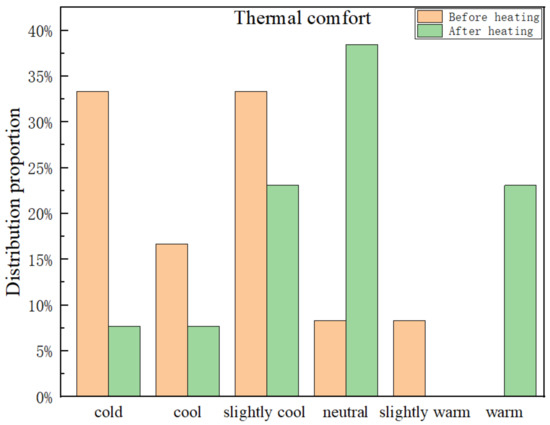
Figure 19.
Thermal comfort evaluation results.
3.2.2. IAQ and Mental State Evaluation
The subjective evaluation results of passengers on IAQ are shown in Figure 20. It can be seen that 91.7% of the passengers think that the IAQ is good before heating, and it drops to 69.2% after heating, indicating that the IAQ after heating is not easy to accept. According to the above correlation analysis, indoor HCHO and TVOC are positively correlated with temperature. After heating, the room temperature increased, and the release capacity of indoor pollutants was stronger. After feeling that the IAQ was getting worse, the occupants took corresponding action measures, such as opening windows for ventilation, which not only reduced the concentration of HCHO/TVOC with pungent odor, but also reduced the concentration of CO2 with the circulation of fresh air. Moreover, according to question 6 in the questionnaire, there is no significant difference in the evaluation results of indoor odor between before and after heating, which indicates that the ventilation measures taken by students based on their own experience can effectively eliminate the adverse effects caused by the change of room temperature. In addition, it is precisely due to the effect of opening windows for ventilation that the indoor PM2.5 concentration increased with the increase of outdoor PM2.5 concentration. This is consistent with the results of objective measurement, that is, compared with before heating, the dissatisfaction of occupants with IAQ increases after heating. By taking ventilation and other measures, the concentration of indoor pollutants except PM2.5 decreased, and the IAQ was improved. Furthermore, in both cases, no one felt that the IAQ was poor, indicating that the dormitory environment in this area was more suitable for students to live in.
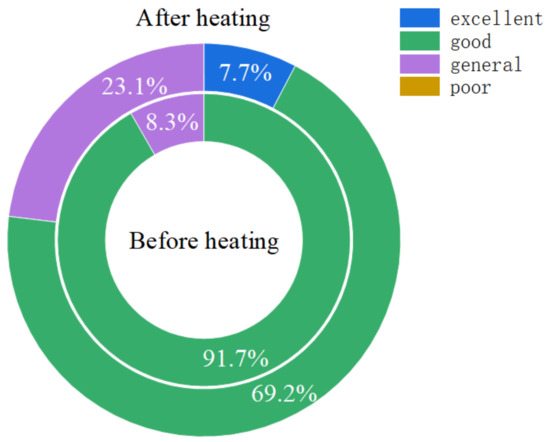
Figure 20.
IAQ evaluation results.
Figure 21 shows the results of the subjective evaluation of the mental state of the occupants. Before heating, 58.3% of the students were in a good mental state during morning study, and 41.7% were in a general mental state. After heating, 7.7% of the postgraduate students were in an excellent mental state, 53.8% were in a good mental state, and 38.5% were in general. Compared with before heating, the evaluation results of excellent mental state appeared, and the total of good and excellent mental state exceeded 60%, and the mental state of the students was slightly improved. This shows that the improvement of IAQ and thermal comfort improves the sleep quality of indoor occupants, and the students can keep more energy after getting up. Moreover, according to question 10 in the questionnaire, the proportion of residents who wake up in the morning and feel that the indoor air is stuffy has decreased from 50% before heating to 46% after heating, which shows that students are soberer when they wake up. It is consistent with the result of objective measurement that the indoor CO2 concentration is lower after heating. No one is sleepy after getting up, which indicates that the sleep quality of students living in the current indoor environment is acceptable.
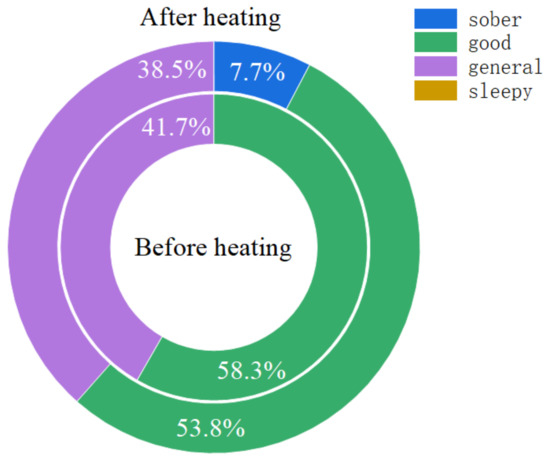
Figure 21.
Mental state evaluation results.
3.3. Sleep Duration and Study Time
Figure 22 shows the average sleep duration of the graduate students in the case of 2 weeks. On the whole, all graduate students sleep more than 7 h per night. This is in line with the consensus recommendation made by the American Academy of Sleep Medicine (AASM) and the Sleep Research Society (SRS) that 7 h or more is the amount of sleep required to promote optimal health for adults aged 18 to 60 [35]. Sleeping for less than 7 h can lead to obesity, high blood pressure and impaired immune function. According to statistics, the average sleep time of the second-year postgraduates is 8.5 h, while the first-year postgraduates is 8.7 h. The average sleep time of students in different grades has little difference. After 5 working days of work, the weekend became a relatively relaxing day. The average sleep time of all students on Saturday exceeded 9.3 h. Combined with the analysis of mental state in the previous chapter, adequate sleep time does not make the passengers feel that they can invest more than 90% of their energy, and most people can only invest 70% or even about 50%. Therefore, it can be considered that the IAQ during sleep affects the mental state of the passengers to a great extent.
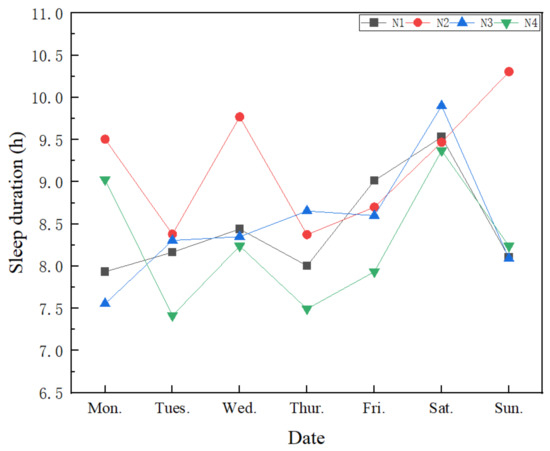
Figure 22.
Sleep duration results.
Figure 23 shows the average study time of the graduate students in the case in 2 weeks, including the time to get up in the morning and the time to return to the dormitory at night. Ignoring the short wash time, and treating their difference as learning time. It can be seen that the time for all students to get up is mainly between 7:00–8:30, which differs depending on whether there are morning classes. The second-year students return to the dormitory later at night, between 21:00–22:00, and the first-year students are used to return between 19:00–21:00. According to statistics, second-year graduate students work 13 h a day, while first-year students study 11.2 h. Due to the heavy scientific research tasks such as graduation, second-year students spend more time studying, and they are faced with greater academic pressure than first-year students. Furthermore, before heating, the average daily learning time of all personnel is 11.4 h, and after heating, it is increased to 12.5 h, reflecting more sufficient learning energy, which is related to the improvement of indoor thermal comfort and IAQ after heating. Therefore, improving the indoor environment during sleep may improve the learning energy of second-year students, so as to reduce the academic pressure.
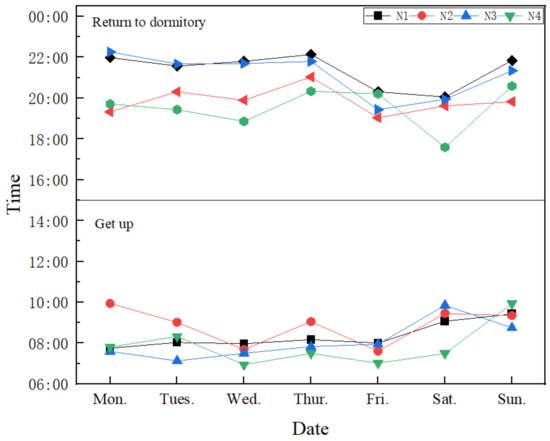
Figure 23.
Study time results.
3.4. Discussion
The objective experiment in this article did not take any control strategy for the occupants during the sampling period, and did not carry out any interference. The purpose is to obtain the changes in IAQ during the sleep period of multi-occupants before and after heating, and the impact of such changes on the personnel. Some other limitations include the limited number of bedrooms. Current work shows that there are non-conformances of different parameters in IAQ during sleep in the dormitory in winter. As shown in Table 5, heating has reduced the number of non-conformance items and has brought improvements in IAQ. In general, the environment in the male dormitory (N1, N2) is better than that in the female dormitory (N3, N4). The poorer air parameters in the female dormitory are HCHO and TVOC. The reason for the higher concentration may be the peculiar smell produced by cosmetics. Throughout the measurement period, the worst environmental parameter for the occupants is the CO2 concentration, which highlights the need to pay attention to this type of environment and take preventive and remedial measures to breathe healthier air. In addition, among all the dormitories, only the dormitory on the shady side has a high humidity, and even if the heating temperature rises, it cannot reach the standard. Therefore, other measures should be taken to eliminate this effect for the rooms on the shady side.

Table 5.
Compliance of IAQ for parameters in the studied dormitories with China standard. “Yes” when the parameter is within the acceptable range or “No” if otherwise.
Furthermore, the improvement of IAQ after heating has a positive impact on the occupants, as shown in Table 6. The thermal comfort is considered satisfactory in the four levels of neutral, slightly warm, warm, and hot. Only 17% of the votes were satisfied before heating, and it increased to 61% after heating. Compared with no one feels that their mental state during the morning study period can reach sober before heating, 7.7% of the students feel that they can devote 100% of their energy to the study, and the mental state reached the sober state has after heating. This shows that the improvement of IAQ has brought advantages to the occupants. For the sleep duration, all the graduate students in the sample were able to guarantee the recommended sufficient sleep time of more than 7 h, and the sleep length increased by 0.1 h after the IAQ was improved. For students, the study time is more concerned, especially the senior students who are facing heavy academic pressure. The daily study time after heating is expected to increase by nearly one hour compared with before heating, which means that the improvement of IAQ during sleep makes them have more time for scientific research.

Table 6.
The positive impact of IAQ.
4. Conclusions
In winter, the external environment is harsh. Central heating can not only increase the temperature of the room but also affect the IAQ, especially during sleep periods when occupants cannot adopt dynamic strategies. Based on field measurement experiments and questionnaire surveys, this paper introduces the results of IAQ in graduate dormitories in northern China before and after heating during sleep. It includes testing of indoor temperature, humidity, CO2, PM2.5, HCHO, and TVOC concentration, discussion of subjective evaluation of occupants, and correlation analysis. Some important findings are as follows:
- After heating in winter, the average temperature in the small space and high-density multi-occupant dormitory rises by 3 °C, and more than 60% of the occupants think that the thermal comfort was satisfactory. When sleep continues, the humidity will gradually increase. Especially dormitories on the shady side, occupants need to pay more attention to the growth of bacteria because of the more humid environment. During sleep, CO2 in the dormitory rises significantly, up to 5000 ppm, which can cause serious consequences.
- In terms of pollutants, indoor PM2.5 is positively correlated with the outdoor PM2.5 concentration, and indoor PM2.5 is nearly increased by 65% due to heating. For odor, the average value of HCHO is less than 0.08 mg/m3, but the use of cosmetics will increase by several times, which is stronger than that in a newly decorated dormitory. The concentration of TVOC is high when people wake up, which leads to uncomfortable odor. Additionally, HCHO and TVOC are positively correlated with temperature and humidity, and HCHO is also positively affected by CO2.
- IAQ in dormitories during sleep affects students’ mental state. Good IAQ can improve students’ sleep duration and study time.
In the future, we will monitor students’ dormitories for a long time and track their academic performance, so as to reflect the IAQ changes in students’ dormitories in different seasons and their impact on learning.
Author Contributions
Conceptualization, Z.L. and L.Z.; methodology, Y.L.; software, L.Z. and Z.L.; validation, Z.L., L.Z. and Y.L.; formal analysis, Z.L.; investigation, L.Z.; resources, L.Z.; data curation, Y.L.; writing—original draft preparation, Y.L. and L.Z.; writing—review and editing, Z.L.; visualization, Y.L.; supervision, Z.L.; project administration, L.Z.; funding acquisition, Z.L. All authors have read and agreed to the published version of the manuscript.
Funding
This research is supported by the National Natural Science Foundation of China (No. 52178066, 61803067, 52008073), NSFC Guidance Program Projects of Liaoning Province (2019-ZD-0174).
Institutional Review Board Statement
Not applicable.
Informed Consent Statement
Not applicable.
Data Availability Statement
Data sharing not applicable.
Conflicts of Interest
The authors declare no conflict of interest.
References
- Nazelle, D.; Seto, E.; Donaire-Gonzalez, D.; Mendez, M.; Matamala, J.; Nieuwenhuijsen, M.J.; Jerrett, M. Improving estimates of air pollution exposure through ubiquitous sensing technologies. Environ. Pollut. 2013, 176, 92–99. [Google Scholar] [CrossRef] [PubMed]
- Lee, S.C.; Lam, S.; Fai, H.K. Characterization of VOCs, ozone, and PM10 emissions from office equipment in an environmental chamber. Build. Environ. 2001, 36, 837–842. [Google Scholar] [CrossRef]
- Van Cauter, E.; Spiegel, K.; Tasali, E.; Leproult, R. Metabolic consequences of sleep and sleep loss. Sleep Med. 2008, 9, S23–S28. [Google Scholar] [CrossRef]
- Dewald, J.F.; Meijer, A.M.; Oort, F.J.; Kerkhof, G.A.; Bögels, S.M. The influence of sleep quality, sleep duration and sleepiness on school performance in children and adolescents: A meta-analytic review. Sleep Med. Rev. 2010, 14, 179–189. [Google Scholar] [CrossRef] [PubMed]
- Dionova, B.W.; Mohammed, M.N.; Al-Zubaidi, S.; Yusuf, E. Environment indoor air quality assessment using fuzzy inference system. ICT Express 2020, 6, 185–194. [Google Scholar] [CrossRef]
- Giles-Corti, B.; Vernez-Moudon, A.; Reis, R.; Turrell, G.; Dannenberg, A.L.; Badland, H.; Foster, S.; Lowe, M.; Sallis, J.F.; Stevenson, M.; et al. City planning and population health: A global challenge. Lancet 2016, 388, 2912–2924. [Google Scholar] [CrossRef]
- Saini, J.; Dutta, M.; Marques, G. A comprehensive review on indoor air quality monitoring systems for enhanced public health. Sustain. Environ. Res. 2020, 30, 6. [Google Scholar] [CrossRef]
- Fragkias, M.; Lobo, J.; Strumsky, D.; Seto, K.C. Does size matter? Scaling of CO2 emissions and US urban areas. PLoS ONE 2013, 8, e64727. [Google Scholar] [CrossRef]
- Nieuwenhuijsen, M.J. Urban and transport planning, environmental exposures and health-new concepts, methods and tools to improve health in cities. Environ. Health 2016, 15, 161–171. [Google Scholar] [CrossRef]
- Mueller, N.; Rojas-Rueda, D.; Basagaña, X.; Cirach, M.; Cole-Hunter, T.; Dadvand, P.; Nieuwenhuijsen, M. Urban and transport planning related exposures and mortality: A health impact assessment for cities. Environ. Health Perspect. 2017, 125, 89–96. [Google Scholar] [CrossRef]
- Canha, N.; Lage, J.; Candeias, S.; Alves, C.; Almeida, S.M. Indoor air quality during sleep under different ventilation patterns. Atmos. Pollut. Res. 2017, 8, 1132–1142. [Google Scholar] [CrossRef]
- Index, E.P. Environmental Performance Index; Yale University and Columbia University: New Haven, CT, USA, 2018. [Google Scholar]
- Cao, C.; Jiang, W.; Wang, B.; Fang, J.; Lang, J.; Tian, G.; Jiang, J.; Zhu, T.F. Inhalable microorganisms in Beijing’s PM2. 5 and PM10 pollutants during a severe smog event. Environ. Sci. Technol. 2014, 48, 1499–1507. [Google Scholar] [CrossRef]
- Bashir, M.F.; Jiang, B.; Komal, B.; Bashir, M.A.; Farooq, T.H.; Iqbal, N.; Bashir, M. Correlation between environmental pollution indicators and COVID-19 pandemic: A brief study in Californian context. Environ. Res. 2020, 187, 109652. [Google Scholar] [CrossRef]
- Abouleish, M. Indoor air quality and coronavirus disease (COVID-19). Public Health 2020, 191, 1–2. [Google Scholar] [CrossRef]
- Bu, Z.; Zhang, Y.; Mmereki, D.; Yu, W.; Li, B. Indoor phthalate concentration in residential apartments in Chongqing, China: Implications for preschool children’s exposure and risk assessment. Atmos. Environ. 2016, 127, 34–45. [Google Scholar] [CrossRef]
- Ashford, N.A.; Caldart, C.C. Negotiated environmental and occupational health and safety agreements in the United States: Lessons for policy. J. Clean. Prod. 2001, 9, 99–120. [Google Scholar] [CrossRef]
- Huang, K.; Song, J.; Feng, G.; Chang, Q.; Jiang, B.; Wang, J.; Sun, W.; Li, H.; Wang, J.; Fang, X. Indoor air quality analysis of residential buildings in northeast China based on field measurements and longtime monitoring. Build. Environ. 2018, 144, 171–183. [Google Scholar] [CrossRef]
- Huang, S.; Wei, W.; Weschler, L.B.; Salthammer, T.; Kan, H.; Bu, Z.; Zhang, Y. Indoor formaldehyde concentrations in urban China: Preliminary study of some important influencing factors. Sci. Total Environ. 2017, 590, 394–405. [Google Scholar] [CrossRef]
- Pei, J.; Yin, Y.; Liu, J. Long-term indoor gas pollutant monitor of new dormitories with natural ventilation. Energy Build. 2016, 129, 514–523. [Google Scholar] [CrossRef]
- Jiang, C.; Li, D.; Zhang, P.; Li, J.; Wang, J.; Yu, J. Formaldehyde and volatile organic compound (VOC) emissions from particleboard: Identification of odorous compounds and effects of heat treatment. Build. Environ. 2017, 117, 118–126. [Google Scholar] [CrossRef]
- Fang, L.; Clausen, G.; Fanger, P.O. Impact of temperature and humidity on perception of indoor air quality during immediate and longer whole-body exposures. Indoor Air 1198, 8, 80–90. [Google Scholar] [CrossRef]
- Hou, J.; Sun, Y.; Dai, X.; Liu, J.; Shen, X.; Tan, H.; Yin, H.; Huang, K.; Gao, Y.; Lai, D.; et al. Associations of indoor carbon dioxide concentrations, air temperature, and humidity with perceived air quality and sick building syndrome symptoms in Chinese homes. Indoor Air 2021, 31, 1018–1028. [Google Scholar] [CrossRef] [PubMed]
- Huang, K.; Zhao, S.; Feng, G.; Chen, Q.; Guan, J.; Song, J. Thermal performance of dual S-channel air-type phase change energy storage device. Appl. Therm. Eng. 2020, 171, 115071. [Google Scholar] [CrossRef]
- Canha, N.; Alves, A.C.; Marta, C.S.; Lage, J.; Belo, J.; Faria, T.; Cabo, S.; Viegas, C.; Alves, C.; Almeida, S.M. Compliance of indoor air quality during sleep with legislation and guidelines–A case study of Lisbon dwellings. Environ. Pollut. 2020, 264, 114619. [Google Scholar] [CrossRef] [PubMed]
- Strøm-Tejsen, P.; Zukowska, D.; Wargocki, P.; Wyon, D.P. The effects of bedroom air quality on sleep and next-day performance. Indoor Air 2016, 26, 679–686. [Google Scholar] [CrossRef]
- Laverge, J.; Novoselac, A.; Corsi, R.; Janssens, A. Experimental assessment of exposure to gaseous pollutants from mattresses and pillows while asleep. Build. Environ. 2013, 59, 203–210. [Google Scholar] [CrossRef]
- Lei, Z.; Liu, C.; Wang, L.; Li, N. Effect of natural ventilation on indoor air quality and thermal comfort in dormitory during winter. Build. Environ. 2017, 125, 240–247. [Google Scholar] [CrossRef]
- Lucialli, P.; Marinello, S.; Pollini, E.; Scaringi, M.; Sajani, S.Z.; Marchesi, S.; Cori, L. Indoor and outdoor concentrations of benzene, toluene, ethylbenzene and xylene in some Italian schools evaluation of areas with different air pollution. Atmos. Pollut. Res. 2020, 11, 1998–2010. [Google Scholar] [CrossRef]
- Zhao, L.; Wu, W.; Li, S. Design and implementation of an IoT based indoor air quality detector with multiple communication interfaces. IEEE Internet Things J. 2019, 6, 9621–9632. [Google Scholar] [CrossRef]
- Lolli, F.; Marinello, S.; Coruzzolo, A.M.; Butturi, M.A. Post-Occupancy Evaluation’s (POE) Applications for Improving Indoor Environment Quality (IEQ). Toxics 2022, 10, 626. [Google Scholar] [CrossRef]
- Fanger, P.O. Thermal Comfort-Analysis and Applications in Environmental Engineering; McGraw Hill Company: New York, NY, USA, 1970. [Google Scholar]
- Granieri, D.; Carapezza, M.L.; Barberi, F.; Ranaldi, M.; Ricci, T.; Tarchini, L. Atmospheric dispersion of natural carbon dioxide emissions on Vulcano Island, Italy. J. Geophys. Res. Sol. Earth 2014, 119, 5398–5413. [Google Scholar] [CrossRef]
- Zhang, N.; Cao, B.; Zhu, Y. Indoor environment and sleep quality: A research based on online survey and field study. Build. Environ. 2018, 137, 198–207. [Google Scholar] [CrossRef]
- Watson, N.F.; Badr, M.S.; Belenky, G.; Bliwise, D.L.; Buxton, O.M.; Tasali, E. Recommended amount of sleep for a healthy adult: A joint consensus statement of the American Academy of Sleep Medicine and Sleep Research Society. J. Clin. Sleep Med. 2015, 11, 591–592. [Google Scholar] [CrossRef]
Publisher’s Note: MDPI stays neutral with regard to jurisdictional claims in published maps and institutional affiliations. |
© 2022 by the authors. Licensee MDPI, Basel, Switzerland. This article is an open access article distributed under the terms and conditions of the Creative Commons Attribution (CC BY) license (https://creativecommons.org/licenses/by/4.0/).