Article

Machine Learning and Deterministic Methods for Detection Meteorological Phenomena from Ground Measurements: Application for Low-Level Jet and Sea-Breeze Identification in Northern France

1
CNRS, UMR 8187—LOG—Laboratoire d’Océanologie et de Géosciences, University Lille, University Littoral Côte d’Opale, F 62930 Wimereux, France
2
UR 4493—LPCA—Laboratoire de Physico-Chimie de l’Atmosphère, University Littoral Côte d’Opale, F 59140 Dunkerque, France
*
Author to whom correspondence should be addressed.
Atmosphere 2022, 13(11), 1873; https://doi.org/10.3390/atmos13111873
Submission received: 23 September 2022 / Revised: 27 October 2022 / Accepted: 7 November 2022 / Published: 10 November 2022
(This article belongs to the Topic Energy Efficiency, Environment and Health)

Abstract

:
This study focused on the detection of mesoscale meteorological phenomena, such as the nocturnal low-level jet (NLLJ) and sea breeze (SB), using automatic deterministic detection wavelet technique algorithms (HWTT and SWT) and the machine learning recurrent neural network (RNN) algorithm. The developed algorithms were applied for detection of NLLJ and SB events from ultrasonic anemometer measurements, performed between January 2018 and December 2019 at a nearshore experimental site in the north of France. Both algorithms identified the SB and NLLJ days successfully. The accuracy of SB event detection by the RNN algorithm attained 95%, and we identified 67 and 78 SB days in 2018 and 2019, respectively. Additionally, a total of 192 and 168 NLLJ days were found in 2018 and 2019, respectively. To demonstrate the capability of the algorithms to detect SB and NLLJ events from near-ground ultrasonic anemometer measurements, analysis of the simultaneous wind lidar measurements available for 86 days were performed. The results show a good agreement between the RNN-based detection method and the lidar observations, detecting 88% of SB. Deterministic algorithms (HWTT and SWT) detected a similar number of NLLJ events and provided high correlation (0.98) with the wind lidar measurements. The meteorological phenomena studied can significantly affect the energy production of offshore wind farms. It was found that the maximum hourly average peak power production could be to 5 times higher than that of the reference day due to higher wind speed observed during NLLJ events. During SB events, hourly average peak power production could be up to 2.5 times higher. In this respect, the developed algorithms applied for analysis, from near-ground anemometer measurements, may be helpful for monitoring and forecasting the meteorological phenomena capable of disturbing the energy production of offshore wind turbines.

1. Introduction

A number of meteorological phenomena, such as the nocturnal low-level jet (NLLJ) and sea breeze (SB), are observed in the lower atmospheric boundary layer in coastal regions. During these events, changes in wind speed, direction, and turbulence parameters occur at a time scales smaller than one hour. As a result, NLLJ and SB may have some impacts on the power production of wind turbines and air quality [1,2,3].
During SB events, the wind speed increases and the wind blows from the sea towards the land. This phenomenon occurs due to an adverse atmospheric pressure gradient generated by the temperature difference between the land and sea during the daytime. SB evolution depends on a large range of geophysical factors including topography, Coriolis force, heat diffusion, solar radiation, synoptic forcing, and sea surface temperature [4,5,6].
In coastal regions, LLJ, characterized by a maximum in the wind speed profile in the lower troposphere [7,8], can have different driving mechanisms [9]. According to Schulz-Stellenfleth et al. [10], LLJ can be attributed to frictional decoupling from the underlying surface or baroclinicity due to the temperature contrast between the land and sea. Over the southern North Sea, relatively warm continental air advected over the cooler sea surface supports the development of surface temperature inversion, leading to the decoupling of the surface friction and acceleration of an air mass [11,12]. Moreover, the surface roughness difference between the land and sea favors the air flow acceleration [13]. Over the southern part of the North Sea, LLJ mainly occurs during the nighttime hours [13].
Recently, the power production of offshore wind turbines has become a large source of renewable energy capable of minimizing global carbon emissions. Since the SB is an important event of the coastal and offshore wind climate, it may significantly affect the resource assessment during the initial pre-construction phase of a wind farm. Indeed, the effect of the SB on offshore wind power production is not negligible; for example, along the Gujarat coast (India), the SB contributed 6.2% of the annual energy generation at the nearshore locations [14]. In the Llobregat Delta (NE of the Iberian Peninsula), Mazon et al. [2] found that a range of 42 to 55% of total wind energy was generated during the SB period, which accounts for 22% of the total time in a year. The resource assessment studies highlighted the importance of sea breezes, because they occur frequently during peak energy demand periods (summer afternoons) across many coastlines designated for offshore wind energy [15,16]. Some studies conducted in the European North Sea reported an enhancement in energy production due to SB [17,18]. Around the southern North Sea, Steele et al. [17] estimated wind energy enhancement of 10% due to the presence of the coastal jet, depending on the sea-breeze type and coastline characteristics. The SB may affect LLJ formation. During the North Sea OBLEX-F1 campaign, SB circulations have been observed that vanished before jet detection [9]. This process was previously observed by Angevine et al. [19], where an LLJ evolved after an SB breakdown [19]. During the OBLEX-F1 campaign, most LLJ detections occurred between the evening and the morning [9]. As population density and economic activity in the coastal zone increase [20], this nocturnal phenomenon can have some important impact on air quality [21,22,23,24] and on power production of wind turbines, especially during the high-electricity-consumption evening period (peak period), corresponding to the evening hours (after sunset) when there is a lot of demand [25]. To meet the nighttime power requirement from offshore wind turbines, NLLJ events can be effective in coastal regions.
Therefore, there is a strong motivation to fully understand the offshore wind and to develop algorithms capable of efficiently, easily, and quickly detecting SB and NLLJ from near ground, in situ measurements. In the literature, several methods have been developed for time series classification, such as feature-based [26] and transformation-based ensembles [27,28], supervised machine learning algorithms [29], and deep learning [30,31]. However, to the best of our knowledge, no study has focused on SB day classification algorithms using machine learning and NLLJ using deterministic methods applied mainly to in situ wind measurements near the ground.
The present study focused on the development of cutting-edge classification algorithms for SB and NLLJ, using time series of wind speed, wind direction, and turbulence kinetic energy measured by an ultrasonic anemometer in the coastal region of northern France. Moreover, we checked the performance of these algorithms by comparing them with lidar measurements. The second objective of this study was to develop a new machine learning algorithm using a recurrent neural network (RNN) to detect SB days and algorithms to detect NLLJ using discrete wavelet transform. The measurement techniques and the methodology for analysis and classification are presented in Section 2, and results are summarized in Section 3, followed by the conclusion in Section 4.

2. Materials and Methods

Measurements were taken in Dunkerque for a period of 2 years, using a 20 Hz ultrasonic anemometer (Figure 1). This measurement device provides 15 min averaged data. In the frame of EPhEMER project (Etude des Phénomènes météorologiques et leurs impacts sur la production Eolienne en MER) and during an intensive observation period (IOP) of 86 days (from July to October 2021), another ultrasonic anemometer located in the front of the coastal line (15 m AGL) and two Vaisala WindCube lidars (WLS7 and WLS100) were deployed to assess the impact of NLLJ and SB on wind turbines.

2.1. Calculation of Turbulence Parameters

u R ,   v R ,   and   w R are respectively the zonal, meridional, and vertical components of wind velocity measured using the ultrasonic anemometer. The wind flow directions are detailed in [32]. To avoid the effects of the meteorological coordinate system on the turbulence parameters, we adopted a new coordinate system where the mean flow is aligned with the x-axis [32,33]. In the new coordinate system, the instantaneous streamwise, transverse, and vertical wind velocity components (u, v, and w) were decomposed into a mean part and fluctuating part as:
u = u ¯ + u ,   u = u ¯ + u ,   w = w ¯ + w ,
where u ¯ , v ¯ ,   and   w ¯ are mean velocity components (15 min averaged), and u , v ,   and   w are the corresponding velocity fluctuations.
The turbulence kinetic energy (TKE) is defined as:
T K E = 1 2 u 2 ¯ + v 2 ¯ + w 2 ¯ ,
The integral length scale can be calculated from the autocorrelation function using the Taylor frozen turbulence hypothesis [34] as:
L u = u 0 u , x t d Δ t ,    
where u , x t is the autocorrelation function, given as:
u , x Δ t = u , x Δ x = u t · u t Δ t u 2 ,
and Δ t is the time period, defined as:
Δ t =   Δ x u ,

2.2. Detection Methods

To detect the SB and NLLJ, we developed four automatic detection algorithms: (i) Sign Change of Sea-Breeze Component (SCSBC) and (ii) machine learning recurrent neural network (RNN) for SB detection; (iii) Haar wavelet threshold technique (HWTT) and (iv) Symlets wavelet slope technique (SWT) for NLLJ detection.
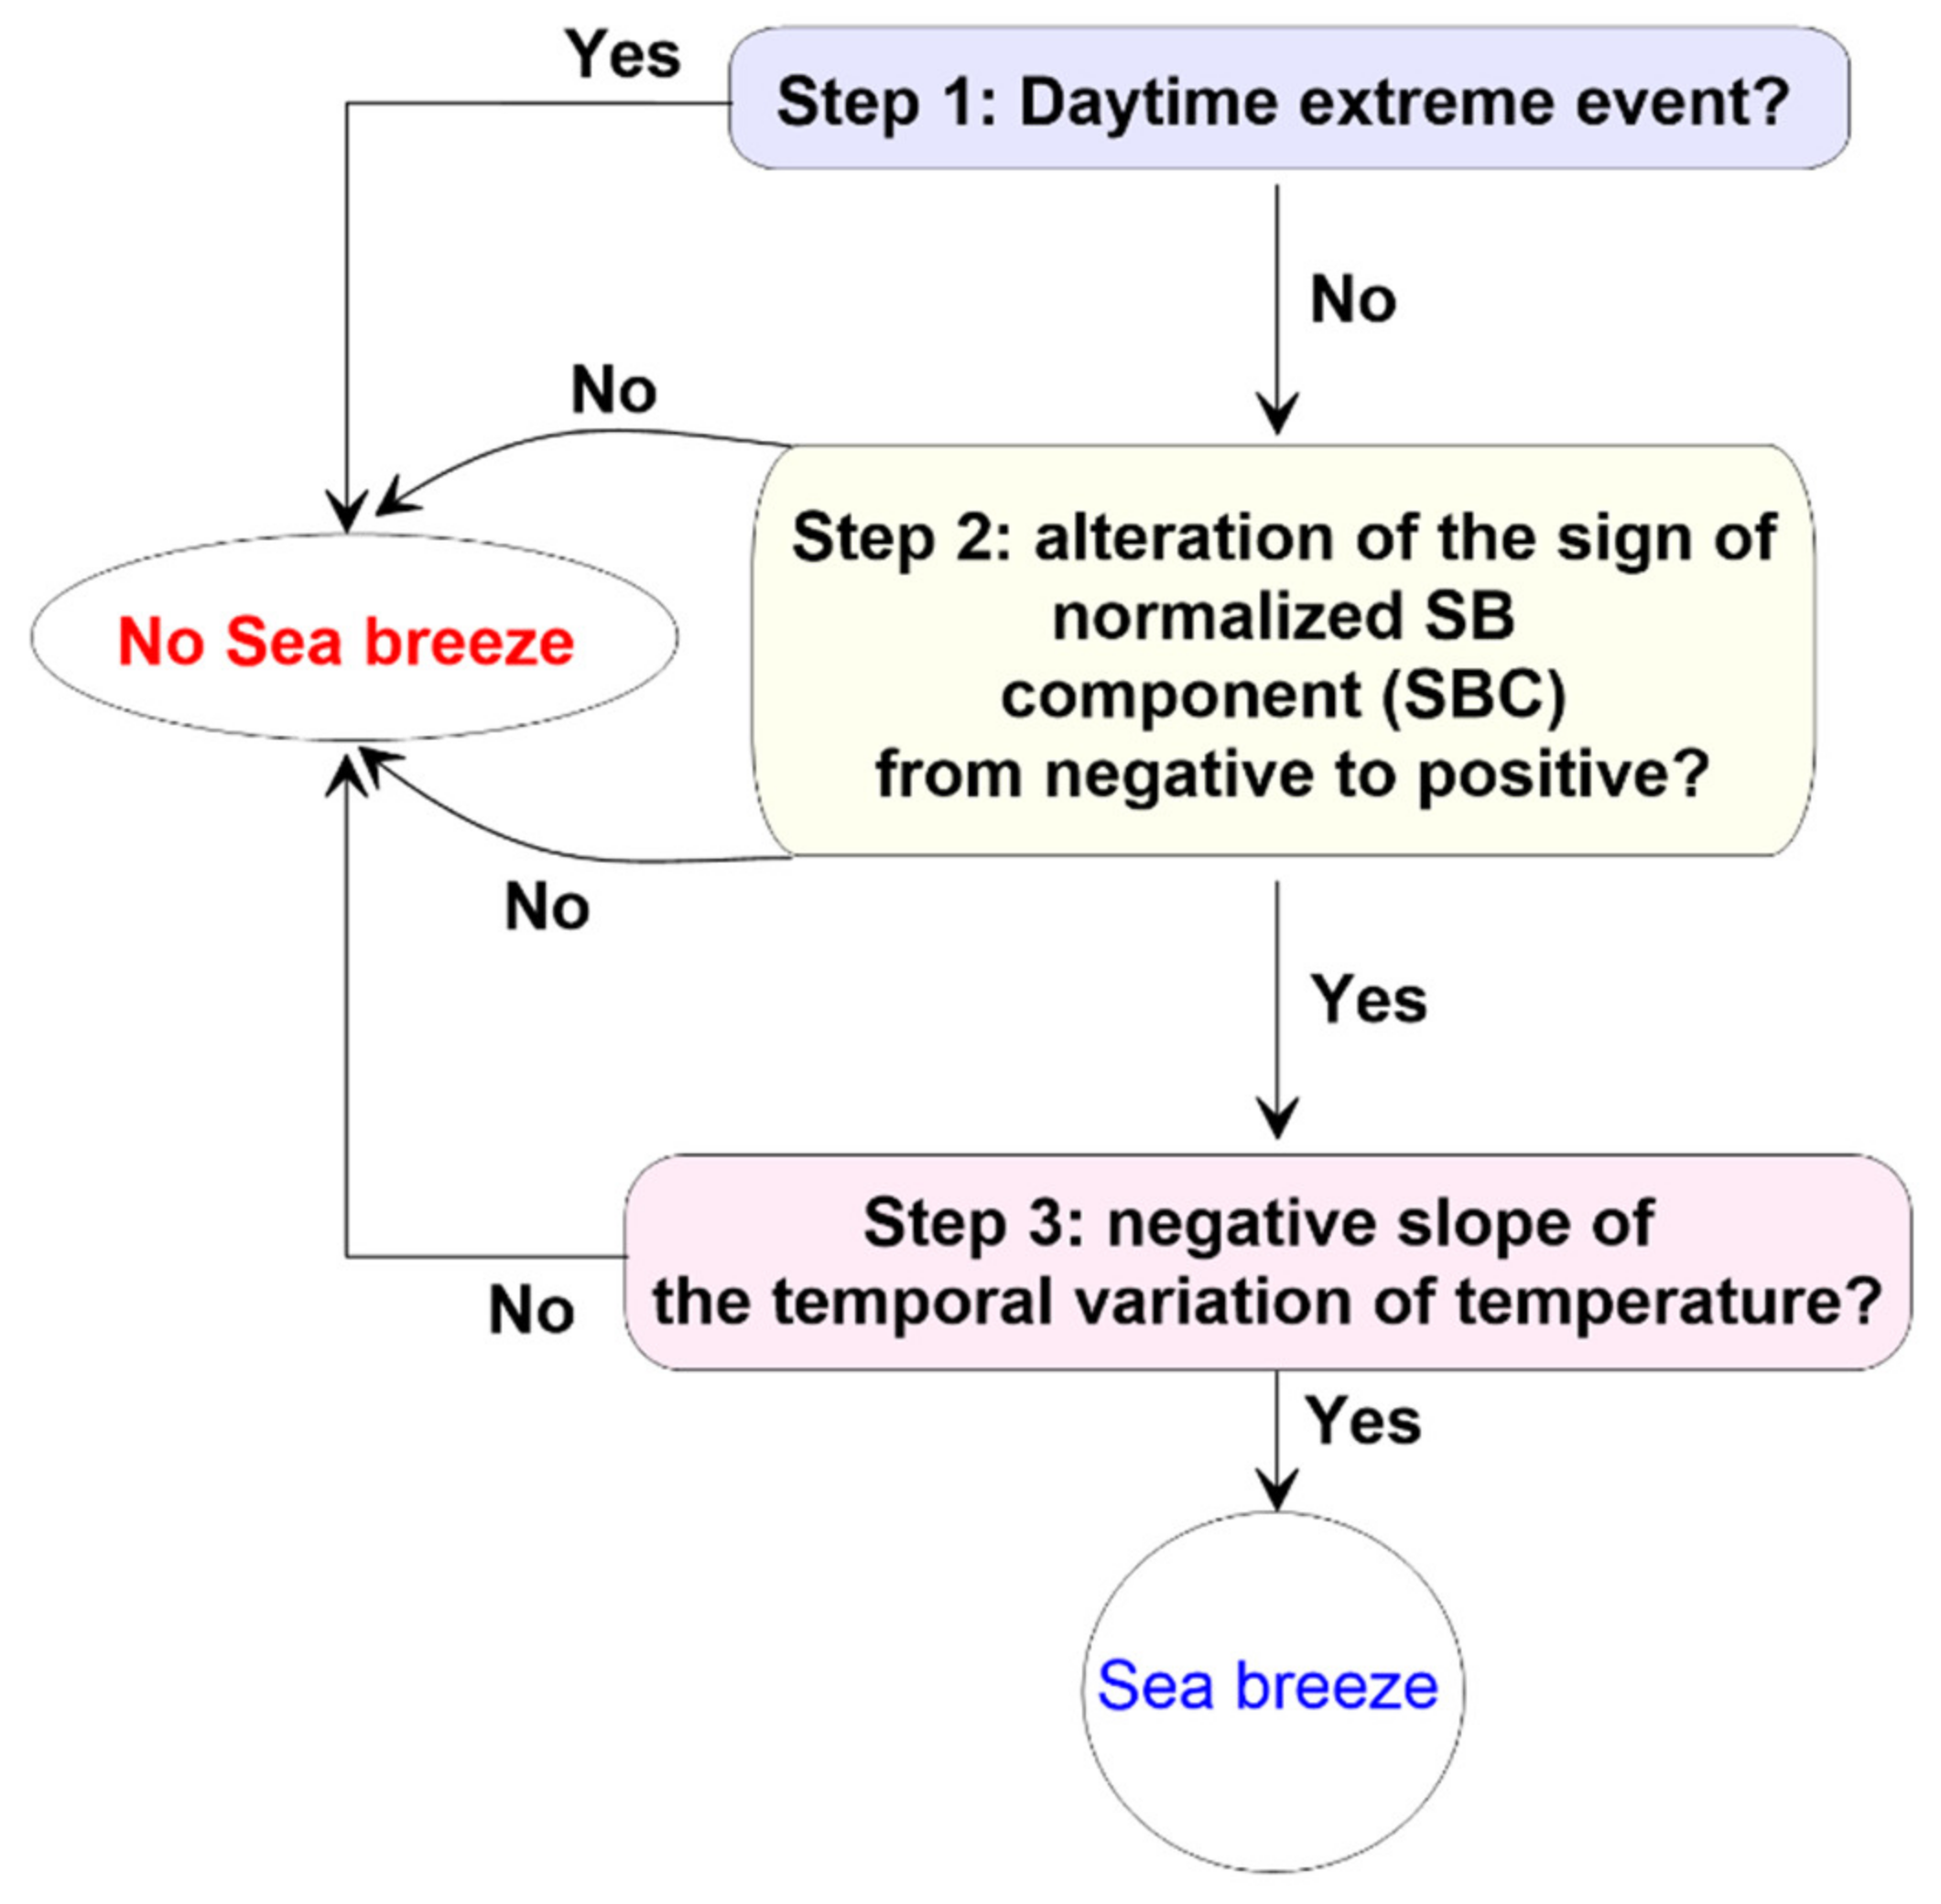
In the SCSBC algorithm, four filters were used to identify SB days (steps 1 to 4 in Figure 2). Step 1 separates the extreme events. Step 2 rejects those days where wind direction changes more than 90 degrees in less than 1 h. In Step 3, for a period from 08:00 to 11:00 UTC, a shift in wind direction from offshore to onshore was recognized from an alteration of the sign of the normalized SB component (SBC = (U × sin(−WD))/U, where WD is the wind direction and U is the horizontal wind speed). A change from a negative to a positive value of SBC signifies the occurrence of an SB [35]. In the last step, a positive slope of the temperature gradient confirms the authenticity of the SB.
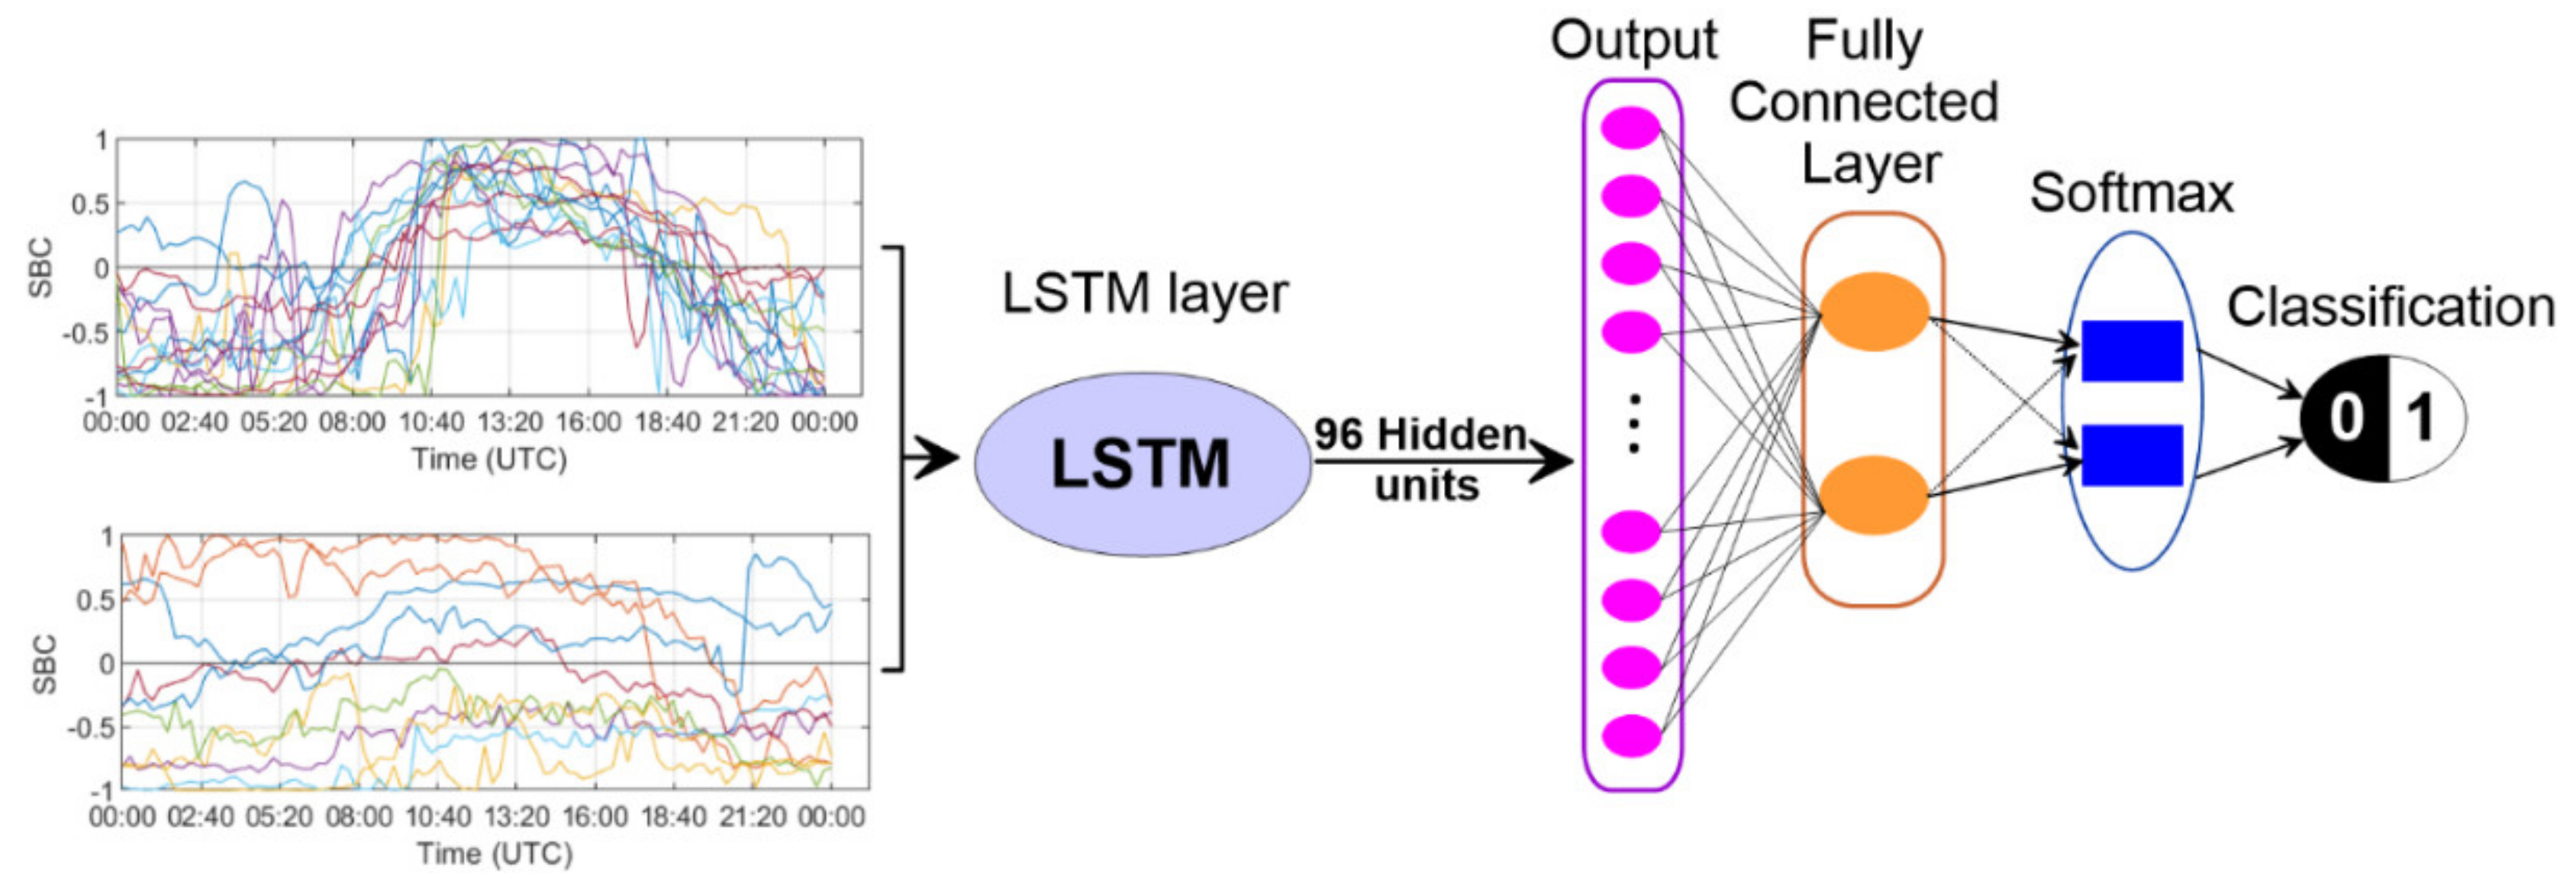
In the RNN framework for SB detection, long short-term memory (LSTM) neural networks are a typical form of RNN. Hidden units in LSTM are capable of recalling the long-term reliance on sequential data (e.g., time series data), thus enhancing the efficiency for classifying the SB and non-SB days. Figure 3 shows the LSTM framework. Since SB days are frequent during the summer, we used six months (from April to September) of data in the input layer. The SBC in each day is treated as features, which consist of 15 min averaged wind direction for a period of 24 h. A total of 182 sequential feature vectors are used to train the network. The cell state in one LSTM block is updated by four interacting layers, namely, forgetting gate, input gate, cell state updating, and output gate. Equations involved in these gates are detailed in [3]. Note that a number of trials with hidden units was made to optimize the hyperparameter. We found that 96 hidden units is best to achieve an optimal prediction of SB days. The output from LSTM passes through a fully connected layer (2 classes). The output from the fully connected layer is followed by an output layer consisting of a softmax activation function, resulting in binary classification (i.e., 1 for SB or 0 for non-SB).
We used a cross-entropy loss function to train classifiers. To optimize the backpropagation, the adaptive momentum estimator (ADAM) was used. The initial learning rate of ADAM was 0.001. To achieve a maximum accuracy a minibatch of 27 sequences, 300 epochs (6 iterations per epoch) were used. To train the network, we used 182 sequences from the year 2018. To test the network output, the same number of sequences from 2019 was used.
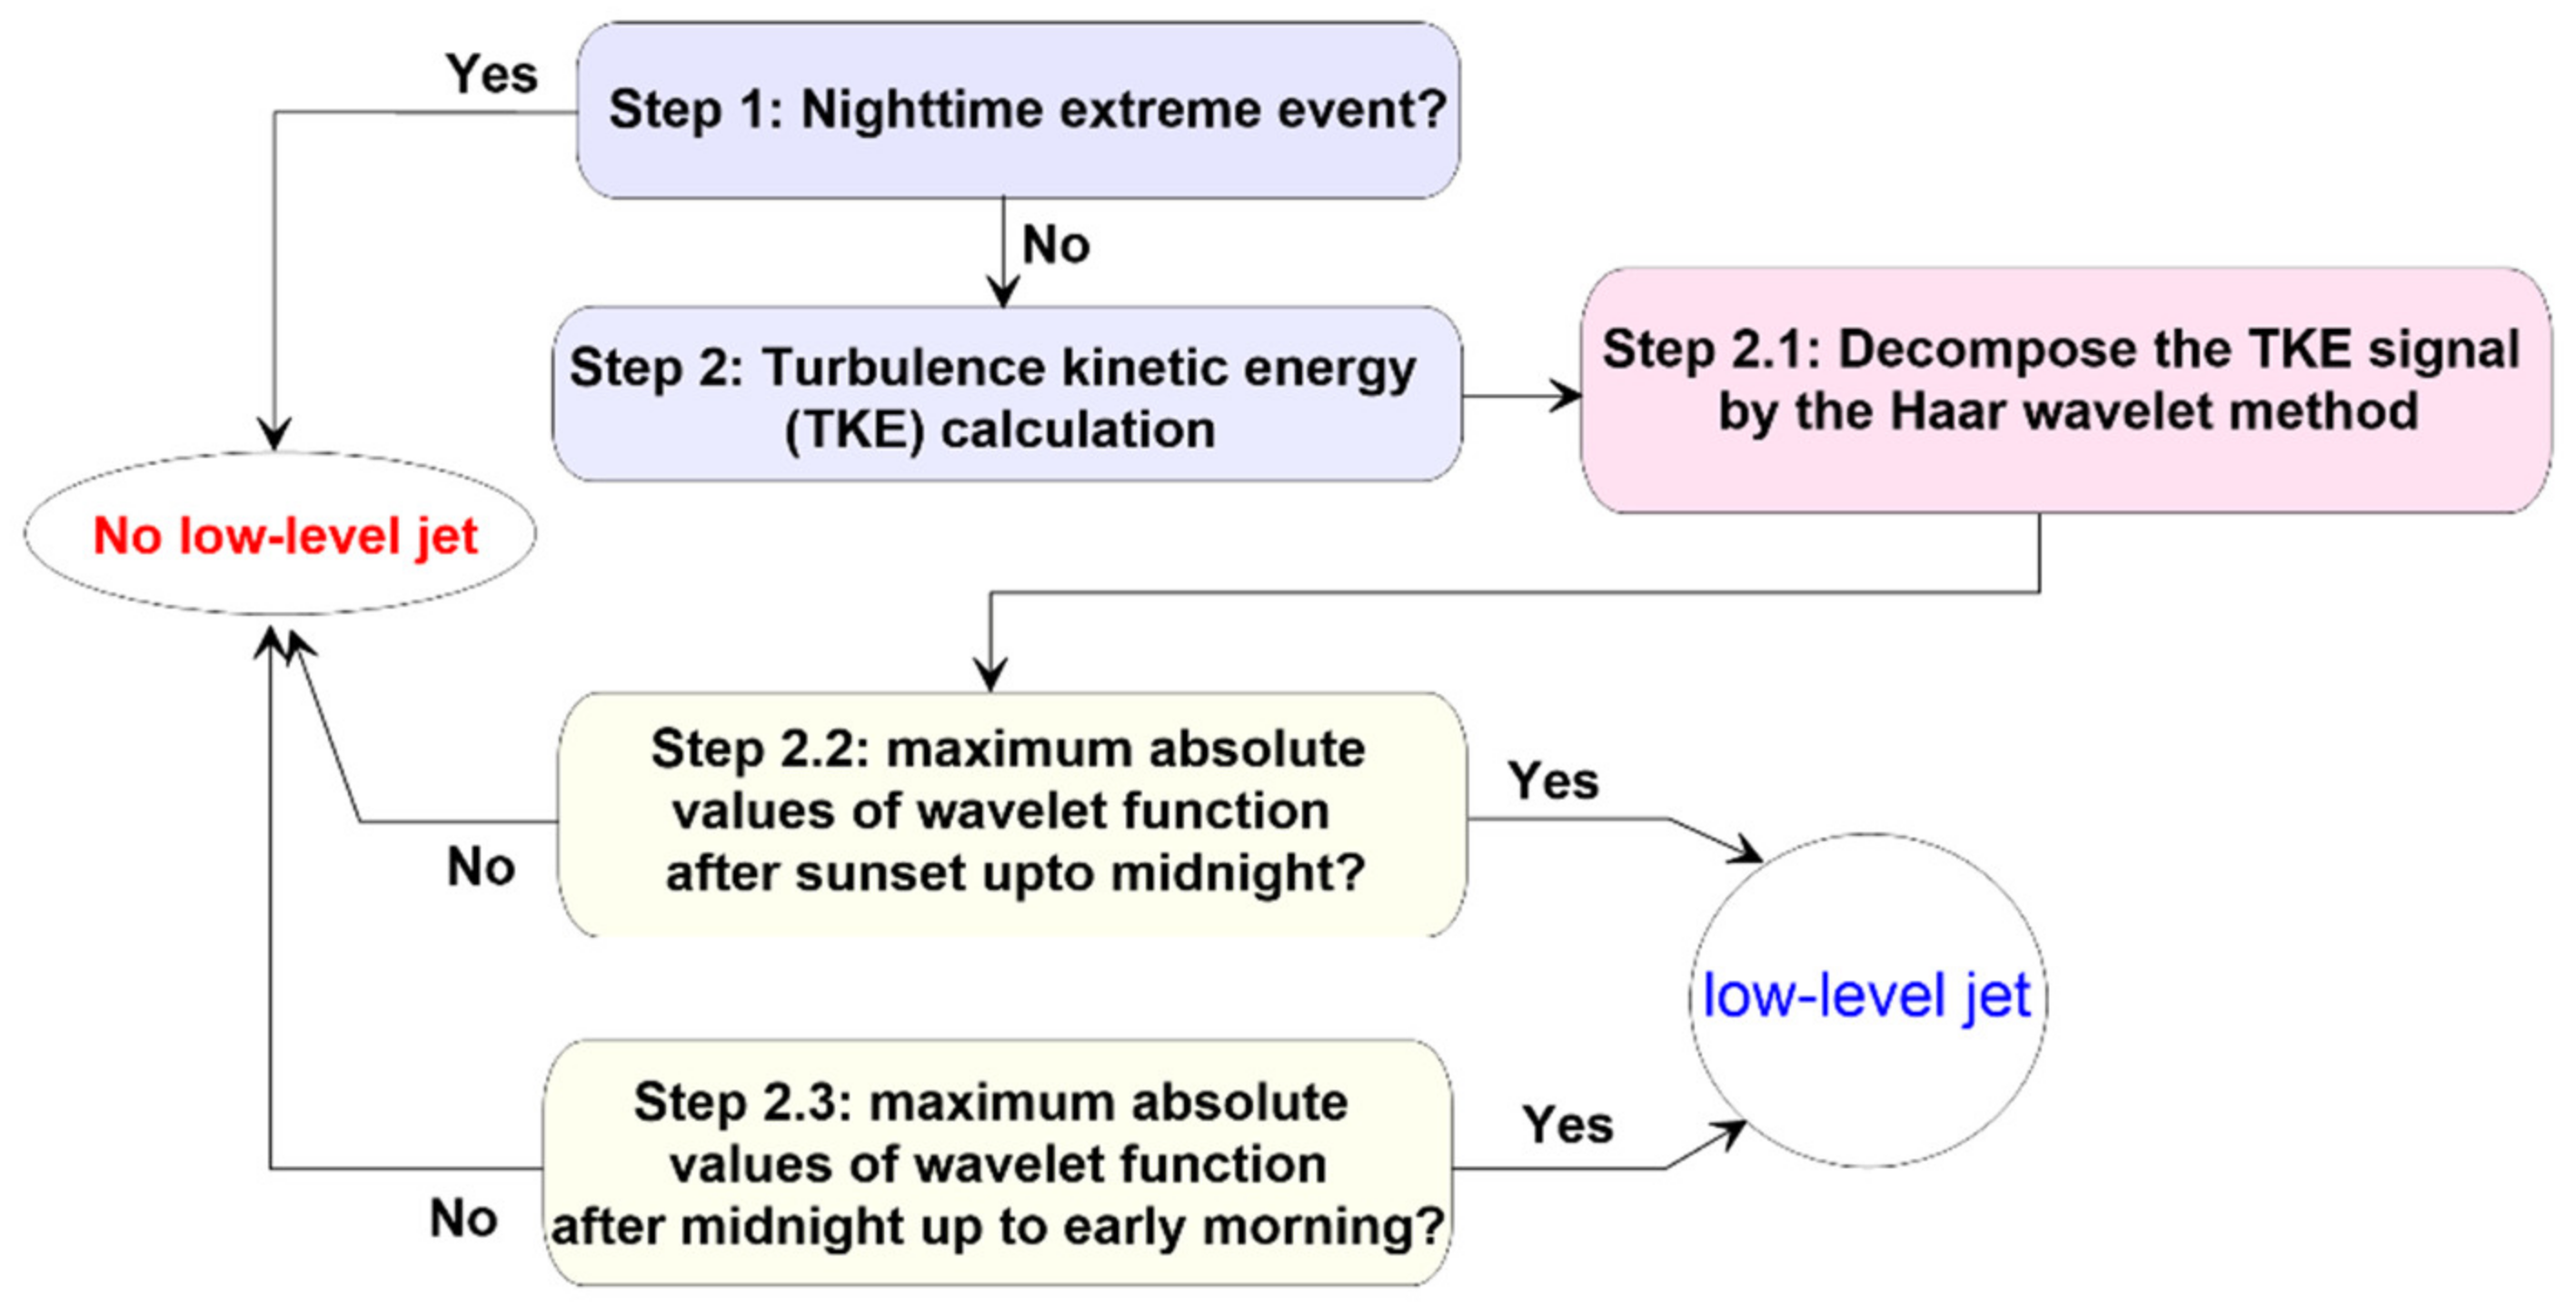
For HWTT for NLLJ detection, we used 5 filters (steps 1 to 2.3) to identify the NLLJ events (Figure 4). Since the LLJ is a nighttime event, Step 1 eliminates the extreme events. The turbulence kinetic energy (TKE) was calculated in Step 2. The decomposition of TKE was performed by the Haar wavelet function [1,36] in Step 2.1. In Steps 2.2 and 2.3, a large value of the dilation coefficient from sunset until early morning signifies the occurrence of NLLJ.
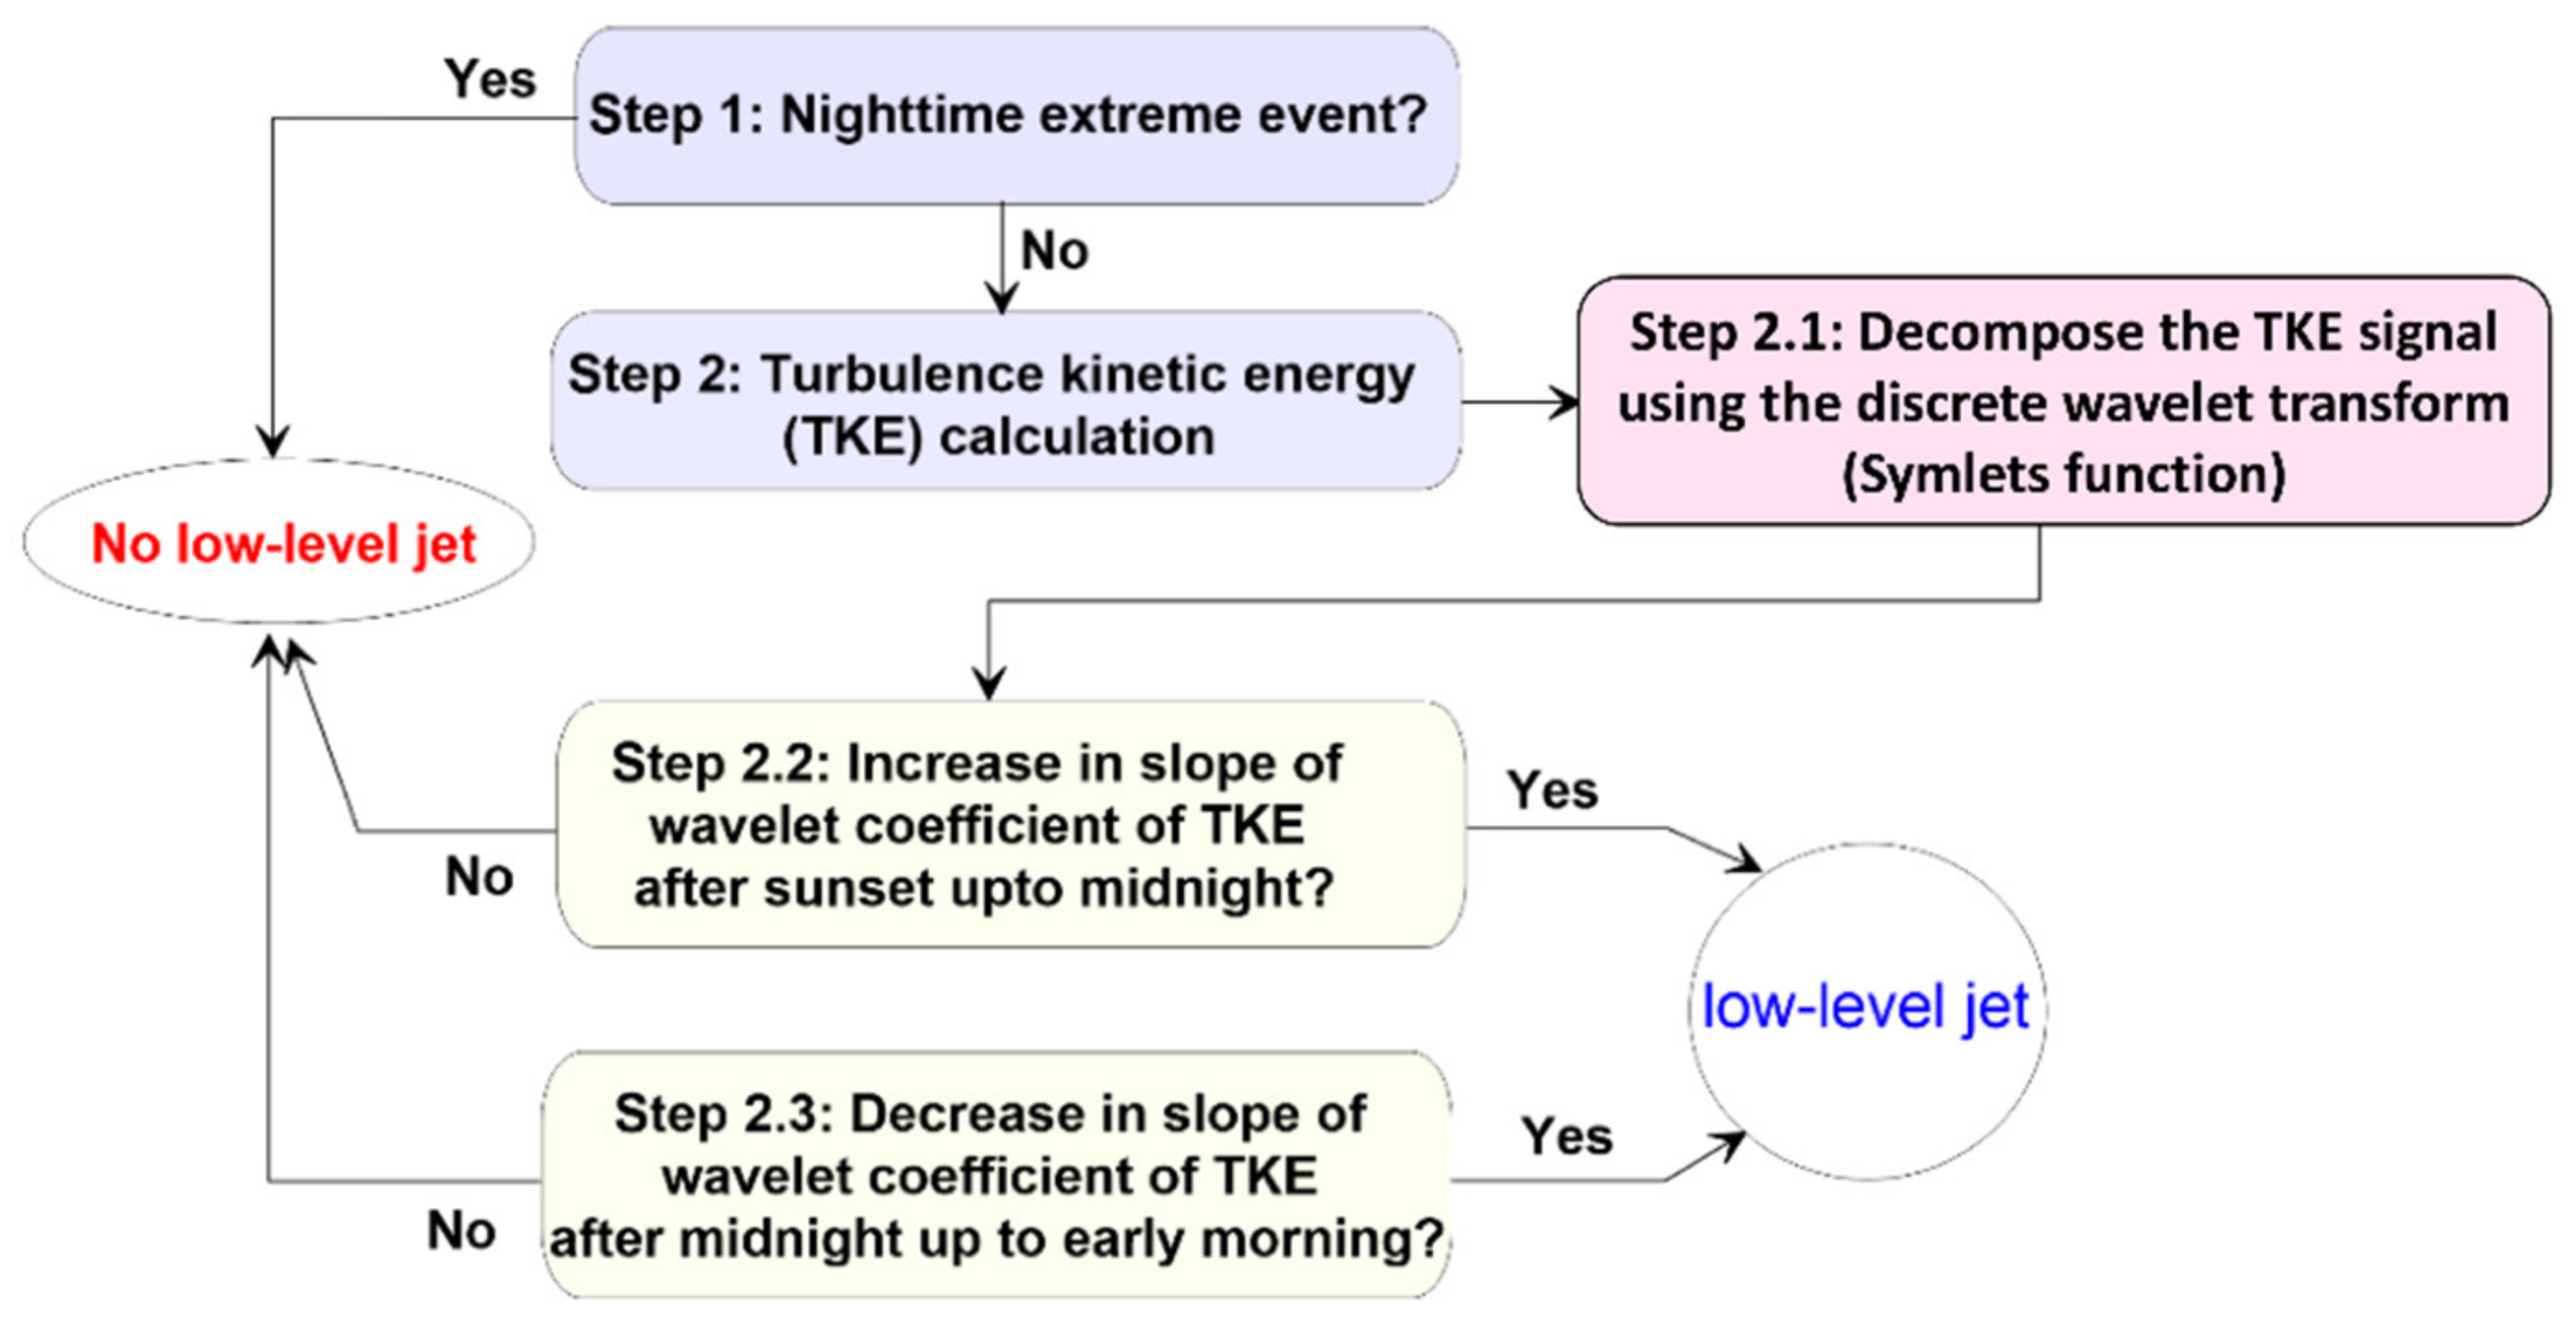
For the SWT for NLLJ detection (Figure 5), Steps 1 and 2 used in this algorithm are exactly the same as those for HWTT. However, the decomposition of the TKE signal was performed by discrete wavelet transform. Symlets mother wavelet function [37] was used to decompose the TKE signal into 4 levels of time resolution (15 min to 1 h). We tried to identify the NLLJ with all resolutions of decomposed TKE signals and found that a 1 h resolution (level 4) of the TKE signal provides optimal classification. The slope of this decomposed TKE was computed from sunset until early morning. In Steps 2.2 and 2.3, if the slope is positive from evening to midnight, and negative from midnight to early morning, it is considered a NLLJ event; otherwise, it is a non-NLLJ event.

3. Results

3.1. Sea-Breeze Classification Results

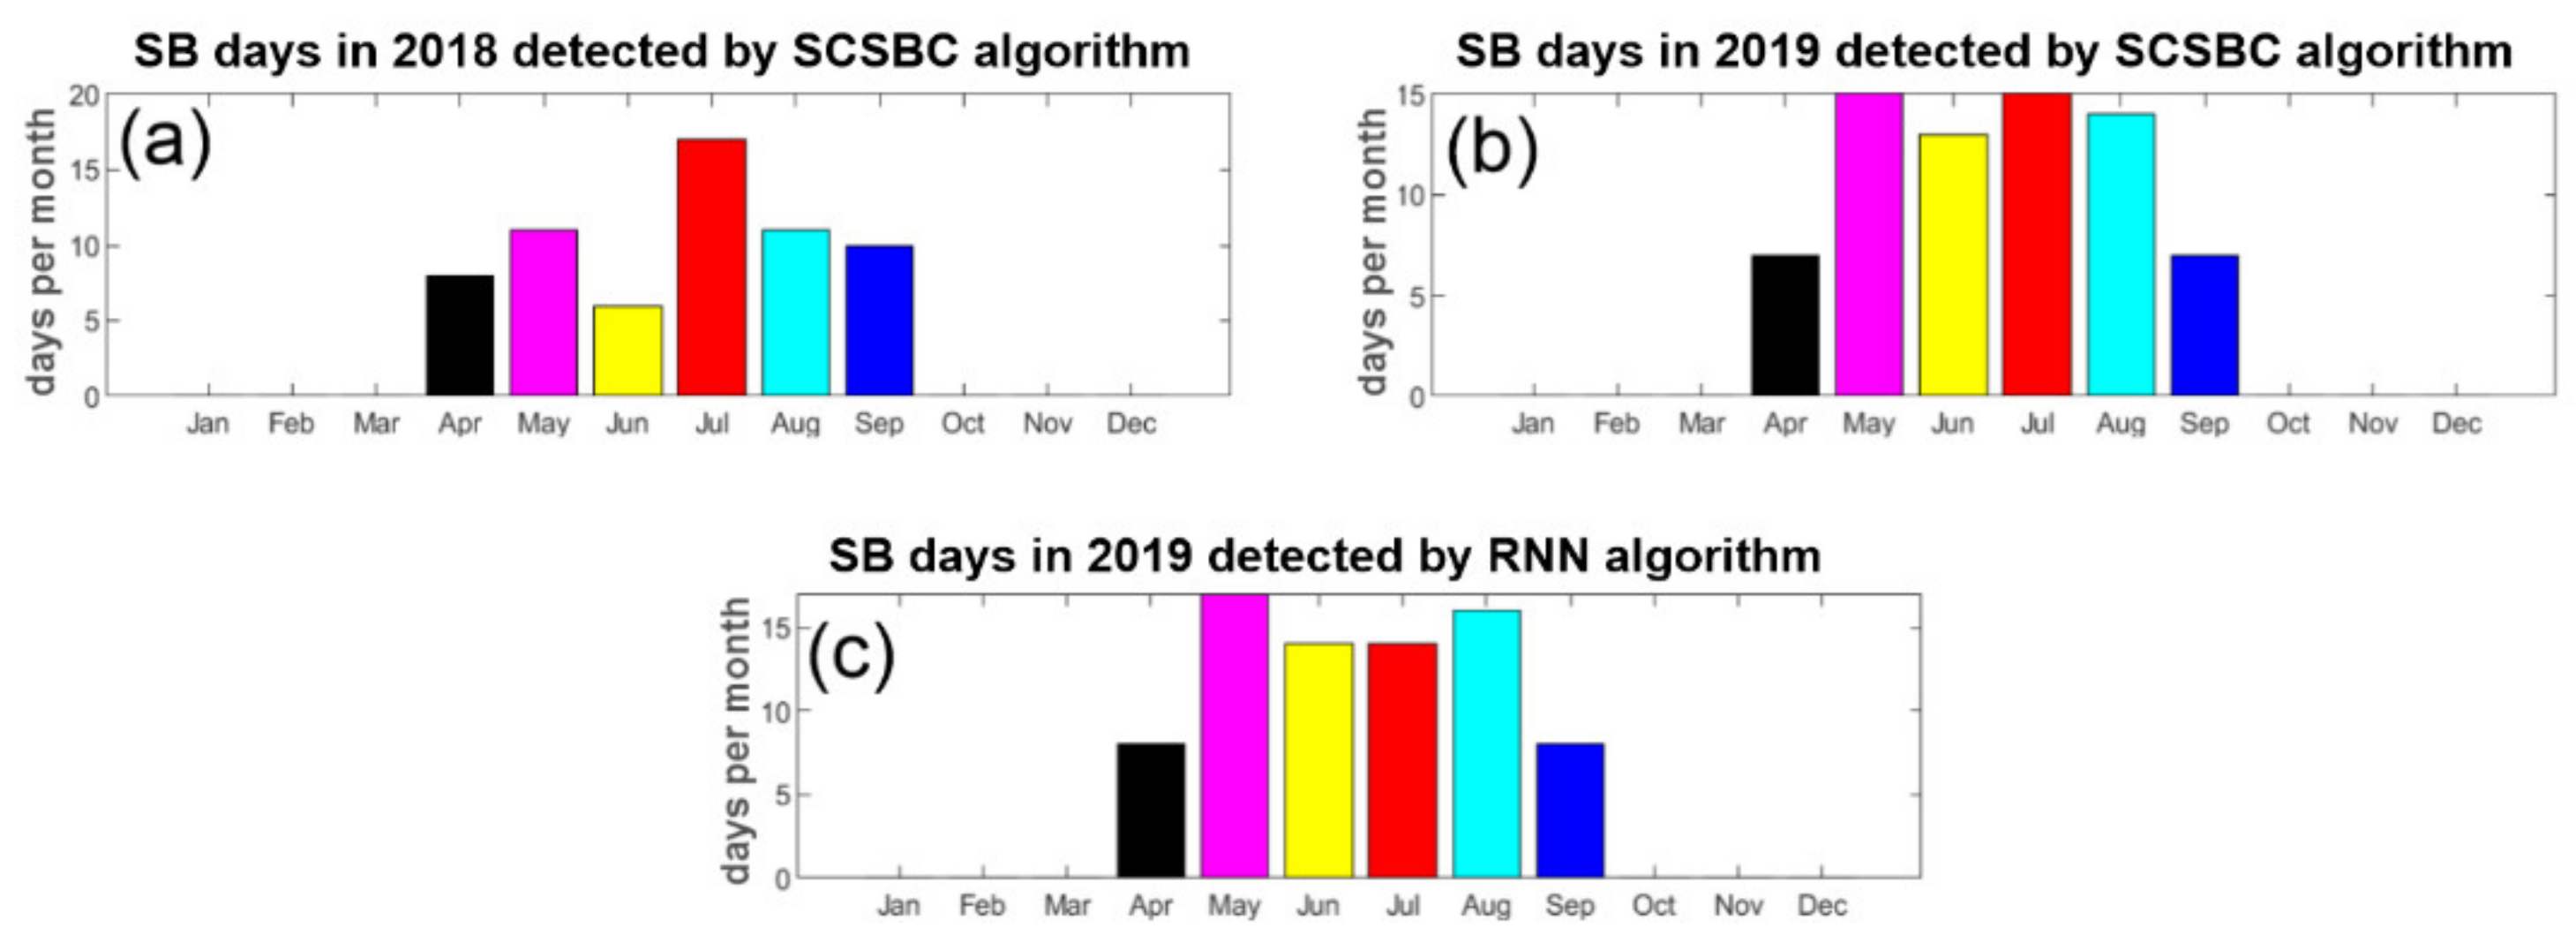
The daytime heating creates thermal contrast between the land and sea, resulting in a concentrated wind flow from the sea toward land. We identified 67 and 78 SB days in 2018 and 2019, respectively, during the summertime (Figure 6) using the SCSBC algorithm.
Furthermore, we developed an RNN algorithm using an LSTM block capable of detecting SB days. To train the network, we used the categorical SBC data from 2018. The RNN was used to classify the SB days in 2019. To validate the machine learning RNN performance, we used actual data of SBC from 2019 (Figure 7).
The average actual and predicted SBC for all SB days are shown in Figure 6. In order to check the classification performance of the RNN algorithm, three statistical metrics, namely, sensitivity, specificity, and classification accuracy, were used. The sensitivity is defined as the ratio between the classified true positive (i.e., both observation and prediction samples are positive) and the total number of samples in true class 1, whereas false negative stands for the observed samples that are positive but prediction samples are negative. Specificity can be stated as the proportion of true negative (i.e., both observation and prediction samples are negative) and the total number of samples in true class 2, whereas false positive means the observed samples are negative but prediction samples are positive. The accuracy is calculated as the ratio of true positive and negative samples to all classes. The proposed RNN algorithm is good enough, having 98% sensitivity, 91% specificity, and 95% classification accuracy. The performance of the RNN algorithm can be enhanced with a greater number of observations.
Figure 8 shows the time average of the wind speed of all SB days. For both years, the range of variation in the average wind speed (Lws = 2.9 m/s to Hws = 4.9 m/s) was to be similar, where Lws and Hws are low and high wind speed, respectively. The maximum wind speed during the SB days occurs roughly from 13:00 UTC to 17:30 UTC. We observed that the maximum average wind speed during SB events is around 5 m/s (10 m AGL).

3.2. Nocturnal Low-Level Jet Classification Results

A concentrated wind flow after sunset is known as the NLLJ. Since the NLLJ is a nighttime phenomenon, it can increase offshore wind power production during the night. Therefore, it is important to detect NLLJ phenomena in coastal regions for offshore wind turbines. We devised two automatic NLLJ detection algorithms, HWTT and SWT. Since the performance of both algorithms is quite similar, only the NLLJ classification by SWT is shown in Figure 9.
Except for October 2018 and January 2019, we found a significant occurrence of NLLJ in every month. A total of 192 and 168 NLLJ days were found in 2018 and 2019, respectively.
Figure 10 shows the hourly average of wind speed for all NLLJ days. The NLLJ events start during the evening; the wind speed increases until midnight, and then decreases. The range of average wind speed, near ground, was Lws = 3.9 m/s to Hws = 4.9 m/s in 2018 during NLLJ events. However, the range of average wind speed was Lws = 4.3 m/s to Hws = 5.2 m/s in 2019 during NLLJ events. We found that near the ground, the average wind speed increases by 1 m/s due to NLLJ during nighttime.

3.3. Validation of the Algorithms Detection

The algorithms of LLJ and SB detection were developed using only ultrasonic anemometer measurements during 2018–2019. However, in order to validate the algorithms, we exploited a statistically relevant database obtained from Vaisala WindCube lidar WLS100 measurements during an IOP of 86 days from 23 July 2021 to 16 October 2021. Hence, wind lidar measurements were used as a reference to validate the algorithms.
The RNN algorithm was validated by the SCSBC during 2019 and we ran it for the IOP. In this study, the SB criteria to determine the SB events from wind lidar measurements were the shift in wind direction from the land to the sea (<1 h) and/or the presence of the gravity current coming from the sea (NW to NE) with a change in wind direction [1]. During the IOP, 25 SB events were observed (two SB days from 23 to 31 July, eight days in August, 13 days in September, and two days in October 2021). The results obtained by the RNN algorithm are in good agreement with the observations, with 22 SB events detected (two SB days from 23 to 31 July, eight days in August, 10 days in September, and two days in October 2021).
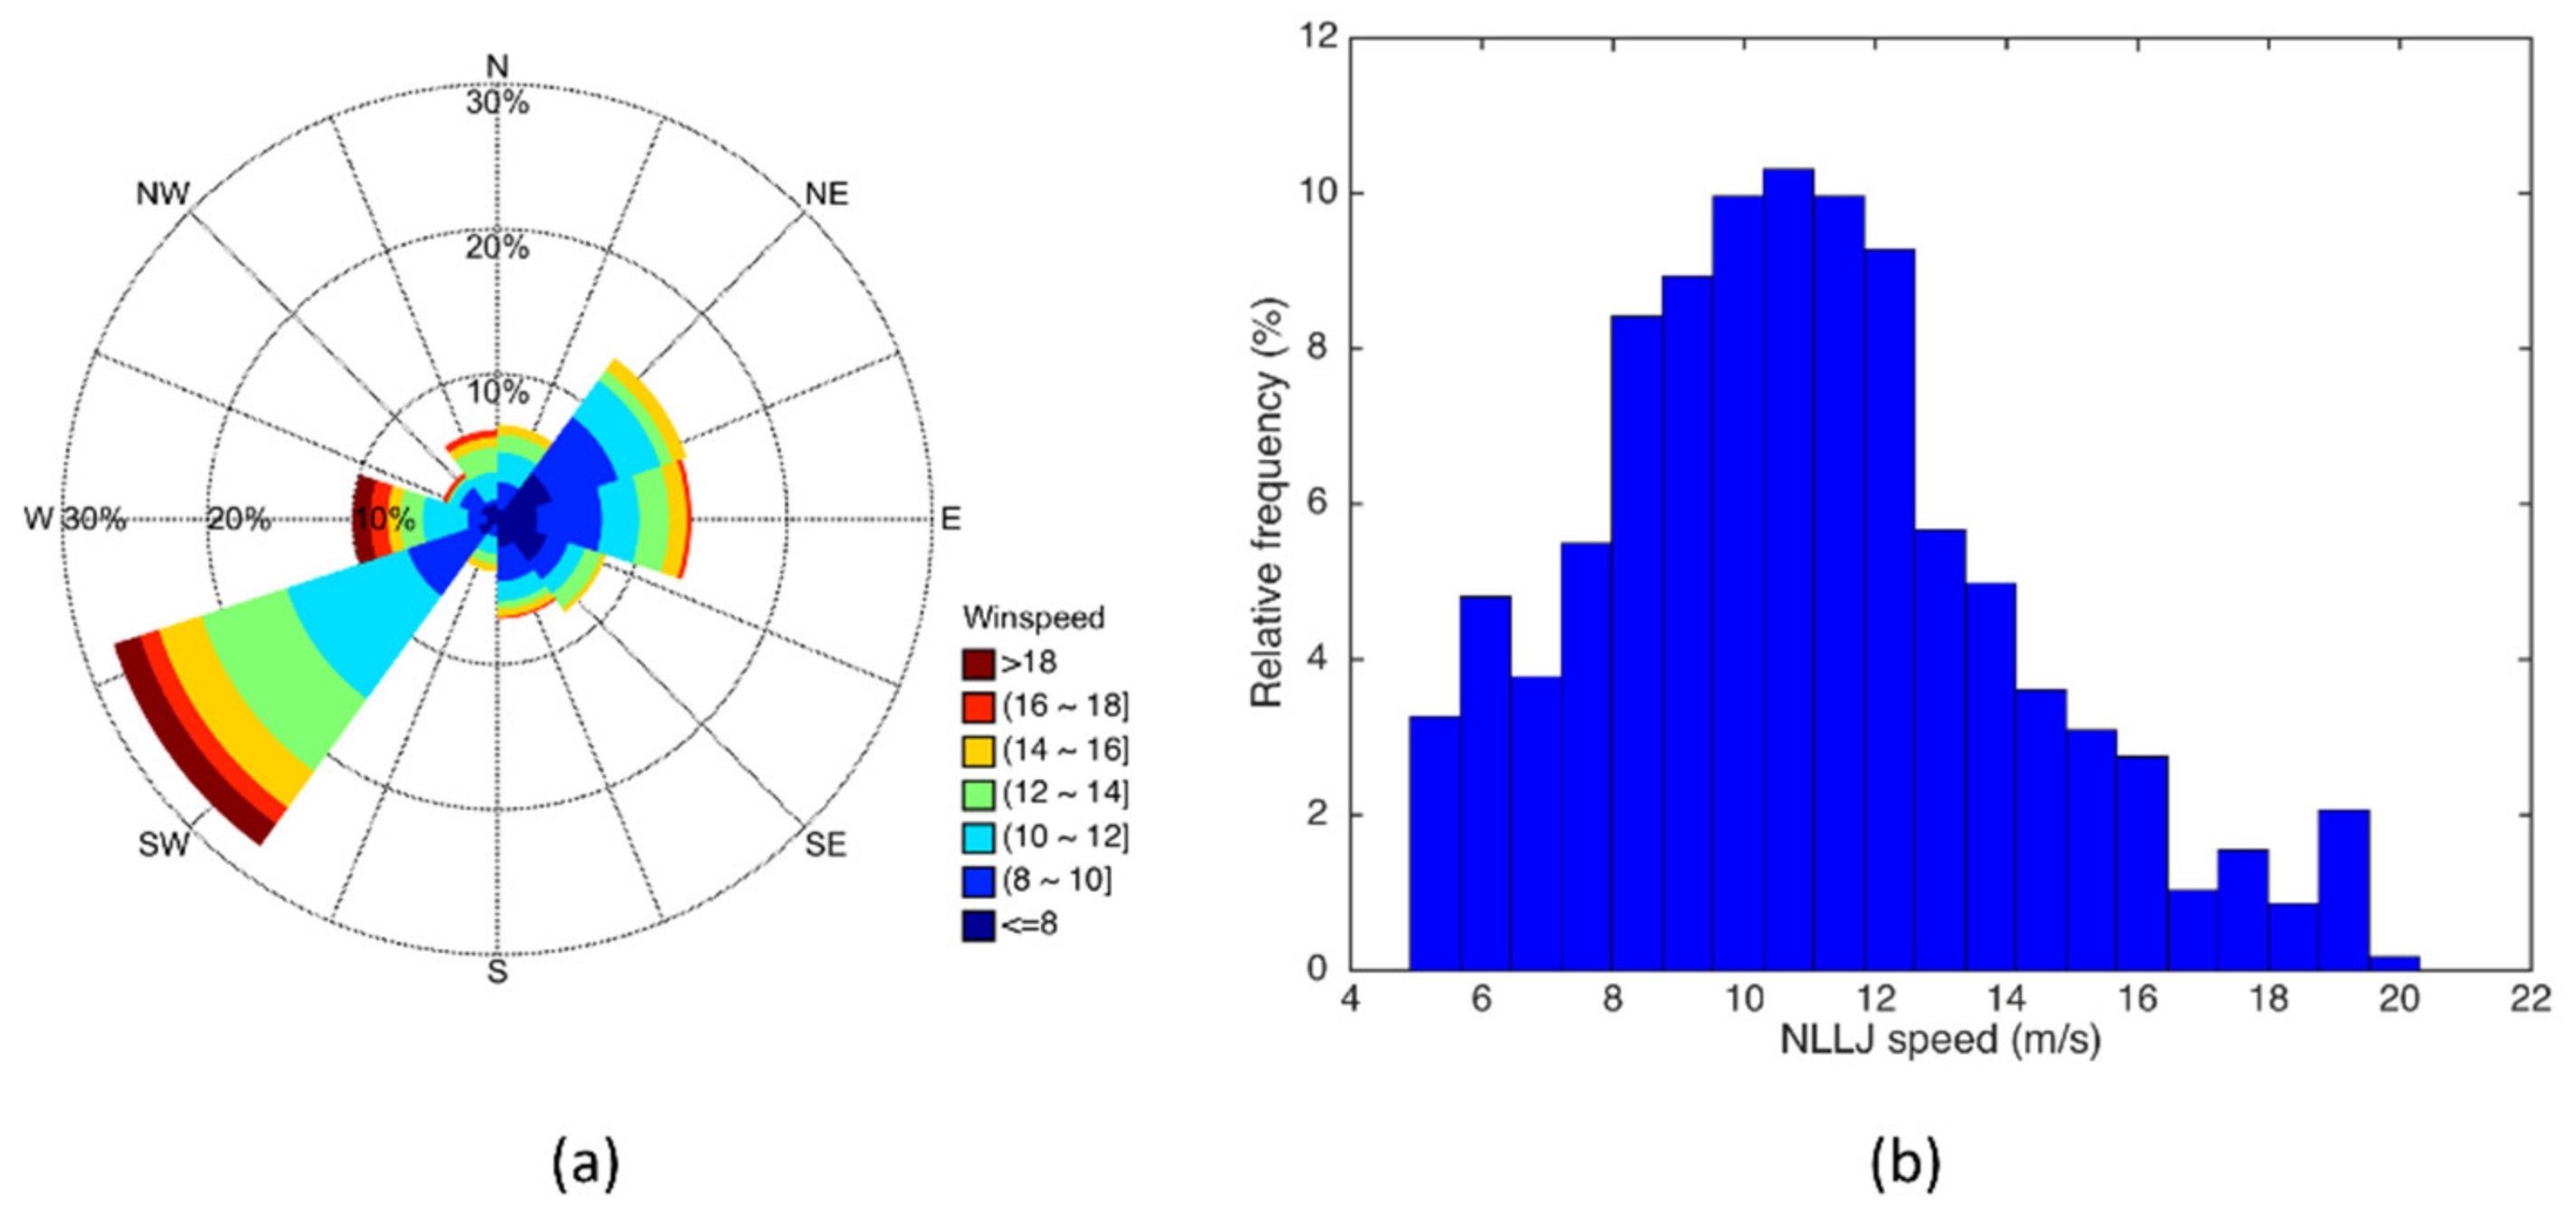
Concerning NLLJ observations, NLLJ days were identified in the horizontal wind speed lidar profile, with a maximum wind (in this study below 1000 m), and decreasing wind speeds of at least 2 m/s both below and above that height [38]. NLLJ days occurred 28% of the time (582 of 2064 measurements), corresponding to 69 NLLJ events (162 of 250). During the IOP, the mean NLLJ core height was 260 m and the maximum observation height was between 500 and 800 m, corresponding to less than 10% of the NLLJ core height detected. The average NLLJ speed (wind speed at jet core height) was 10 m/s, with a standard deviation of 3 m/s. Around 75% of LLJ core came from the land to seaward, with a maximum of 20 m/s (Figure 11a), and a range of NLLJ speed between 8 and 14 m/s (Figure 11b).
HWTT and SWT algorithms both detected 70 NLLJ events. The results show that 92% of events deduced from the HWTT algorithm are in good agreement with observations. However, the algorithm detected 70 NLLJ events, corresponding to one event more than those observed, which can be attributed to the difficulty of validating this NLLJ event during a cloudy night, which limits the maximum range of wind lidar measurements. Moreover, 573 h of NLLJ were detected by the algorithm versus 582 h of NLLJ observations. The comparison between arrival times of NLLJ observed by the lidar and deduced from the algorithm shows a linear regression equation with an intercept of −0.05, corresponding to a delay of about 1 h. The NLLJ time arrival agreed well with the observations. Moreover, comparison between the NLLJ breakdown times shows a linear regression equation with an intercept of +0.04. This means that the algorithm no longer detects the NLLJ with a gap of 1 h before the NLLJ breakdown times. Although the SW LLJ direction dominates during this IOP, both results cannot be explained by the separation distance between the anemometer and the wind lidar (located south from the anemometer). However, both results are in good agreement, with a correlation coefficient R2 of 98% between the NLLJ detected from HWTT and wind lidar measurements.

3.4. Influence of NLLJ and SB on Power Production by Wind Turbines

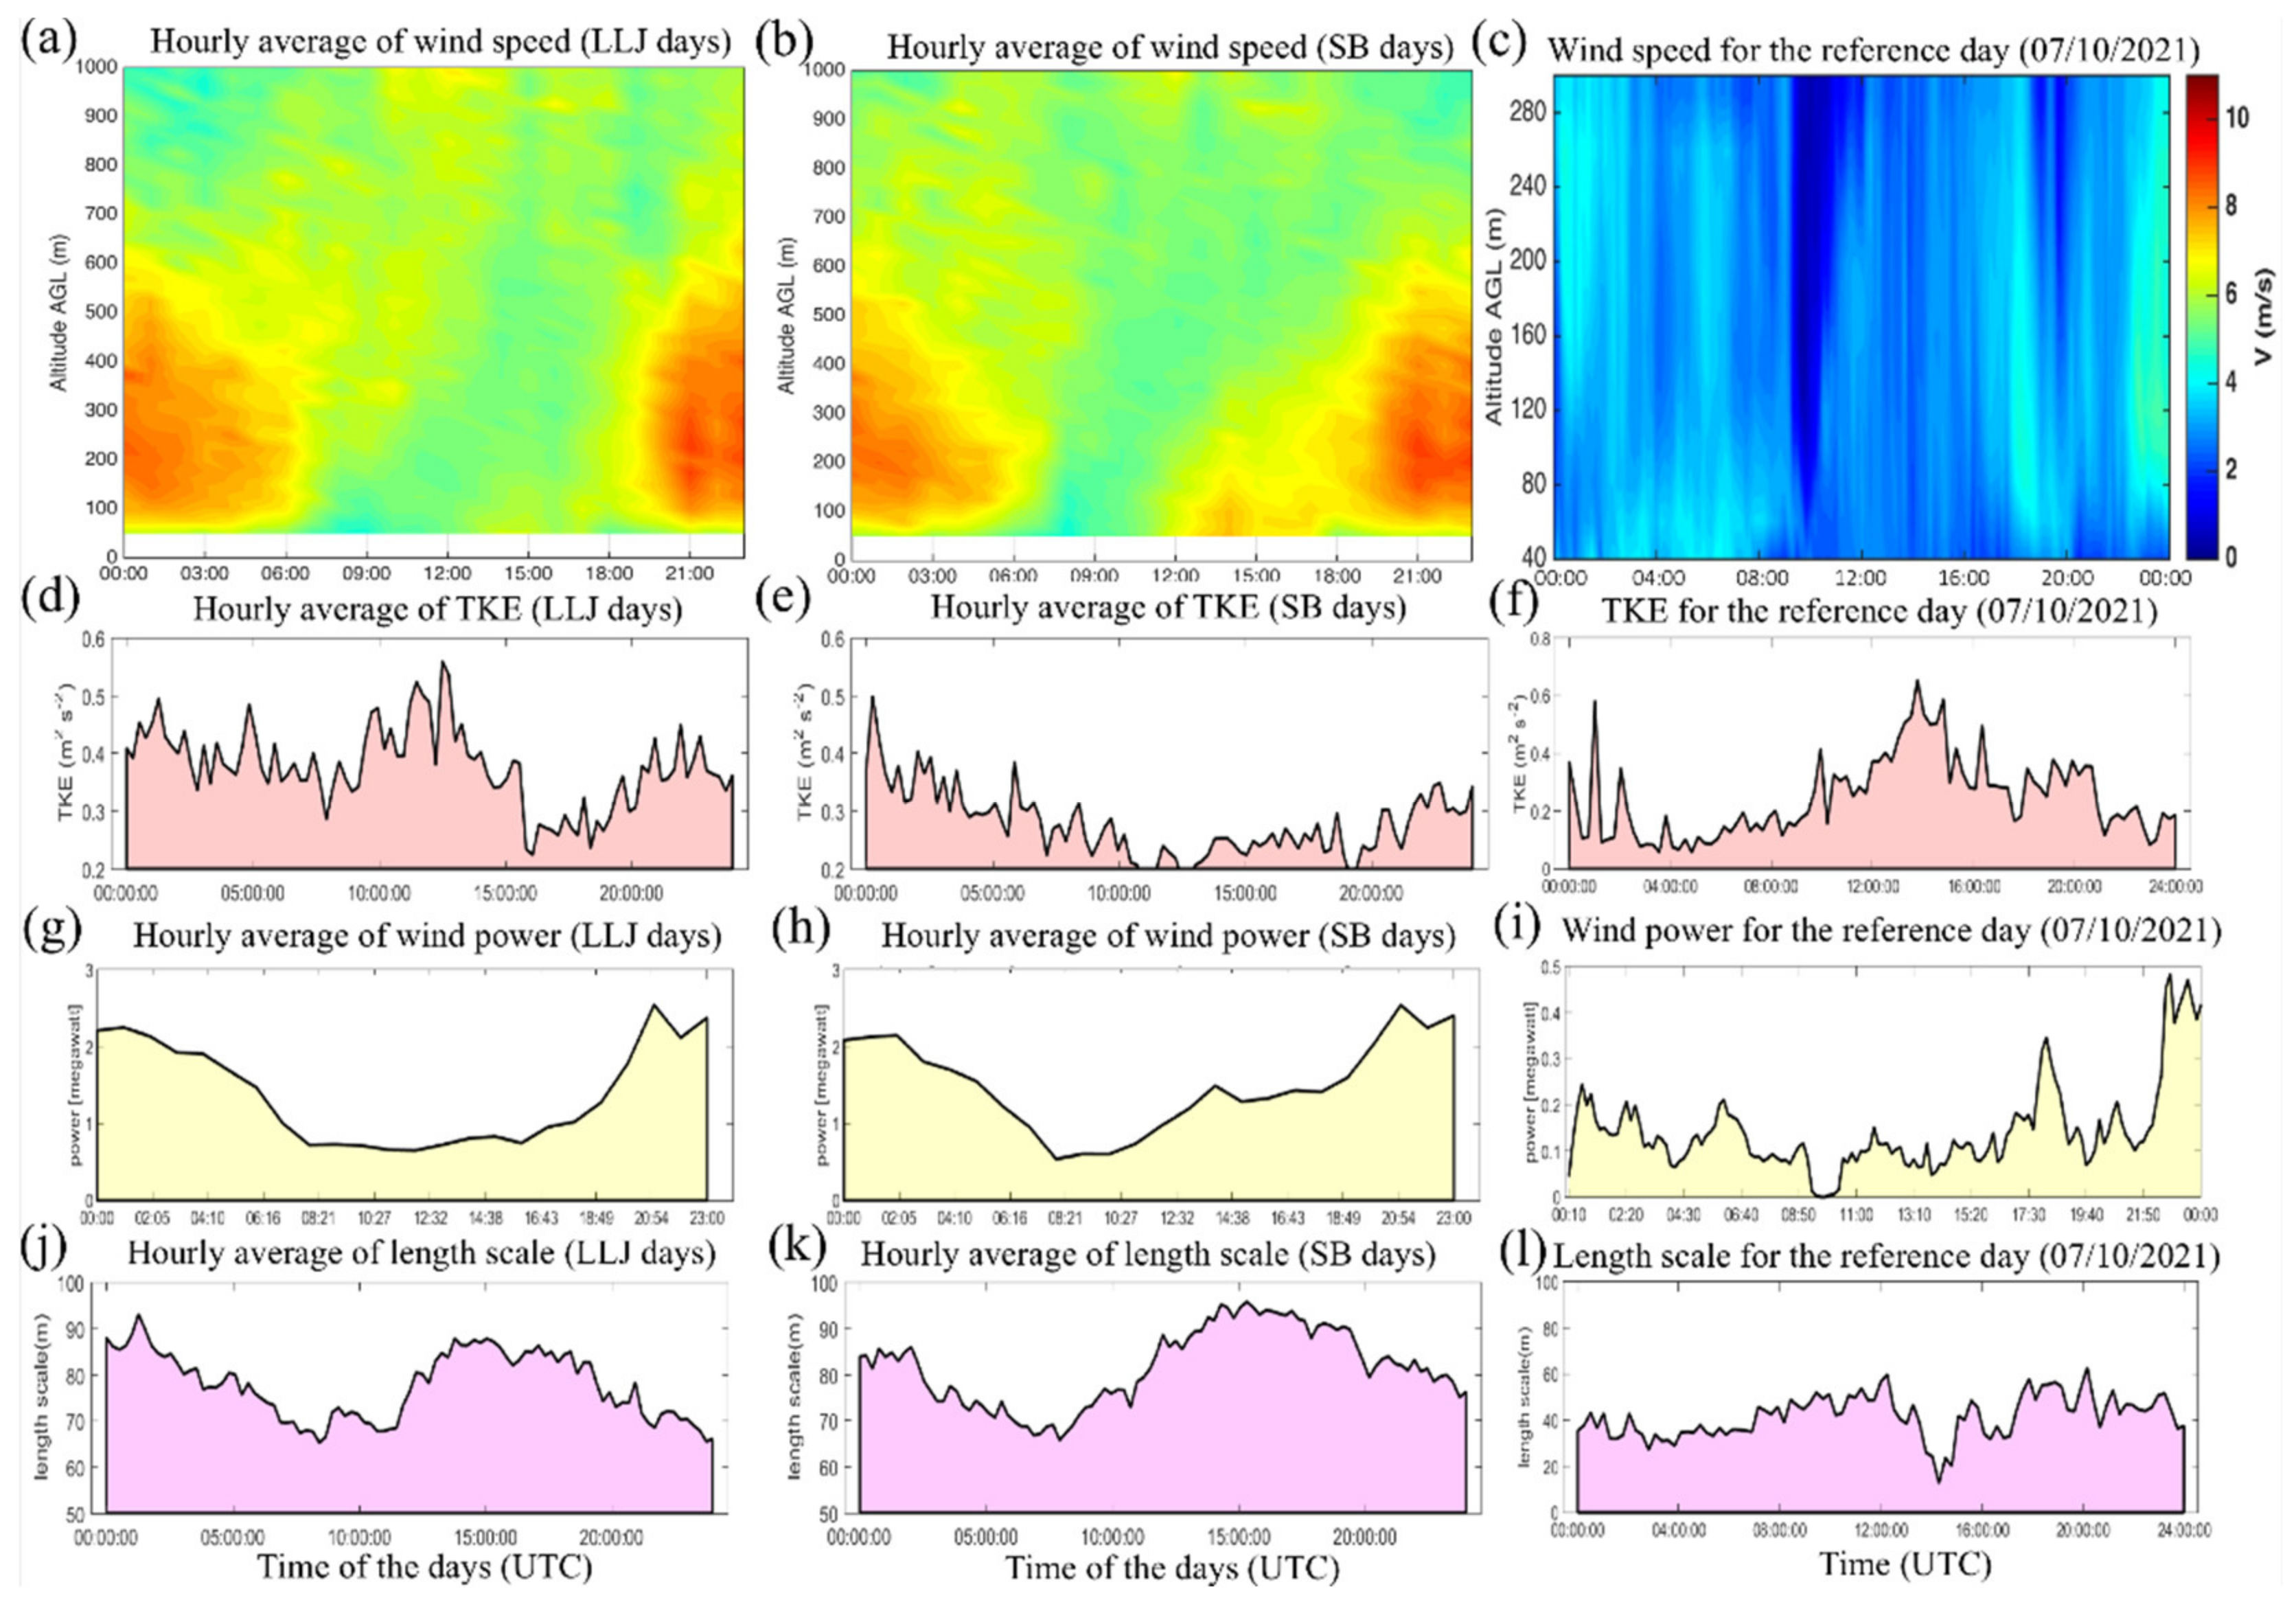
In order to illustrate the impacts of NLLJ and SB on wind turbines, the hourly average of the horizontal wind speed for each altitude below 1000 m, measured by the wind lidar during NLLJ event days (Figure 12a) and SB event days (Figure 12b) of the IOP, was plotted. The date of 7 October 2021 was selected as a representative reference day without NLLJ and SB events below 300 m (Figure 12c).
Figure 12a reveals the presence of NLLJ between 00:00 to 6:00 UTC and 18:00 to 00:00 UTC located below 600 m. During NLLJ event days, the wind speed is relatively low during the daytime, unlike for the rest of the day, during which the NLLJ jet speed can reach more than 8 m/s. The NLLJ jet core is roughly located between 75–600 m with a jet speed height around 250 m. However, the majority of the jet core seems to decrease in the early morning before dissipating during daytime. The relatively high values of TKE observed near ground during the night can be explained by the presence of wind shear located below the jet core, which generates turbulence (Figure 12d).
Regarding SB events (Figure 12b), the results appear similar to those obtained for NLLJ events but with a more pronounced wind speed zone between 10:00 and 17:00 below 200 m. This zone corresponds to SB occurrence and seems to have an influence on the NLLJ development: the latter starts about 1 h earlier compared to days without SB events. This effect was observed in previous studies which revealed that, during low synoptic wind speeds, SB can occur, creating a LLJ [9,19,39]. This one-hour earlier arrival time of NLLJ may be explained by the fact that during SB events, the TKE is relatively low (Figure 12e), in comparison to the NLLJ event days (Figure 12d) and the reference day (Figure 12f); this may favor earlier formation of an inversion layer formation. Indeed, the daytime TKE low values may be due to the advection of cooling air coming from the sea toward the land. Therefore, the SB gravity current may support the development of surface temperature inversion, leading to the decoupling effect, which may favor the formation of the NLLJ.
The wind power production was estimated for a wind turbine with a height range of about 100–150 m. The power was calculated as:
P o w e r = π 2 r 2 U R e s 3 ρ φ ,  
where r is the rotor radius, U R e s is the rotor equivalent wind speed, ρ is air density, and φ is the efficiency factor; we used φ = 40 % for all calculations.
The rotor equivalent wind speed can be calculated as [40]:
U R e s = i = 1 n h U i 3 i , 1 / 3
where n h is the measurement height, U i   is the average wind speed for the i t h segment, is the total rotor swept area, i ( = H i H i + 1 H d H ) is the area of the i t h segment, where H = 2 r 2 H H h u b 2 , r is the rotor radius, and H h u b is the hub height.
Figure 12g shows that the hourly average maximum power ( 2.5 megawatts) can be achieved at 21:00 UTC during the NLLJ events. Hence, the maximum hourly average estimated peak power generation is approximately 5 times higher than that of the reference day (Figure 12i). The hourly average SB events are mainly observed between 10:00 and 17:00 UTC. Then, during the SB events, the hourly average estimated peak power generation can be up to 2.5 times higher than that of the reference day.
The hourly average integral length scale (Lu), deduced near ground, has a similar evolution as that of the hourly average power production during the NLLJ (Figure 12j) and SB (Figure 12k) events, and the reference day (Figure 12l). Lu is the length of the largest eddy at the measurement location. An increment in Lu was observed within the NLLJ shear layer and the SB gravity current at the beginning of the NLLJ and SB occurrences. Moreover, the Lu during the NLLJ is 1.25 times larger than that of SB, which is 1.5 times larger than Lu of the reference day. By comparing all parameters used in this study, it was found that the ultrasonic anemometer measurements are useful for identifying NLLJ and SB events.

4. Conclusions

In this study, we assessed the wind measurements with the aim to identify SB and NLLJ meteorological events in the north of France. Measurements were mainly taken using an ultrasonic anemometer in the coastal region of Dunkerque. We developed four algorithms to identify NLLJ and SB days: Sign Change of Sea-Breeze Component (SCSBC), recurrent neural network (RNN) for SB, Haar wavelet threshold technique for NLLJ (HWTT), and Symlets wavelet slope technique for NLLJ (SWT).
These algorithms successfully identified the SB and NLLJ days. Some significant results obtained from the analysis are the following:
  • The proposed RNN algorithm is good enough for SB identification, having 98% sensitivity, 91% specificity, and 95% classification accuracy.
  • The results obtained from the RNN algorithm are in good agreement with the independent lidar observations and show that 88% of SB events were detected during the 86-day IOP.
  • Regarding NLLJ, the proposed algorithms (HWTT and SWT) detected a similar number of NLLJ events, with a R2 of 0.98 between the NLLJ detected from HWTT and that from wind lidar measurement.
  • During the NLLJ events, the estimated maximum hourly average peak power generation was approximately 5 times higher than that of the reference day, and the peak power generation was 2.5 times higher during the SB events.
  • The integral length scale during the NLLJ was found to be 1.25 times larger than that during SB events. Furthermore, the integral length scale during the SB was 1.6 times larger than that expected for a reference day.

Author Contributions

Conceptualization, P.A. and A.S.; methodology, S.R., P.A., M.F. and A.S.; software, S.R., M.F., P.A.; validation, S.R., P.A., M.F. and A.S.; formal analysis, S.R., P.A., M.F. and A.S.; investigation, S.R., P.A., M.F. and A.S.; data curation, S.R., P.A., M.F. and A.S.; writing—original draft preparation, S.R., P.A. and A.S.; writing—review and editing, S.R., P.A., M.F. and A.S.; visualization, S.R., P.A., M.F. and A.S.; supervision, P.A. and A.S.; project administration, P.A. and A.S.; funding acquisition, P.A. and A.S. All authors have read and agreed to the published version of the manuscript.

Funding

This research was funded by EDF Renouvelables/EMD, by the Université du Littoral Côte d’Opale, by the Pôle de Recherche MTE, by the SFR Campus de la Mer, by the Institut de Recherches Pluridisciplinaires en Sciences de l’Environnement, by the Région «Hauts de France» and the Ministère de l’Enseignement Supérieur et de la Recherche (CPER IRenE and Climibio), by the European Fund for Regional Economic Development, by the Labex CaPPA (Chemical and Physical Properties of the Atmosphere), which is funded by the French National Research Agency through the PIA (Programme d’Investissement d’Avenir) under contract “ANR-11-LABX-0005-01”.

Acknowledgments

The authors would like to thank the Ministère de la Mer, the Direction interrégionale de la mer Manche Est - Mer du Nord, the Phares et Balises de Dunkerque for the permission to operate the field campaign in the front of coastal line of Dunkerque. The authors graciously acknowledge the efforts of our collaborators Caroline Piguet, Cedric Dallozzo (EDF Renouvelables), Anaïs Zamiara, Sébastien Lefèbvre (SFR Campus de la Mer), Véronique Vanvincq (UCEIV, Pôle MTE), Arnaud Cuisset, Dominique Schneider, Benoit Escorne (Pôle MTE), Julien Ratynski (LPCA), Fabien Marteel and Jérôme Parmentier (Service Technique du CGU de Dunkerque).

Conflicts of Interest

The authors declare no conflict of interest.

Abbreviations

NLLJNocturnal Low-Level Jet
SBSea Breeze
AGLAbove Ground Level
RNNRecurrent Neural Network
IOPIntensive Observation Period
TKETurbulence Kinetic Energy
HWTTHaar Wavelet Threshold Technique
SWTSymlets Wavelet slope Technique
SCSBCSign Change of Sea-Breeze Component
LSTMLong Short-Term Memory
ADAMADAptive Momentum estimator

References

  1. Augustin, P.; Billet, S.; Crumeyrolle, S.; Deboudt, K.; Dieudonné, E.; Flament, P.; Fourmentin, M.; Guilbaud, S.; Hanoune, B.; Landkocz, Y.; et al. Impact of Sea Breeze Dynamics on Atmospheric Pollutants and Their Toxicity in Industrial and Urban Coastal Environments. Remote Sens. 2020, 12, 648. [Google Scholar] [CrossRef] [Green Version]
  2. Mazon, J.; Rojas, J.I.; Jou, J.; Valle, A.; Olmeda, D.; Sanchez, C. An Assessment of the Sea Breeze Energy Potential Using Small Wind Turbines in Peri-Urban Coastal Areas. J. Wind Eng. Ind. Aerodyn. 2015, 139, 1–7. [Google Scholar] [CrossRef] [Green Version]
  3. Roy, S.; Sentchev, A.; Fourmentin, M.; Augustin, P. Turbulence of Landward and Seaward Wind during Sea-Breeze Days within the Lower Atmospheric Boundary Layer. Atmosphere 2021, 12, 1563. [Google Scholar] [CrossRef]
  4. Augustin, P.; Delbarre, H.; Lohou, F.; Campistron, B.; Puygrenier, V.; Cachier, H.; Lombardo, T. Investigation of Local Meteorological Events and Their Relationship with Ozone and Aerosols during an ESCOMPTE Photochemical Episode. Ann. Geophys. 2006, 24, 2809–2822. [Google Scholar] [CrossRef] [Green Version]
  5. Crumeyrolle, S.; Augustin, P.; Rivellini, L.-H.; Choël, M.; Riffault, V.; Deboudt, K.; Fourmentin, M.; Dieudonné, E.; Delbarre, H.; Derimian, Y.; et al. Aerosol Variability Induced by Atmospheric Dynamics in a Coastal Area of Senegal, North-Western Africa. Atmos. Environ. 2019, 203, 228–241. [Google Scholar] [CrossRef]
  6. Miller, S.T.K. Sea Breeze: Structure, Forecasting, and Impacts. Rev. Geophys. 2003, 41, 1011. [Google Scholar] [CrossRef] [Green Version]
  7. Banta, R.M.; Pichugina, Y.L.; Brewer, W.A. Turbulent Velocity-Variance Profiles in the Stable Boundary Layer Generated by a Nocturnal Low-Level Jet. J. Atmos. Sci. 2006, 63, 2700–2719. [Google Scholar] [CrossRef] [Green Version]
  8. Baas, P.; Bosveld, F.C.; Baltink, H.K.; Holtslag, A.A.M. A Climatology of Nocturnal Low-Level Jets at Cabauw. J. Appl. Meteorol. Climatol. 2009, 48, 1627–1642. [Google Scholar] [CrossRef]
  9. Wagner, D.; Steinfeld, G.; Witha, B.; Wurps, H.; Reuder, J. Low Level Jets over the Southern North Sea. Meteorol. Z. 2019, 28, 389–415. [Google Scholar] [CrossRef]
  10. Schulz-Stellenfleth, J.; Emeis, S.; Dörenkämper, M.; Bange, J.; Cañadillas, B.; Neumann, T.; Schneemann, J.; Weber, I.; zum Berge, K.; Platis, A.; et al. Coastal Impacts on Offshore Wind Farms—A Review Focussing on the German Bight Area. Meteorol. Z. 2022, 31, 289–315. [Google Scholar] [CrossRef]
  11. Davis, P.A. Development and Mechanisms of the Nocturnal Jet. Meteorol. Appl. 2000, 7, 239–246. [Google Scholar] [CrossRef]
  12. Larsén, X.G.; Fischereit, J. A Case Study of Wind Farm Effects Using Two Wake Parameterizations in the Weather Research and Forecasting (WRF) Model (V3.7.1) in the Presence of Low-Level Jets. Geosci. Model Dev. 2021, 14, 3141–3158. [Google Scholar] [CrossRef]
  13. Rausch, T.; Cañadillas, B.; Hampel, O.; Simsek, T.; Tayfun, Y.B.; Neumann, T.; Siedersleben, S.; Lampert, A. Wind Lidar and Radiosonde Measurements of Low-Level Jets in Coastal Areas of the German Bight. Atmosphere 2022, 13, 839. [Google Scholar] [CrossRef]
  14. Kumar, R.; Stallard, T.; Stansby, P.K. Large-scale Offshore Wind Energy Installation in Northwest India: Assessment of Wind Resource Using Weather Research and Forecasting and Levelized Cost of Energy. Wind Energy 2021, 24, 174–192. [Google Scholar] [CrossRef]
  15. Seroka, G.; Fredj, E.; Kohut, J.; Dunk, R.; Miles, T.; Glenn, S. Sea Breeze Sensitivity to Coastal Upwelling and Synoptic Flow Using Lagrangian Methods. J. Geophys. Res. Atmos. 2018, 123, 9443–9461. [Google Scholar] [CrossRef]
  16. Garvine, R.W.; Kempton, W. Ssessing the Wind Field over the Continental Shelf as a Resource for Electric Power. J. Mar. Res. 2008, 66, 751–773. [Google Scholar] [CrossRef]
  17. Steele, C.J.; Dorling, S.R.; Von Glasow, R.; Bacon, J. Modelling Sea-Breeze Climatologies and Interactions on Coasts in the Southern North Sea: Implications for Offshore Wind Energy. Q. J. R. Meteorol. Soc. 2015, 141, 1821–1835. [Google Scholar] [CrossRef] [Green Version]
  18. Holtslag, M.C.; Bierbooms, W.A.A.M.; van Bussel, G.J.W. Validation of Surface Layer Similarity Theory to Describe Far Offshore Marine Conditions in the Dutch North Sea in Scope of Wind Energy Research. J. Wind Eng. Ind. Aerodyn. 2015, 136, 180–191. [Google Scholar] [CrossRef]
  19. Angevine, W.M.; Tjernström, M.; Žagar, M. Modeling of the Coastal Boundary Layer and Pollutant Transport in New England. J. Appl. Meteorol. Climatol. 2006, 45, 137–154. [Google Scholar] [CrossRef]
  20. Filho, L.M.; Roebeling, P.; Villasante, S.; Bastos, M.I. Ecosystem Services Values and Changes across the Atlantic Coastal Zone: Considerations and Implications. Mar. Policy 2022, 145, 105265. [Google Scholar] [CrossRef]
  21. Tsiringakis, A.; Theeuwes, N.E.; Barlow, J.F.; Steeneveld, G.-J. Interactions Between the Nocturnal Low-Level Jets and the Urban Boundary Layer: A Case Study over London. Bound. Layer Meteorol. 2022, 183, 249–272. [Google Scholar] [CrossRef]
  22. Sullivan, J.T.; Rabenhorst, S.D.; Dreessen, J.; McGee, T.J.; Delgado, R.; Twigg, L.; Sumnicht, G. Lidar Observations Revealing Transport of O3 in the Presence of a Nocturnal Low-Level Jet: Regional Implications for “next-Day” Pollution. Atmos. Environ. 2017, 158, 160–171. [Google Scholar] [CrossRef]
  23. Corsmeier, U.; Kossmann, M.; Kalthoff, N.; Sturman, A. Temporal Evolution of Winter Smog within a Nocturnal Boundary Layer at Christchurch, New Zealand. Meteorol. Atmos. Phys. 2006, 91, 129–148. [Google Scholar] [CrossRef]
  24. Tucker, S.C.; Banta, R.M.; Langford, A.O.; Senff, C.J.; Brewer, W.A.; Williams, E.J.; Lerner, B.M.; Osthoff, H.D.; Hardesty, R.M. Relationships of Coastal Nocturnal Boundary Layer Winds and Turbulence to Houston Ozone Concentrations during TexAQS 2006. J. Geophys. Res. 2010, 115, D10304. [Google Scholar] [CrossRef]
  25. Hill, S.I.; Desobry, F.; Garnsey, E.W.; Chong, Y.-F. The Impact on Energy Consumption of Daylight Saving Clock Changes. Energy Policy 2010, 38, 4955–4965. [Google Scholar] [CrossRef]
  26. Nanopoulos, A.; Alcock, R.; Manolopoulos, Y. Feature-Based Classification of Time-Series Data. Int. J. Comput. Res. 2001, 10, 49–61. [Google Scholar]
  27. Lines, J.; Taylor, S.; Bagnall, A. Time Series Classification with HIVE-COTE: The Hierarchical Vote Collective of Transformation-Based Ensembles. ACM Trans. Knowl. Discov. Data 2018, 12, 1–35. [Google Scholar] [CrossRef] [Green Version]
  28. Koley, B.; Dey, D. An Ensemble System for Automatic Sleep Stage Classification Using Single Channel EEG Signal. Comput. Biol. Med. 2012, 42, 1186–1195. [Google Scholar] [CrossRef]
  29. Sokolov, A.; Dmitriev, E.; Gengembre, C.; Delbarre, H. Automated Classification of Regional Meteorological Events in a Coastal Area Using In Situ Measurements. J. Atmos. Ocean. Technol. 2020, 37, 723–739. [Google Scholar] [CrossRef]
  30. Wang, Z.; Yan, W.; Oates, T. Time Series Classification from Scratch with Deep Neural Networks: A Strong Baseline. In Proceedings of the 2017 International Joint Conference on Neural Networks (IJCNN), Anchorage, AK, USA, 14–19 May 2017; pp. 1578–1585. [Google Scholar]
  31. Cui, Z.; Chen, W.; Chen, Y. Multi-Scale Convolutional Neural Networks for Time Series Classification. arXiv 2016. [Google Scholar] [CrossRef]
  32. Roy, S.; Sentchev, A.A.; Schmitt, F.G.; Augustin, P.; Fourmentin, M. Impact of Nocturnal Low-Level Jet and Orographic Waves on the Turbulent Motions and Energy Fluxes in the Lower Atmospheric Boundary Layer. Bound. Layer Meteorol. 2021, 180, 527–542. [Google Scholar] [CrossRef]
  33. Golzio, A.; Bollati, I.M.; Ferrarese, S. An Assessment of Coordinate Rotation Methods in Sonic Anemometer Measurements of Turbulent Fluxes over Complex Mountainous Terrain. Atmosphere 2019, 10, 324. [Google Scholar] [CrossRef] [Green Version]
  34. Hill, R.J. Corrections to Taylor’s Frozen Turbulence Approximation. Atmos. Res. 1996, 40, 153–175. [Google Scholar] [CrossRef]
  35. KiranKumar, N.V.P.; Jagadeesh, K.; Niranjan, K.; Rajeev, K. Seasonal Variations of Sea Breeze and Its Effect on the Spectral Behaviour of Surface Layer Winds in the Coastal Zone near Visakhapatnam, India. J. Atmos. Sol. Terr. Phys. 2019, 186, 1–7. [Google Scholar] [CrossRef]
  36. Baars, H.; Ansmann, A.; Engelmann, R.; Althausen, D. Continuous Monitoring of the Boundary-Layer Top with Lidar. Atmos. Chem. Phys. 2008, 8, 7281–7296. [Google Scholar] [CrossRef] [Green Version]
  37. Al-kadi, M.I.; Reaz, M.B.I.; Mohd Ali, M.A. Compatibility of Mother Wavelet Functions with the Electroencephalographic Signal. In Proceedings of the 2012 IEEE-EMBS Conference on Biomedical Engineering and Sciences, Langkawi, Malaysia, 17–19 December 2012; pp. 113–117. [Google Scholar]
  38. Andreas, E.L.; Claffy, K.J.; Makshtas, A.P. Low-Level Atmospheric Jets and Inversions Over The Western Weddell Sea. Bound. Layer Meteorol. 2000, 97, 459–486. [Google Scholar] [CrossRef]
  39. Svensson, N.; Arnqvist, J.; Bergström, H.; Rutgersson, A.; Sahlée, E. Measurements and Modelling of Offshore Wind Profiles in a Semi-Enclosed Sea. Atmosphere 2019, 10, 194. [Google Scholar] [CrossRef] [Green Version]
  40. Wagner, R.; Cañadillas, B.; Clifton, A.; Feeney, S.; Nygaard, N.; Poodt, M.; Martin, C.S.; Tüxen, E.; Wagenaar, J.W. Rotor Equivalent Wind Speed for Power Curve Measurement—Comparative Exercise for IEA Wind Annex 32. J. Phys. Conf. Ser. 2014, 524, 12108. [Google Scholar] [CrossRef]
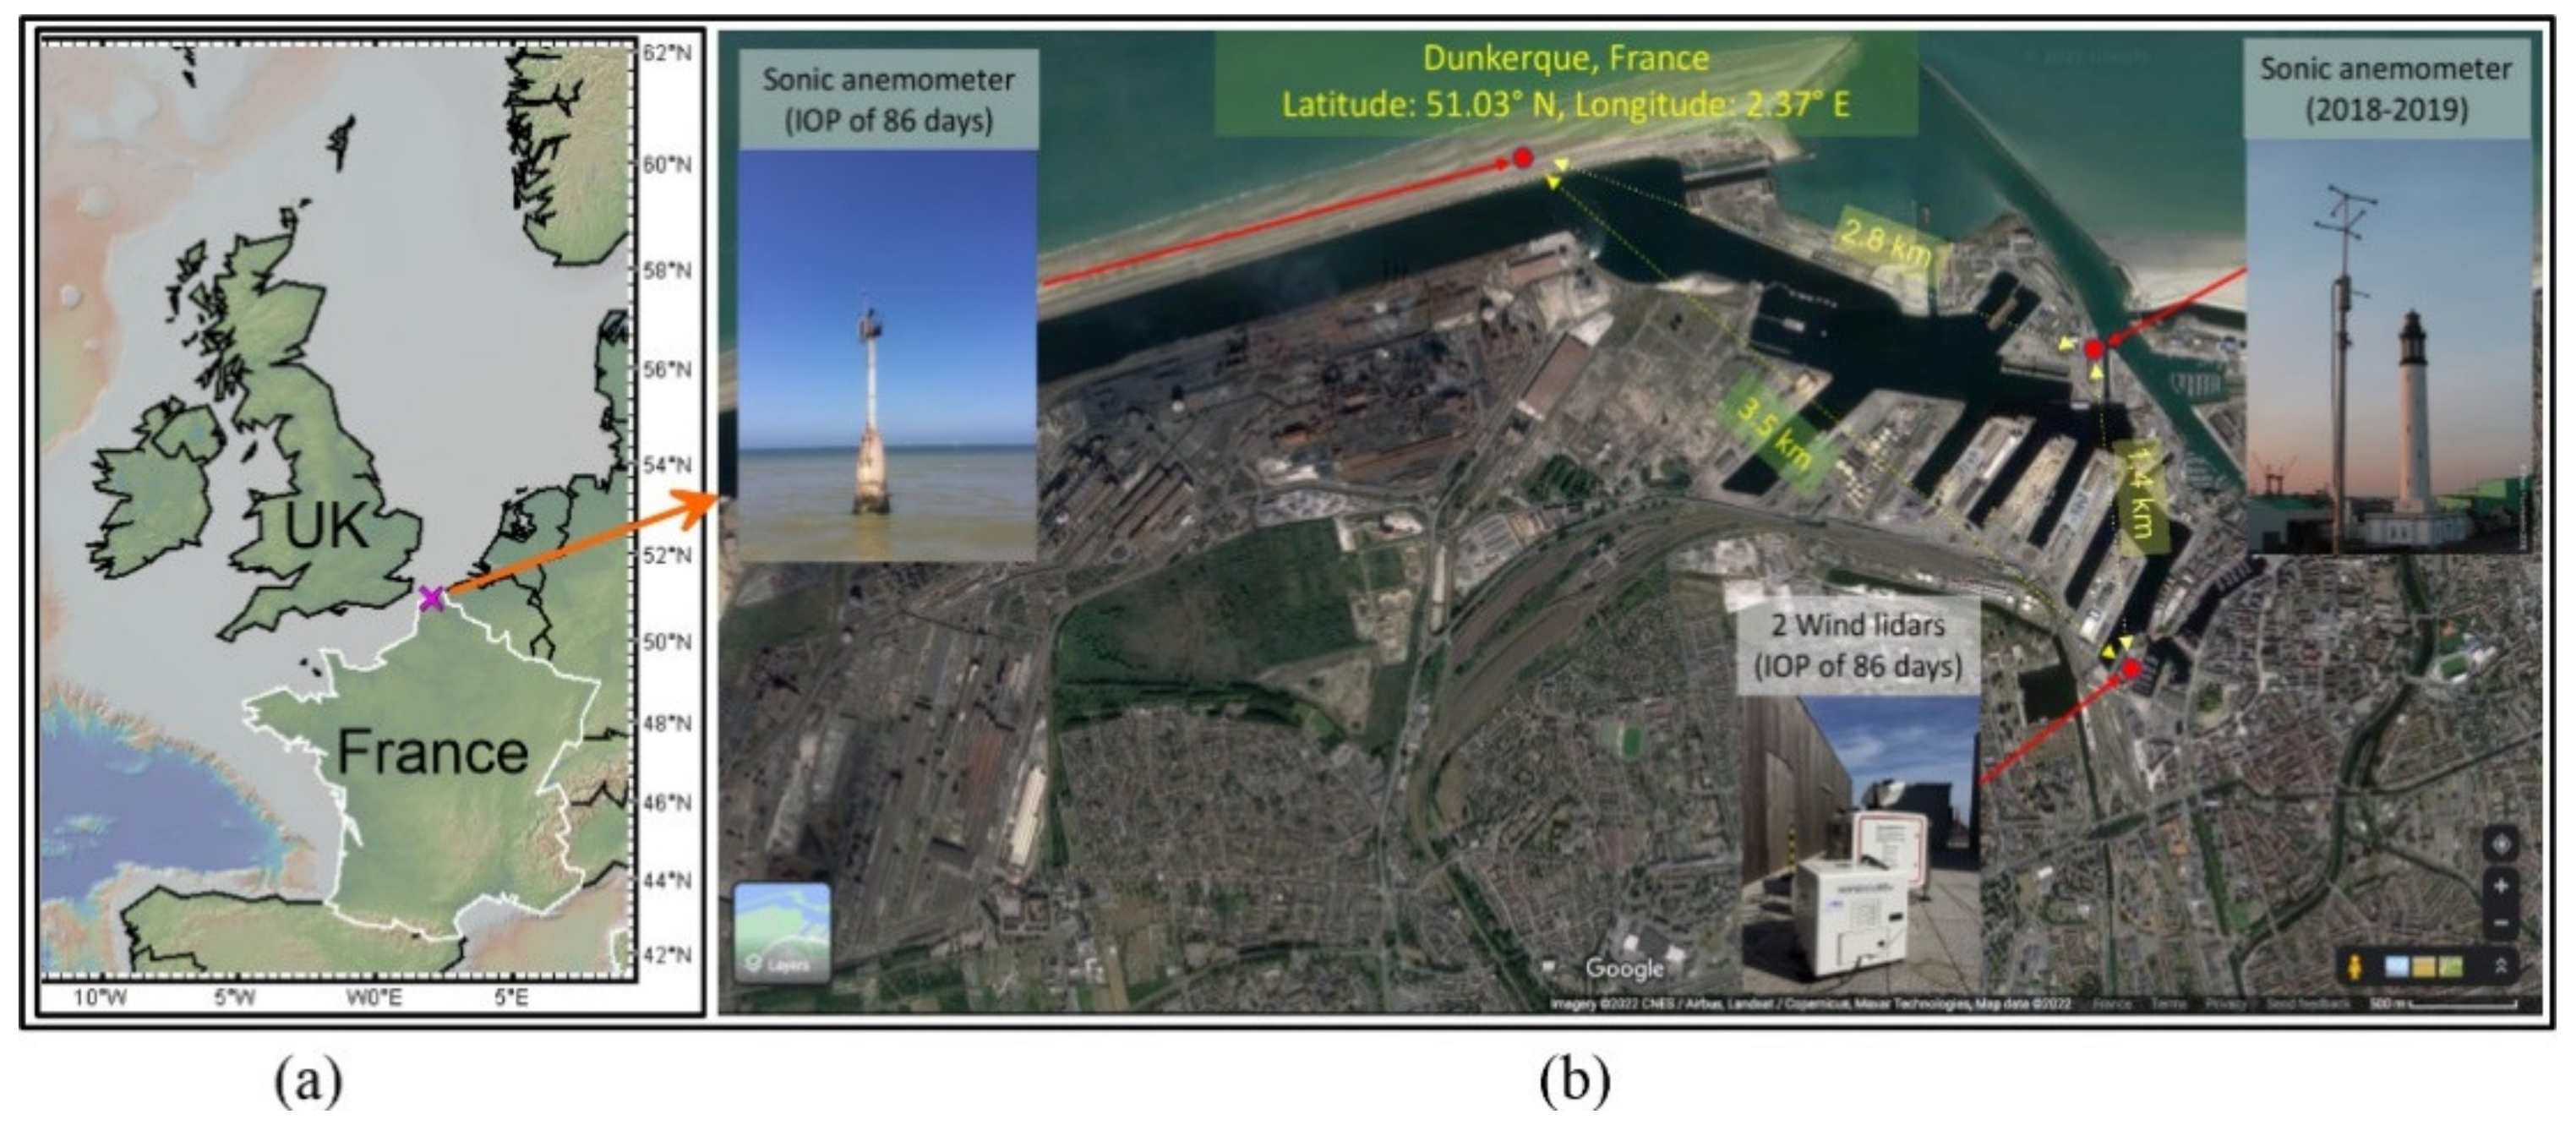
Figure 1. Measurement location map of North West of Europe (a); location in Dunkerque of the different experimental devices used in the measurement campaign (2 ultrasonic anemometers and 2 wind lidars) (b).
Atmosphere 13 01873 g001
Figure 2. Flow chart for the SCSBC sea-breeze identification method.
Atmosphere 13 01873 g002
Figure 3. Machine learning recurrent neural network for the sea-breeze identification method (RNN).
Atmosphere 13 01873 g003
Figure 4. Flow chart for the low-level jet identification method using the Haar wavelet function (HWTT).
Atmosphere 13 01873 g004
Figure 5. Flow chart for the low-level jet identification method using Symlets wavelet function and the slope of wavelet coefficients (SWT).
Atmosphere 13 01873 g005
Figure 6. Identification of SB days using SCSBC algorithm from wind measurements in 2018 (a); 2019 (b). SB days identified by RNN algorithm, 2019 (c).
Atmosphere 13 01873 g006
Figure 7. Performance test of RNN algorithm for SB day identification in 2019, actual average SBC of all SB days (a); predicted average SBC of all SB days (b); confusion matrix and accuracy (c).
Atmosphere 13 01873 g007
Figure 8. Time average of wind speed for all SB days during 2018 (a); 2019 (b).
Atmosphere 13 01873 g008
Figure 9. Identification of NLLJ days using SWT algorithm from wind measurements in 2018 (a); 2019 (b).
Atmosphere 13 01873 g009
Figure 10. Time average of wind speed for all NLLJ days in 2018 (a); 2019 (b).
Atmosphere 13 01873 g010
Figure 11. (a) Windrose of NLLJ core; NLLJ speed is shown in m/s and the percentage corresponds to the occurrence of NLLJ speed and direction relative to the total amount of NLLJ observed; (b) relative frequency distribution of NLLJ speed.
Atmosphere 13 01873 g011
Figure 12. Time height section of hourly average horizontal wind speed using lidar measurements for NLLJ events from WLS100 (a); SB events from WLS100 (b); and for the reference day from WLS7 (c). Time evolution of hourly average TKE at 10 m (AGL) for NLLJ events (d); for SB events (e); and TKE for the reference day (f). Time evolution of hourly average potential power calculated using rotor equivalent wind speed for NLLJ events (g); for SB events (h); and for the reference day (i). Time evolution of hourly average length scale (Lu) for NLLJ events (j); for the SB events (k); and for the reference day (l).
Atmosphere 13 01873 g012
Publisher’s Note: MDPI stays neutral with regard to jurisdictional claims in published maps and institutional affiliations.