Article

Establishing Correlation between Cruise Ship Activities and Ambient PM Concentrations in the Kotor Bay Area Using a Low-Cost Sensor Network

1
Center for Research, Innovation and Entrepreneurship, Faculty of Maritime Studies Kotor, University of Montenegro, 85330 Kotor, Montenegro
2
Environmental Protection Agency of Montenegro, 81000 Podgorica, Montenegro
*
Author to whom correspondence should be addressed.
Atmosphere 2022, 13(11), 1819; https://doi.org/10.3390/atmos13111819
Submission received: 3 October 2022 / Revised: 28 October 2022 / Accepted: 29 October 2022 / Published: 1 November 2022
(This article belongs to the Special Issue Shipping Emissions and Air Pollution)

Abstract

:
The analysis of cruise ships is focusing on port areas where they may represent a significant source of anthropogenic emissions. In order to determine the correlation between cruise ship activities (hoteling and maneuvering) in ports with the ambient concentration of pollutants associated with marine diesel fuel combustion, the low-cost sensors are finding their market share due to lower prices compared to the referent ones. In this study, a network of four low-cost PM sensors was used to determine the correlation between ambient PM2.5 and PM10 mass concentrations with cruise ship activities in the Kotor Bay area during 27 days in the peak summer season, with a 10-min resolution. Recorded data and the Openair model were used to investigate the potential relationship between cruise ship operations and temporal fluctuations in PM concentrations in the ambient air. Additionally, an Tier 3 methodology developed through the European Monitoring and Evaluation Programme of the European Environmental Agency (EMEP/EEA) was applied in order to estimate the total cruise ship PM emissions. The study has shown that weather conditions play a significant role in local PM concentrations, so that, with predominant ENE wind directions, the west side of the Bay experienced on average higher concentrations of both PM2.5 and PM10. Rain precipitation and higher winds tend to decrease rapidly ambient PM concentrations. Higher PM levels are associated mainly with lower wind speeds and the inflows from neighboring berths/anchorages. During the maneuvering (arrival and departure) of cruise ships, higher spikes in PM values were detected, being more visible for PM10 than PM2.5. A significant correlation between daily average PM concentrations and cruise ships’ daily estimated PM emission was not found. As a result, higher temporal resolution demonstrated a stronger correlation.

1. Introduction

The environmental effect of shipping should be assessed in the context of port sites, since air quality in the surrounding area is significantly impacted, resulting in serious repercussions for human health for people living in coastal areas [1]. Ships produce considerable amounts of pollutants into the neighboring environment while berthed, even three to five times more than when underway [2]. In some cases, ships in ports can account for up to 77% of total emissions [3,4].
Particulate matter (PM) generated by ships’ diesel engines has a range of adverse health and environmental-related consequences. It is estimated that shipping-related PM2.5 emissions cause about 60,000 premature cardiac and lung cancer deaths worldwide each year [5]. Another study has shown that ships account for over 6 million childhood asthma cases and 250,000 deaths annually [6].
According to studies [7,8,9,10,11,12], ships contribute significantly to PM2.5 and PM10 emissions in ambient air in coastal urban areas. When exhausted, PM2.5 and PM10 have relatively brief lives in ambient air, lasting from a few minutes to a few hours [13]. In port areas, shipping contributes to ambient PM mostly through secondary particles, accounting for 60% to 70% of PM2.5 and PM10 mass concentrations [12].
PM emission from ships in port areas is primarily determined by the ship’s operational mode (such as maneuvering and hoteling) and total time spent in each mode, engine characteristics and load, and the type of fuel they burn. Since this phase typically lasts longer than the maneuvering mode, the hoteling mode (when only auxiliary engines are used for energy production) is typically the largest contributor to PM emission [12,14,15]. When it comes to marine fuel quality, PM generation in marine diesel engines and consequent emission are generally correlated with the fuel’s sulfur content, as well as fuel viscosity, aromatics and polyaromatic content, carbon residue, and ash content [16,17].
Ships are continually moving, and even when berthed in ports, their emission plumes are intermittent, making detection more challenging with a single onshore monitoring station owing to shifting wind directions. Additionally, spatially scattered reference instrument networks are costly and difficult to manage. In this regard, where feasible, the use of a network of low-cost air quality sensors can provide a viable option [18,19].
Cruise ships make up a minor portion of the worldwide fleet and have a negligible impact on air pollution along maritime routes. However, cruise ships are increasingly focusing on port areas where they may be a significant source of anthropogenic emissions.
Kotor, a town in Montenegro, is a Mediterranean/Adriatic cruise ship destination. The Old Town of Kotor and the surrounding Bay are a part of UNESCO’s cultural and natural heritage. With cruise calls and passengers included, the Port of Kotor is listed as the third largest cruise port in the Adriatic Sea area. Statistics show 64 cruise calls in 2021, a 611% rise over 2020 (COVID-19 year) with a minimum record of 9 calls, and 86% drop over 2019 with the highest record of 464 calls [20]. At the same time, there were 9139 cruise passenger movements in 2021, up to 203% from 2020’s minimum record of 3009, and down 98% from 2019’s maximum record of 614,588 passengers [20]. In 2019, the period before the COVID-19 pandemic and the decline of the shipping industry, the volume of the cruise traffic from June to November (high tourist season) was 76.91%, while in the period from December to May, it was 32.09% [21]. This unbalanced seasonality share of approximately 2.4 times more cruise calls in the high season period represents a serious issue from the aspects of environmental pollution, including air pollution.
The purpose of this study was to establish a correlation between cruise ship activities in the Kotor Bay area and the PM2.5 and PM10 concentration in the ambient air. The study was based on an integrated approach using cruise ship emission inventories and dedicated measurement campaigns. The data provided in this research were collected over the course of 27 days in August and September 2022.

2. Methodology

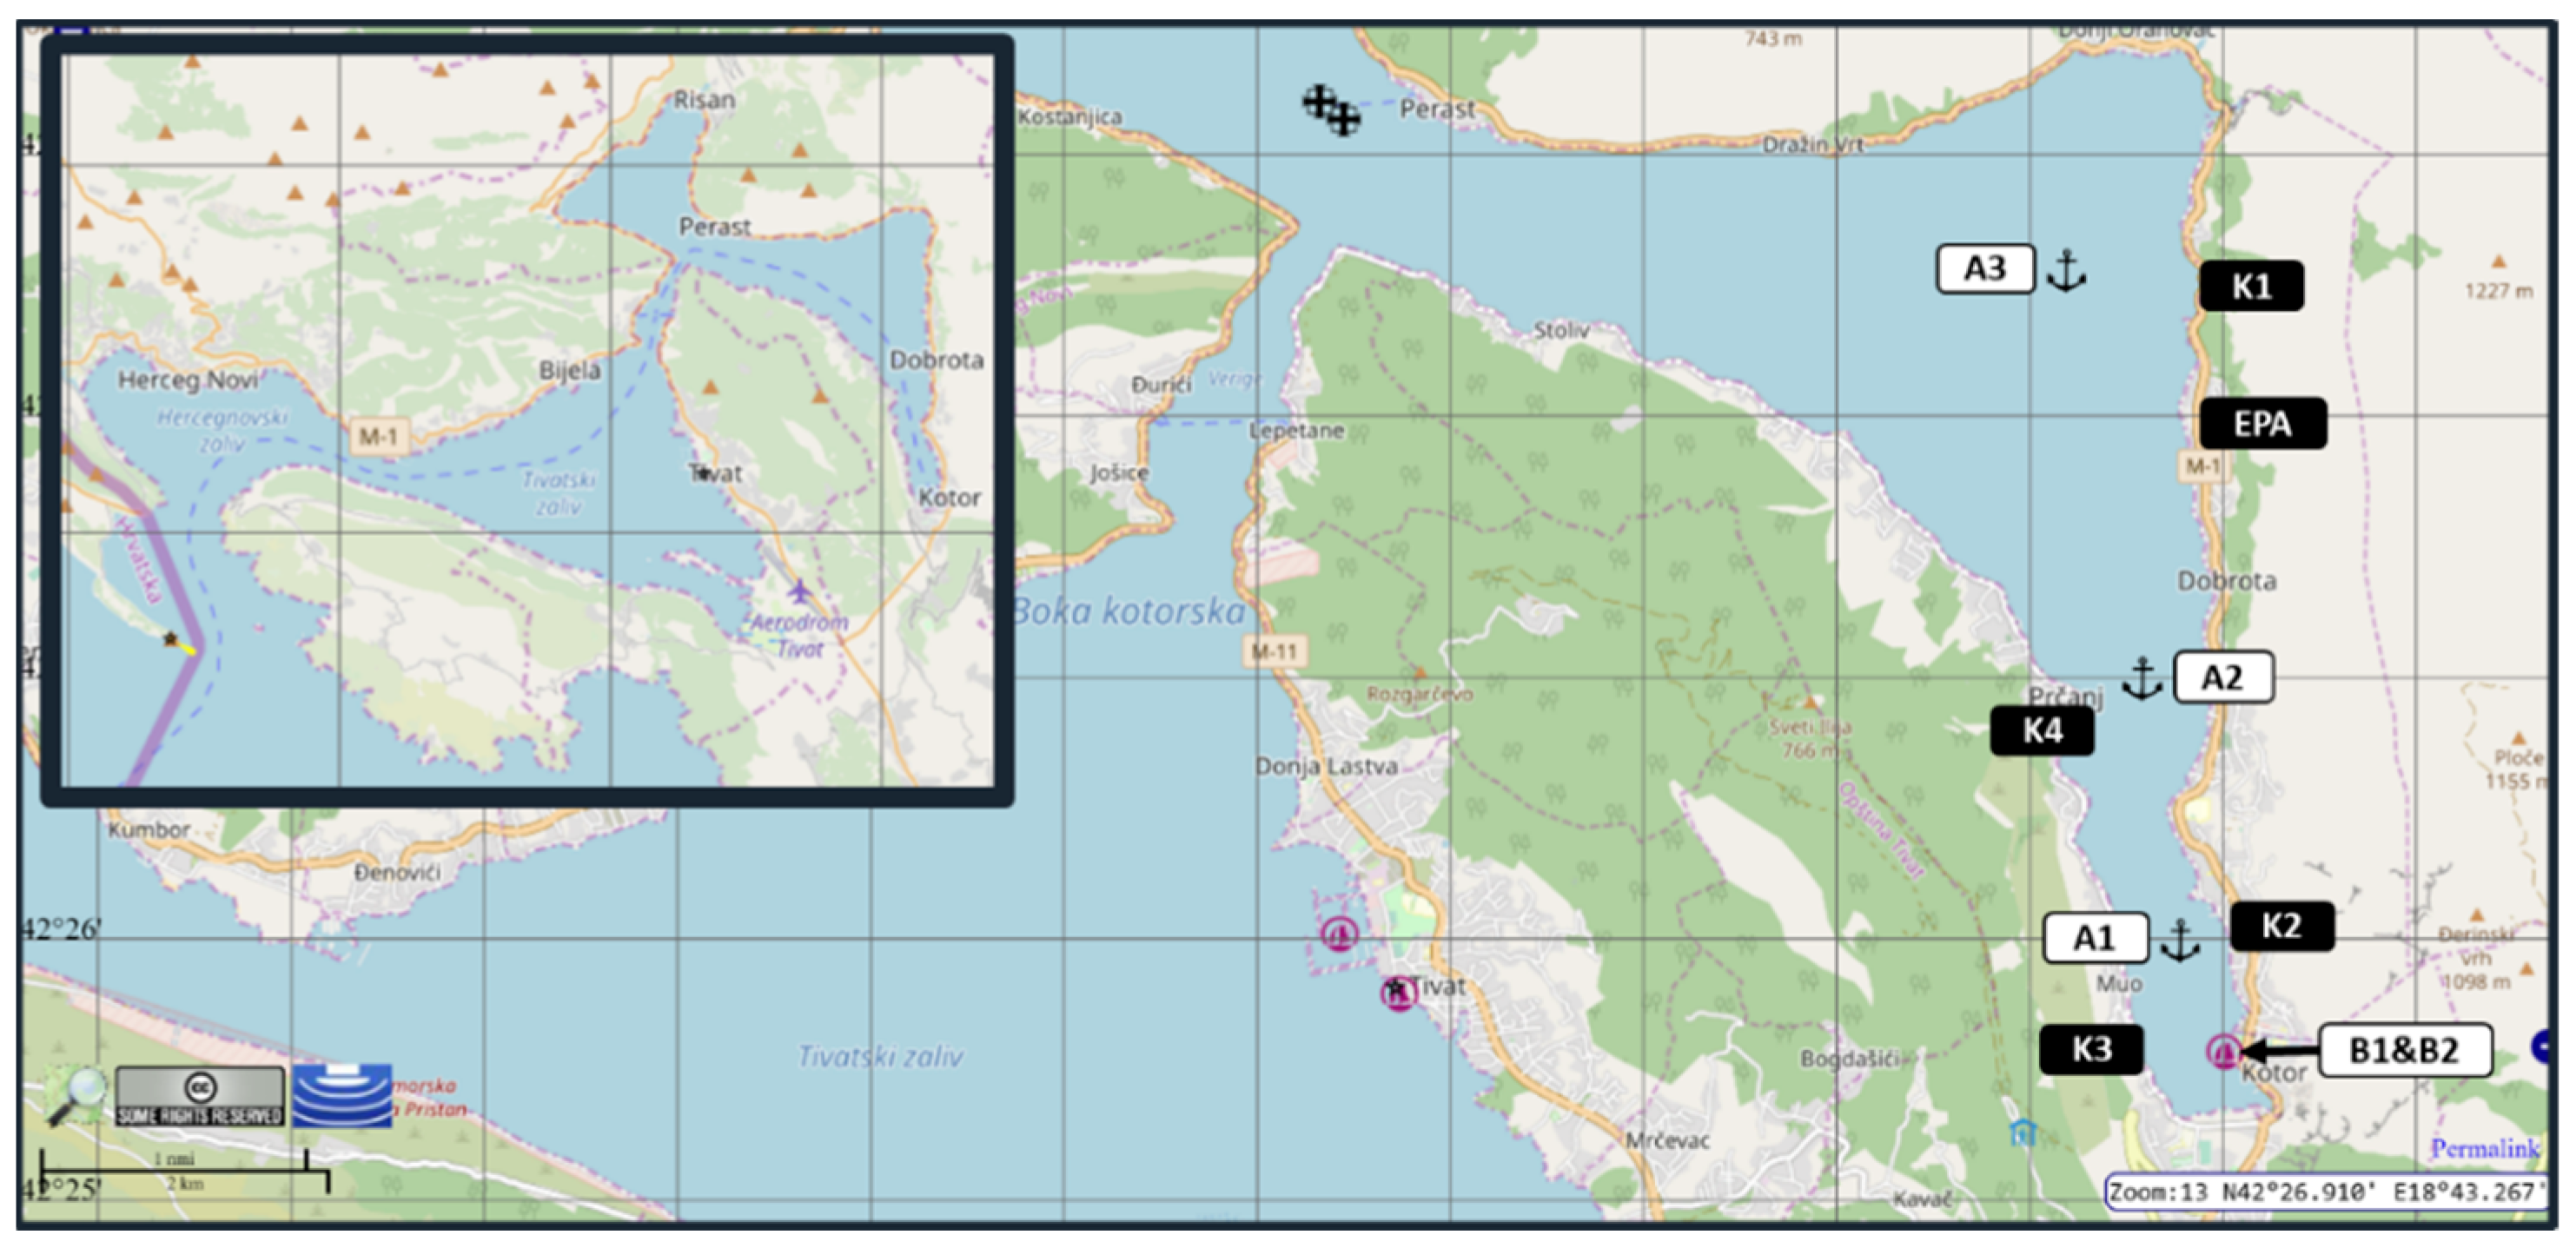
2.1. Cruise Ship and Measurement Locations in the Kotor Bay Area

Boka Kotorska Bay consists of 4 smaller bays including Kotor Bay, Risan Bay, Tivat Bay, and Herceg Novi Bay (Figure 1). The Boka Kotorska Bay is 28 km long, from its entrance at the open sea to the Port of Kotor. Straight Verige, which is barely 340 m wide and located at the Kotor Bay entrance, is the narrowest part of the whole Bay. The Kotor Bay resembles a fjord, surrounded by two massifs of the Dinaric Alps rising from 700 m (mount Vrmac) on the west side of the Bay up to 1749 m (mount Lovćen) on the east side of the Bay. Thus, the influence of the industrial zone and airport Tivat, positioned on the other side of the mountain range Vrmac, on local air quality in the Bay was neglected.
The Port of Kotor and its pier are in the vicinity of the Old Town of Kotor. Infrastructural capacities of the Port of Kotor include the main seaside berth, Berth 1, and the riverside berth, Berth 2 (Figure 1). The maximum allowed ship construction characteristics for berthing on the position Berth 1 are LOA = 280 m and Draft = 7.8 m, and ship characteristics for berthing on position Berth 2 are LOA = 150 m and Draft = 4.5 m [22]. Berth 2 is designed for smaller ships, whereas Berth 1 is designed for bigger ships or, alternatively, two smaller ships. The geographic coordinates of the Port of Kotor are 42°25,5’ N and 18°46,1’ E. The port area covers 11,344 m2 of land area and 86,226 m2 of sea area and 1848 m2 of the river area, together with three anchorage locations (A): the first location between the suburbs of Dobrota and Muo (A1), the second between the suburbs Kamenarovici and Prčanj (A2), and the third in front of the suburb Orahovac/Ljuta (A3), according to a pre-arrival arrangement with the Port Authorities (Figure 1) [22].
There were four measurement locations (K) in the Kotor Bay area, positioned in such a way as to be in the vicinity of the berth/anchor position and to cover most of the Bay area (Figure 1). K2 and K3 measurement locations were close to cruise ship berth position B in the Port of Kotor and anchoring position A1. K2 was placed at the building of Faculty of Maritime Studies in the suburb Dobrota. K3 was placed in the suburb Muo on the other side of the Bay. K4 was placed in suburb Prčanj in the vicinity of anchoring position A2. K1 was placed in suburb Ljuta in the vicinity of anchoring position A3.
Figure 1. Map of Boka Kotorska Bay with Kotor Bay at the end with anchoring (A1–A3), berthing (B), PM measurement (K1–K4) positions, and Montenegrin EPA measuring station (EPA) [23].
Atmosphere 13 01819 g001

2.2. Measurement Instrumentation

For the purpose of this study, 4 Kunak AIR Pro outdoor air quality monitoring stations (K1–K4) with PM, external temperature, pressure, and relative humidity sensors were used. The PM sensor consisted of an Optical Particle Counter (OPC) capable of measuring particles from 0.3 μm up to 40 μm. PM1, PM2.5, PM4, PM10, Total Suspended Particles (TSP), and Total Particle Counter (TPC) were calculated assuming a particle density profile [24]. The effect of humidity was corrected with the embedded algorithm, achieving high accuracy at any environmental conditions except under foggy days or condensation. The data were automatically invalidated by the Kunak Cloud software [24].
In addition, a Kunak ultrasonic anemometer measuring average wind speed, maximum wind speed, and wind direction, was coupled to the K2 station.
K1, K3, and K4 were placed onto public lighting poles at a height between 2 and 4 m, enabling an autonomous power supply. K2 was placed on the roof of the building of the Faculty of Maritime Studies Kotor at an altitude of 6 m, and it was connected to the faculty’s power supply. Stations were roughly 10 m from the shoreline, separated by a local road. All sensors were collecting data every 10 min, and data were stored at the Kunak Cloud Platform.
Specification on the Kunak equipment is available on the company website [24].

2.3. Methodology for Quantification of Pollutant Emission and Cruise Ship Data

For the purpose of this study, in addition to the measurement campaign, a methodology of Trozzi and Vaccaro [25] was used to estimate the PM emission from cruise ships for each berth and anchorage position in the Kotor Bay area for the same period of time as for the campaign.
The EMEP Tier 3 methodology for calculating the exhaust emission from shipping was a bottom-up approach. It took into account the detailed operation and technical data of individual cruise ship calls, such as the ship’s class, fuel type, engine type, gross tonnage, and amount of time spent in an appropriate navigation mode. Furthermore, proposed emission factors were selected based on the experimental situation in the Kotor Bay. Engine, fuel, and navigational mode have an impact on ship emission factors [25].
The total estimated amounts of PM2.5,10 emitted from cruise ships for the purpose of this study have been calculated using the following equation [25].
E = ∑p [Tp × ∑e (Pe × LFe × EFe,i,j,m,p)],
where
  • E—emission over a complete trip (tonnes),
  • P—engine nominal power (kW),
  • LF—engine load factor (%),
  • EF—emission factor (kg/kW),
  • T—time (h),
  • e—engine category,
  • i—pollutant,
  • j—engine type,
  • m—fuel type,
  • p—the different navigation mode (cruising, hoteling, maneuvering).
Regarding the fuel quality, it was assumed that all cruise ships consume an ultra-low sulfur fuel oil with max. 0.1%m/m when berthed/anchored in accordance with the EU Sulphur Directive [26].
According to the EMEP Tier 3, there are four distinguished navigation modes determined by the load factors (LF), as follows [25]:
(a)
approaching and berthing or/and anchoring in ports;
(b)
hoteling;
(c)
departing from the ports;
(d)
cruising.
The last mode (d) was not taken into consideration for this analysis due to the unique nature of the navigation operations in the Boka Kotorska Bay. When the ship approaches Kotor Bay at the Verige Straight, mode (a) begins. At the time of berthing or/and anchoring, this step is complete. The time spent at the berth or in the anchor position is part of mode (b). Mode (c) begins when the cruise ship leaves the berth or anchorage and finishes when it enters the Verige Straight.
The duration of maneuvering operations (combined for (a) and (c) modes) was anticipated to be roughly 0.83 h for position B, 0.67 h for position A1, 0.5 h for position A2, and 0.33 h for position A3, based on the experience of the port’s pilots. Based on data from ship announcements, the hoteling mode was determined.
During the experimental period, 61 cruise calls with arrival/departure events were considered [22]. During that time, there were 33 distinct cruise ships. Table 1 [27] shows how 29 analyzed cruise ships were categorized into four groups based on their gross tonnage under the adopted technique. Small and mid-size cruise ships were the most prevalent. Smaller cruise ships with less than 1000 GT were not considered.

3. Results and Discussion

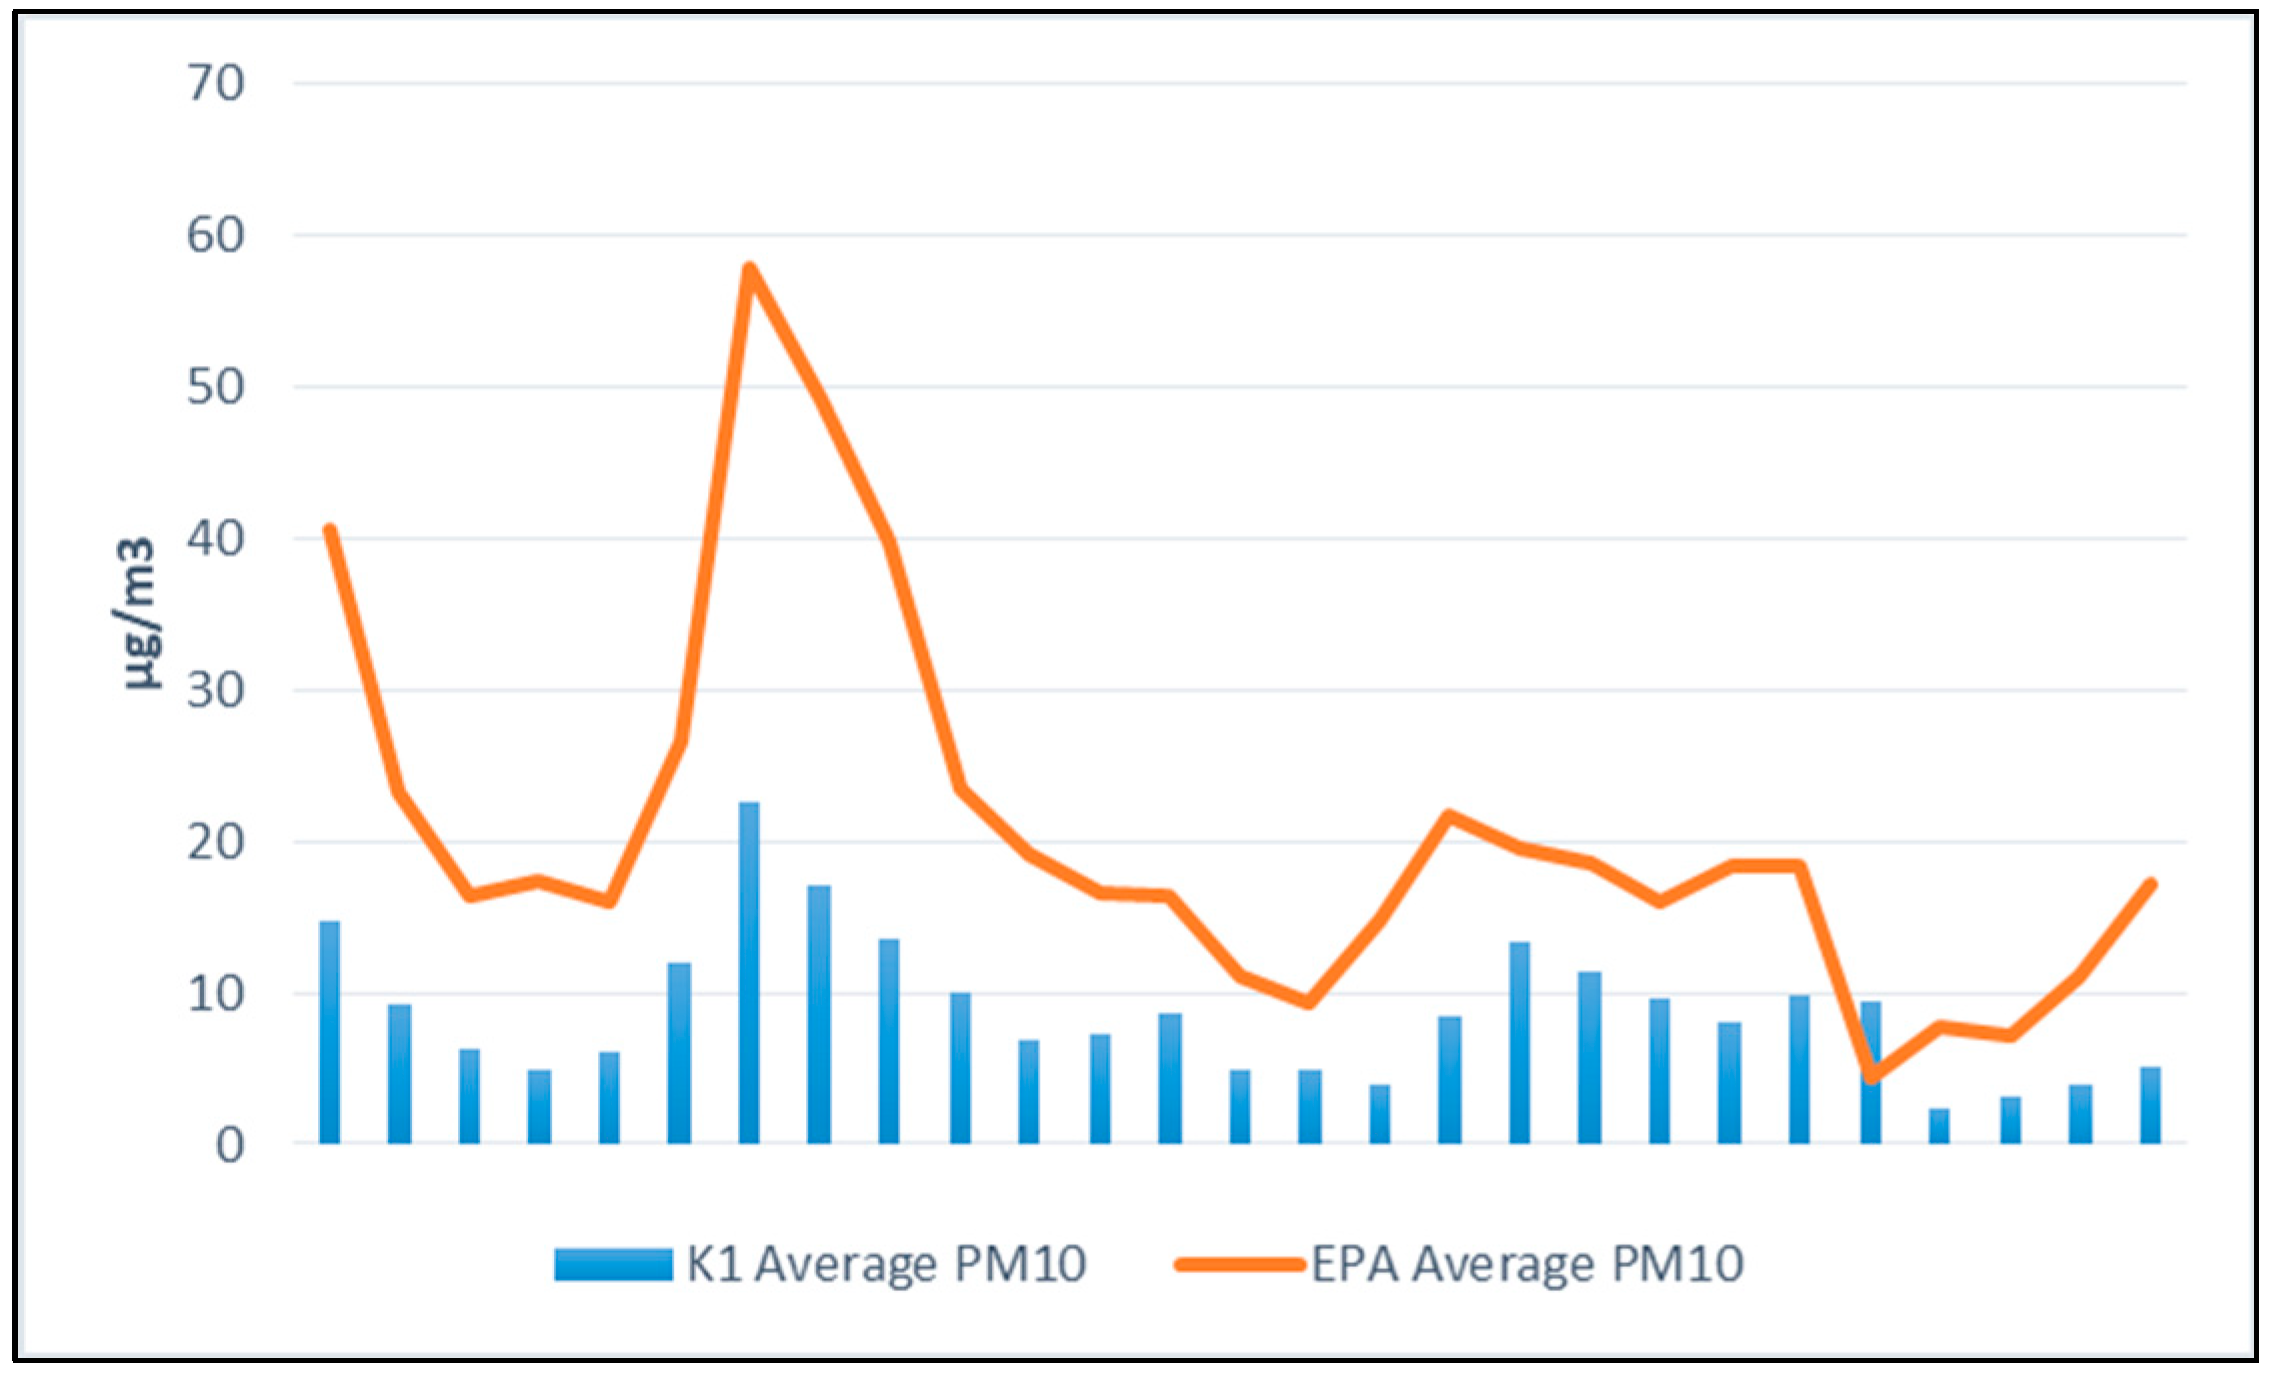
3.1. PM Data Validation

For the purpose of measuring data validation, the K1 sensor was installed approximately 1 km distance from the Air Monitoring Station of the Montenegrin Environmental Protection Agency (EPA) located in the suburb of St. Stasije (Figure 1). A micro location analysis at both positions found that both locations were quite similar from the perspective of exposure relative to the two key sources of pollution: cruise ships anchored at the A3 position, and road traffic via the M-1 roadway.
EPA’s Air Monitoring Station is equipped with an automatic sampling Derenda PNS 18 device, which is used for the gravimetric determination of daily PM10 concentrations in the ambient air according to the European standard EN 12341:2014 [28]. A graphical presentation of the average daily PM10 data collected by EPA’s sampler and K1 sensor in the period from 20 August to 15 September 2022 is shown on Figure 2.
In comparison to the data obtained by the standardized Derenda PNS 18 sampler, the data collected via the K1 low-cost sensor showed strong correlation coefficients, as follows: rk1 = 0.88.

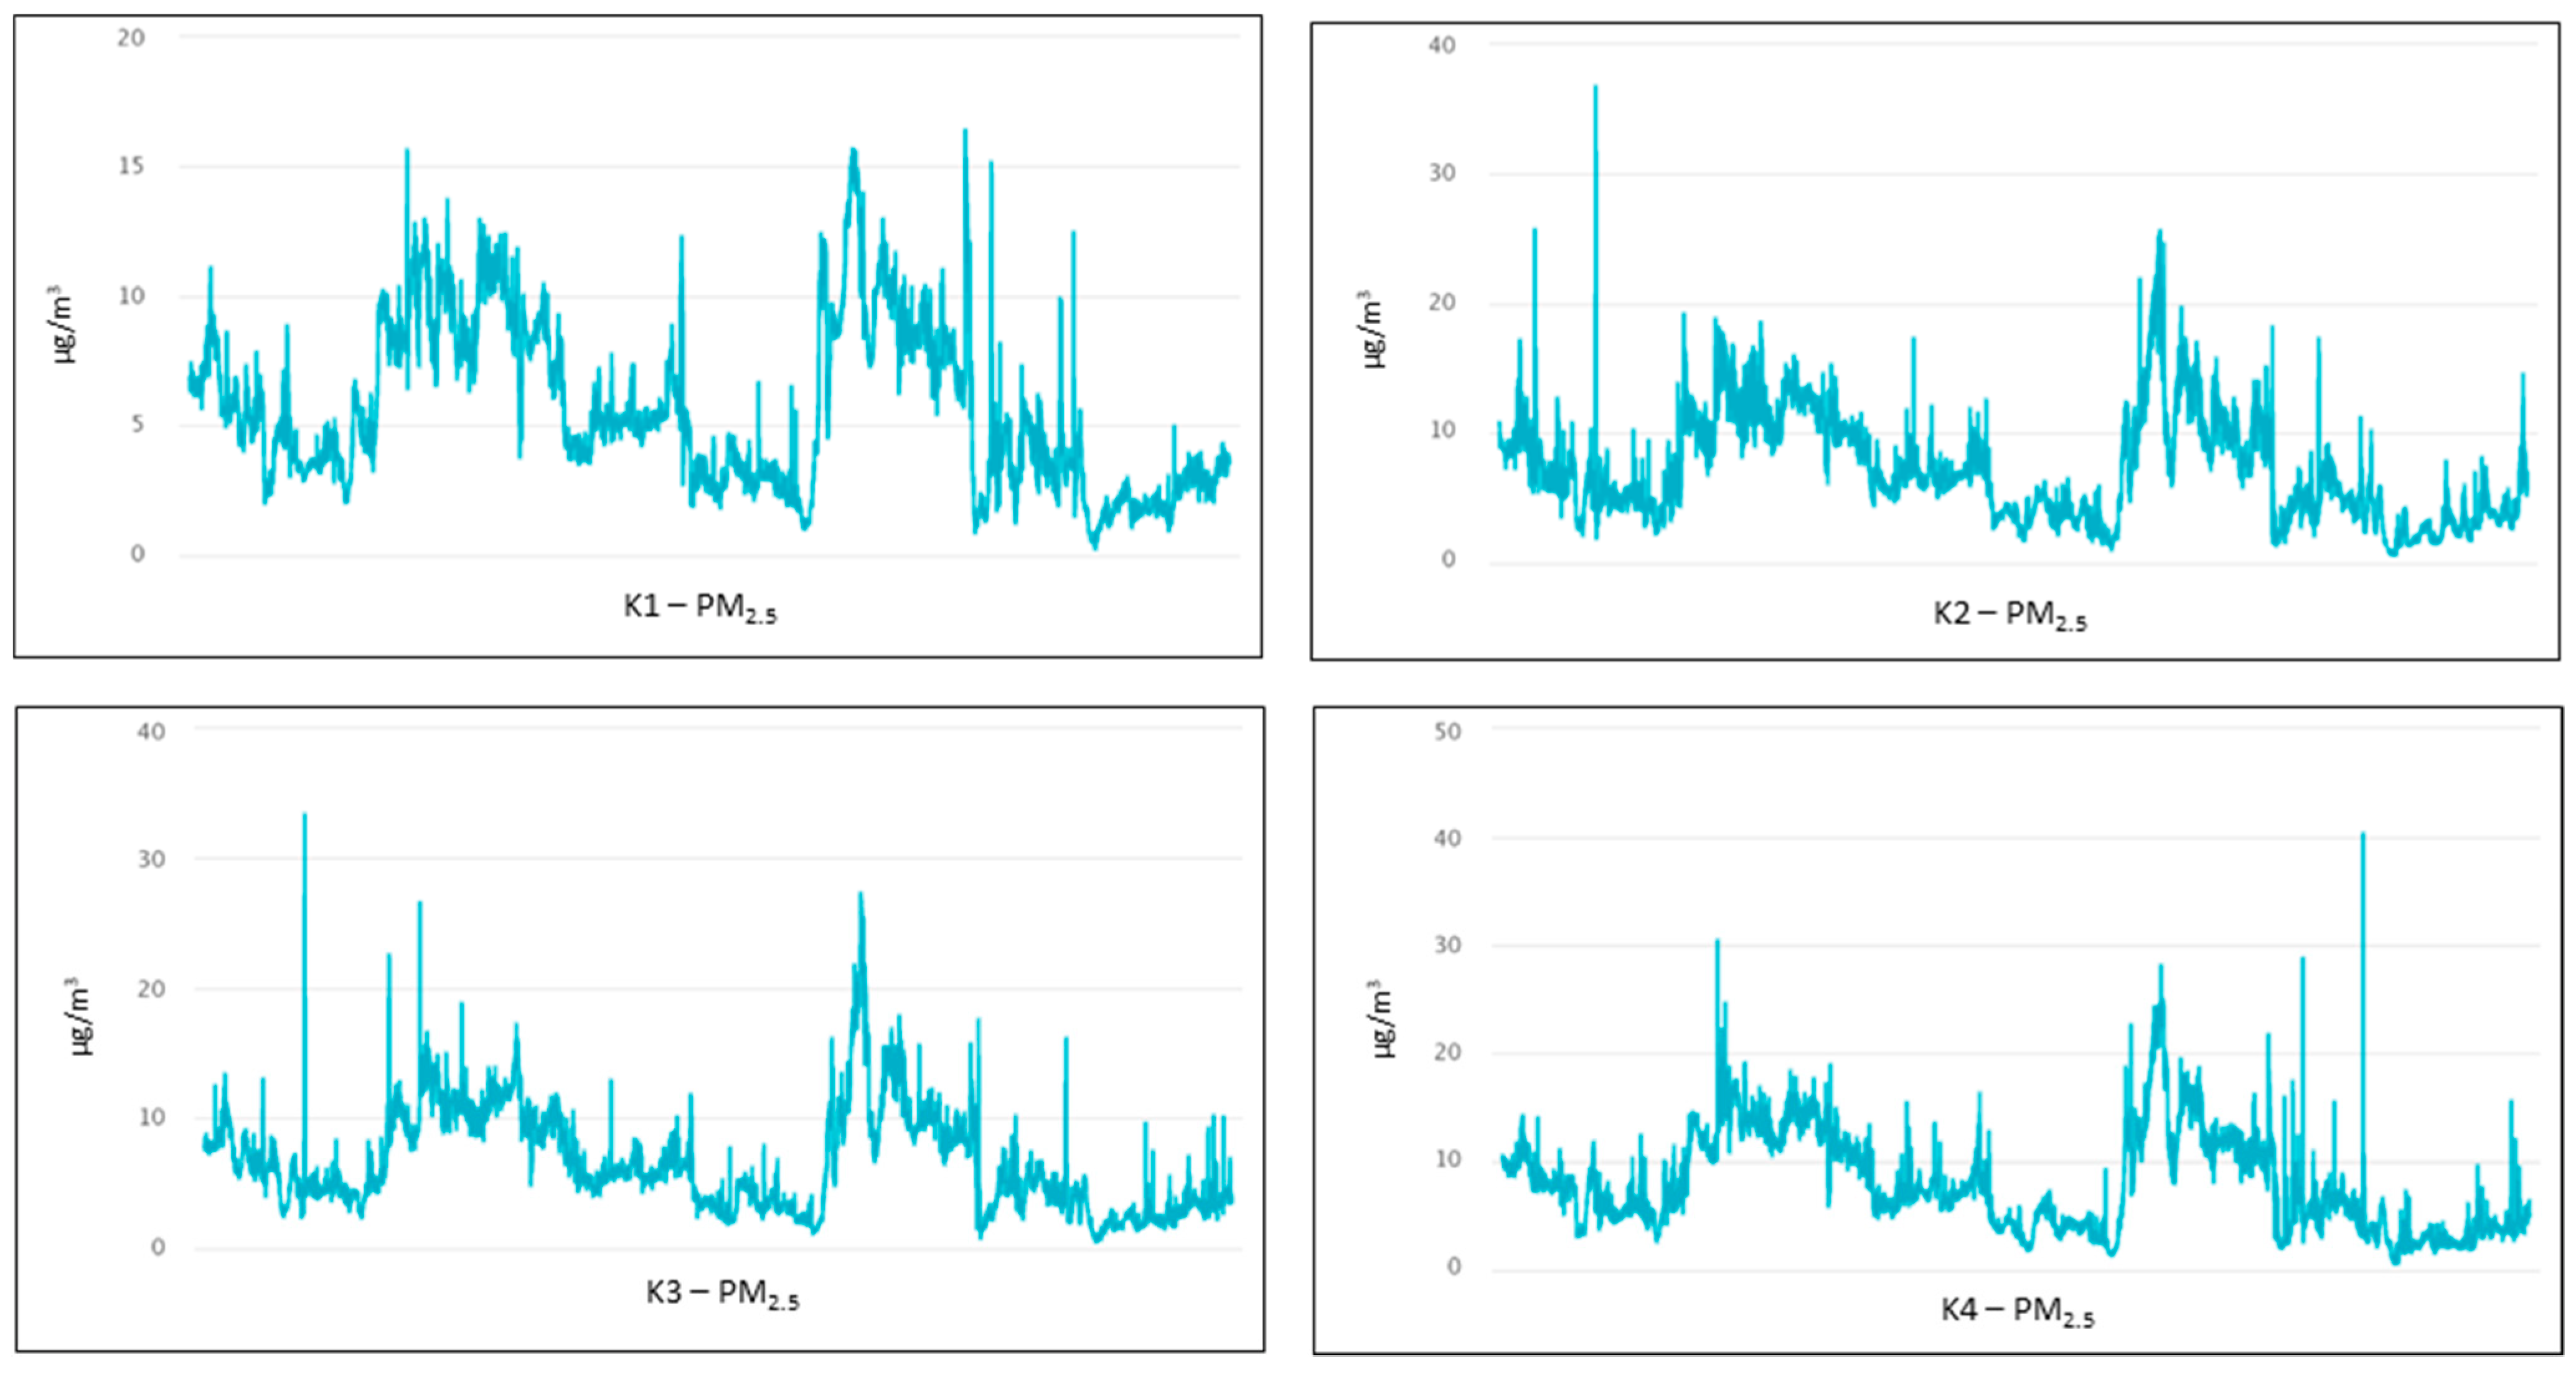
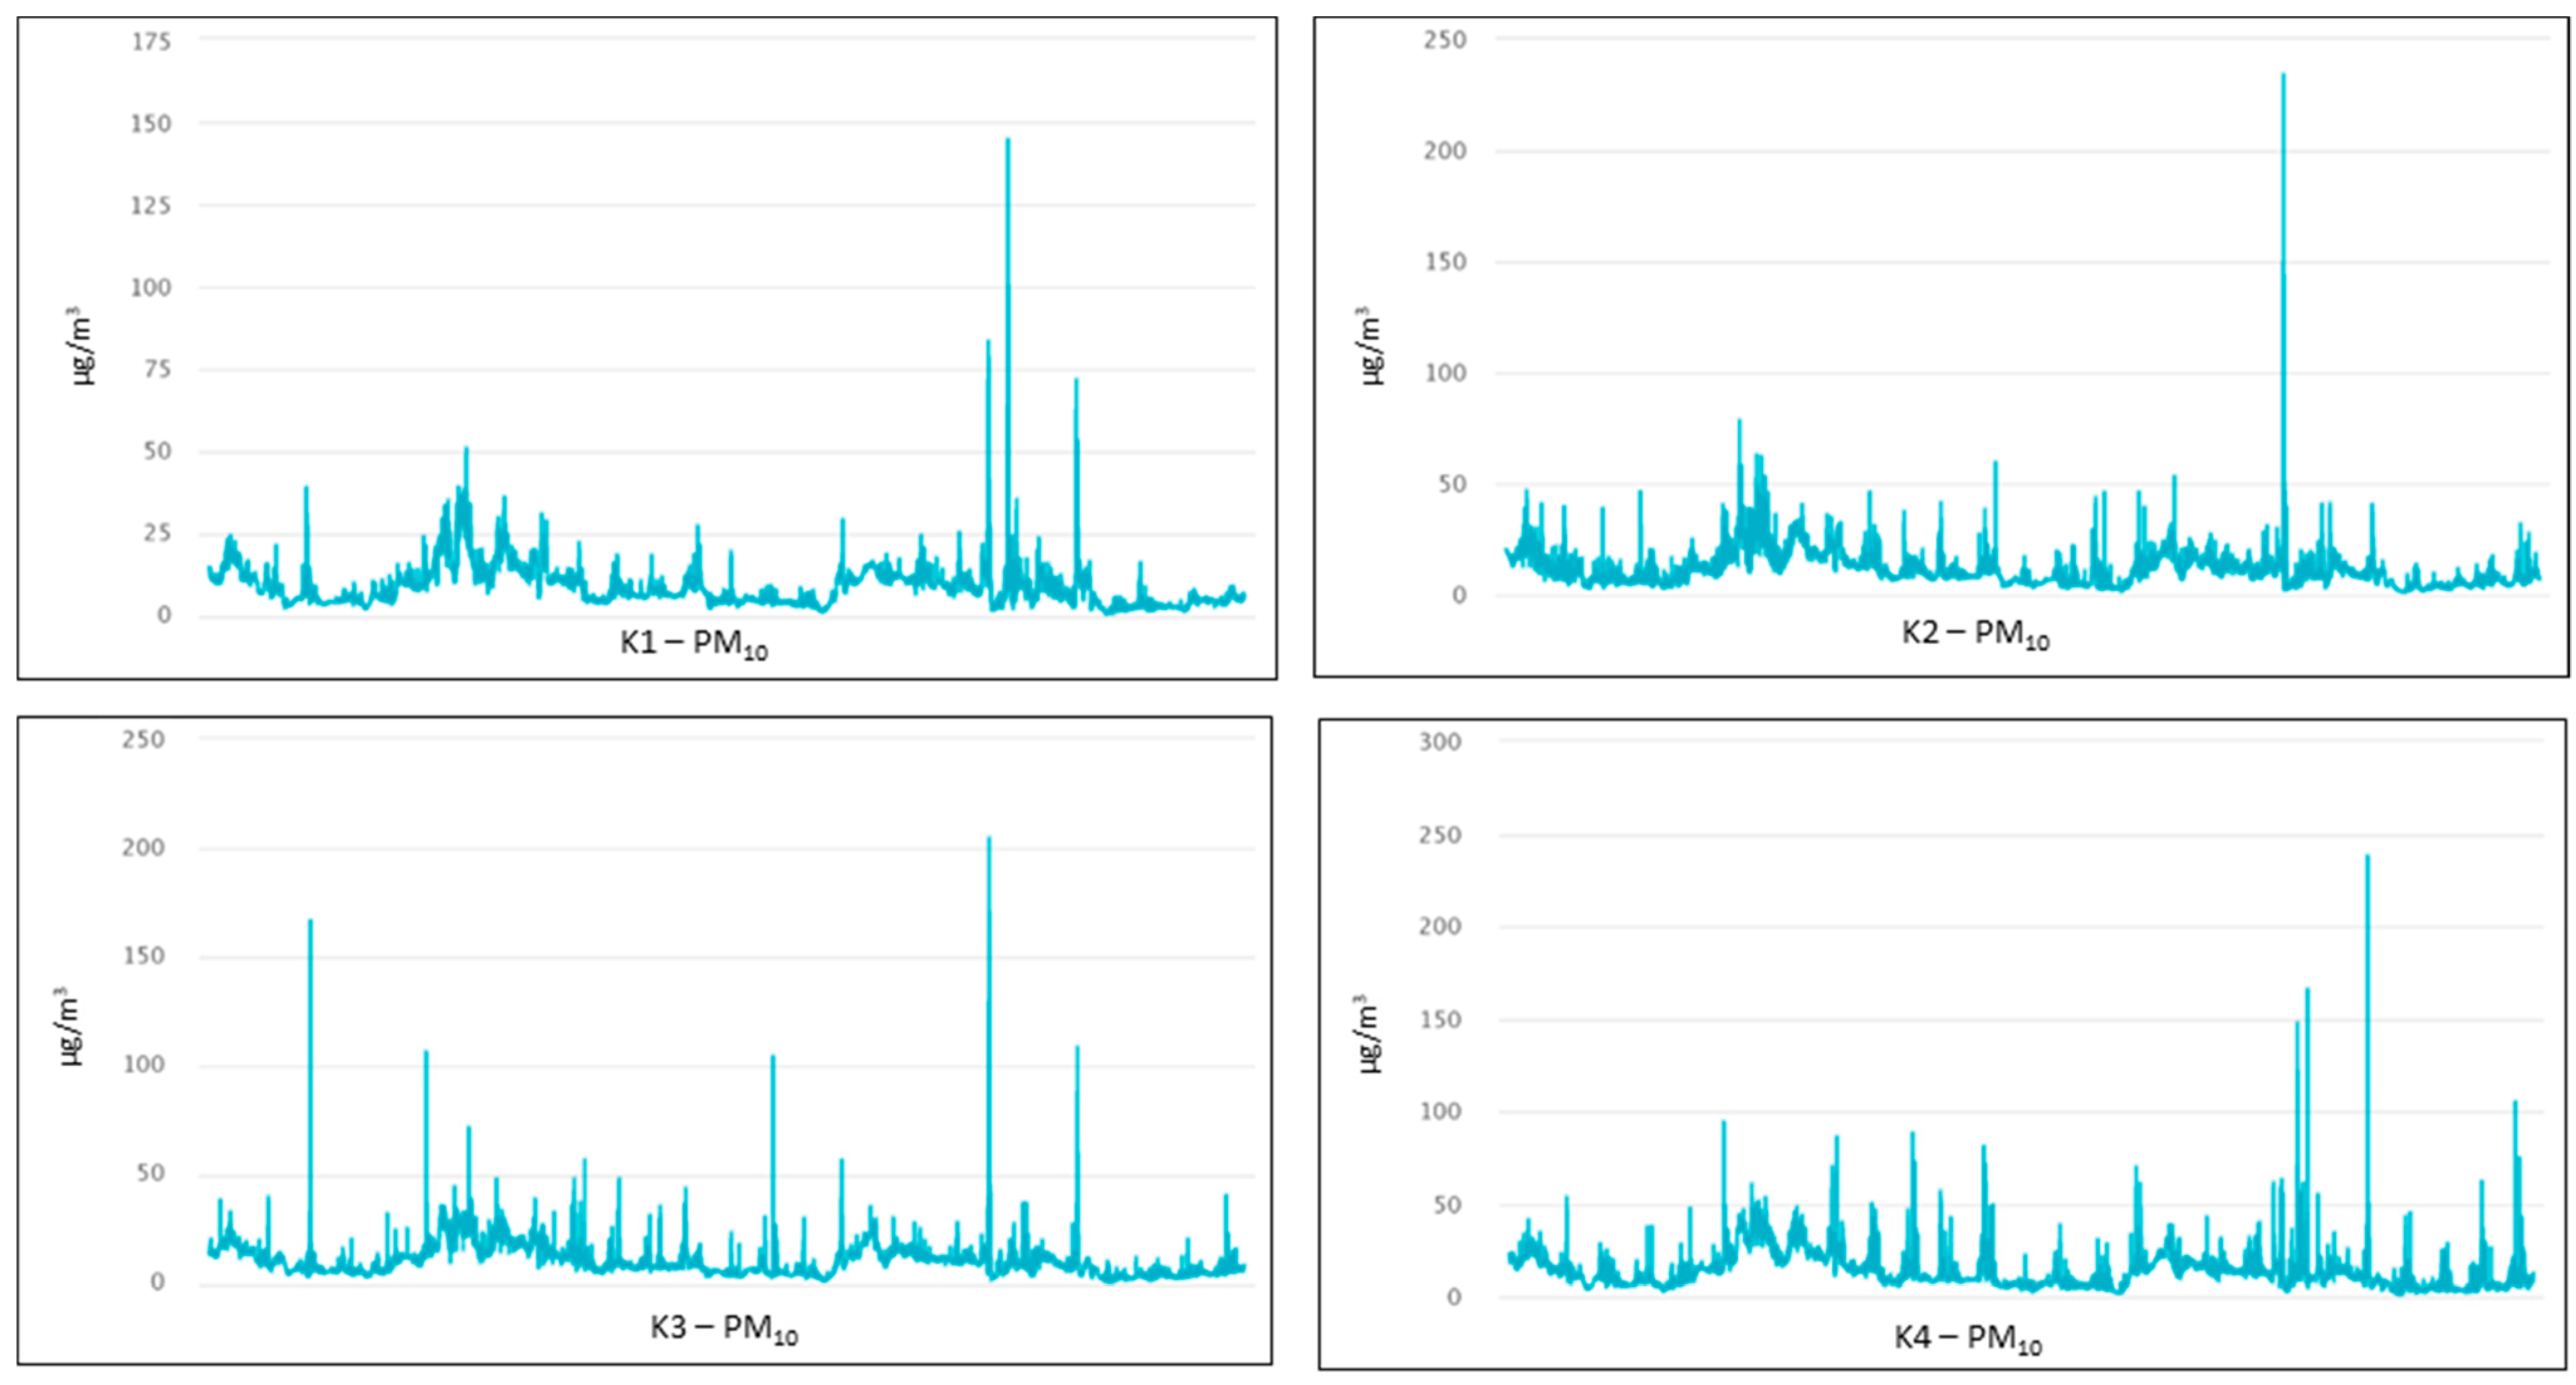
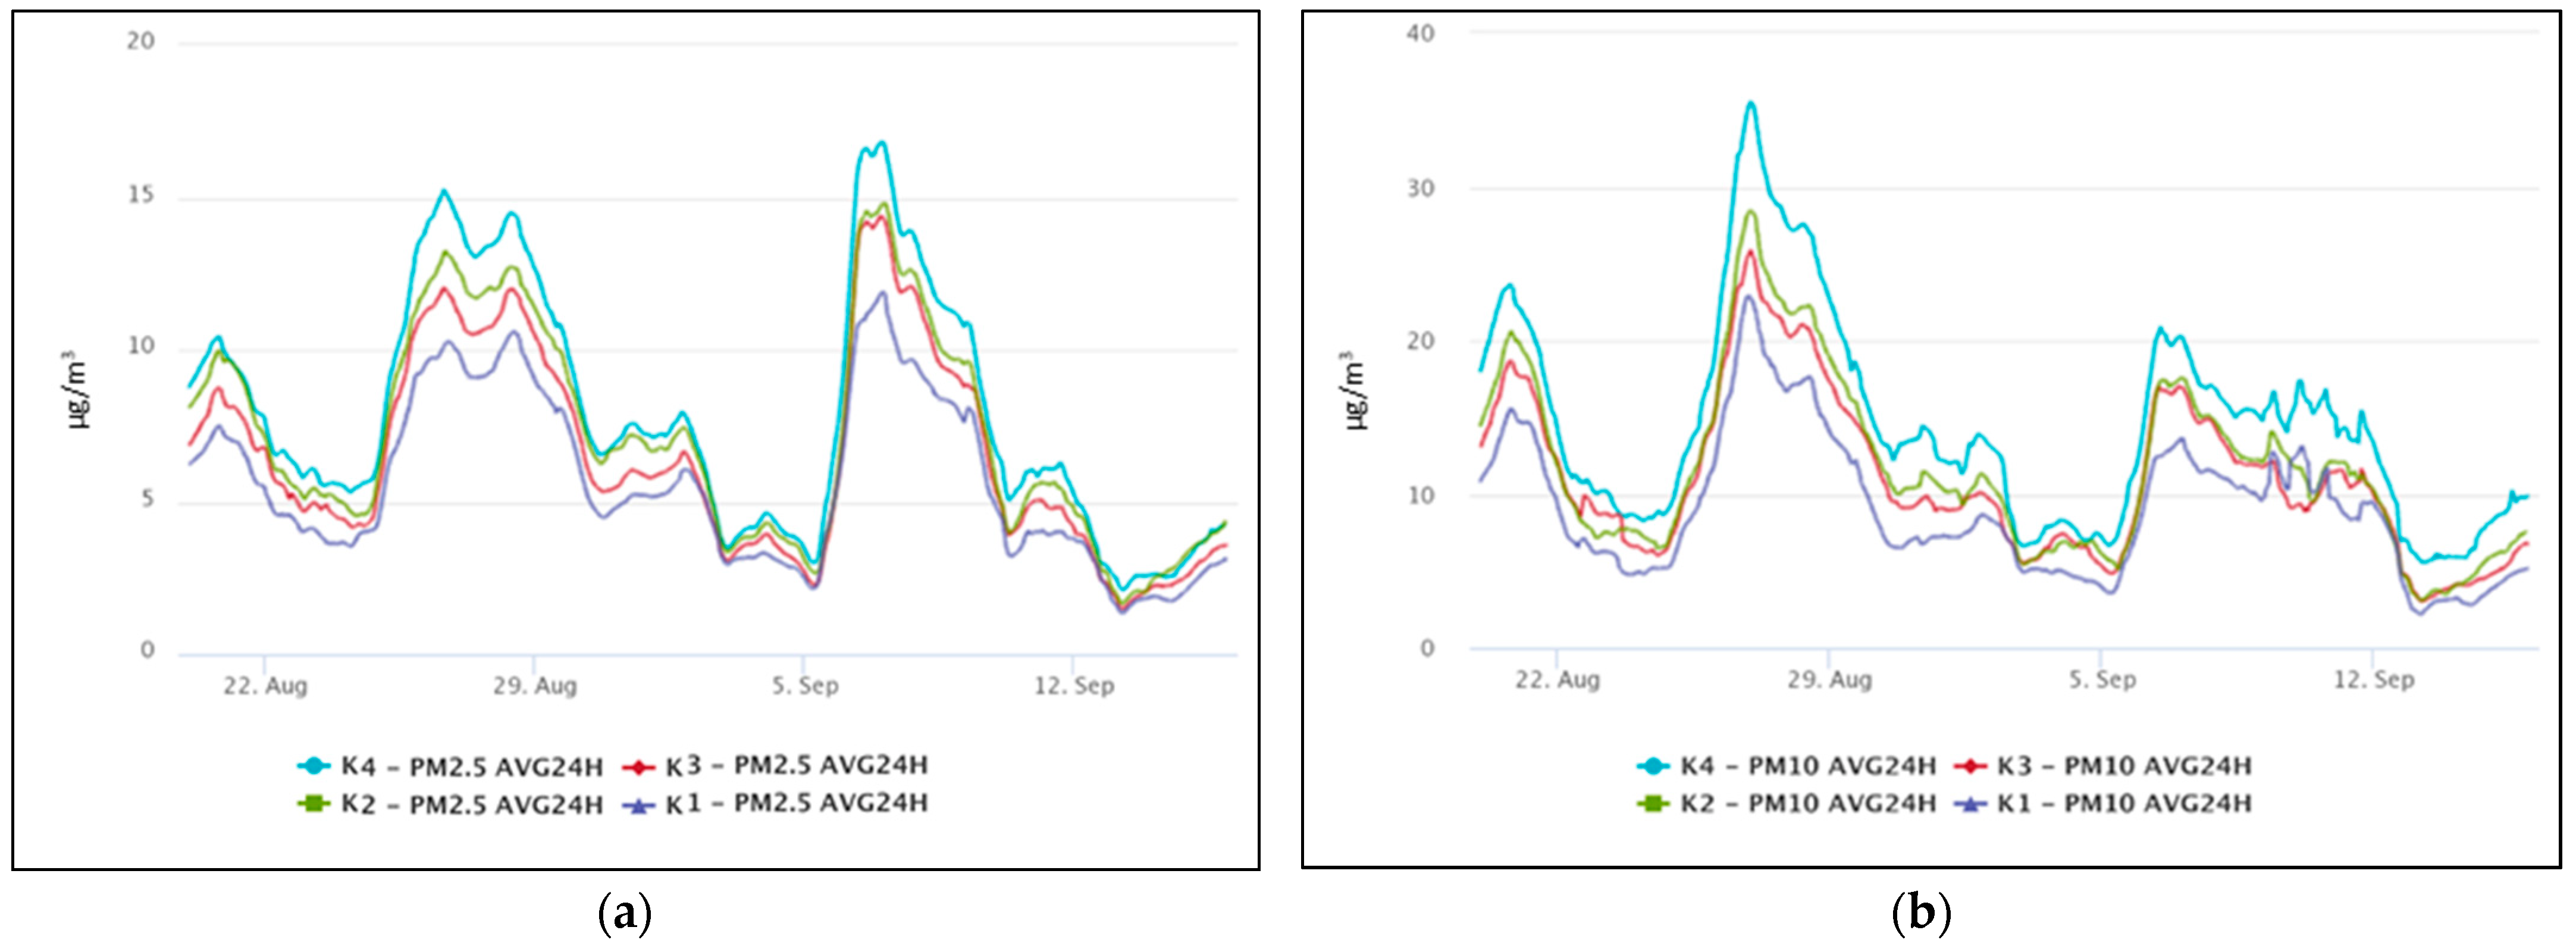
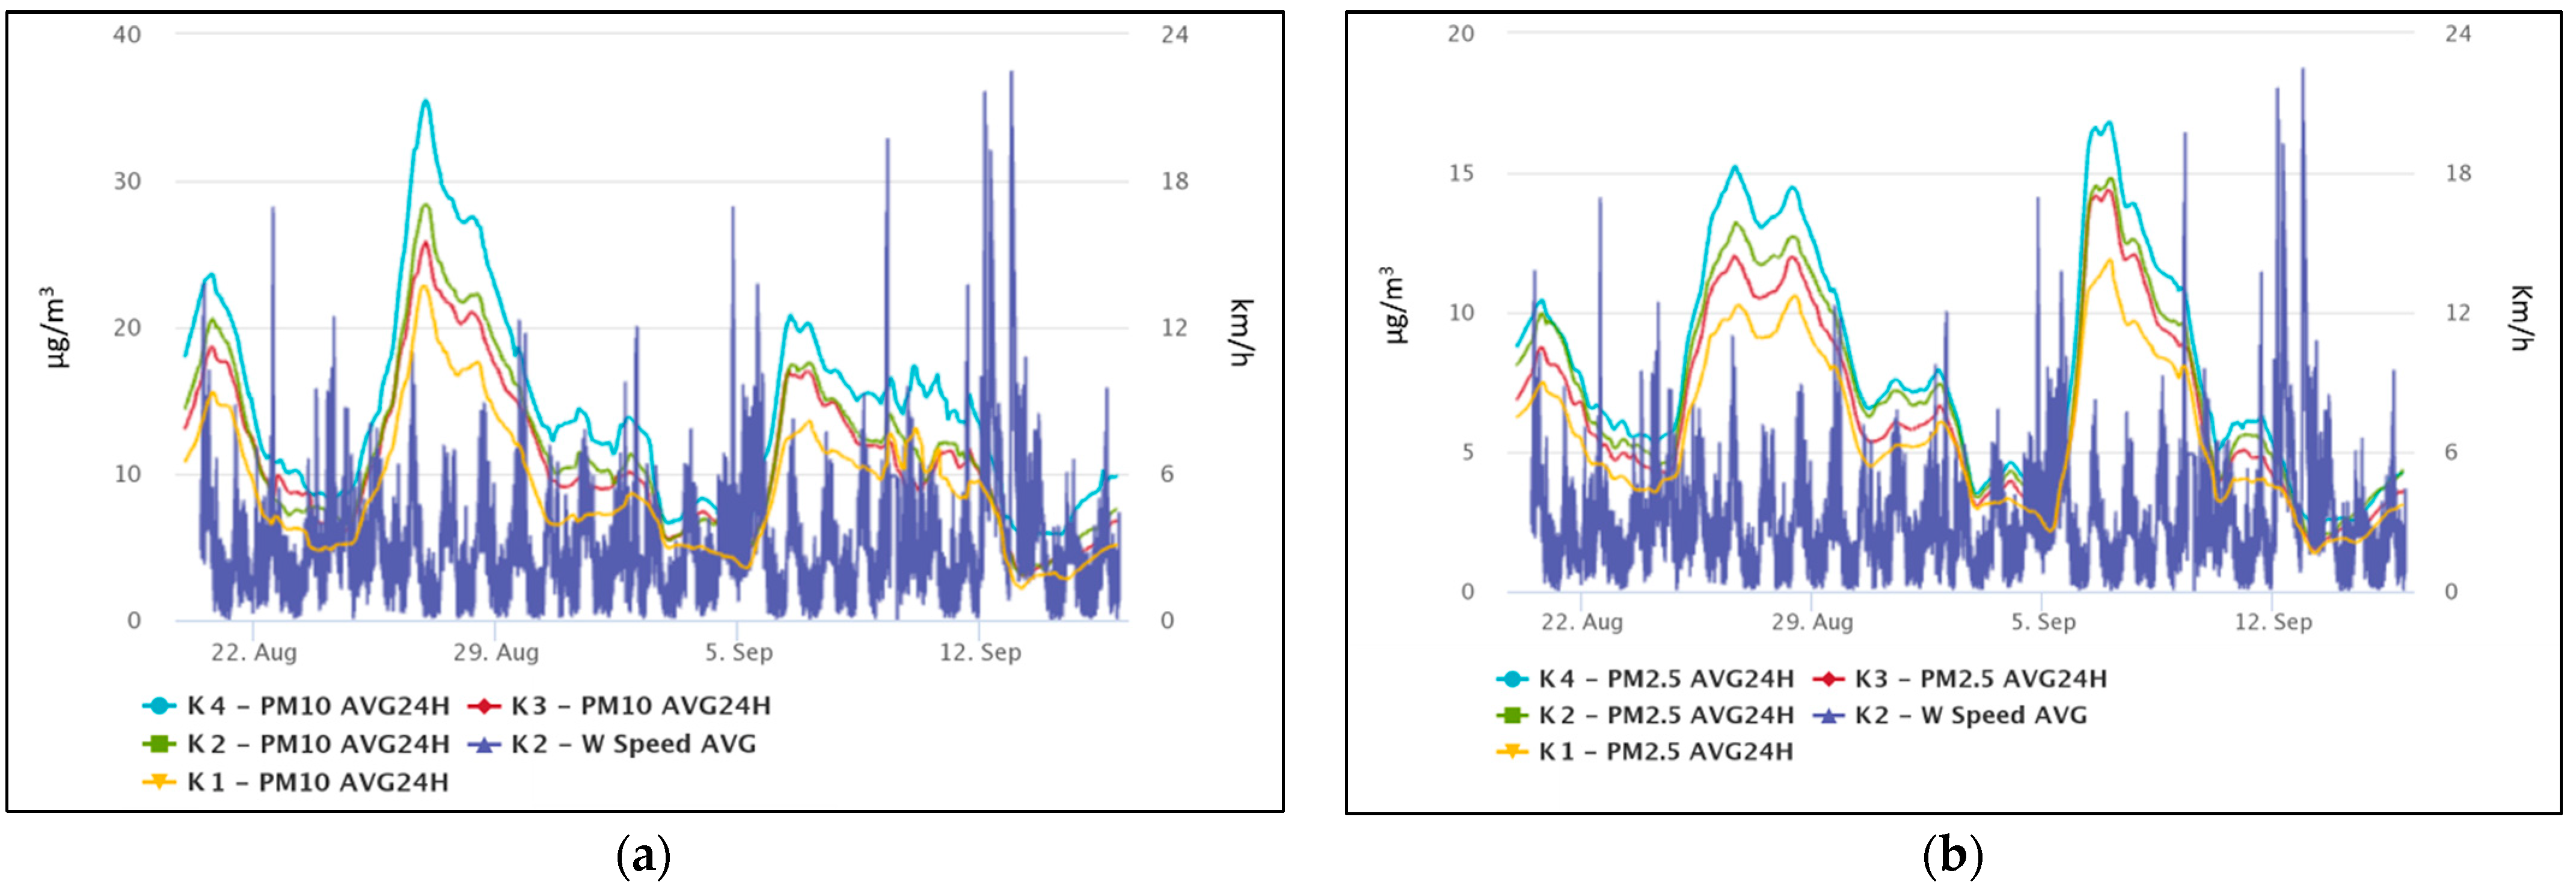
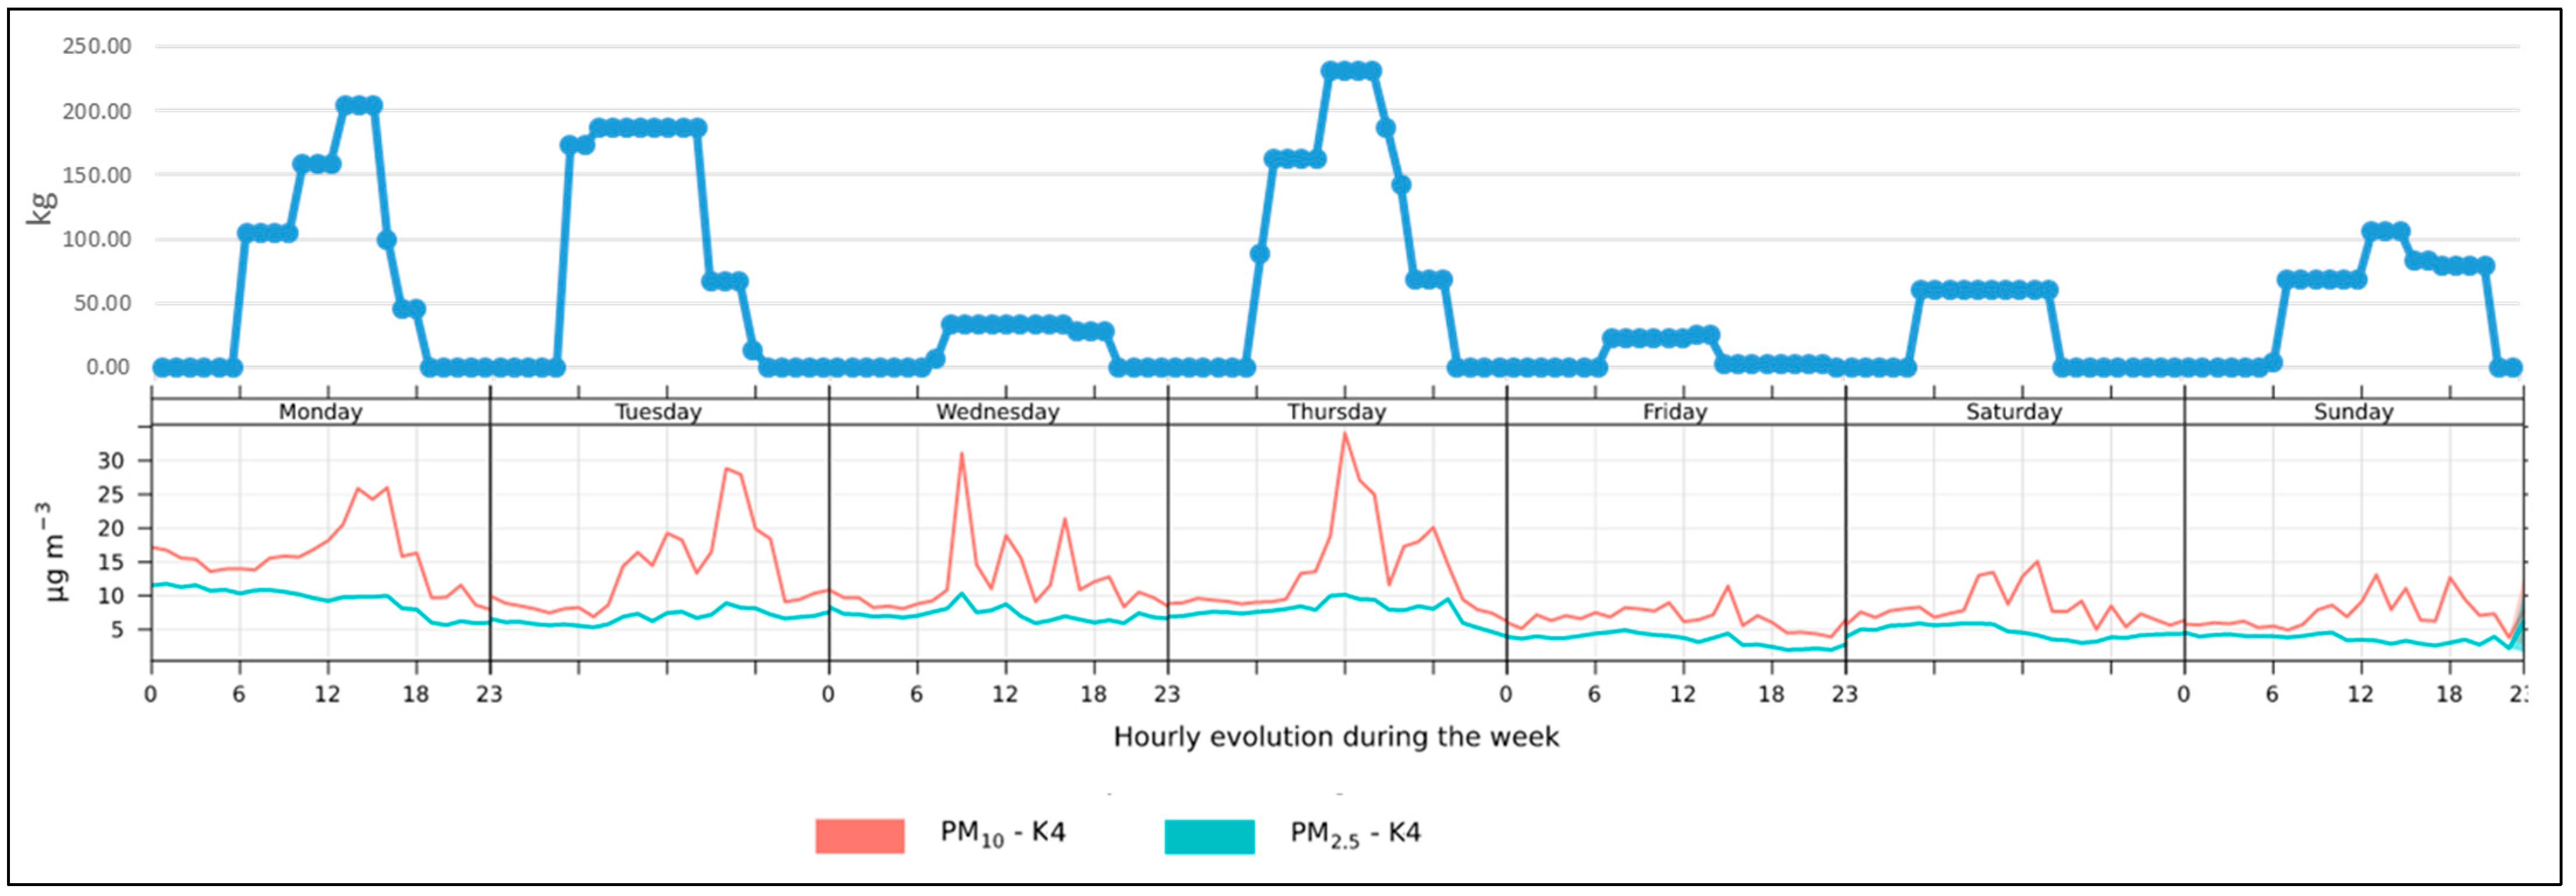
3.2. Temporal Variation of PM Concentration Data in Kotor Bay

Figure 3 and Figure 4 show 10-min temporal variations of the PM2.5 and PM10 concentrations measured by the four Kunak PM sensors over the experimental period.
When comparing PM2.5 mass concentration values for 4 measurement locations, it was visible that the profiles did not always overlap, and some considerable differences were observed (Figure 3). PM2.5 were in the ranges of 0.1–16.5 µg/m3, 0.4–36.9 µg/m3, 0.3–33.5 µg/m3, and 0.4–40.4 µg/m3 for K1, K2, K3, and K4, respectively. PM2.5 median values for the experimental period were 5.4 µg/m3, 7.4 µg/m3, 6.6 µg/m3, and 7.9 µg/m3 for K1, K2, K3, and K4, respectively.
Similar to PM2.5, profiles of PM10 mass concentration values for 4 measurement locations did not always overlap, and some considerable differences were observed (Figure 4). PM10 were in the ranges of 0.1–145.1 µg/m3, 0.7–235.1 µg/m3, 0.4–205.5 µg/m3, and 0.5–238.7 µg/m3 for K1, K2, K3, and K4, respectively. PM10 median values for the experimental period were 8.5 µg/m3, 11.9 µg/m3, 11.1 µg/m3, and 14.3 µg/m3 for K1, K2, K3, and K4, respectively.
For the same experimental period, the 24 h average values of PM2.5 and PM10 were determined by each measurement station. The daily averages of PM2.5 at each location (Figure 5a) varied but followed a similar trend, in the ranges of 1.4–11.9 µg/m3 (mean value 5.7 µg/m3), 1.6–14.8 µg/m3 (mean value 7.2 µg/m3), 1.5–14.4 µg/m3 (mean value 6.57 µg/m3), and 2.1–16.8 µg/m3 (mean value 8.0 µg/m3), for K1, K2, K3, and K4, respectively. It should be noted that the mean 24-h average PM2.5 concentrations for each of the four locations over the experimental period were below the WHO recommendation of 15 µg/m3 [29], with the exception of location K4 with two periods when these values were exceeded, first on 26 August and then on 6/7 September, with 15.3 µg/m3 and 16.8 µg/m3, respectively.
Similar to PM2.5, PM10 daily averages at each location (Figure 5b) varied but followed a similar trend, in the ranges of 2.1–22.9 µg/m3 (mean value 9.1 µg/m3), 3.1–28.5 µg/m3 (mean value 11.7 µg/m3), 3.0–25.9 µg/m3 (mean value 11.7 µg/m3), and 5.5–35.7 µg/m3 (mean value 14.4 µg/m3), for K1, K2, K3, and K4, respectively. It should be emphasized that for each of the four locations, the mean 24-h average PM10 concentrations throughout the study period were lower than the WHO recommendation of 45 µg/m3 and the Montenegrin air quality standard of 50 µg/m3 [30].

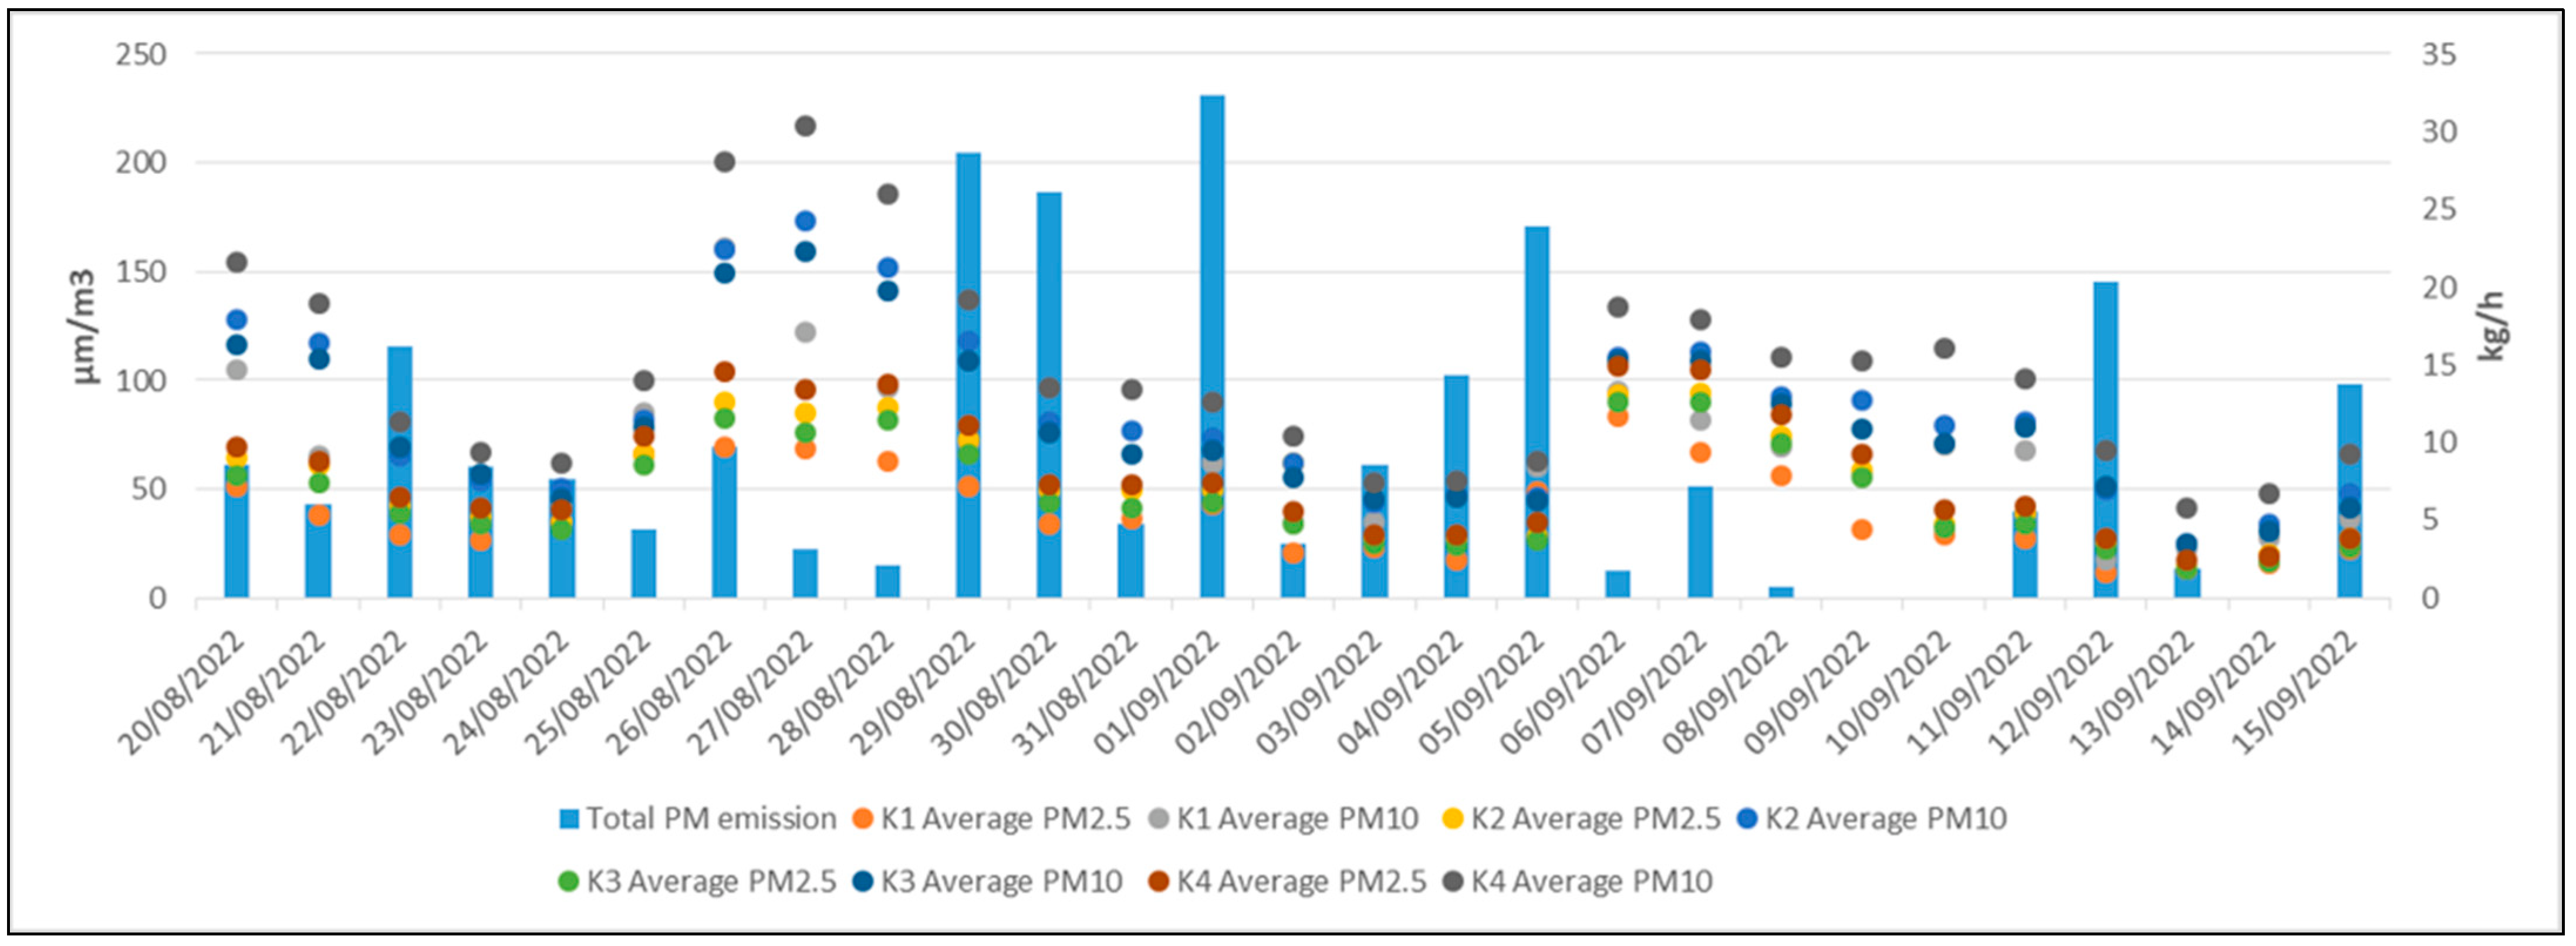
3.3. Estimation of Total Emission of PM from Cruise Ships in Kotor Bay

According to the methodology of Trozzi and Vaccaro [25], the estimated amounts of PM2.5,10 emitted from cruise ships entering the Port of Kotor during the identified operation modes (maneuvering and hoteling), together with other technical characteristics, are shown in Table 2.
Due to the limited capacity of the berth position (B), larger cruise ships were mostly anchored in position A1. During the experimental period, 44% of cruise ships were positioned at B, 33% at location A1, 15% at location A2, and only 8% at location A3 [22].
During the experimental period, the largest cruise ship had a gross tonnage of 142,714 BRT and was anchored at position A1, while the smallest cruise ship had a gross tonnage of 1206 BRT and was berthed at position B [22]. The average duration of the hoteling phase was 8.68 h, whereas the longest was 24 h for the ship in position B, and the shortest was 4 h for the same ship [22].

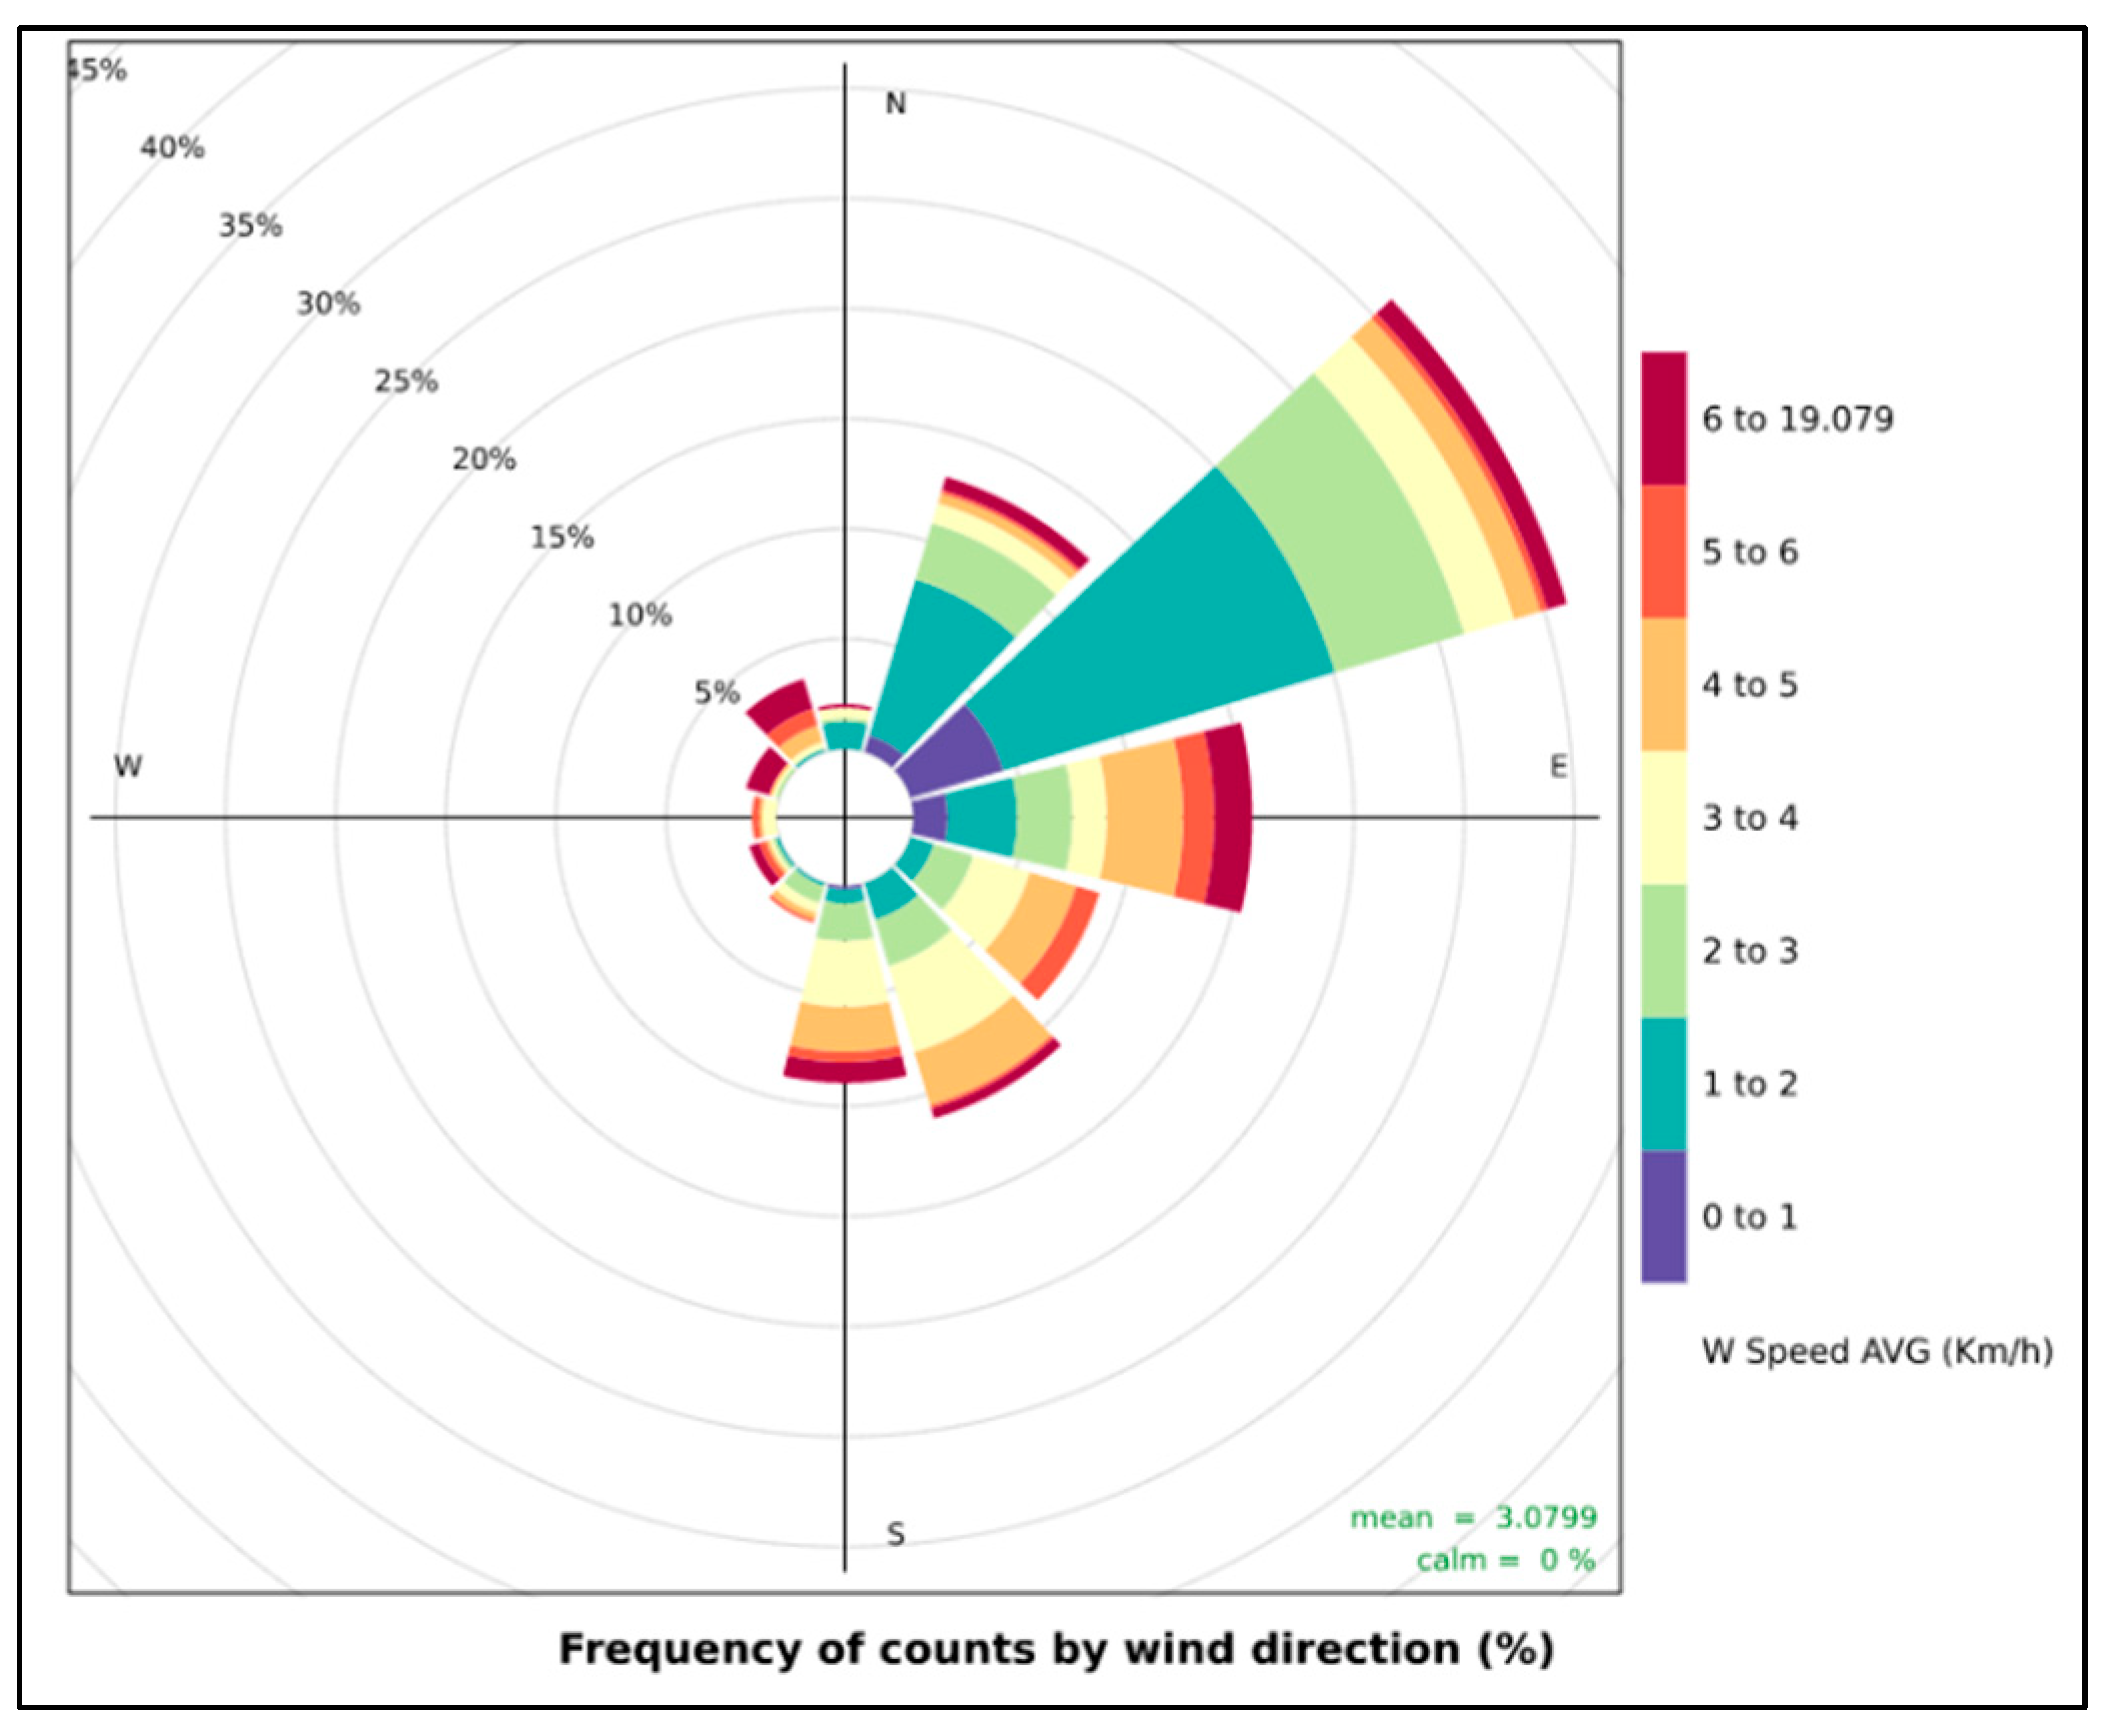
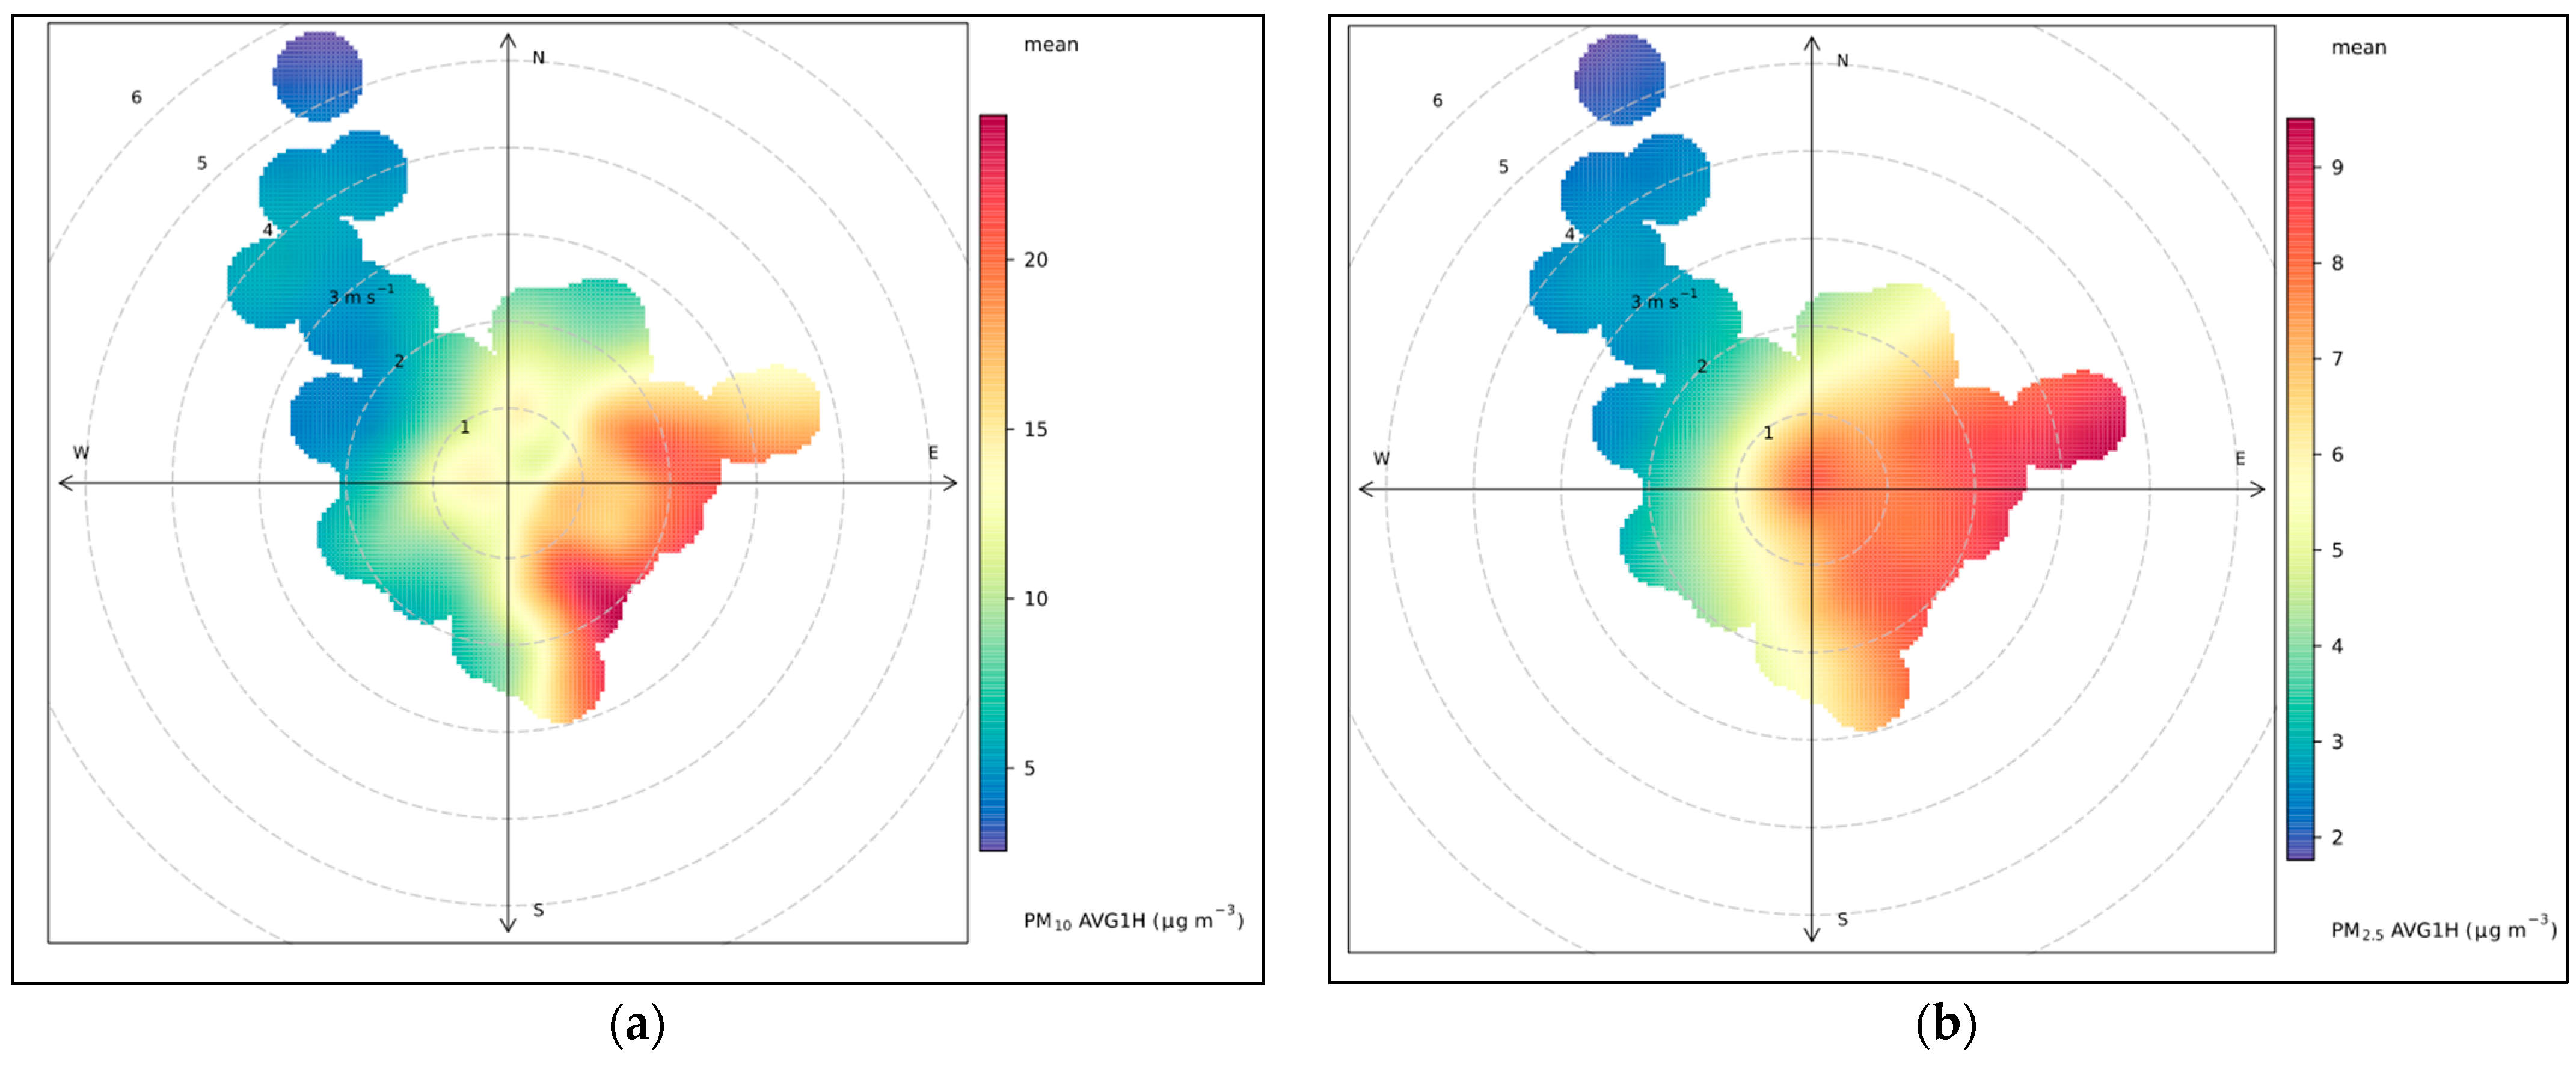
3.4. Correlation of PM Ambient Concentration with Cruise Ship Activities in Kotor Bay

Weather conditions, primarily rain precipitation and wind direction/speed, significantly influenced the PM concentration in the Kotor Bay area.
During the experimental period, the maximum and minimum temperatures were recorded at 35.9 °C and 16.9 °C, while the mean temperature was 25.8 °C. At the same time, air humidity ranged between the maximum value of 95.4% and a minimum of 24.0%, with the mean value of 61.2%.
Wind data were collected by the Kunak ultrasonic anemometer at the K2 measurement location over the experimental period. The wind was mild during this period, with a mean intensity of 3.1 km/h blowing from the mountain range east of Kotor Bay, with a prevailing ENE direction; therefore, ship emissions were largely carried from the east to the west side of the Bay region, as seen in Figure 6. As a consequence, the combined average values of the west side K3 and K4 measurement stations were 19.8% and 11.9% higher than those of the east side K1 and K2 for both PM10 and PM2.5, respectively (Figure 7).
Periods of the highest average wind speeds were observed on 20, 24–26, 29 August, and 4–5, 9, 12–13 September. The maximum daily average wind speed was 7.9 km/h, and the highest rate was 22.5 km/h. Both values were recorded on 12 September.
Rain precipitation during the experimental period was observed on 21 August, and 1–3, 9–10 September. Sunny periods were observed on 23–27, 31 August and 5–8, 12–13 September. Other days were mainly cloudy.
Over a period of sun and clouds with low wind speed weather, higher concentrations of PM10 (Figure 8a) and PM2.5 (Figure 8b) were recorded. On the other side, higher winds and rain precipitation significantly influenced the decrease in PM daily mean values, as shown in Figure 8.
Bivariate polar plots with wind direction presented on a radial scale provide information about the potential emission sources of analyzed air pollutants [31]. Using Openair tools [32], the PM2.5 and PM10 concentration distribution in the experimental period from 20 August to 15 September 2022 was presented for the K4 measuring location as a function of wind speed and direction (Figure 9). The K4 station was selected due to the highest measured average concentration of PM10 and PM2.5 during the experimental period. Figure 9 demonstrates that higher levels of PM are associated mainly with low wind speed and the inflow from nearby anchorages A2 and A1 during the hoteling phase and positioned ENE (A2) and SE (A1) from the station.
Figure 10 shows both the estimated total cruise ship PM emission and PM10/PM2.5 ambient concentrations for the observed period of time. For better visibility, a 7-day period was selected, from 29 August to 4 September 2022. When evaluating the data, it is worth noting that the cruise ship activities, linked to the realization of the ship’s operational phases (arrival/hoteling/departure), as described in Section 2.3, and estimated PM emissions (Table 2), affect the height of the PM ambient concentration spikes. This is more evident for PM10 than PM2.5.
When observing the whole experimental period, the daily average values of both PM2.5 and PM10 did not significantly correlate with the daily cruise ship’s estimated total PM emission (Figure 11).
As also previously suggested by [33], a cruise ship’s direct impact on PM concentration is best assessed using a higher temporal resolution.

4. Conclusions

The aim of this study was to examine whether the application of low-cost sensors in appropriate measurement locations can be properly monitored to follow changes in concentration levels and the distribution of suspended particles PM10 and PM2.5 in the local ambient air on a daily basis regarding the volume of cruise ship traffic in the Kotor Bay area.
The study presented in the paper pointed to a number of factors that directly affect the correlation in large percentages, but also raised a number of questions that will certainly be the subject of future research on this topic. In general, the analyzed PM concentrations, especially short-term concentration profiles, compared to the cruise ships’ data in the period from 20 August to 15 September 2022 in the Kotor Bay highlighted that the application of low-cost sensor networks and related IoT systems in the process of monitoring the impact of cruise ship traffic is justified to a substantial extent. Nevertheless, it is always recommended to conduct the monitoring campaign with the support of the relevant national authorities, aiming to perform the validation and periodical recalibration of devices with the standardized equipment prescribed by the relevant international standards.
Furthermore, the research indicated the need for the real-time monitoring of cruise ship activities in the Bay, potentially by implementing automatic tracking systems aiming to gather operational data with high-time resolution. In that case, the calculated PM emission values are expected to better correlate with the PM concentrations’ data captured by the Kunak sensors. Another potential course in further research may be focused on the detailed chemical analysis of particle samples collected at the Montenegrin EPA’s Air Quality Monitoring Station by applying standardized gravimetric methods to distinguish contribution levels of the air pollution from cruise ships through some of the source apportionment models.

Author Contributions

R.G.: Conceptualization, formal analysis, investigation, methodology, project administration, resources, validation, visualization, writing—original draft preparation. M.S.: Investigation, project administration, resources, visualization, writing—original draft preparation. G.D.: Methodology, resources, supervision, validation, writing—review and editing. D.N.: Conceptualization, formal analysis, investigation, methodology, project administration, resources, supervision, validation, visualization, writing—review and editing. All authors have read and agreed to the published version of the manuscript.

Funding

This research received no external funding.

Institutional Review Board Statement

Not applicable.

Informed Consent Statement

Not applicable.

Data Availability Statement

Not applicable.

Acknowledgments

This study was partially carried out within the sustainability of the results of the Interreg IPA CBC Italy-Albania-Montenegro 2014–2020 project no. 2018IT-AL-ME153, “Partnership for the Observation and study of new Routes and Transnational Sea-highways—PORTS” financed from 15 March 2018 to 14 December 2020, funded by EC and University of Montenegro.

Conflicts of Interest

The authors declare no conflict of interest.

References

  1. Viana, M.; Hammingh, P.; Colette, A.; Querol, X.; Degraeuwe, B.; De Vlieger, I.; Van Aardenne, J. Impact of maritime transport emissions on coastal air quality in Europe. Atmos. Environ. 2014, 90, 96–105. [Google Scholar] [CrossRef]
  2. Tzannatos, E. Ship emissions and their externalities for the port of Piraeus–Greece. Atmos. Environ. 2010, 44, 400–407. [Google Scholar] [CrossRef]
  3. Hulskotte, J.; Van der Gon, H.D. Fuel consumption and associated emissions from seagoing ships at berth derived from an on-board survey. Atmos. Environ. 2010, 44, 1229–1236. [Google Scholar] [CrossRef]
  4. Cullinane, K.; Cullinane, S. Atmospheric Emissions from Shipping: The Need for Regulation and Approaches to Compliance. Transp. Rev. 2013, 33, 377–401. [Google Scholar] [CrossRef]
  5. Corbett, J.J.; Winebrake, J.J.; Green, E.H.; Kasibhatla, P.; Eyring, V.; Lauer, A. Mortality from Ship Emissions: A Global Assessment. Environ. Sci. Technol. 2007, 41, 8512–8518. [Google Scholar] [CrossRef] [PubMed]
  6. Sofiev, M.; Winebrake, J.J.; Johansson, L.; Carr, E.; Prank, M.; Soares, J.; Vira, J.; Kouznetsov, R.; Jalkanen, J.-P.; Corbett, J.J. Cleaner fuels for ships provide public health benefits with climate trade-offs. Nat. Commun. 2018, 9, 406. [Google Scholar] [CrossRef] [PubMed] [Green Version]
  7. Sorte, S.; Rodrigues, V.; Borrego, C.; Monteiro, A. Impact of harbour activities on local air quality: A review. Environ. Pollut. 2020, 257, 113542. [Google Scholar] [CrossRef] [PubMed]
  8. Saraga, D.E.; Tolis, E.I.; Maggos, T.; Vasilakos, C.; Bartzis, J.G. PM2.5 source apportionment for the port city of Thessaloniki, Greece. Sci. Total Environ. 2019, 650 Pt 2, 2337–2354. [Google Scholar] [CrossRef] [PubMed]
  9. Sarigiannis, D.; Handakas, E.; Kermenidou, M.; Zarkadas, I.; Gotti, A.; Charisiadis, P.; Makris, K.; Manousakas, M.; Eleftheriadis, K.; Karakitsios, S. Monitoring of air pollution levels related to Charilaos Trikoupis Bridge. Sci. Total Environ. 2017, 609, 1451–1463. [Google Scholar] [CrossRef] [PubMed]
  10. Viana, M.; Amato, F.; Alastuey, A.; Querol, X.; Moreno, T.; Dos Santos, S.G.; Herce, M.D.; Fernández-Patier, R. Chemical Tracers of Particulate Emissions from Commercial Shipping. Environ. Sci. Technol. 2009, 43, 7472–7477. [Google Scholar] [CrossRef] [PubMed]
  11. Merico, E.; Conte, M.; Grasso, F.; Cesari, D.; Gambaro, A.; Morabito, E.; Gregoris, E.; Orlando, S.; Alebić-Juretić, A.; Zubak, V.; et al. Comparison of the impact of ships to size-segregated particle concentrations in two harbour cities of northern Adriatic Sea. Environ. Pollut. 2020, 266 Pt 3, 115175. [Google Scholar] [CrossRef] [PubMed]
  12. Nunes, R.A.O.; Alvim-Ferraz, M.C.M.; Martins, F.G.; Calderay-Cayetano, F.; Durán-Grados, V.; Moreno-Gutiérrez, J.; Jalkanen, J.-P.; Hannuniemi, H.; Sousa, S.I.V. Shipping emissions in the Iberian Peninsula and the impacts on air quality. Atmos. Chem. Phys. 2020, 20, 9473–9489. [Google Scholar] [CrossRef]
  13. Cao, J.; Chow, J.C.; Lee, F.S.; Watson, J. Evolution of PM2.5 Measurements and Standards in the U.S. and Future Perspectives for China. Aerosol Air Qual. Res. 2013, 13, 1197–1211. [Google Scholar] [CrossRef]
  14. Jahangiri, S.; Nikolova, N.; Tenekedjiev, K. An improved emission inventory method for estimating engine exhaust emissions from ships. Sustain. Environ. Res. 2018, 28, 374–381. [Google Scholar] [CrossRef]
  15. Nunes, R.; Alvim-Ferraz, M.; Martins, F.; Sousa, S. Assessment of shipping emissions on four ports of Portugal. Environ. Pollut. 2017, 231 Pt 2, 1370–1379. [Google Scholar] [CrossRef] [PubMed]
  16. Winnes, H. Air Pollution from Ships. Ph.D. Thesis, Chalmers University of Technology, Department of Shipping and Marine Technology, Gothenburg, Sweden, 2010. [Google Scholar]
  17. Joint Industry Guidance: The Supply and Use of 0.50%-Sulphur Marine Fuel. Available online: https://www.energiafed.be/fr/media/405/download (accessed on 15 September 2022).
  18. Hofman, J.; Peters, J.; Stroobants, C.; Elst, E.; Baeyens, B.; Van Laer, J.; Spruyt, M.; Van Essche, W.; Delbare, E.; Roels, B.; et al. Air Quality Sensor Networks for Evidence-Based Policy Making: Best Practices for Actionable Insights. Atmosphere 2022, 13, 944. [Google Scholar] [CrossRef]
  19. Jayaratne, R.; Kuhn, T.; Christensen, B.; Liu, X.; Zing, I.; Lamont, R.; Dunbabin, M.; Maddox, J.; Fisher, G.; Morawska, L. Using a Network of Low-cost Particle Sensors to Assess the Impact of Ship Emissions on a Residential Community. Aerosol Air Qual. Res. 2020, 20, 2754–2764. [Google Scholar] [CrossRef]
  20. Cruise Activities in Med-Cruise Ports Statistics Report 2021. Available online: https://www.medcruise.com/news/3d-flip-book/2021-statistics-report (accessed on 15 September 2022).
  21. Cruise Activities in Med-Cruise Ports Statistics Report 2019. Available online: https://www.medcruise.com/news/3d-flip-book/2019-medcruise-statistics-report (accessed on 15 September 2022).
  22. Official Web Site of Port of Kotor. Available online: https://www.portofkotor.co.me/ (accessed on 15 September 2022).
  23. Open Sea Map. Available online: https://map.openseamap.org/ (accessed on 15 September 2022).
  24. Kunak. Available online: https://www.kunak.es/ (accessed on 15 September 2022).
  25. Trozzi, C.; Vaccaro, R. Methodologies for estimating air pollutant emissions from ships: A 2006 update. Environment & Transport. In Proceedings of the 2nd International Scientific Symposium (including 15th Conference Transport and Air Pollution), Reims, France, 12–14 June 2006. [Google Scholar]
  26. Regional Sulphur Emission Limits at a Glance. Available online: https://www.gard.no/web/updates/content/29212584/regional-sulphur-emission-limits-at-a-glance (accessed on 15 September 2022).
  27. Ward, D. Berlitz Cruising & Cruise Ships 2020; Apa Publications Ltd.: London, UK, 2021; p. 75. [Google Scholar]
  28. European Standard EN 12341. Ambient Air—Standard Gravimetric Measurement Method for the Determination of the PM10 or PM2,5 Mass Concentration of Suspended Particulate Matter (English version). Available online: https://cdn.standards.iteh.ai/samples/29133/5dca9312c2084eeaab0957f0f98e4cb7/SIST-EN-12341-2014.pdf (accessed on 15 September 2022).
  29. Ambient (Outdoor) Air Pollution. Available online: https://www.who.int/news-room/fact-sheets/detail/ambient-(outdoor)-air-quality-and-health (accessed on 15 September 2022).
  30. Monthly Reports on Air Quality (Mjesečni Izvještaji o Kvalitetu Vazduha). Available online: https://epa.org.me/mjesecni-izvjestaji-o-kvalitetu-vazduha/ (accessed on 15 September 2022).
  31. Carslaw, D.C.; Beevers, S.D. Characterising and understanding emission sources using bivariate polar plots and k-means clustering. Environ. Model. Softw. 2013, 40, 325–329. [Google Scholar] [CrossRef]
  32. Carslaw, D.C.; Ropkins, K. Openair—An R package for air quality data analysis. Environ. Model. Softw. 2012, 27–28, 52–61. [Google Scholar] [CrossRef]
  33. Donateo, A.; Gregoris, E.; Gambaro, A.; Merico, E.; Giua, R.; Nocioni, A.; Contini, D. Contribution of harbour activities and ship traffic to PM2.5, particle number concentrations and PAHs in a port city of the Mediterranean Sea (Italy). Environ. Sci. Pollut. Res. Int. 2014, 21, 9415–9429. [Google Scholar] [CrossRef] [PubMed]
Figure 2. A correlation analysis of the PM10 data gathered by EPA’s sampler and K1 low-cost sensors for the experimental period from 20 August to 15 September 2022.
Atmosphere 13 01819 g002
Figure 3. PM2.5 mass concentration in µm/m3 as (10 min) time series for each of 4 measurement locations K1, K2, K3, and K4 for the measuring period from 20 August to 15 September 2022.
Atmosphere 13 01819 g003
Figure 4. PM10 mass concentration in µm/m3 as (10 min) time series for each of 4 measurement locations K1, K2, K3, and K4 for the measuring period from 20 August to 15 September 2022.
Atmosphere 13 01819 g004
Figure 5. The 24 h average values of PM2.5 (a) and PM10 (b) in µm/m3 for each measurement location over the experimental period.
Atmosphere 13 01819 g005
Figure 6. Average wind speed and direction at K2 measurement location over the experimental period 20 August–15 September 2022.
Atmosphere 13 01819 g006
Figure 7. Average concentrations of PM for 4 measurement locations over the experimental period 20 August–15 September 2022.
Atmosphere 13 01819 g007
Figure 8. Average wind speed vs. PM10 (a) and PM2.5; (b) 24 h average over the experimental period 20 August–15 September 2022.
Atmosphere 13 01819 g008
Figure 9. Bivariate polar plot of PM2.5 (a) and PM10 (b) concentrations at the K4 measuring location during experimental period from 20 August to 15 September 2022. Each plot’s center indicates a wind speed of zero, which rises radially outward. The color scale indicates the concentration of PM.
Atmosphere 13 01819 g009
Figure 10. Estimated total cruise ship PM emission (kg) in Kotor Bay vs. PM10 and PM2.5 ambient concentrations (µm/m3) at K4 measurement location over an observed period from 29 August to 4 September 2022.
Atmosphere 13 01819 g010
Figure 11. Estimated total cruise ship PM emission vs. PM10/PM2.5 daily average ambient concentrations for all measurement locations over the experimental period.
Atmosphere 13 01819 g011
Table 1. Categorization of cruise ships in the Port of Kotor in 2022 [22,27].
Cruise Ship CategoryGross TonnageNumber of Cruise Ships
Boutique ship1000–50007
Small ship5001–50,00010
Mid-size ship50,001–101,0009
Large resort ship>101,0013
Table 2. Total estimated amounts of PM2.5,10 emitted from cruise ships during the experimental period including specific technical characteristics and operational conditions [22,25].
DateTotal PM2.5,10 Emitted (kg)Total BRTLocations
20/August/202260.8690,280A1
21/August/202242.81170,528B, A1
22/August/2022115.22231,466A1, A2
23/August/202260.22103,664B, A1
24/August/202254.9779,442B, A1, A2
25/August/202231.6734,610B, A1
26/August/202269.6740,790B
27/August/202222.7014,745B
28/Augus/202215.2665,542B
29/August/2022204.27308,986A1, A2, A3
30/August/2022186.72356,964B, A1, A2, A3
31/August/202233.9734,729B, A1
01/September/2022230.70352,410B, A1, A2, A3
02/September/202225.0950,098B, A1
03/September/202260.8690,280A1
04/September/2022102.2987,040B, A1, A2
05/September/2022170.59299,017B, A1, A2, A3
06/September/202212.6550,795B
07/September/202250.9476,883B, A1
08/September/20224.994333B
09/September/20220.000-
10/eptember/20220.000-
11/September/202240.00161,370B, A1
12/September/2022145.63231,420B, A1, A2
13/September/202213.639976B
14/September/20220.000-
15/September/202298.28148,302B, A1
Total1854.013,093,670-
Publisher’s Note: MDPI stays neutral with regard to jurisdictional claims in published maps and institutional affiliations.

