Communication

Is Portugal Starting to Burn All Year Long? The Transboundary Fire in January 2022

by
Flavio T. Couto
1,2,3,*,
Filippe L. M. Santos
1,2,3,
Cátia Campos
1,3,
Nuno Andrade
1,3,4,
Carolina Purificação
1,2,3 and
Rui Salgado
1,2,3,5
1
Instituto de Ciências da Terra (ICT), Rua Romão Ramalho 59, 7000-671 Évora, Portugal
2
Instituto de Investigação e Formação Avançada (IIFA), Universidade de Évora, Palácio do Vimioso, Largo Marquês de Marialva, Apart. 94, 7002-554 Évora, Portugal
3
Earth Remote Sensing Laboratory (EaRS Lab.), Rua Romão Ramalho 59, 7000-671 Évora, Portugal
4
Escola de Ciências Sociais, Colégio do Espírito Santo, Universidade de Évora, Largo dos Colegiais 2, 7000-645 Évora, Portugal
5
Departamento de Física, Escola de Ciência e Tecnologia, Universidade de Évora, Rua Romão Ramalho 59, 7000-671 Évora, Portugal
*
Author to whom correspondence should be addressed.
Atmosphere 2022, 13(10), 1677; https://doi.org/10.3390/atmos13101677
Submission received: 30 August 2022 / Revised: 5 October 2022 / Accepted: 10 October 2022 / Published: 14 October 2022
(This article belongs to the Section Climatology)

Abstract

:
Changes in the large fire seasons induced by climate variability may have implications in several sectors of modern society. This communication aims to investigate possible changes in the behaviour of active fires during the wintertime and document an event that occurred in the transboundary mountainous region in the north-western Iberian Peninsula between Portugal and Spain on 28 January 2022. The VIIRS active fire data, a satellite product, were analysed for the period between December 2012 and February 2022. The Meso-NH model was used to explore the atmospheric conditions during the event that burned almost 2400 ha. It was configured in a single domain with a horizontal resolution of 1500 m (300 × 300 grid points). The study highlights an increase in fire occurrence during the winter of 2021/22 and indicates that climate variability may create atmospheric conditions propitious for fire development even during the winter. The mild temperatures, dry air, and easterly flow affecting northern Portugal played an important role in the fire that occurred on 28 January 2022. Local orographic effects associated with downslope flow favoured fire propagation. Given the lack of knowledge about large winter fires, this study can be a starting point for future research on this subject.

1. Introduction

Nowadays, forest fires are becoming a transversal problem threatening several regions worldwide. The large fires result from the interaction of multiple factors such as atmospheric conditions determined by climate and weather patterns, fuel, orography, landscape, soil use, and anthropogenic factors. Changes in fire seasons may have implications for the Earth’s systems (e.g., Cryosphere, Biosphere, and Atmosphere) beyond affecting different socioeconomic activities (e.g., pastures, agriculture, business, and tourism).
In the mountain cryosphere, for example, an increase in fire activity together with climate changes may influence glacier melt, an important source of freshwater. The melt may occur from the impacts of smoke on the atmospheric conditions above the glacier or by soot deposition, which decreases the surface albedo on the glacier [1,2,3]. Extreme fire seasons also affect biodiversity in many forested areas. In 2017, the wildfires in Southern Spain affected many endangered plant and animal species of the Doñana Natural Park [4].
In the Earth’s atmosphere, it is essential to understand the role of large fires in air pollution. In North America, anthropogenic pollution has been decreasing over the last two decades, but mega-fires have become an important source of pollution [5]. On the other hand, the effects of climate change may create environments characterized by warmer and drier conditions, thereby making the fire season longer and more intense, with larger wildfires, an earlier start, and a delayed end in different regions [6,7,8,9]. The drought-induced extreme fire outbreaks in the Pantanal biome (Brazil) in 2020 were the most dangerous recorded in the last 70 years [10]. In Chile, the 2016/17 wildfire outbreak was characterized by extremely high temperatures and intense winds that led to the worst fire season in the country [11]. In addition, some extreme wildfires have been marked by events with strong convective processes in their plumes. These powerful updrafts can trigger fire-generated thunderstorms [12].
In Portugal, the 2017 Pedrógão Grande mega-fire showed the complexity behind the deadly wildfires. The development of pyro-cumulonimbus clouds and the fires’ interactions with the dry thunderstorm environment produced extreme fire behaviour [13,14]. The location and shape of the Azores Anticyclone play an important role during the fire season in Portugal. Over Madeira Island, the complex terrain creates orographic effects that increase the local fire danger [15], whereas on mainland Portugal, the anticyclone circulation together with the thermal low over the Iberian Peninsula effects the wind intensity on the western coast, favouring the rapid spread of the fire, such as the behaviour verified during the Vila de Rei wildfire in July 2019 [16]. Extreme fires have a direct negative impact on the tourism sector, decreasing tourist visits or damaging visitor facilities and infrastructures, thus ceasing the main economic activity for many regions [17,18,19,20]. All these facts demonstrate that the current concept of “Living with fire” is true, needed, and requires inter- and transdisciplinary efforts to understand and mitigate the impacts of these mega-fires, e.g., in [21].
Prescribed burning usually occurs in winter, once there are conditions to control a fire, with lower temperatures and higher relative humidity. Climate change may influence the weather conditions under which they occur; consequently, a better understanding of the weather patterns during the winter season is essential for safe and effective prescribed burning [22]. For example, a fire occurring over complex terrain may have an unexpected propagation if the wind is weak and not aligned with the slope [23]. Recently, it has been shown that climate change may decrease the role played by prescribed burning in wildfire risk mitigation [24,25,26], indicating the importance of effective climate change mitigation [27].
The motivation of the present study is increasing the knowledge of the environmental factors that can lead to fire-conducive weather conditions throughout the year. Such knowledge is important to improving community safety and firefighting strategies. This communication aims to investigate possible changes in the behaviour of active fires during the wintertime and document an event that occurred in the transboundary mountainous region in the north-western Iberian Peninsula between Portugal and Spain on 28 January 2022. The text is organized as follows: Section 2 presents the data used, the choice of the case study, and numerical modelling aspects. The results and discussion are found in Section 3. Section 4 provides the conclusions of the study.

2. Materials and Methods

To achieve the study’s objective, the satellite data were used to identify the fire activity between 10 winter periods (2012/2013 to 2021/2022) and the fire characteristics during a case study. The months December, January, and February were considered as winter periods. The satellite data’s analysis is complemented by weather station data and a numerical experiment conducted on the case study in order to identify the main atmospheric conditions favouring fire propagation. The data, the case study, and the numerical experiment are described below.

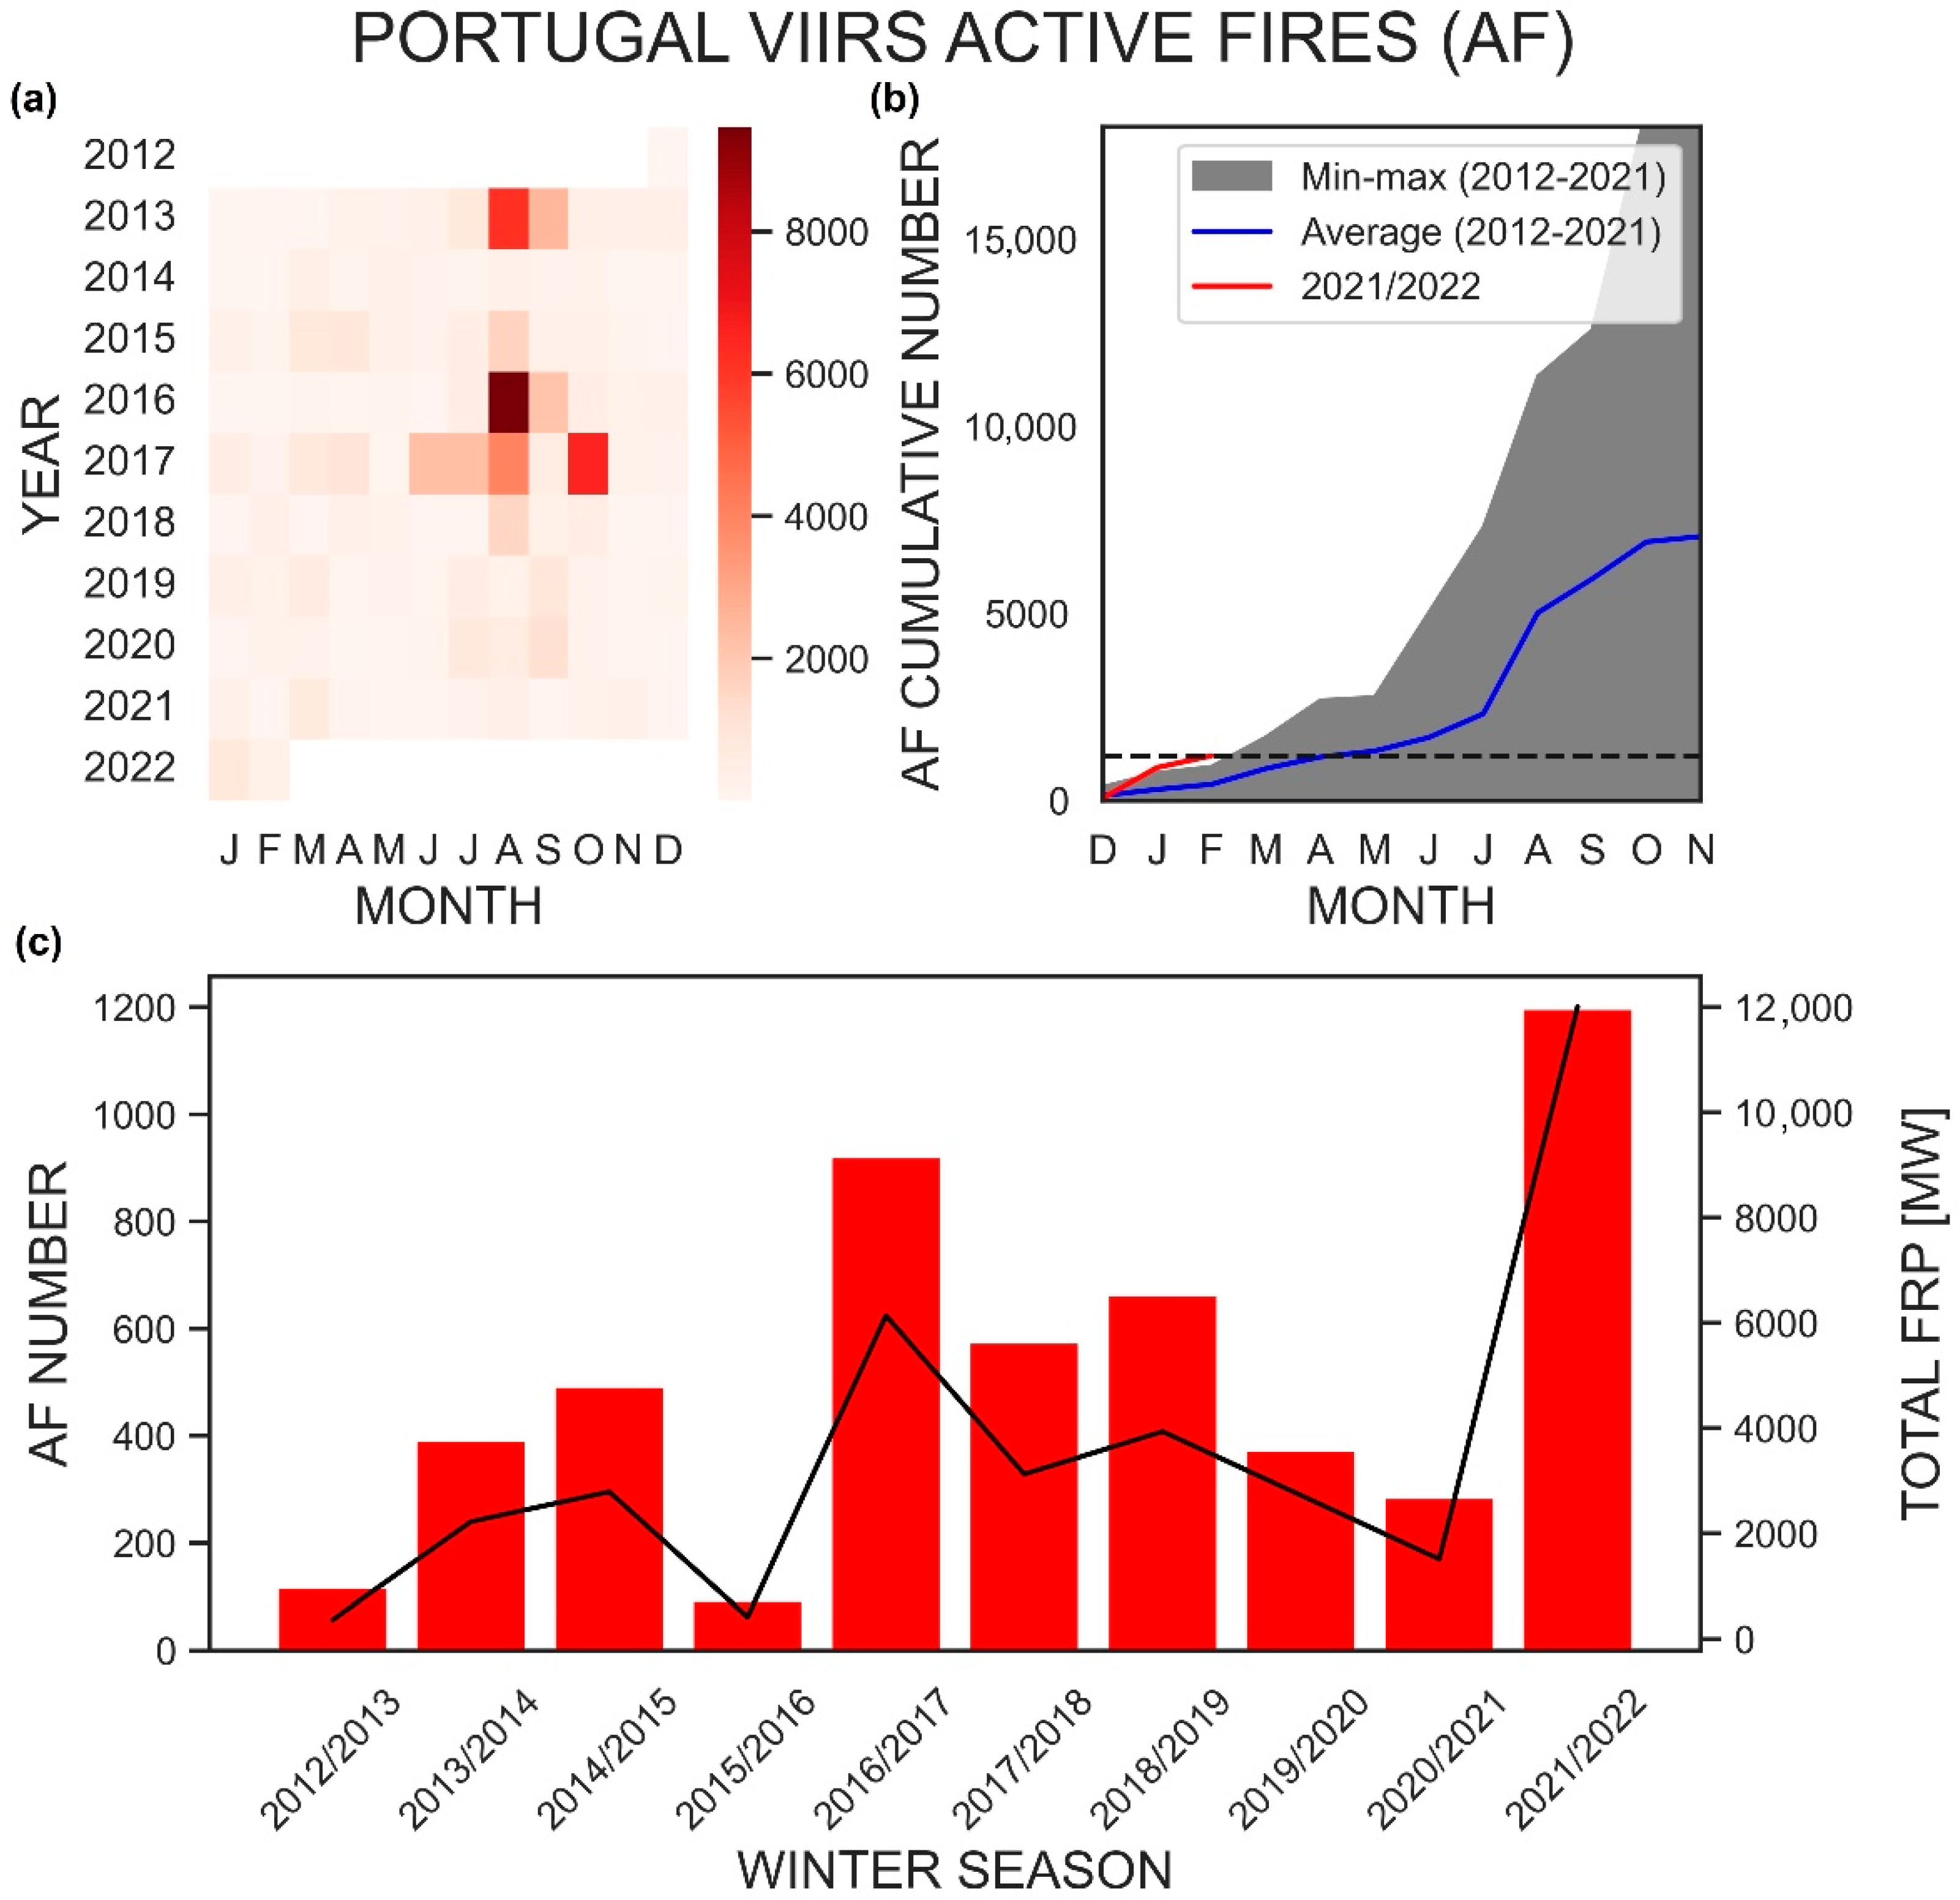
2.1. Satellite Data (VIIRS 375 m Active Fire Product)
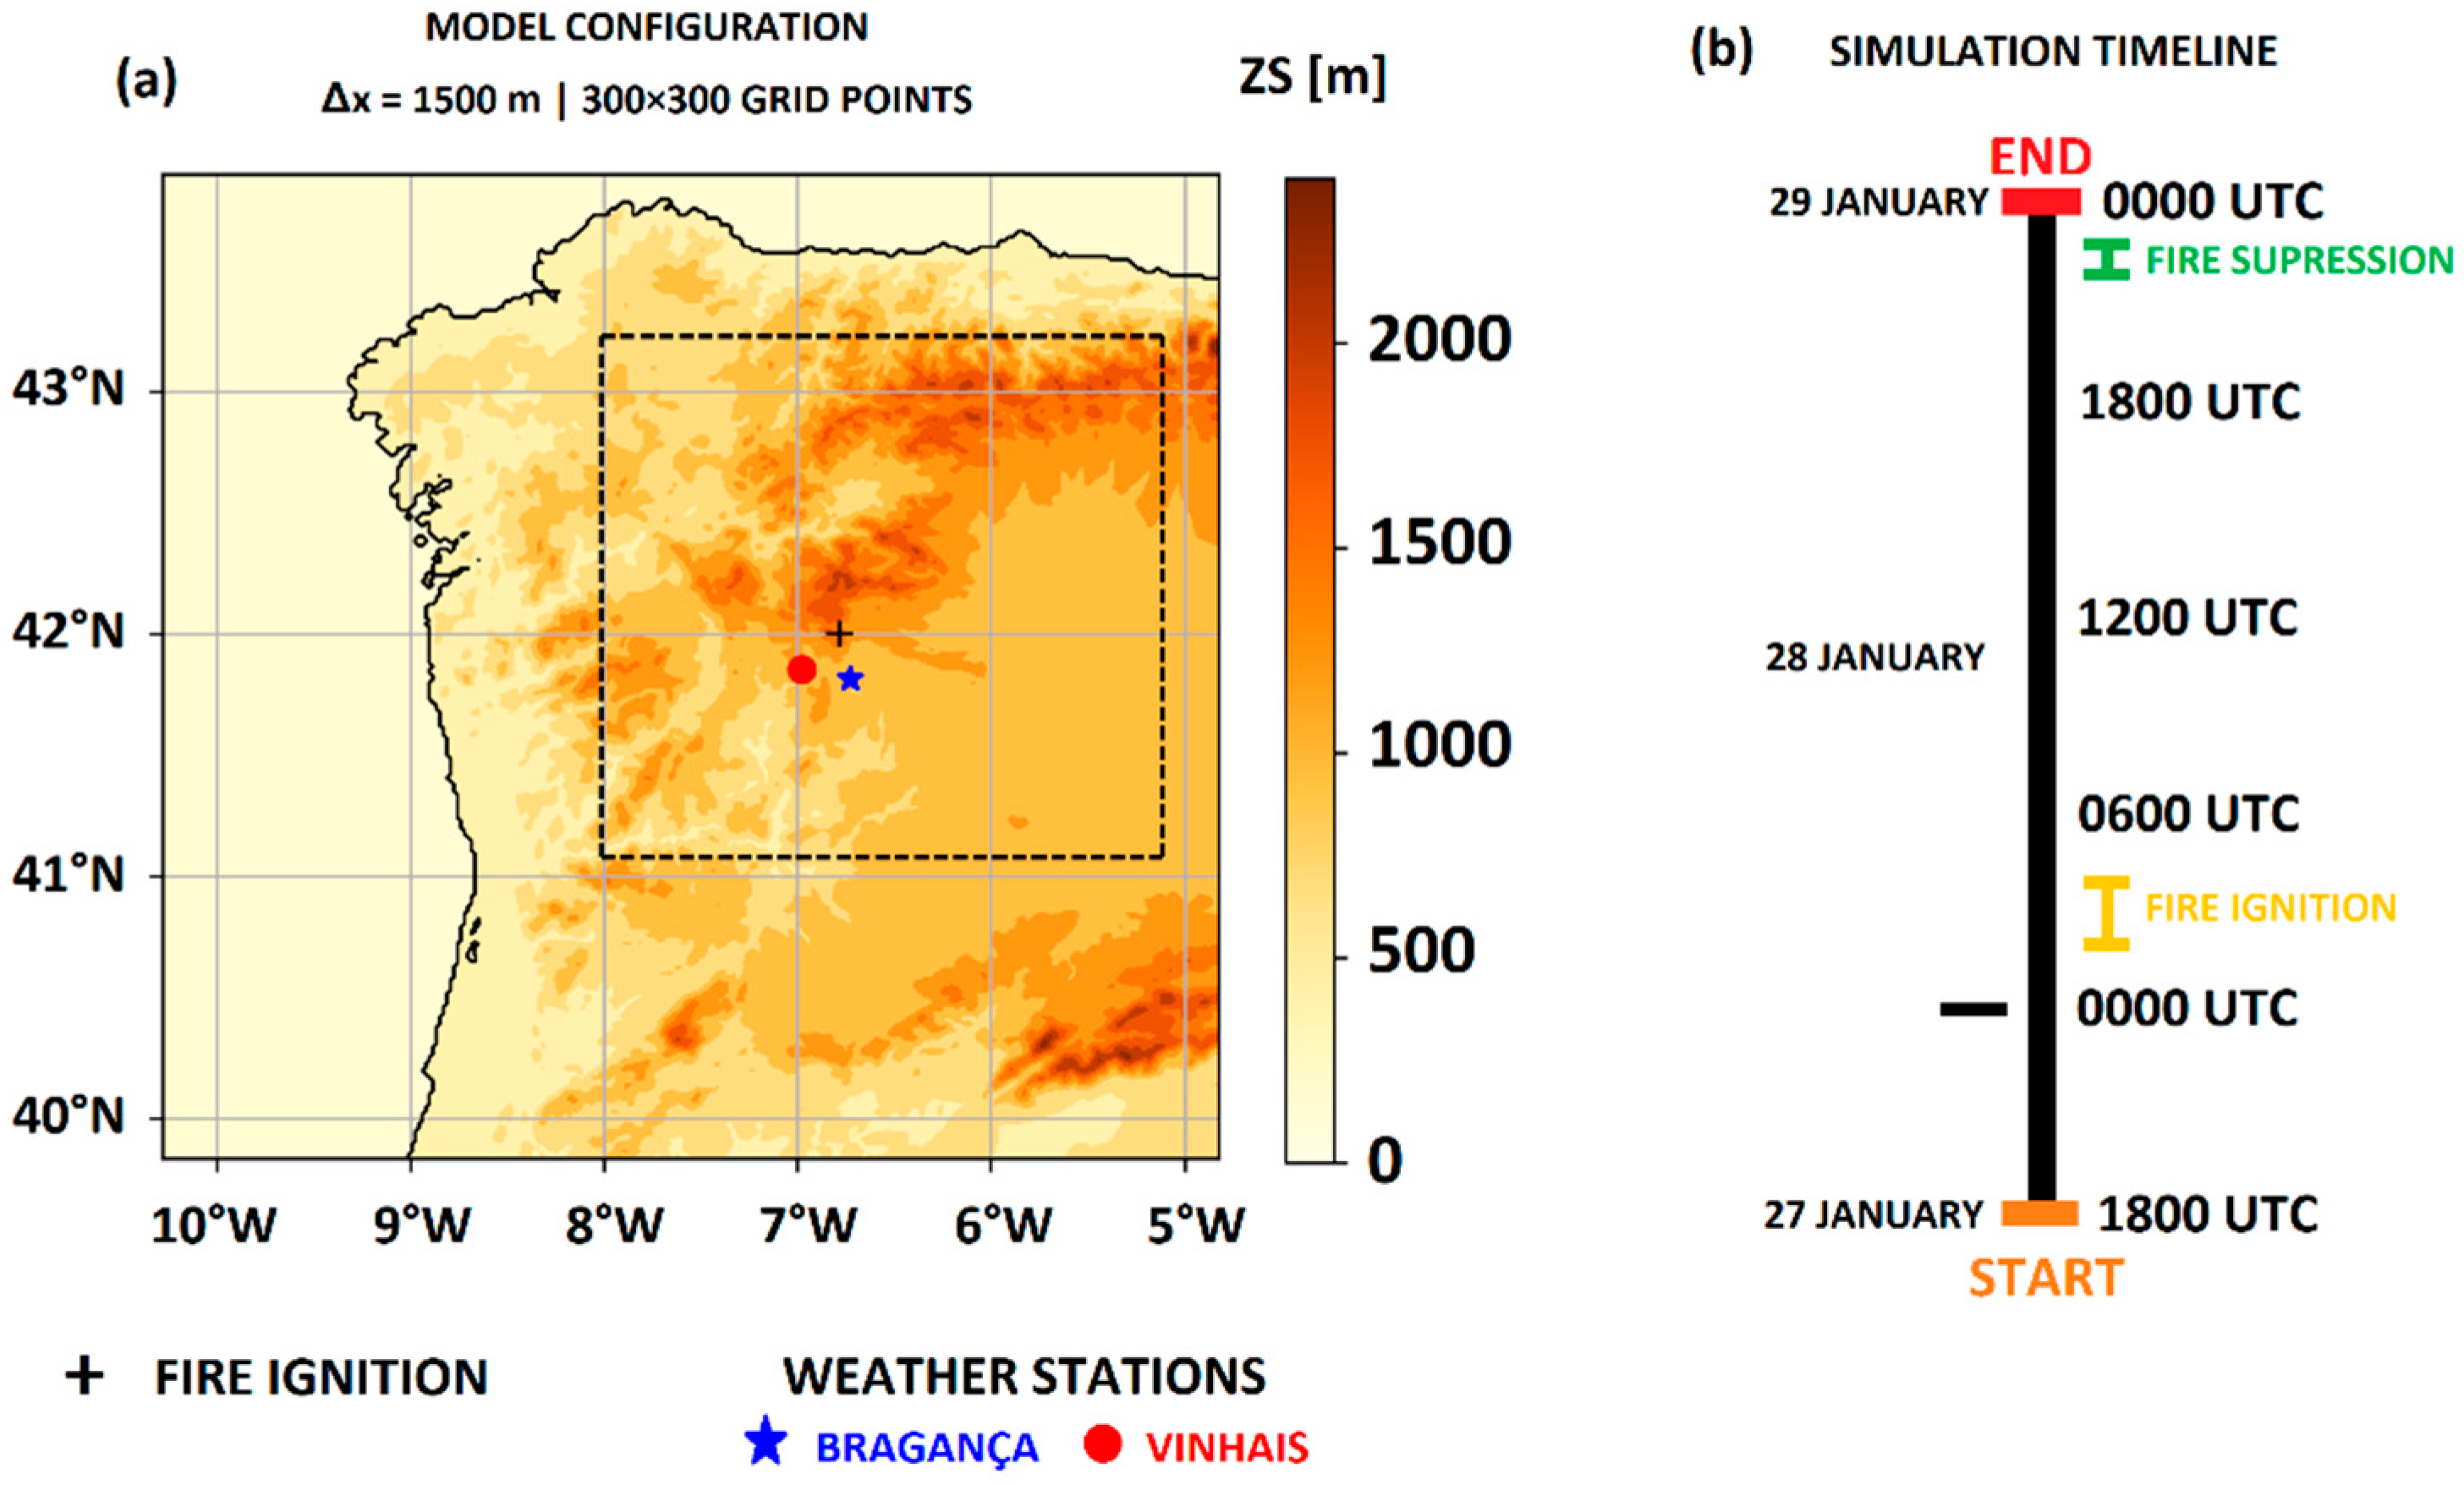
Fire activity was determined using the Visible Imaging Radiometer Suite (VIIRS) 375 m thermal anomalies/active fire product algorithm [28]. The active fire product provides data from the VIIRS sensor aboard the joint NASA/NOAA Suomi National Polar-orbiting Partnership (Suomi NPP) and NOAA-20 satellites, as well as information for each location across the globe at least twice a day. The VIIRS sensor has a better spatial and spectral resolution and a larger swath at 3000 km that provides full global imagery every day. The VIIRS active fire product can detect small fires and improve the spatial agreement with the burned area perimeter [28]. The 375 m data have improved nighttime performance, allowing for their use in support of fire management (e.g., near real-time alert systems) since they include the fire’s location and intensity along with point sources for smoke plumes.
Fire Radiative Power (FRP) represents the rate of emitted radiative energy by the fire during the observation. FRP depicts the pixel-integrated fire radiative power in MW (megawatts). Higher FRP values equate with higher fire intensity and/or larger fires [28]. Smouldering fires are generally 175–575 °C, whereas intense fires reach 525–925 °C. Burning characteristics also depend on fuel type, moisture, temperature, and wind. The VIIRS active fire data are used for the period between December 2012 and February 2022. Aiming to minimize false alarms, i.e., when a fire is falsely identified, only pixels with presumed vegetation fires (type 0) were considered.

2.2. Case Study

Large fires are still among the biggest preoccupations in Portugal due to the magnitude of summer events. However, large fires in the green zones do not usually occur during the winter season, since the temperatures are normally very low and the moisture relatively high. According to the official statistics published in 2022 [29], the period between 28 and 31 January was marked by 10 fires: day 28 (3 fires), day 29 (3 fires), day 30 (1 fire), and day 31 (3 fires). It is noteworthy that January burned 5697 ha, which is 10 times greater than the annual average (ha/year) for the decade (2012/2021) during the same period. Furthermore, the region affected by the January fires, namely, the north region, is characterized by a high population density, large urban agglomerations, and the use of fire in agroforestry management [29].
The case study presented herein corresponds to the transboundary fire that started in the Montesinho Natural Park on 28 January 2022. As stated by the authorities, the fire started at 04h00 AM in Lama Grande, Bragança, and extended to the Spanish territory. Efforts were made by both countries to control the fire. According to the reports, an area of almost 2400 ha, comprising a large part of the bush area, burned throughout the event. For firefighters, the precarious infrastructure required to access the park and the Felgueira village’s proximity were the biggest challenges. The fire was under control at 11h15 PM local time on 28th January.
The Montesinho Natural Park is in the region of Trás-os-Montes, encompassing the northern part of the councils of Bragança and Vinhais. The park features two large mountains: Serra da Coroa and Serra de Montesinho, from which the name of the park is derived. This Natural Park was created in 1979, with over 74,000 ha and 92 villages with around 9000 inhabitants. The minimum altitude is 438 m, and the maximum is 1486 m. Regarding activities to undertake in the park, it is possible to engage in pedestrian walks or to find interpretive paths and the centre for the Iberian wolf.

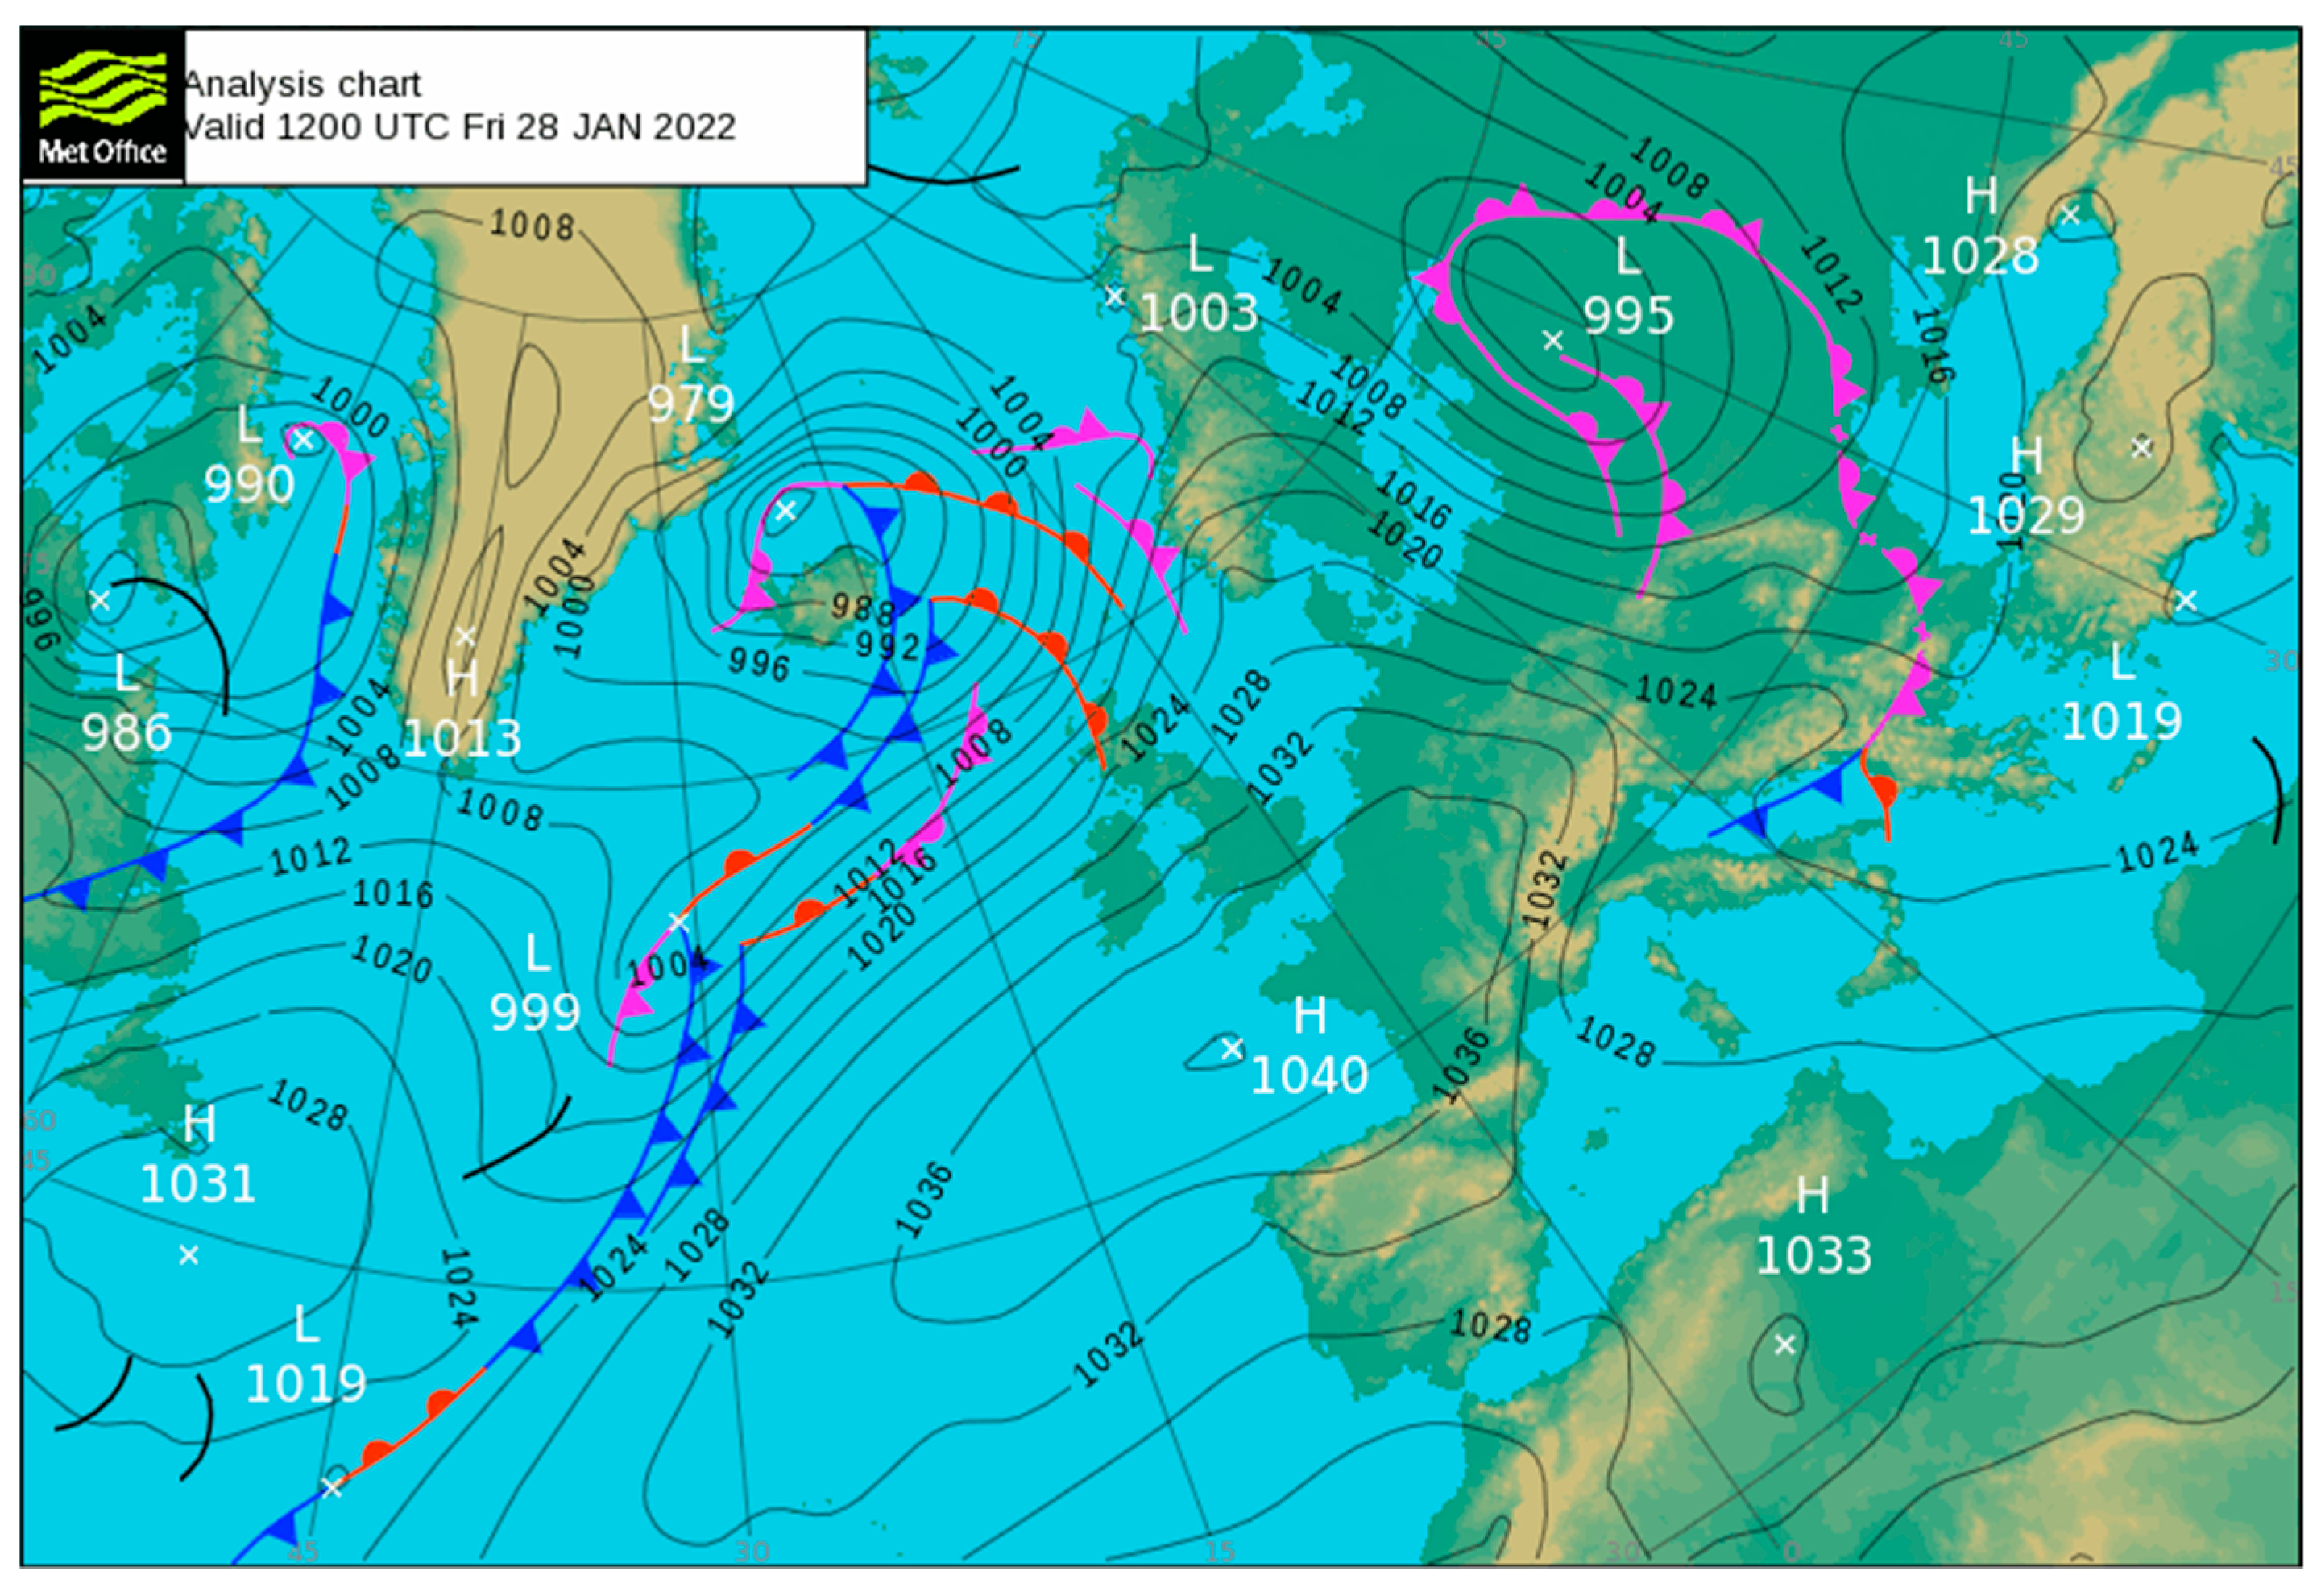
2.3. Synoptic Charts and Weather Station Data

The large-scale environment was identified through the analysis of synoptic meteorological charts covering Europe provided by the Met Office [30]. The Portuguese Institute for Sea and Atmosphere, I. P. (IPMA, IP), has provided the weather station data for the study. The observations of two meteorological stations located near the transboundary fire have been used to evaluate the model’s performance and analyse meteorological parameters including temperature, relative humidity, and wind gusts. The observations were also used to identify the fire-conducive weather conditions during January 2022. The stations’ locations are shown in Figure 1a (see Section 2.4 for the model setup). The climatological series of temperature and precipitation from October 2021 to January 2022 have been analysed from the monthly climate bulletins released by the IPMA and are available online at [31].

2.4. Numerical Experiment

The current atmospheric models can accurately diagnose changes in near-surface air temperature, relative humidity, and wind speed, which can contribute to the rapid spread of fires. This study explores the atmospheric conditions on 28 January 2022 based on a numerical simulation using the Meso-NH model.
The non-hydrostatic mesoscale atmospheric model Meso-NH [32] is implemented with a rather complete parametrization package of sub-grid scale physical processes in the atmosphere (e.g., convection, cloud microphysics, cloud electricity, turbulence, surface processes, dust emission and transport, etc.). The one-moment microphysical scheme predicts the mass-mixing ratios of cloud water, rain, graupel, snow, and ice (ICE3) [33]. The turbulence scheme is based on a 1.5-order closure [34]. Shallow convection is parameterized according to [35]. The radiation parameterization is based on the Rapid Radiative Transfer Model [36].
The near surface meteorological variables are obtained from the externalised platform of surface models, SURFEX [37], which is coupled to Meso-NH. In the context of forest fires, the model has been successfully used to represent fire-inducing weather conditions over complex terrains [15], under dry thunderstorm environments [13], or coupled with fire propagation models (e.g., ForeFire model [38,39] and Blaze model [40]).
For the purposes of the study, the model was configured in a single domain with a horizontal resolution of 1500 m (300 × 300 grid points) and centred around the point of the fire’s ignition (Figure 1a). The vertical grid was configured with 50 sigma levels unequally spaced, stretching gradually from 30 m (bottom) to 900 m (top). The fire–atmosphere interactions were not considered in the experiment. The 6 h analysis from European Centre for Medium-Range Weather Forecasts (ECMWF) provided the initial conditions and allowed for the model’s integration between 27 January at 1800 UTC and 29 January at 0000 UTC (Figure 1b).
The horizontal resolution used is six times finer than that of the ECMWF analysis, used here for initial and boundary conditions. At this scale, Meso-NH is a cloud-resolving model, able to resolve the main mesoscale atmospheric processes. The small-scale circulations due to orographic features and surface heterogeneities are better represented. The evolution of the boundary layer’s structure is also expected to be better modelled. Meso-NH kilometric- (or finer) scale simulations have been successfully used over Portugal, namely, in the study of extreme meteorological events cf. [41] and thermal circulations due to surface contrasts cf. [42].
The model experiment was validated using two weather stations (Figure S1). Figure S1a shows the comparison between the wind gusts simulated and observed. In Bragança station, the wind gusts simulated are close to the observations with maximums of around 10 m s−1 during the afternoon of 28 January. However, in Vinhais station (Figure S1b), the maximum wind gusts observed are 20 m s−1 at 1200 UTC, which were underestimated by the model. Such a difference may be explained by the feedback effects of the fire on the atmosphere that are not represented by the atmospheric model. Considering other meteorological variables, such as the lower/higher observed relative humidity/air temperatures, when compared with the values simulated (Figure S1c,d), they may also have occurred as a consequence of the wildfire that occurred precisely in this region. As mentioned previously, the fire’s effects were not considered by the model. In addition, it is important to note the minimum relative humidity observed of 18% at 1600 UTC on 28 January 2022 and the maximum air temperature observed of 13.9 °C at 1500 UTC.

3. Results and Discussion

3.1. Winter Fires in Portugal

Over the period considered, 2012–2022, fires occurred in all seasons, but to different extents. Figure 2a shows, as expected, that the greatest fire activity occurs in the summer months, but some fires break out in other seasons. October 2017, for example, was marked by mega-fires during the passage of Hurricane Ophelia near Portugal, e.g., [43,44,45], which induced strong south-westerly winds over mainland Portugal. However, Figure 2b shows the fire activity starting earlier in the present year (2022). The total active fires recorded between December and February are at least three times larger than the average for the period and correspond to values expected to occur in the spring season (see dashed line in Figure 2b). Considering the winter months (December, January, and February) and over the past 10 winter seasons (Figure 2c), the VIIRS active fire observations recorded a maximum fire activity in the winter of 2021/2022, with a total of 1198 active fires. Such a result indicates that among all the winter seasons, the winter of 2021/2022 presented the largest number of active fires.
Although the short time scale does not allow for a statistical analysis of the evolution of the number of forest fires nor the calculation of a significant trend, the figures suggest that the last winter has registered the occurrence of more fires. Concerning the FRP, Figure 2c highlights the exceptionality of the winter of 2021/2022 that released 12,000 megawatts, almost double the previous maximum (winter 2016/2017).

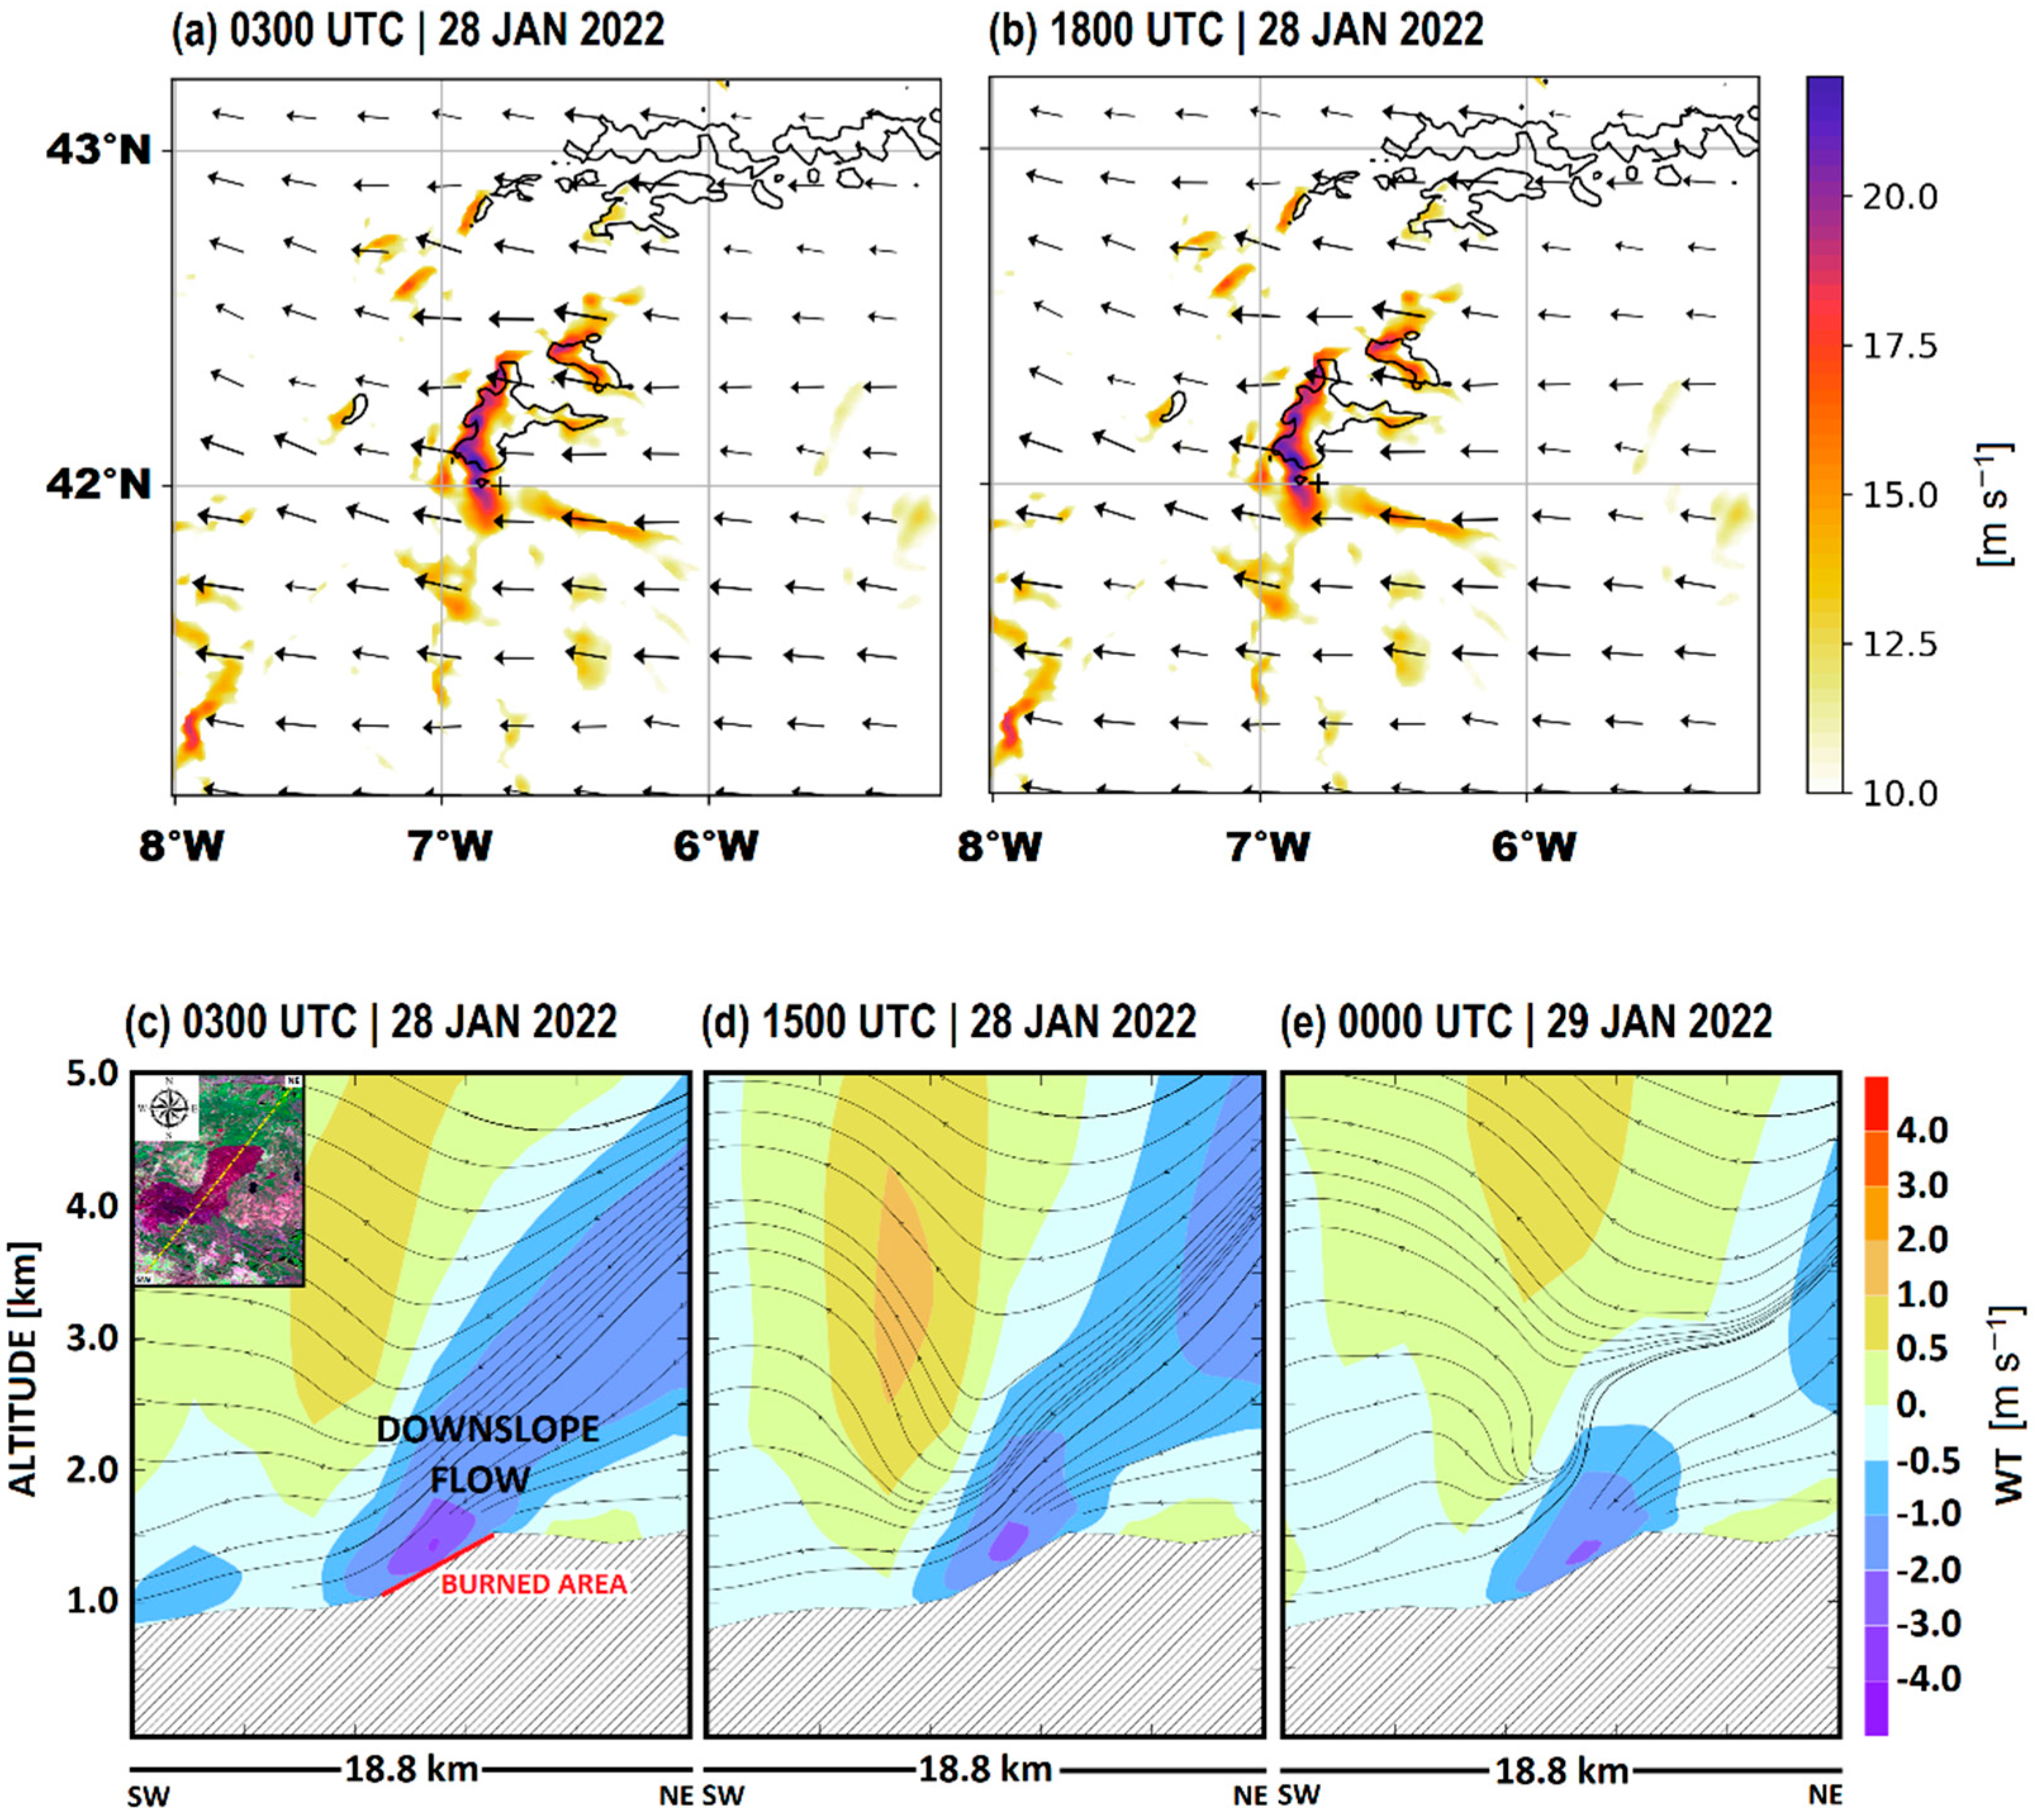
3.2. Case Study: Fire Evolution and Atmospheric Conditions on 28 January 2022

This subsection focuses on the description and discussion of the atmospheric environment leading to the fire that occurred in the Montesinho National Park on 28 January 2022.
According to the IPMA report [46], mainland Portugal experienced below-average precipitation in January 2022, with a total corresponding to only 12% of the normal value for 1971–2000. Figure S2a shows only three days with precipitation, all with daily accumulated precipitation below 10 mm, with a maximum of 9.3 mm at Vinhais station on 9th January. The mean air temperature (9.65 °C) was higher than the normal value for 1971–2000 (+0.84 °C), whereas the maximum temperature value was the highest in the last 90 years, with an average value of 15.29 °C (+2.20 °C) compared to the normal temperature in 1971–2000 [46]. The air temperature (Figure S2b) at Bragança station shows a greater amplitude than at Vinhais station. However, the temperature increases in the last four days of January 2022 in both meteorological stations, with a maximum of 17 °C on 29 January 2022 at Bragança. According to [44], in the period of days (1 to 3) and (27 to 31), the air temperature showed a positive anomaly of 4 °C. In addition, the air relative humidity decreased in both stations between 26 and 29 January 2022 (Figure S2c). The minimum relative humidity observed was 10% at 1600 UTC on 29 January 2022 in Bragança station. Regarding the wind gusts (Figure S2d), the observations showed maximum wind gusts in Vinhais greater than at Bragança station and more frequent throughout the month. The maximum wind gusts reached 18.4 m s−1 on 28 January 2022 in Vinhais. In summary, all these conditions helped to classify January 2022 as hot and very dry within the study region.
Considering the previous months (i.e., October, November, and December 2021), October had a normal level of accumulated precipitation, but November and December were very dry. Such a condition during the previous two months probably had a positive impact on lowering the moisture content of the fuels and increasing their flammability. Examining previous winter seasons, Figure S3 shows the last winter season with the lowest accumulated precipitation. In addition, the seasonal accumulated precipitation presents an inverse relationship with the total active fires for Portugal (Figure 2c), except for the 2013/2014 winter season.
During the period of study, the Iberian Peninsula was under the influence of a high-pressure system. Figure 3 shows that the centre of the anticyclone was located at the Biscay Gulf. The Meso-NH model was employed for the examination of the mesoscale circulation during the event. Figure 4a shows that the easterly winds over the Iberian Peninsula were controlled by the synoptic system, and the lower tropospheric circulation at 850 hPa presented wind intensities of about 10 m s−1, with a maximum above 15 m s−1 in some regions. Near the surface, the wind pattern is disturbed by orographic effects, especially in the mountainous region where the fire was ignited, with wind gusts at 10 m around 20 m s−1 and remaining stationary during the entire period (Figure 4a,b). On the other hand, the air temperature was around 15 °C in the afternoon, whereas the relative humidity at 2 m was below 40% during the day (not shown).
To obtain a more detailed picture of the impact of the atmospheric conditions on the fire behaviour, the satellite data for day 28 were also analysed (Figure 5). The atmospheric circulation associated with the anticyclone system favoured the westward transport of the smoke plume (Figure 5a). In the same figure, several fires in northern Portugal can be seen on 28 January. The first active fire in the region was recorded by the VIIRS sensor over Portugal after 0100 UTC. The active fires were observed throughout the day extending southwestward over Spanish territory and spreading again over Portugal throughout the day.
The numerical experiment, with its high resolution, indicates the factors that may have influenced the fire’s behaviour. The vertical cross-section crossing the burned area presented in Figure 4c–e shows the development of intense and stationary downslope winds where the fire occurred. The descending air is more intense than the ascending air, with negative vertical velocities of 3 m s−1 near the surface. This stationary condition directed the fire front southwestward and, afterwards, likely redirected the fire front to the west while still following the downslope. The combination of a complex terrain and strong winds increases the rate of fire spread and may hinder fire suppression e.g., [47,48].
The effect reproduced by the model is similar to those documented for mountainous regions, with intense winds on the lee side, e.g., [15,47]. These orographic effects depend on mountain geometry, wind direction, and air stability, e.g., [49]. Near the surface, a high-pressure system centred over the Biscay Gulf induced the easterly flow over the northwest of the Iberian Peninsula. The orographic effects created by the complex terrain produced intense downslope winds where the fire occurred. Such an environment, with wind gusts above 15 m s−1, favoured fire propagation and, consequently, the burning of a large area on 28 January 2022. Therefore, intense wind gusts are found to play an important role in fire propagation over steep terrain.

4. Conclusions

This paper raises a question concerning the occurrence of large fires during the wintertime. The exceptional active fires during the 2021/2022 winter season may be a result of the impact of climate change on fire activity. This aspect should be worthy of further research. During the exceptional wildfire event that occurred on 28 January 2022, the anticyclone system, centred over the Biscay Gulf, favoured the advection of mild and dry air due to an easterly flow over the Iberian Peninsula in late January.
While large wildfires have been well-documented during summertime, this is the first time that such a large winter wildfire has been documented. The potential for the occurrence of large fires is dependent on the combination of several factors. The case study is an example of how atmospheric conditions can be conducive to these extreme fire events. The interaction between an easterly flow and the orography was crucial to fire propagation and causing the large burned area and made this winter event exceptional. Meso-NH simulated the orographic effects, namely, the development of intense downslope winds. The results indicate that a fire ignited during a dry and warmer winter can spread quickly, being accelerated by orographic effects. In the study, the orography induced intense wind gusts at the surface during the entire period.
More generally, this study contributes to increasing the knowledge of different scenarios for large fire occurrences throughout the year, as well as in regions where the local conditions appear to be very important for fire propagation when combined with the weather conditions. Additionally, the present study highlights the orographic effects that can increase the fire susceptibility and vulnerability of some regions, namely, in nature parks, which are important for the conservation of biodiversity and the development of tourism. Furthermore, the increase in active fires can have a profound impact on human health during the winter season by decreasing air quality.
Finally, under climate change scenarios, it is likely that the danger of fires increases in specific regions beyond the summertime, and this study can be seen as a starting point for future research about how climate changes may influence a fire’s behaviour throughout all seasons. A future study will assess the event at a finer resolution to fully characterize it using a coupled atmosphere–fire simulation. The representation of microscale features driving the fire’s behaviour and smoke plume transport are very important for advances in air quality studies over densely populated regions and firefighting strategies.

Supplementary Materials

The following supporting information can be downloaded at: https://www.mdpi.com/article/10.3390/atmos13101677/s1, Figure S1. Comparison of the meteorological variables between the simulation and observations from the weather stations during the simulation period (between 27 at 1900UTC and 29 January 2022 at 0000 UTC): (a) Wind gusts (m s−1) at 10 m in Bragança; (b) as (a), but for Vinhais station; (c) relative humidity (%) at 2 m in Vinhais; (d) air temperature (°C) at 2 m in Vinhais; Figure S2. Observations of the meteorological variables from the two weather stations (Bragança and Vinhais) for January 2022: (a) daily accumulated precipitation (mm); (b) air temperature (°C) at 2 m; (c) air relative (%) at 2 m; (d) Wind gusts (m s−1) at 10 m; Figure S3. Total accumulated precipitation for 10 wintertime periods obtained from the IPMA.

Author Contributions

Conceptualization, F.T.C. and F.L.M.S.; methodology, F.T.C., F.L.M.S. and N.A.; software, F.T.C., F.L.M.S., C.C. and C.P.; validation, C.P.; formal analysis, F.T.C., F.L.M.S., C.C. and C.P.; investigation, F.T.C., N.A. and F.L.M.S.; resources, F.T.C., R.S. and F.L.M.S.; data curation, F.L.M.S. and C.C.; writing—original draft preparation, F.T.C.; writing—review and editing, F.L.M.S., N.A., C.C., C.P. and R.S.; visualization, F.T.C., F.L.M.S., C.C. and C.P.; supervision, F.T.C.; project administration, F.T.C. and R.S.; funding acquisition, F.T.C. and R.S. All authors have read and agreed to the published version of the manuscript.

Funding

This research was funded by the European Union through the European Regional Development Fund in the framework of the Interreg V A Spain–Portugal program (POCTEP) through the CILIFO project (Ref.: 0753-CILIFO-5-E), FIREPOCTEP project (0756-FIREPOCTEP-6-E), RH.VITA project (ALT20-05-3559-FSE-000074), and also by national funds through FCT-Foundation for Science and Technology, I.P. under the PyroC.pt project (Refs. PCIF/MPG/0175/2019), ICT project (Refs. UIDB/04683/2020 and UIDP/04683/2020).

Institutional Review Board Statement

Not applicable.

Informed Consent Statement

Not applicable.

Data Availability Statement

Not applicable.

Acknowledgments

The authors are grateful to the Portuguese Institute for Sea and Atmosphere (IPMA) for providing meteorological data, the European Centre for Medium-Range Weather Forecasts (ECMWF) for the provided meteorological analysis and the Met Office by the synoptic chart.

Conflicts of Interest

The authors declare no conflict of interest.

References

  1. Huss, M.; Hock, R. Global-scale hydrological response to future glacier mass loss. Nat. Clim. Chang. 2018, 8, 135–140. [Google Scholar] [CrossRef] [Green Version]
  2. Immerzeel, W.W.; Lutz, A.F.; Andrade, M.; Bahl, A.; Biemans, H.; Bolch, T.; Hyde, S.; Brumby, S.; Davies, B.J.; Elmore, A.C.; et al. Importance and vulnerability of the world’s water towers. Nature 2020, 577, 364–369. [Google Scholar] [CrossRef] [PubMed]
  3. Aubry-Wake, C.; Bertoncini, A.; Pomeroy, J.W. Fire and ice: The impact of wildfire-affected albedo and irradiance on glacier melt. Earth’s Future 2022, 10, e2022EF002685. [Google Scholar] [CrossRef]
  4. Adame, J.A.; Lope, L.; Hidalgo, P.J.; Sorribas, M.; Gutiérrez-Álvarez, I.; del Águila, A.; Saiz-Lopez, A.; Yela, M. Study of the exceptional meteorological conditions, trace gases and particulate matter measured during the 2017 forest fires in Doñana Natural Park, Spain. Sci. Total Environ. 2018, 645, 710–720. [Google Scholar] [CrossRef] [PubMed]
  5. Buchholz, R.R.; Park, M.; Worden, H.M.; Tang, W.; Edwards, D.P.; Gaubert, B.; Deeter, M.N.; Sullivan, T.; Ru, M.; Chin, M.; et al. New seasonal pattern of pollution emerges from changing North American wildfires. Nat. Commun. 2022, 13, 2043. [Google Scholar] [CrossRef]
  6. Dong, C.; Williams, A.P.; Abatzoglou, J.T.; Lin, K.; Okin, G.S.; Gillespie, T.W.; Long, D.; Lin, Y.-H.; Hall, A.; MacDonald, G.M. The season for large fires in Southern California is projected to lengthen in a changing climate. Commun. Earth Environ. 2022, 3, 22. [Google Scholar] [CrossRef]
  7. Dowdy, A.J. Climatological Variability of Fire Weather in Australia. J. Appl. Meteorol. Clim. 2018, 57, 221–234. [Google Scholar] [CrossRef]
  8. Collins, L.; Clarke, H.; Clarke, M.F.; McColl Gausden, S.C.; Nolan, R.H.; Penman, T.; Bradstock, R. Warmer and drier conditions have increased the potential for large and severe fire seasons across south-eastern Australia. Glob. Ecol. Biogeogr. 2022, 31, 1933–1948. [Google Scholar] [CrossRef]
  9. Carrillo, J.; Pérez, J.C.; Expósito, F.J.; Díaz, J.P.; González, A. Projections of wildfire weather danger in the Canary Islands. Sci. Rep. 2022, 12, 8093. [Google Scholar] [CrossRef]
  10. Libonati, R.; Geirinhas, J.L.; Silva, P.S.; Russo, A.; Rodrigues, J.A.; Belém, L.B.C.; Nogueira, J.; Roque, F.O.; DaCamara, C.C.; Nunes, A.M.B.; et al. Assessing the role of compound drought and heatwave events on unprecedented 2020 wildfires in the Pantanal. Environ. Res. Lett. 2022, 17, 015005. [Google Scholar] [CrossRef]
  11. Dacre, H.F.; Crawford, B.R.; Charlton-Perez, A.J.; Lopez-Saldana, G.; Griffiths, G.H.; Veloso, J.V. Chilean Wildfires: Probabilistic Prediction, Emergency Response, and Public Communication. Bull. Am. Meteorol. Soc. 2018, 99, 2259–2274. [Google Scholar] [CrossRef] [Green Version]
  12. Rodriguez, B.; Lareau, N.P.; Kingsmill, D.E.; Clements, C.B. Extreme pyroconvective updrafts during a megafire. Geophys. Res. Lett. 2020, 47, e2020GL089001. [Google Scholar] [CrossRef]
  13. Couto, F.T.; Iakunin, M.; Salgado, R.; Pinto, P.; Viegas, T.; Pinty, J.-P. Lightning modelling for the research of forest fire ignition in Portugal. Atmos. Res. 2020, 242, 104993. [Google Scholar] [CrossRef]
  14. Pinto, P.; Silva, Á.P.; Viegas, D.X.; Almeida, M.; Raposo, J.; Ribeiro, L.M. Influence of Convectively Driven Flows in the Course of a Large Fire in Portugal: The Case of Pedrógão Grande. Atmosphere 2022, 13, 414. [Google Scholar] [CrossRef]
  15. Couto, F.T.; Salgado, R.; Guiomar, N. Forest Fires in Madeira Island and the Fire Weather Created by Orographic Effects. Atmosphere 2021, 12, 827. [Google Scholar] [CrossRef]
  16. Purificação, C.; Andrade, N.; Potes, M.; Salgueiro, V.; Couto, F.T.; Salgado, R. Modelling the Atmospheric Environment Associated with a Wind-Driven Fire Event in Portugal. Atmosphere 2022, 13, 1124. [Google Scholar] [CrossRef]
  17. Sanders, D.; Laing, J. In the Line of Fire: The Challenges of Managing Tourism Operations in the Victorian Alps. Tour. Rev. Int. 2009, 13, 223–236. [Google Scholar] [CrossRef] [Green Version]
  18. Kim, M.-K.; Jakus, P.M. Wildfire, national park visitation, and changes in regional economic activity. J. Outdoor Recreat. Tour. 2019, 26, 34–42. [Google Scholar] [CrossRef] [Green Version]
  19. Couto, F.T.; Andrade, N.; Salgado, R.; Serra, J. Wildfire Risk in Madeira Island and the Potential Impacts on Tourism. In Proceedings of the EGU General Assembly 2021, Online, 19–30 April 2021; p. EGU21-14575. [Google Scholar] [CrossRef]
  20. Cioccio, L.; Michael, E.J. Hazard or disaster: Tourism management for the inevitable in Northeast Victoria. Tour. Manag. 2007, 28, 1–11. [Google Scholar] [CrossRef]
  21. Stoof, C.R.; Kettridge, N. Living with fire and the need for diversity. Earth’s Future 2022, 10, e2021EF002528. [Google Scholar] [CrossRef]
  22. Clarke, H.; Tran, B.; Boer, M.M.; Price, O.; Kenny, B.; Bradstock, R. Climate change effects on the frequency, seasonality and interannual variability of suitable prescribed burning weather conditions in southeastern Australia. Agric. For. Meteorol. 2019, 271, 148–157. [Google Scholar] [CrossRef]
  23. Arreola Amaya, M.; Clements, C.B. Evolution of Plume Core Structures and Turbulence during a Wildland Fire Experiment. Atmosphere 2020, 11, 842. [Google Scholar] [CrossRef]
  24. Bradstock, R.A.; Cary, G.J.; Davies, I.; Lindenmayer, D.B.; Price, O.F.; Williams, R.J. Wildfires, fuel treatment and risk mitigation in Australian eucalypt forests: Insights from landscape-scale simulation. J. Environ. Manag. 2012, 105, 66–75. [Google Scholar] [CrossRef] [PubMed]
  25. King, K.J.; Cary, G.J.; Bradstock, R.A.; Marsden-Smedley, J.B. Contrasting fire responses to climate and management: Insights from two Australian ecosystems. Glob. Chang. Biol. 2013, 19, 1223–1235. [Google Scholar] [CrossRef] [PubMed]
  26. Clarke, H.; Cirulis, B.; Penman, T.; Price, O.; Boer, M.M.; Bradstock, R. The 2019–2020 Australian forest fires are a harbinger of decreased prescribed burning effectiveness under rising extreme conditions. Sci. Rep. 2022, 12, 11871. [Google Scholar] [CrossRef] [PubMed]
  27. Abram, N.J.; Henley, B.J.; Sen Gupta, A.; Lippmann, T.J.R.; Clarke, H.; Dowdy, A.J.; Sharples, J.J.; Nolan, R.H.; Zhang, T.; Wooster, M.J.; et al. Connections of climate change and variability to large and extreme forest fires in southeast Australia. Commun Earth Environ. 2021, 2, 8. [Google Scholar] [CrossRef]
  28. Schroeder, W.; Oliva, P.; Giglio, L.; Csiszar, I.A. The New VIIRS 375 m active fire detection data product: Algorithm description and initial assessment. Remote Sens. Environ. 2014, 143, 85–96. [Google Scholar] [CrossRef]
  29. ICNF Report. 1 Relatório Provisório de Incêndios Rurais de 2022 (1 de Janeiro a 30 de Junho); Instituto da Conservação da Natureza e das Florestas, I.P., Departamento de Gestão de Áreas Públicas e de Proteção Florestal: Lisbon, Portugal, 2022; p. 14. Available online: https://www.icnf.pt/api/file/doc/1b241b838544443a (accessed on 30 August 2022).
  30. Met Office’s Website. Available online: https://digital.nmla.metoffice.gov.uk (accessed on 30 August 2022).
  31. IPMA’s Monthly Climate Bulletins. Available online: https://www.ipma.pt/pt/publicacoes/boletins.jsp?cmbDep=cli&cmbTema=pcl&cmbAno=2021&idDep=cli&idTema=pcl&curAno=2021 (accessed on 30 September 2022).
  32. Lac, C.; Chaboureau, J.P.; Masson, V.; Pinty, J.P.; Tulet, P.; Escobar, J.; Leriche, M.; Barthe, C.; Aouizerats, B.; Augros, C.; et al. Overview of the Meso-NH model version 5.4 and its applications. Geosci. Model Dev. 2018, 11, 1929–1969. [Google Scholar] [CrossRef] [Green Version]
  33. Pinty, J.-P.; Jabouille, P. A Mixed-Phase Cloud Parameterization for Use in Mesoscale Non-Hydrostatic Model: Simulations of a Squall Line and of Orographic Precipitation. In Proceedings of the Conference of Cloud Physics, Everett, WA, USA, 17–21 August 1998; pp. 217–220. [Google Scholar]
  34. Cuxart, J.; Bougeault, P.; Redelsperger, J.L. A turbulence scheme allowing for mesoscale and large-eddy simulations. Q. J. R. Meteorol. Soc. 2000, 126, 1–30. [Google Scholar] [CrossRef]
  35. Pergaud, J.; Masson, V.; Malardel, S.; Couvreux, F. A Parameterization of Dry Thermals and Shallow Cumuli for Mesoscale Numerical Weather Prediction. Bound. Layer Meteorol. 2009, 132, 83. [Google Scholar] [CrossRef]
  36. Mlawer, E.J.; Taubman, S.J.; Brown, P.D.; Iacono, M.J.; Clough, S.A. Radiative transfer for inhomogeneous atmospheres: RRTM, a validated correlated-k model for the longwave. J. Geophys. Res. 1997, 102, 16663–16682. [Google Scholar] [CrossRef] [Green Version]
  37. Masson, V.; Moigne, P.L.; Martin, E.; Faroux, S.; Alias, A.; Alkama, R.; Belamari, S.; Barbu, A.; Boone, A.; Bouyssel, F.; et al. The SURFEXv7.2 land and ocean surface platform for coupled or offline simulation of earth surface variables and fluxe. Geosci. Model Dev. 2013, 6, 929–960. [Google Scholar] [CrossRef] [Green Version]
  38. Filippi, J.; Bosseur, F.; Pialat, X.; Santoni, P.; Strada, S.; Mari, C. Simulation of Coupled Fire/Atmosphere Interaction with the MesoNH-ForeFire Models. J. Combust. 2011, 2011, 540309. [Google Scholar] [CrossRef] [Green Version]
  39. Filippi, J.B.; Bosseur, F.; Mari, C.; Lac, C. Simulation of a large wildfire in a coupled fire-atmosphere model. Atmosphere 2018, 9, 218. [Google Scholar] [CrossRef] [Green Version]
  40. Costes, A.; Rochoux, M.C.; Lac, C.; Masson, V. Subgrid-scale fire front reconstruction for ensemble coupled atmosphere-fire simulations of the FireFlux I experiment. Fire Saf. J. 2021, 126, 103475. [Google Scholar] [CrossRef]
  41. Couto, F.T.; Ducrocq, V.; Salgado, R.; Costa, M.J. Numerical simulations of significant orographic precipitation in Madeira island. Atmos. Res. 2016, 169, 102–112. [Google Scholar] [CrossRef] [Green Version]
  42. Iakunin, M.; Salgado, R.; Potes, M. Breeze Effects at a Large Artificial Lake: Summer Case Study. Hydrol. Earth Syst. Sci. 2018, 22, 5191–5210. [Google Scholar] [CrossRef] [Green Version]
  43. Akritidis, D.; Katragkou, E.; Georgoulias, A.K.; Zanis, P.; Kartsios, S.; Flemming, J.; Inness, A.; Douros, J.; Eskes, H. A complex aerosol transport event over Europe during the 2017 Storm Ophelia in CAMS forecast systems: Analysis and evaluation. Atmos. Chem. Phys. 2020, 20, 13557–13578. [Google Scholar] [CrossRef]
  44. Moore, D.P. The October 2017 red sun phenomenon over the UK. Weather 2019, 74, 348–353. [Google Scholar] [CrossRef]
  45. Moore, P. An analysis of storm Ophelia which struck Ireland on 16 October 2017. Weather 2021, 76, 301–306. [Google Scholar] [CrossRef]
  46. IPMA Report. Boletim Climático Portugal Continental, Janeiro 2022; Instituto Português do Mar e da Atmosfera, I.P. Divisão de Clima e Alterações Climáticas: Lisbon, Portugal, 2022; p. 16. Available online: https://www.ipma.pt/resources.www/docs/im.publicacoes/edicoes.online/20220204/FGdTvyAzNYKcsCOxBZMy/cli_20220101_20220131_pcl_mm_co_pt.pdf (accessed on 30 August 2022).
  47. Brewer, M.J.; Clements, C.B. The 2018 Camp Fire: Meteorological Analysis Using In Situ Observations and Numerical Simulations. Atmosphere 2020, 11, 47. [Google Scholar] [CrossRef] [Green Version]
  48. Kartsios, S.; Karacostas, T.; Pytharoulis, I.; Dimitrakopoulos, A.P. Numerical investigation of atmosphere-fire interactions during high-impact wildland fire events in Greece. Atmos. Res. 2021, 247, 105253. [Google Scholar] [CrossRef]
  49. Couto, F.T.; Ducrocq, V.; Salgado, R.; Costa, M.J. Understanding significant precipitation in Madeira island using high-resolution numerical simulations of real cases. Q. J. R. Meteorol. Soc. 2017, 143, 251–264. [Google Scholar] [CrossRef]
Figure 1. Numerical experiment: (a) model configuration with a domain at 1500 m horizontal resolution and orography (unit: metres; coloured areas) obtained from the SRTM database. The symbols indicate the fire location considered in the case study (see Section 2.2) and the weather stations. (b) Numerical experiment timeline. The dashed-line rectangle represents a zoom area.
Atmosphere 13 01677 g001
Figure 2. VIIRS data: (a) active fires between December 2012 and February 2022; (b) monthly cumulative active fires, dashed line indicates the winter 2021/2022 AF number; (c) seasonal cumulative number of active fires (red columns, left Y-axis) and Fire Radiative Power (FRP; black line, right Y-axis) for 10 wintertime periods.
Atmosphere 13 01677 g002
Figure 3. Synoptic chart of surface pressure showing the large-scale pattern over Europe on 28 January 2022 at 1200 UTC. Figure indicates the mean sea level pressure (black contour), cold front (blue line), warm front (red line) and occluded front (purple line). Source: [30].
Atmosphere 13 01677 g003
Figure 4. Regional to local atmospheric conditions were obtained from the numerical experiment with a 1500 m horizontal resolution: wind gusts at 10 m with arrows representing the horizontal wind vectors at 850 hPa level at (a) 0300 UTC and (b) 1800 UTC. The contour represents orography at 1500 m; SW–NE vertical cross-sections crossing the total burned area of vertical velocity and streamlines at (c) 0300 UTC, (d) 1500 UTC, and (e) 0000 UTC. The localization of the cross-section is indicated in the inner figure in (c).
Atmosphere 13 01677 g004
Figure 5. Fire characteristics on 28th January 2022: (a) image of the VIIRS active fires and smoke plume; (b) VIIRS active fires along the burned area.
Atmosphere 13 01677 g005
Publisher’s Note: MDPI stays neutral with regard to jurisdictional claims in published maps and institutional affiliations.

