Article

Dynamics of the Response of Vegetation Activity to Air Temperature Change in Temperate China

1
College of Resources and Environment, Shanxi Agricultural University, Taigu, Jinzhong 030801, China
2
Department of Resources and Environmental Engineering, Shanxi Institute of Energy, Jinzhong 030600, China
3
College of Natural Resources and Environment, Northwest A & F University, Yangling, Xianyang 712100, China
4
College of Agronomy, Shanxi Agricultural University, Taigu, Jinzhong 030801, China
*
Author to whom correspondence should be addressed.
Atmosphere 2022, 13(10), 1574; https://doi.org/10.3390/atmos13101574
Submission received: 3 August 2022 / Revised: 12 September 2022 / Accepted: 23 September 2022 / Published: 26 September 2022

Abstract

:
Previous research has documented a tight positive relationship between vegetation activity and growing season air temperature in China’s temperate zone (TC). However, this relationship may change over time following alternations in other environmental factors. Using the linear regression analysis and the moving windows based on partial correlation analysis method, the temporal variations of responses of vegetation NDVI to rising air temperature during 1982–2015 in the TC were examined. The results showed that the interannual partial correlation between NDVI and air temperature (RNDVI−T, include RNDVI−Tmean, RNDVI−Tmax, and RNDVI−Tmin, represents the partial correlation between NDVI and Tmean, Tmax, and Tmin, respectively) for the growing season (GS) in a 17−year moving window showed a significant decreasing trend during the last 34 years, mainly due to decreasing RNDVI−T in summer and autumn. The area with a significant decrease of RNDVI−Tmean, RNDVI−Tmax, and RNDVI−Tmin for the GS approximately accounted for 52.36%, 45.63%, and 49.98% of the TC, respectively. For the seasonal patterns of RNDVI−T, the regions with a significant downward trend in all seasons were higher than those with a significant upward trend. We also found a more significant and accelerating decrease of RNDVI−T for warm years compared to cold years, implying a decoupling or even a reverse correlation between NDVI and air temperature with continuous climate warming over the TC. Overall, our study provided evidence that the impact of Tmean, Tmax, and Tmin on vegetation activities exhibited a weakening trend and cautioned using results from interannual time scales to constrain the decadal response of vegetation growth to future global warming.

1. Introduction

Vegetation, as an essential component of terrestrial ecosystems, plays a critical role in the global carbon, water, air quality, and land surface temperature [1,2,3,4], and it absorbs more attention in the study of global change and terrestrial ecosystems [5]. According to previous studies, vegetation activities depend on temperature changes to a large extent. Recently, climatic changes have enhanced plant growth, productivity, and terrestrial vegetation greenness in northern middle and high latitudes [6]. Satellite observations and earth system simulations have revealed that when compared to other environmental processes (such as CO2 and nitrogen fertilizer application), warming in the growing season has been suggested to be the most important controlling element of global greening in recent decades.
In addition, temperature data over the past five decades show that nighttime temperatures have increased more rapidly than daytime temperatures [7], what is commonly known as asymmetric warming [8,9]. Most plant species take up carbon during the daytime through photosynthesis, whereas plants’ respiration happens throughout the day. Therefore, day and night warming could influence vegetation growth and plant vegetation phenology differently [7,10,11,12,13]. For example, Peng et al. (2013) found that in most humid and cold ecosystems in northern regions, the rise in the maximum temperature (Tmax) usually had a positive effect on the normalized difference vegetation index (NDVI) while the rise in the minimum temperature (Tmin) was usually negatively correlated with NDVI. Tan et al. (2015) also revealed some striking seasonal differences in the response of vegetation activity to the diurnally asymmetric warming in the Northern Hemisphere (NH). Xia et al. (2018) found that in the Tibetan Plateau in the past 30 years, Tmax and NDVI had a positive partial correlation in humid and cold regions and a negative correlation in semi−arid and arid regions; however, the partial correlation between Tmin and NDVI was positive in alpine and meadow grasslands, and was negative in mountain grasslands or wet forests. Xia et al. (2014) reviewed the effects of non−uniform climate warming on the terrestrial carbon cycle. They ascertained that the effects of the current asymmetric warming on terrestrial ecosystems are still a key challenge in carbon cycle research. It can be found that the responses of vegetation in different vegetation ecosystems and different regions to daytime and nighttime warming vary greatly.
However, limited evidence from satellite vegetation greenness [14] and tree−ring data [15,16] hints that northern terrestrial vegetation activity to temperature may not be constant over timescales of decades. Piao et al. (2014) documented the strength of the relationship between space−borne measurements of the NDVI and growing season (GS) temperature in the Northern Hemisphere declined substantially during the last 30 years. This phenomenon also exists at the regional or seasonal scale [17,18]. He et al. (2017) found that the significant positive relationship between NDVI and temperature from 1984 to 1997 dramatically weakened during 1998–2011 in China [18]. This can be interpreted as a weakening relationship between interannual temperature variability and vegetation activity. Though many studies have focused on the response of vegetation dynamics to daily mean temperature (Tmean), whether the impacts of asymmetric diurnal warming on terrestrial ecosystem behavior have changed is still unclear.
In this study, we used the linear regression trend analysis and the moving windows based on the partial correlation analysis method to investigate the temporal changes in vegetation activity responses to climate changes in China’s temperate zone (TC) at the regional scale and seasonal scale based on the long−term NDVI data sets and air temperature data sets in the past 34 years. Additionally, we compared the changes in the correlation of vegetation activity and air temperature between cold and warm years. This study can help us to improve our understanding of the effect of temperature on vegetation in the context of climate warming.

2. Data Sets and Methods
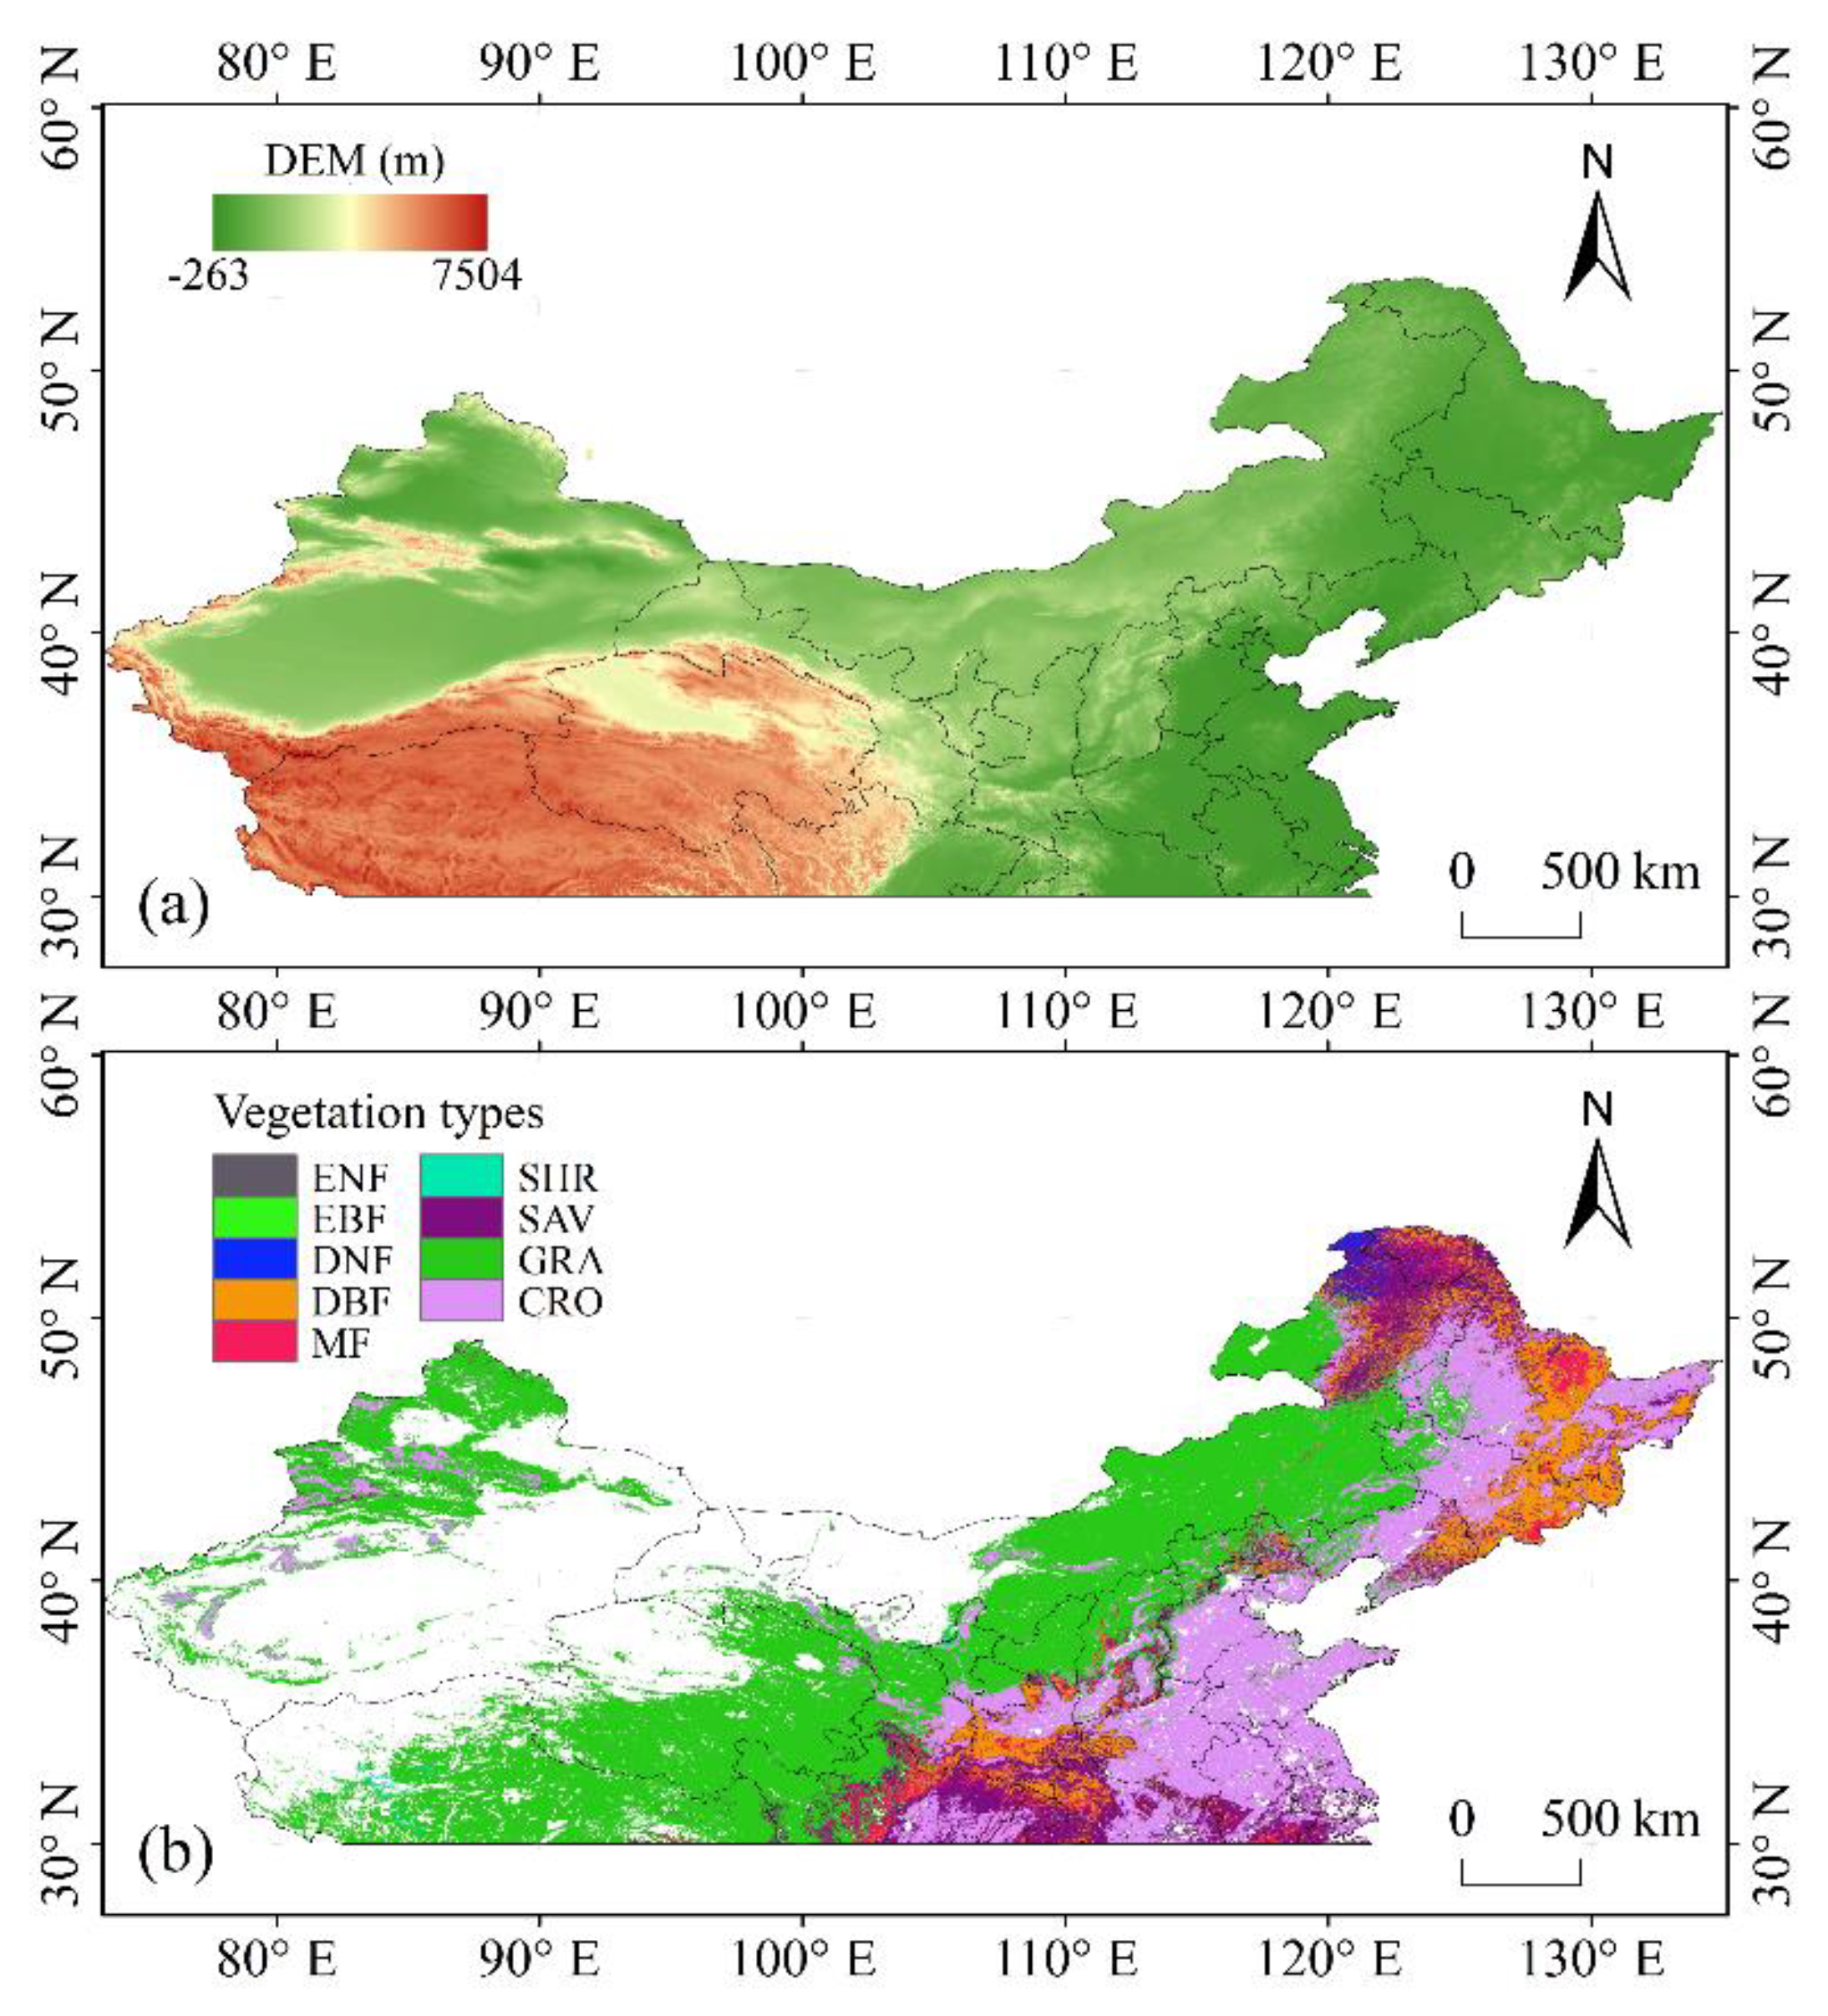
2.1. Study Area

This study focused on temperate China (70–140° E and 30–55° N) [8], which has a relatively consistent growing season throughout the region [8], and the satellite−measured NDVI used in our study was less impacted by the solar zenith angle effects [14]. The significant differences in elevation and vegetation types diversity are distinctive features across the TC (Figure 1).

2.2. Data Sets

Vegetation activity is measured by the normalized difference vegetation index (NDVI). NDVI is related to the fraction of photosynthetically active radiation absorbed by vegetation canopies and leaf biomass [19,20]. Therefore, NDVI is frequently used to measure vegetation activities and productivity on a large spatiotemporal scale. The biweekly NDVI3g data of 1982–2015 used in this study were obtained from NASA’s GIMMS3g (Global Inventory Modeling and Mapping Studies) team, with a spatial resolution of 8 km [21]. To reduce the influence of non−vegetation noise on the NDVI3g time series, we extracted pixels with mean NDVI values during a growing season above 0.1 because lower values usually indicate bare soil or sparse vegetation [22]. Mean NDVI during a growing season was defined as the average NDVI from April to October each year [19]. The NDVI3g data sets were widely used to measure vegetation activity in previous studies [23,24,25].
Meteorological data in the growing season were the average monthly precipitation and the monthly Tmean, Tmax, and Tmin temperatures of 603 weather station sites from the China Meteorological Administration. According to the China Meteorological Administration, identical standards and instrumentation were used at these stations. The meteorological data sets were resampled at the same pixel size (8 km × 8 km) as the NDVI data set by the nearest neighbor method [18,26].

2.3. Methods

To determine the temporal changes in the relationships between vegetation activity and temperature, we first calculated the one−order partial correlation coefficients between averaged NDVI (NDVIGS) during a growing season (April–October) and temperature (RNDVI−Tmean, RNDVI−Tmax, RNDVI−Tmin), with the sum of precipitation as the control variable for each of the 17−year moving windows from 1982–1998 to 1999–2015. Consequently, there were 18 moving windows centered from 1990 to 2007 and 18 RNDVI−Tmean, 18 RNDVI−Tmax, and 18 RNDVI-Tmin values, respectively. RNDVI-Tmean, RNDVI-Tmax, and RNDVI-Tmin were then regressed (unary linear regression model) against the centers of the moving windows to determine their respective temporal trends [14,17]. Trends in both the inter−annual and gridded scales were determined using least squares fitting and considered statistically significant at the 5% (or 1%) level. Our study defined the spring, summer, and autumn seasons as the periods from April to May, June to August, and September to October, respectively. The temporal changes in the relationships between vegetation activity and temperature during different seasons were calculated using a similar approach.
To compare the changes in the correlation of vegetation productivity and temperature between cold and warm years over the TC in warm and cold years. We divided the period 1982–2015 into 15–20−year time windows (i.e., 1982–2001, 1983–2002,…,1996–2015). For each 20−year series, we divide the 20 years into two groups based on their ranks in the GS temperature: the 10 years with higher GS temperature are defined as warm years, and the other 10 years are cold years. We then separately calculate RNDVI−T (including RNDVI-Tmean, RNDVI−Tmax, and RNDVI−Tmin) for warm and cold years by controlling for corresponding precipitation.

3. Results

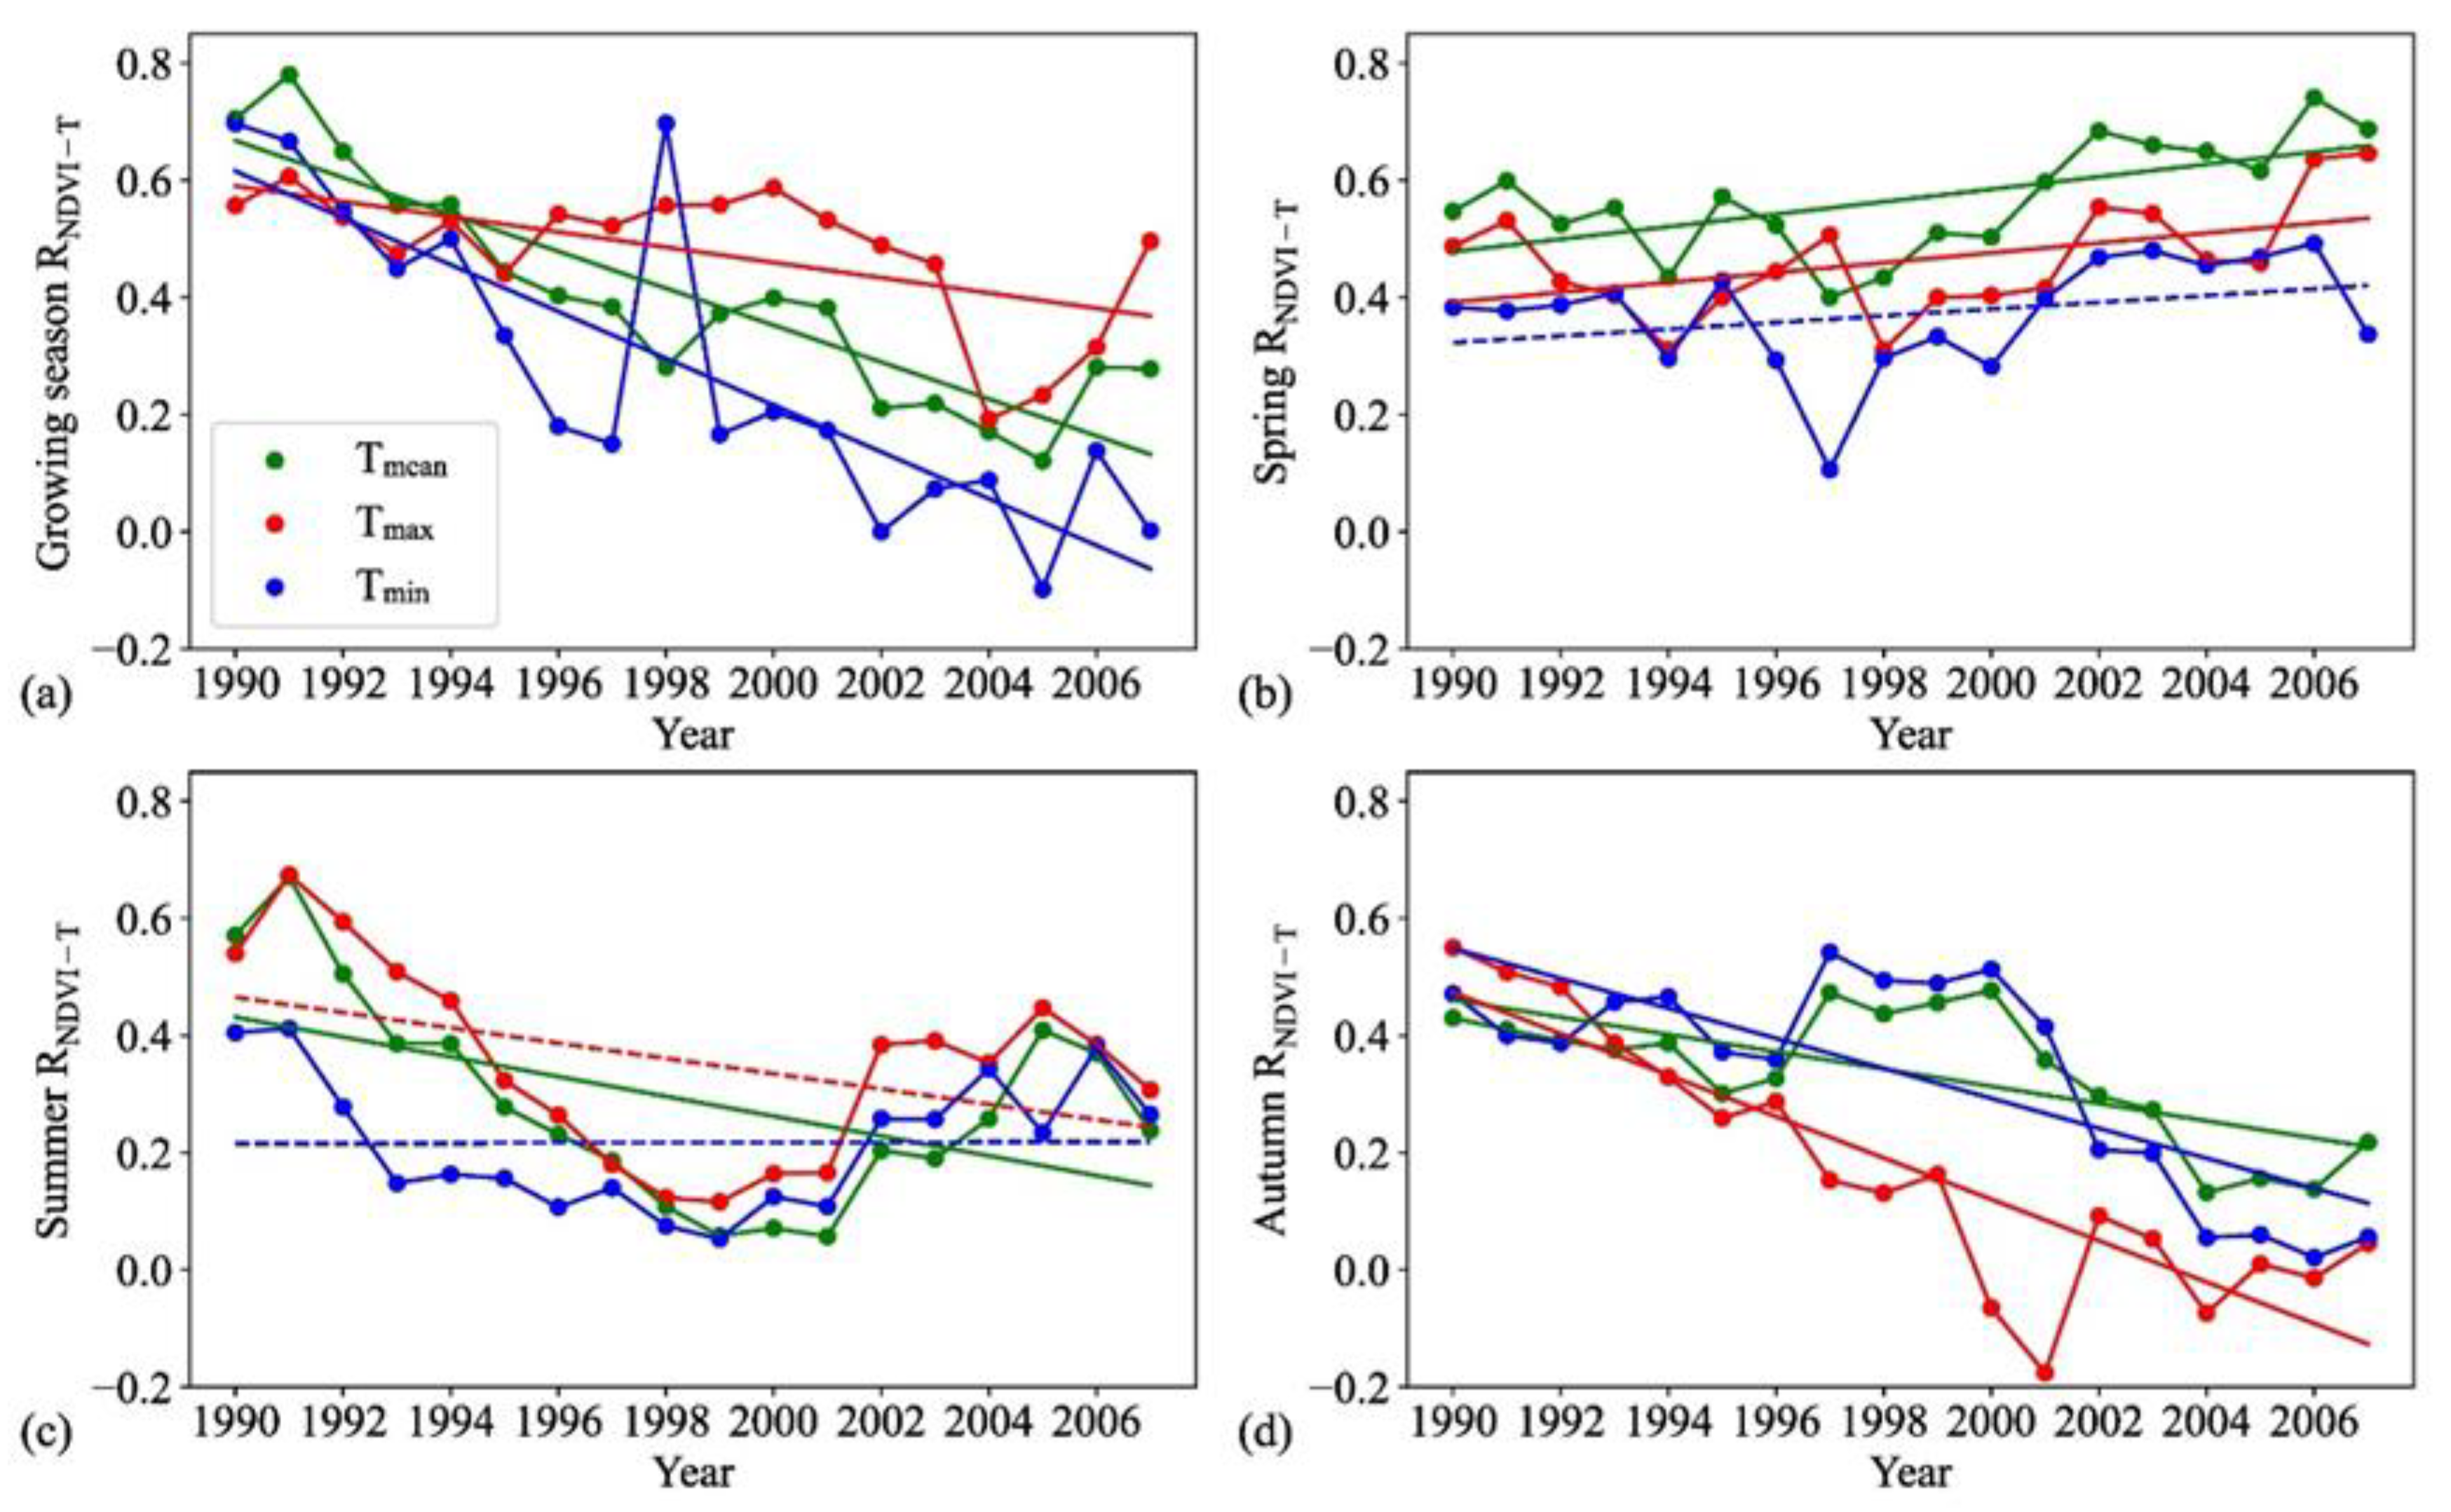
3.1. Changes in Correlations between Vegetation Activity and Temperature

The partial correlation coefficients between the regionally averaged NDVIGS and growing season temperature showed substantial temporal evolution during the past 34 years (Figure 2a). The partial correlation coefficient between NDVIGS and growing season Tmean (RNDVI−Tmean) was about 0.71 (p < 0.01) for the window 1982–1998, and then generally decreased to about 0.28 (p > 0.05) for the window 1999–2015. Similarly, the partial correlation coefficient between NDVIGS and growing season Tmax (RNDVI−Tmax) was about 0.56 (p < 0.05) for the first window, decreased to about 0.19 for the window 1996–2012, and then increased to about 0.50 (p > 0.05) for the last window. Moreover, the partial correlation coefficient between NDVIGS and growing season Tmin (RNDVI−Tmin) was about 0.70 (p < 0.01) and 0.67 (p < 0.01) for the earliest two windows, respectively, and then gradually decreased toward 0.00 onward. Overall, the RNDVI−Tmean, RNDVI−Tmax, and RNDVI−Tmin decreased significantly at the rate of −0.31/10a (p < 0.01, R2 = 0.81), −0.13/10a (p < 0.01, R2 = 0.35), and −0.40/10a (p < 0.01, R2 = 0.70), respectively.
At the regional scale, The RNDVI−Tmean showed distinct patterns among spring, summer, and autumn (Figure 2b–d). The RNDVI−Tmean for spring gradually increased from 0.55 in the first window centered in 1990 to about 0.74 and 0.69 in the last two windows centered in 2006 and 2007, and the slope of the increasing trend is 0.11/10a (p < 0.01, R2 = 0.36). In contrast, both RNDVI−Tmean for summer and autumn showed a significantly decreased trend, with the rate of decline are 0.11/10a (p < 0.01, R2 = 0.36) and 0.08/10a (p < 0.05, R2 = 0.23), respectively (Figure 2c,d). The RNDVI-Tmean for summer was 0.57(p < 0.05) and 0.67 (p < 0.01) for the earliest two windows, respectively, and then generally decreased to 0.24 (p > 0.05) for the last window. RNDVI−Tmean for autumn was between 0.38 and 0.42 in the earlier five windows and reduced to low values in the last four 17−year windows. These results suggested that the decreased trend of the growing season RNDVI−Tmean during the last 34 years is likely caused by the decreasing RNDVI−Tmean in summer and autumn.
Similarly, both RNDVI−Tmax and RNDVI−Tmin showed distinct patterns among three seasons at the regional scale (Figure 2b–d). The RNDVI−Tmax for spring gradually increased from 0.49 (p > 0.05) in the first window centered in 1990 to about 0.64 (p < 0.01) and 0.65 (p < 0.01) in the last two windows centered in 2006 and 2007, and the slope of the increasing trend is 0.08/10a (p < 0.05, R2 = 0.23). In contrast, both RNDVI−Tmax for summer and autumn showed a decreased trend, although the former was insignificant. RNDVI−Tmax for autumn were 0.55 (p < 0.05) and 0.51 (p < 0.05) in the first two windows, respectively, and then gradually decreased toward about 0.00 in the last eight 17−year windows, and the slope of the decreasing trend is −0.35/10a (p < 0.01, R2 = 0.78). The RNDVI−Tmin for spring and summer showed a significant trend during the past 34 years (p > 0.05). However, RNDVI−Tmin for autumn exhibited a significantly decreased pattern (Figure 2d). The RNDVI−Tmin for autumn was 0.47 in the first window and then gradually decreased toward 0.00 onward in the last four windows, and the slope of the decreasing trend is −0.26/10a (p < 0.01, R2 = 0.57).

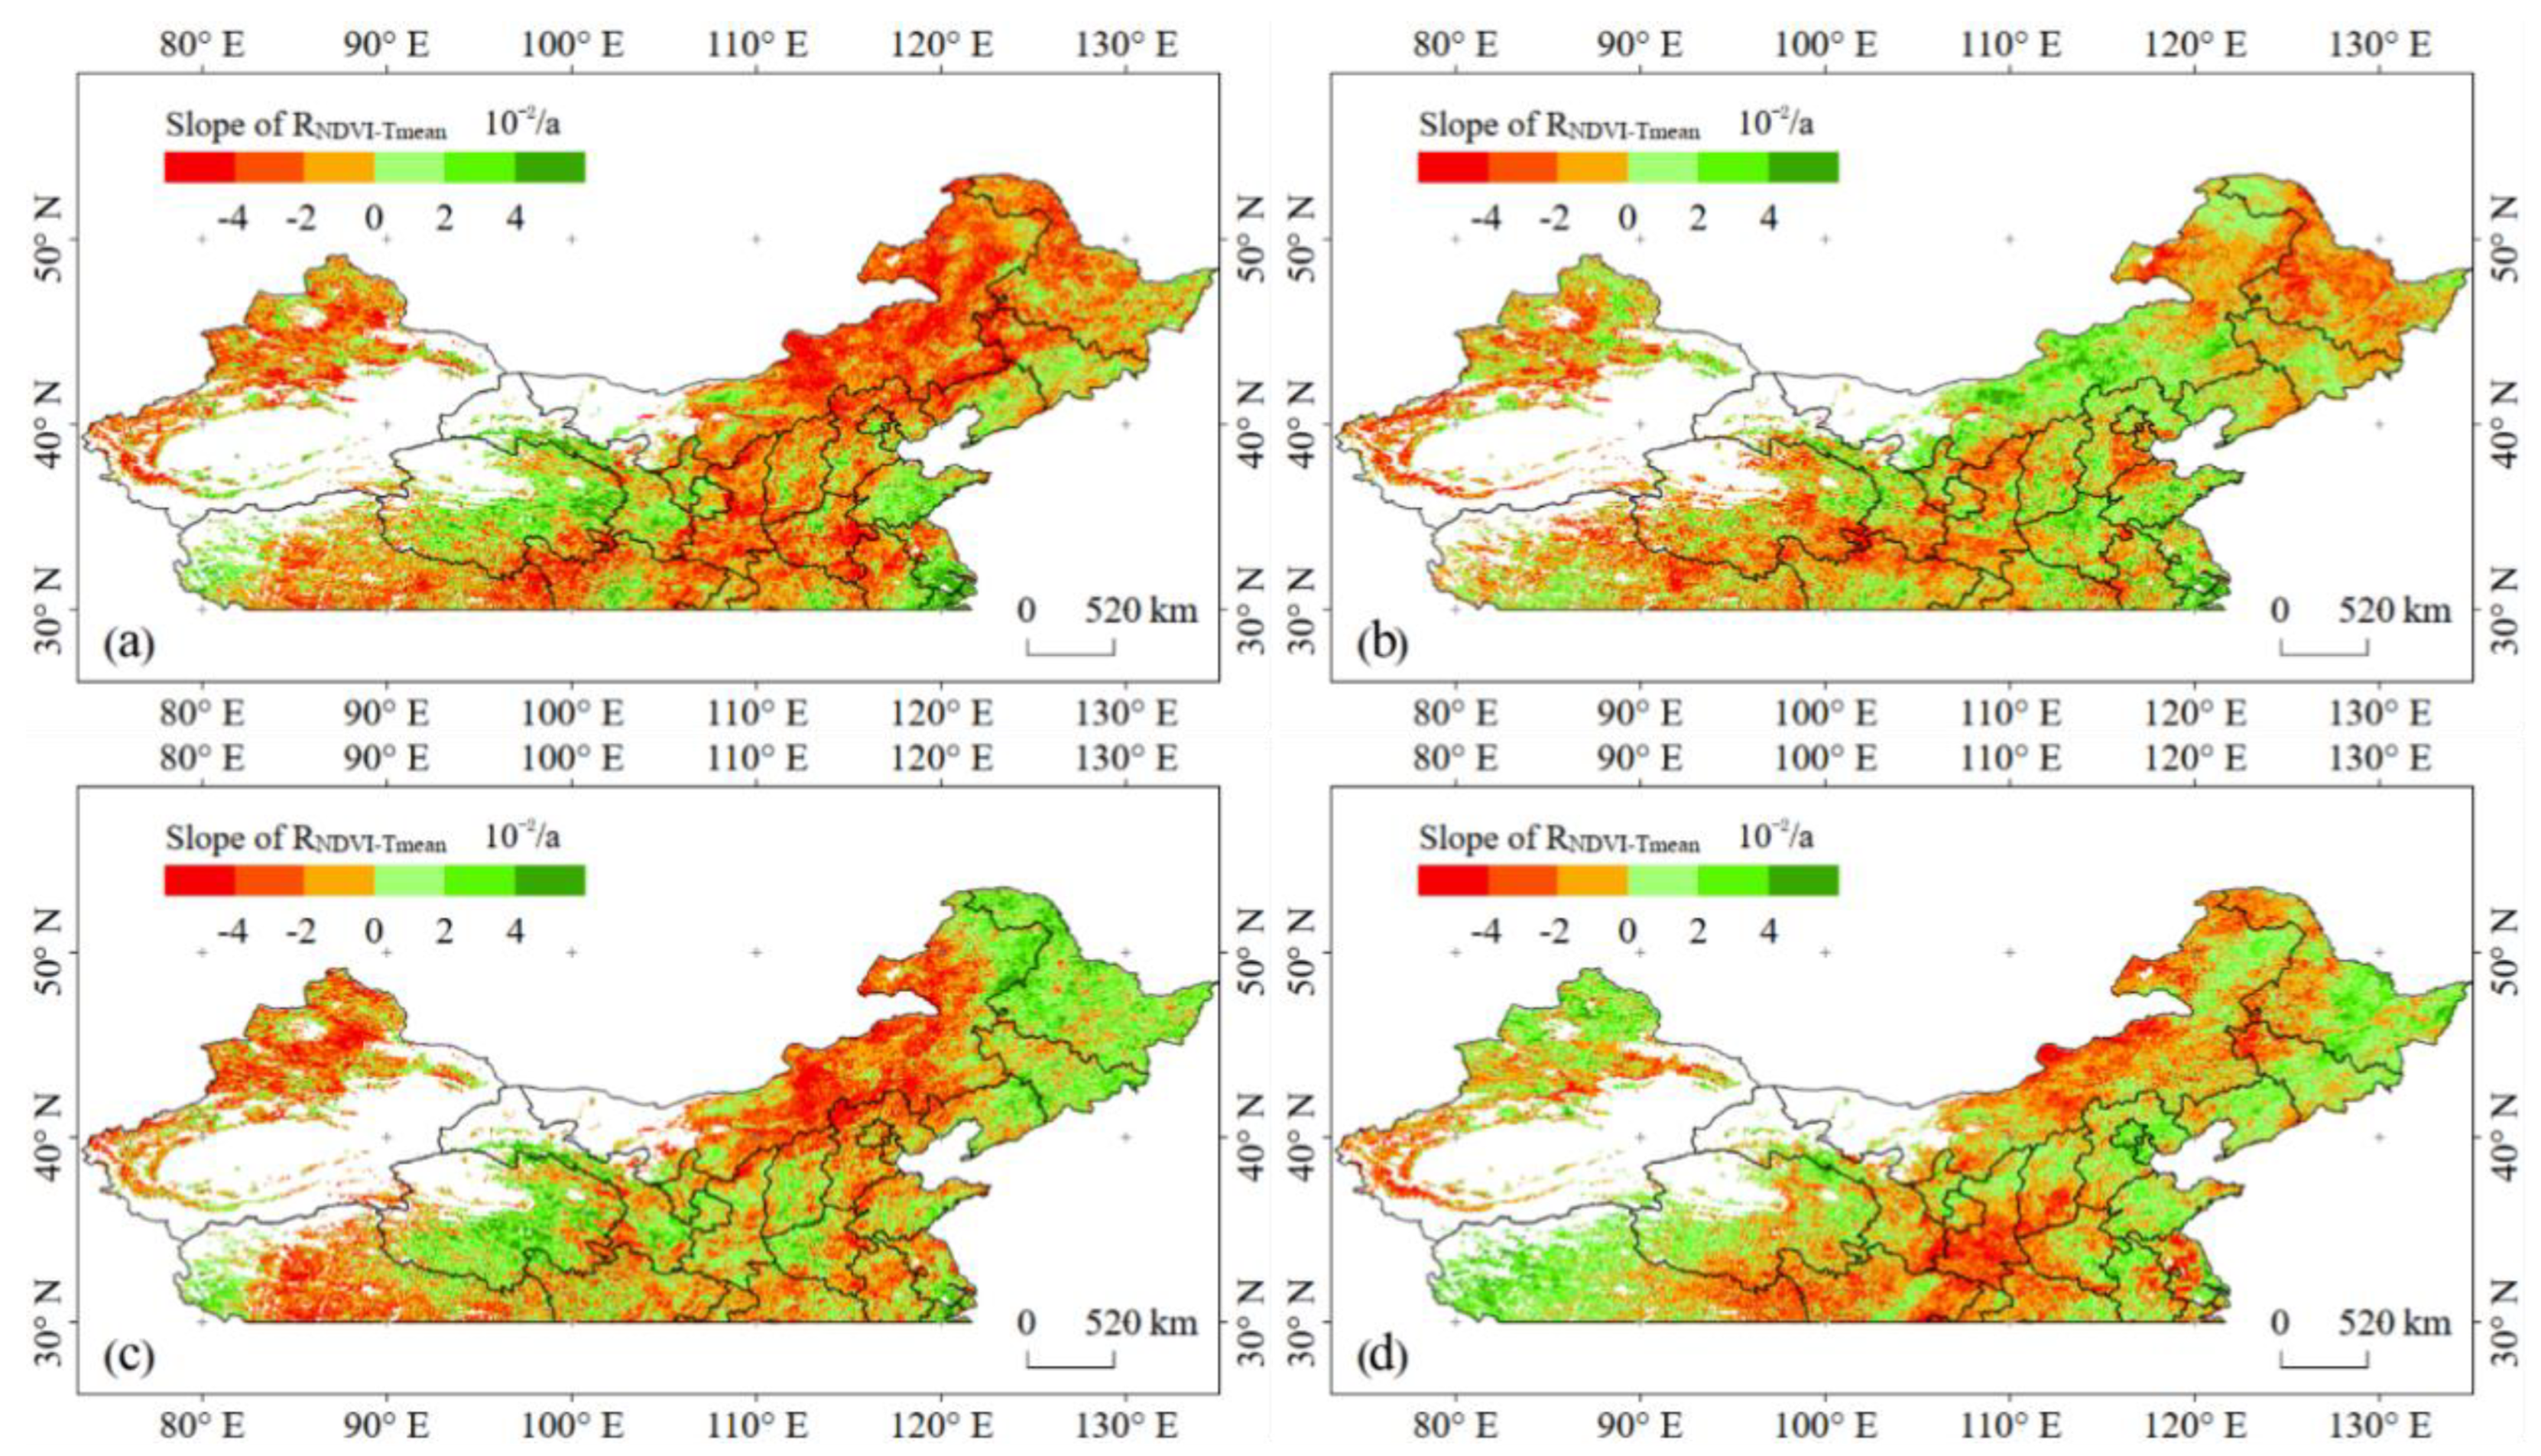
3.2. Spatial Patterns of Changes in Correlations between Vegetation Activity and Temperature

In terms of the spatial patterns across the TC. The RNDVI−Tmean for the GS revealed a general decreasing trend. In most areas (70.10% of temperate China), the RNDVI−Tmean showed a downward trend in the GS, with statistical significance (p < 0.05) for 52.36% of the TC (Figure 3). These pixels showing a significant decreasing trend are mainly distributed in the Inner Mongolia Plateau, the Loess Plateau, Western Northeast Plain, and Xinjiang region. The number of pixels with increasing RNDVI−Tmean is small, accounting for 16.02% of the total area, mainly distributed in Qinghai and Gansu provinces and the eastern coastal areas. For Tmean, the RNDVI−Tmean for spring showed a negative temporal trend in 57.75% of areas, mostly in Heilongjiang Province, Shaanxi Province, and eastern Xinjiang Province, 40.05% of pixels showed a significant negative trend across the TC. RNDVI−Tmean for spring showed a positive trend in 42.25% of areas, with 25.77% of areas of the TC being significant (p < 0.05), and mostly located in the Inner Mongolia Plateau, Gansu Province, and Eastern China. RNDVI−Tmean for summer showed negative temporal trend in 57.78% of areas, mostly in the Inner Mongolia Plateau, Qinghai Province, and the northeast of China, with 40.05% of pixels of the TC being significant (p < 0.05). Positive trends of RNDVI−Tmean for summer were found at the other 42.22% of areas, with 25.56% of areas of the TC being significant (p < 0.05). For autumn, the RNDVI−Tmean showed negative temporal trend in 54.43% of areas, primarily located in the Inner Mongolia Plateau and central parts of China, and 36.30% of areas of the TC being significant (p < 0.05). Positive trends of RNDVI−Tmean for autumn were found at the other 45.57% of areas across the TC, mostly located in the northeast of China, the western regions of China, and the North China regions, with 27.79% of areas of the TC being significant (p < 0.05).
Similarly, in most areas (64.86% of temperate China), the RNDVI−Tmax for the GS showed a downward trend, with statistical significance (p < 0.05) for 45.63% of areas of the TC (Figure 4). These pixels showing a significant decreasing trend are mainly distributed in the Inner Mongolia Plateau, the Loess Plateau, and the North China Plain. Positive trends of RNDVI−Tmax were found at the other 35.14% of areas, with 19.54% of areas of the TC being significant (p < 0.05), mainly distributed in Qinghai Province, Sichuan Province, and the Northeast Plain. The RNDVI−Tmax for spring showed a negative temporal trend in 57.75% of areas, mainly in the Loess Plateau and northern Xinjiang Province, and 38.32% of pixels showed a significant negative trend across the TC. RNDVI−Tmax for spring showed a positive trend in the other 42.25% of areas, with 25.77% of areas of the TC being significant (p < 0.05), and mostly located in the Qinghai Province and Eastern China. RNDVI−Tmax for summer showed a negative temporal trend in 54.91% of areas, mostly in western Xinjiang Province, Qinghai Province, and the Inner Mongolia Plateau, with 37.34% of pixels of the TC being significant (p < 0.05). Positive trends of RNDVI−Tmax for summer were found in the other 45.09% of areas, with 28.17% of areas of the TC being significant (p < 0.05). For autumn, the RNDVI−Tmax showed a negative temporal trend in 63.84% of areas, mostly located in the Inner Mongolia Plateau and central parts of China, and 47.23% of areas of the TC being significant (p < 0.05). Positive trends of RNDVI−Tmax for autumn were found in the other 36.16% of areas across the TC, primarily located in the northeast of China, and the western regions of China, with 22.12% of areas of the TC being significant (p < 0.05).
For Tmin, the RNDVI−Tmin for the growing season showed a downward trend in most areas (67.80% of temperate China), with statistical significance (p < 0.05) for 49.98% of areas of the TC. These pixels showing a significant decreasing trend are mainly distributed in the Loess Plateau, the Tibet Plateau, and the Northeast Plain. Positive trends of RNDVI−Tmin were found at the other 32.20% of areas, with 18.02% of areas of the TC being significant (p < 0.05), mainly distributed in Qinghai Province, Gansu Province, and the eastern coastal regions. The RNDVI−Tmin for spring showed a negative temporal trend in 61.26% of areas, mainly in the Loess Plateau, the Northeast Plain, and the Tibet Plateau, and 44.55% of pixels showed a significant negative trend across the TC. RNDVI−Tmin for spring showed a positive trend in other 38.74% of areas, with 24.67% of areas of the TC being significant (p < 0.05), and mostly located in the Xinjiang Province, Gansu Province, and the eastern coastal regions. RNDVI−Tmin for summer showed a negative temporal trend in 52.86% of areas, mostly in the North China Plain and the Xinjiang Province, with 34.18% of areas of the TC being significant (p < 0.05). Positive trends of RNDVI−Tmin for summer were found at the other 47.14% of areas, with 29.52% of areas of the TC being significant (p < 0.05). For autumn, the RNDVI−Tmin showed a negative temporal trend in 52.53% of areas, mostly in the Greater Khingan Mountains and the central regions of the Inner Mongolia Plateau, and 32.55% of areas of the TC were significant (p < 0.05). Positive trends of RNDVI−Tmin for autumn were found in the other 47.47% of areas across the TC, mostly located in the central and western regions of China, with 27.99% of areas of the TC being significant (p < 0.05).

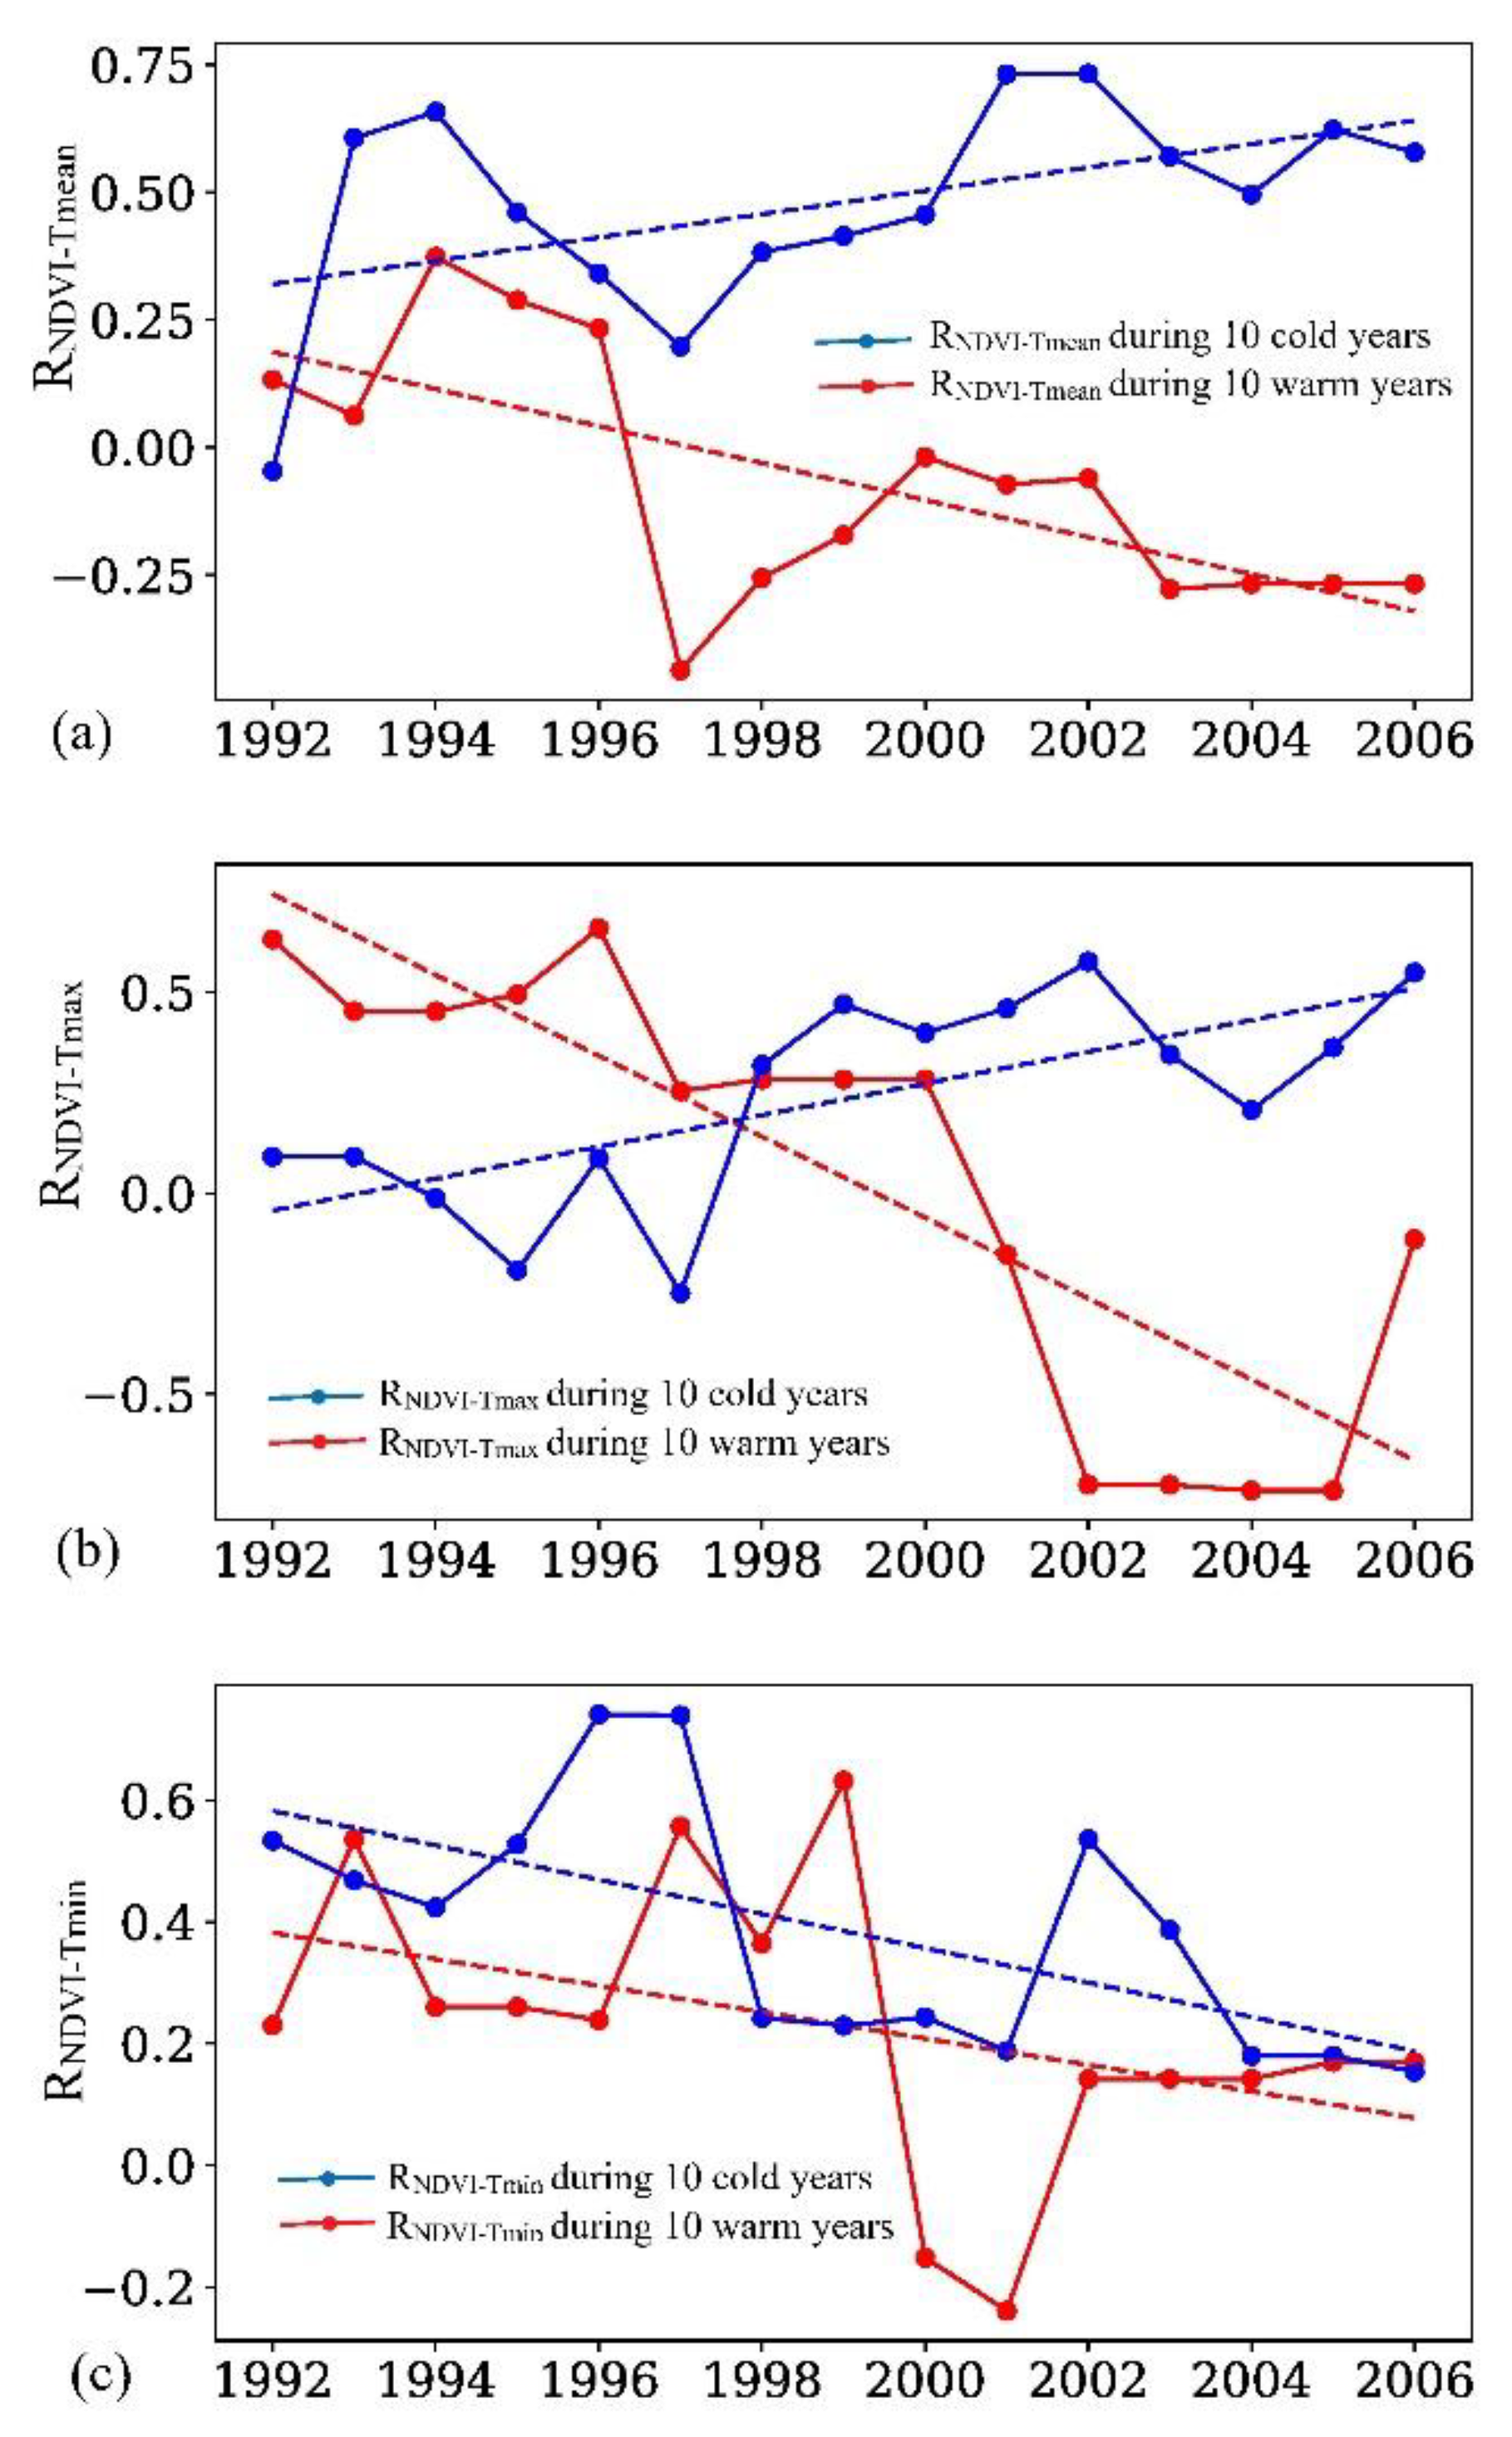
3.3. Changes in the Partial Correlation Coefficient between Growing Season NDVI and Temperature over the TC in Warm and Cold Years

We compared RNDVI−T and its change between cold and warm years over the TC in Figure 5. The data in Figure 6a indicate that RNDVI−Tmean for cold years is systematically higher than for warm years. Over the past 34 years, RNDVI−Tmean for warm years showed a significant decreasing trend (R2 = 0.45, p < 0.01), that for cold years showed an insignificant increasing trend (R2 = 0.45, p < 0.01). Similarly, RNDVI−Tmax for warm years showed a significant decreasing trend (R2 = 0.45, p < 0.01), that for cold years showed an insignificant increasing trend (R2 = 0.45, p < 0.01) (Figure 6b). RNDVI−Tmin shows a significant decreasing trend for both warm (R2 = 0.45, p < 0.01) and cold (R2 = 0.45, p < 0.01) years over the past 34 years (Figure 6c). Overall, there is a more significant and accelerating decrease of RNDVI−T for warm years compared to cold years, implying a decoupling or even a reverse correlation between NDVI and air temperature with continuous climate warming over the TC.

4. Discussion

Satellite NDVI measurements and meteorological data provide evidence of an overall decrease in the interannual correlation between vegetation activity and temperature in temperate regions of China over the last three decades. The interannual change of the response of vegetation activity to temperature is a supplement or verification to previous studies on a larger scale [17,18]. For instance, Cong et al. (2017) found that the interannual partial correlation coefficient between NDVI in summer and temperature in a 15−year moving window for an alpine meadow showed a decreased trend. The phenomenon is similar to the changes of the response of tree−ring width to temperature changes in the United States [15], Alaska [27], and the high latitudes of the Northern Hemisphere [16]. Briffa et al. (1998) found that tree−growth’s sensitivity to temperature decreased at high northern latitudes during the second half of the twentieth century. In recent years, Piao et al. (2014) research showed that in the NH, the positive influence of the temperature during a growing season on vegetation growth tends to be weak. Although the time and space scales are different, these studies show that with global warming, the sensitivity of vegetation to temperature rise has decreased, and the influence of temperature on vegetation may tend to develop in a weak direction. Interestingly, limited studies revealed some striking seasonal differences in the response of vegetation phenology to the global warming [28]. Recent studies reported a slowdown in the warming−induced advanced spring phenology in temperate regions [28,29]. However, the differences in the trend of RNDVI−Tmean, RNDVI−Tmax, and RNDVI−Tmin are still not clear.
This study confirms that the positive effects of growing season Tmean on vegetation growth in the middle and high latitudes of the Northern Hemisphere are weakening [14,17,18]. Furthermore, we found that over the past three decades, there was a similar trend of significant weakening of the effect of nighttime and daytime temperature on vegetation in temperate regions of China. Notably, the diminished degree of temperature impacts vegetation mainly in summer and autumn. In contrast, the positive effects of spring temperature on vegetation activity in temperate China show an increasing trend over the last 34 years. This systematic and comprehensive study can help us to improve our understanding of the effect of temperature on vegetation in the context of climate warming.
Due to complex and changing factors, the reasons for the changes in vegetation activity response to temperature changes are still not easy to verify. Piao et al. (2014) attributed the weakening relationship between vegetation activity and temperature changes to the continuous increase of drought in the Northern Hemisphere. Our study also confirms the opinion that the relationship between vegetation activity and temperature for warm years showed a significant decreasing trend. In contrast, for cold years, this relationship showed an insignificant increasing trend (Figure 6). Cong et al. (2017) believed that the increase in precipitation might change the response of vegetation to temperature. He et al. (2017) believed that the reduction of solar radiation, the increase in rainfall, and human influence are the reasons for the transformation of the response of vegetation to temperature changes in China. One possible explanation for the spatial difference shown by vegetation response is that the temperature rise in this area may be close to the optimum temperature or physiological and ecological threshold of some plants, or the vegetation has gradually adapted to the warming environment [30]. In addition, differences in climatic control factors of vegetation in different regions and vegetation types may also lead to the large spatial differences in the temporal trends of the relationship between temperature and vegetation activity [11,19].
In addition to air temperature and precipitation, other indirect factors might affect vegetation growth in temperate regions of China. Other indirect effects of climate such as soil temperature [31,32], drought [33,34], insect damage [35], fire disturbances [36,37], human interventions (e.g., ecological projects), land cover changes [38], nutrient limitations and changes in nutrient availability [39], and seasonal biological carryover [40] also have the potential to attenuate the observed vegetation–temperature interannual correlations. Moreover, it is unknown whether these observed changes reflect decadal variability or a long−term transition in the vegetation–temperature relationship due to satellite data’s relatively short time period. Moreover, atmospheric observation data from weather stations cannot always represent the thermal environment of vegetation. In the future, it will be necessary to observe the response of vegetation growth to climatic conditions during a longer period under continuous global warming conditions.

5. Conclusions

This paper analyzes the temporal changes in vegetation activity responses to temperature changes in China’s temperate zone at the regional and seasonal scales in the past 34 years. At the regional scale, the strength (correlation) of the linkage between vegetation activities and temperature for the growing season has declined from the early 1980s to 2015, mainly due to decreasing RNDVI−T in summer and autumn. The RNDVI−Tmean, RNDVI−Tmax, and RNDVI−Tmin for the growing season decreased significantly at the rate of −0.31/10a, −0.13/10a, and −0.40/10a, respectively. For the spatial patterns, the regions showing a significantly negative trend in the partial correlation coefficient between vegetation activities and the temperature was greater than that of areas showing a significant positive trend in all seasons. The area with a significant decrease of RNDVI−Tmean, RNDVI−Tmax, and RNDVI−Tmin for the GS approximately accounted for 52.36%, 45.63%, and 49.98% of the TC, respectively. After comparing changes in the correlation of NDVI and temperature between cold and warm years over the TC in warm and cold years, we also found a more significant and accelerating decrease of RNDVI−T for warm years compared to cold years. This result implies a decoupling or reverses correlation between vegetation activities and air temperature with continuous climate warming over the TC.

Author Contributions

Formal analysis, J.Z.; Methodology, N.J.; Writing—original draft, M.Q. and C.W.; Writing—review & editing, M.Q. and M.F. All authors have read and agreed to the published version of the manuscript.

Funding

This research was funded by [National Natural Science Foundation of China] grant number [31871571] and [Planning Subject of Philosophy and Social Sciences of Shanxi Province] grant number [2020YJ049].

Acknowledgments

The authors would like to thank the Dynamic Institute of Geospatial Observation Network—DIGON (https://digonresearch.org/, accessed on 22 September 2022) research and consultancy firm experts for proofreading the manuscript.

Conflicts of Interest

The authors declare no conflict of interest.

References

  1. Rahaman, Z.A.; Kafy, A.A.; Saha, M.; Rahim, A.A.; Almulhim, A.I.; Rahaman, S.N.; Fattah, M.A.; Rahman, M.T.; Kalaivani, S.; Faisal, A.−A.; et al. Assessing the impacts of vegetation cover loss on surface temperature, urban heat island and carbon emission in Penang city, Malaysia. Build. Environ. 2022, 222, 109335. [Google Scholar] [CrossRef]
  2. Kafy, A.−A.; Al Rakib, A.; Akter, K.S.; Rahaman, Z.A.; Faisal, A.−A.; Mallik, S.; Nasher, N.M.R.; Hossain, M.I.; Ali, M.Y. Monitoring the effects of vegetation cover losses on land surface temperature dynamics using geospatial approach in Rajshahi City, Bangladesh. Environ. Chall. 2021, 4, 100187. [Google Scholar] [CrossRef]
  3. Kafy, A.A.; Saha, M.; Faisal, A.−A.; Rahaman, Z.A.; Rahman, M.T.; Liu, D.; Fattah, M.A.; Al Rakib, A.; AlDousari, A.E.; Rahaman, S.N.; et al. Predicting the impacts of land use/land cover changes on seasonal urban thermal characteristics using machine learning algorithms. Build. Environ. 2022, 217, 109066. [Google Scholar] [CrossRef]
  4. Kafy, A.A.; Faisal, A.−A.; Al Rakib, A.; Fattah, M.A.; Rahaman, Z.A.; Sattar, G.S. Impact of vegetation cover loss on surface temperature and carbon emission in a fastest−growing city, Cumilla, Bangladesh. Build. Environ. 2022, 208, 108573. [Google Scholar] [CrossRef]
  5. Zhao, L.; Dai, A.; Dong, B. Changes in global vegetation activity and its driving factors during 1982–2013. Agric. For. Meteorol. 2018, 249, 198–209. [Google Scholar] [CrossRef]
  6. Zhu, Z.; Piao, S.; Myneni, R.B.; Huang, M.; Zeng, Z.; Canadell, J.G.; Ciais, P.; Sitch, S.; Friedlingstein, P.; Arneth, A.; et al. Greening of the Earth and its drivers. Nat. Clim. Chang. 2016, 6, 791–795. [Google Scholar] [CrossRef]
  7. Xia, J.; Chen, J.; Piao, S.; Ciais, P.; Luo, Y.; Wan, S. Terrestrial carbon cycle affected by non−uniform climate warming. Nat. Geosci. 2014, 7, 173–180. [Google Scholar] [CrossRef]
  8. Du, Z.; Zhao, J.; Liu, X.; Wu, Z.; Zhang, H. Recent asymmetric warming trends of daytime versus nighttime and their linkages with vegetation greenness in temperate China. Environ. Sci. Pollut. Res. Int. 2019, 26, 35717–35727. [Google Scholar] [CrossRef]
  9. Davy, R.; Esau, I.; Chernokulsky, A.; Outten, S.; Zilitinkevich, S. Diurnal asymmetry to the observed global warming. Int. J. Climatol. 2017, 37, 79–93. [Google Scholar] [CrossRef]
  10. Du, Z.; Zhao, J.; Pan, H.; Wu, Z.; Zhang, H. Responses of vegetation activity to the daytime and nighttime warming in Northwest China. Environ. Monit. Assess. 2019, 191, 721. [Google Scholar] [CrossRef]
  11. Peng, S.; Piao, S.; Ciais, P.; Myneni, R.B.; Chen, A.; Chevallier, F.; Dolman, A.J.; Janssens, I.A.; Penuelas, J.; Zhang, G.; et al. Asymmetric effects of daytime and night−time warming on Northern Hemisphere vegetation. Nature 2013, 501, 88–92. [Google Scholar] [CrossRef]
  12. Xu, G.; Zhang, H.; Chen, B.; Zhang, H.; Innes, J.; Wang, G.; Yan, J.; Zheng, Y.; Zhu, Z.; Myneni, R. Changes in Vegetation Growth Dynamics and Relations with Climate over China’s Landmass from 1982 to 2011. Remote Sens. 2014, 6, 3263–3283. [Google Scholar] [CrossRef]
  13. Wu, X.; Liu, H.; Li, X.; Liang, E.; Beck, P.S.; Huang, Y. Seasonal divergence in the interannual responses of Northern Hemisphere vegetation activity to variations in diurnal climate. Sci. Rep. 2016, 6, 19000. [Google Scholar] [CrossRef]
  14. Piao, S.; Nan, H.; Huntingford, C.; Ciais, P.; Friedlingstein, P.; Sitch, S.; Peng, S.; Ahlstrom, A.; Canadell, J.G.; Cong, N.; et al. Evidence for a weakening relationship between interannual temperature variability and northern vegetation activity. Nat. Commun. 2014, 5, 5018. [Google Scholar] [CrossRef]
  15. D’Arrigo, R.; Wilson, R.; Liepert, B.; Cherubini, P. On the ‘Divergence Problem’ in Northern Forests: A review of the tree−ring evidence and possible causes. Glob. Planet. Chang. 2008, 60, 289–305. [Google Scholar] [CrossRef]
  16. Briffa, K.R.; Schweingruber, F.H.; Jones, P.D.; Osborn, T.J.; Shiyatov, S.G.; Vaganov, E.A. Reduced sensitivity of recent tree−growth to temperature at high northern latitudes. Nature 1998, 391, 678–682. [Google Scholar] [CrossRef]
  17. Cong, N.; Shen, M.; Yang, W.; Yang, Z.; Zhang, G.; Piao, S. Varying responses of vegetation activity to climate changes on the Tibetan Plateau grassland. Int. J. Biometeorol. 2017, 61, 1433–1444. [Google Scholar] [CrossRef]
  18. He, B.; Chen, A.; Jiang, W.; Chen, Z. The response of vegetation growth to shifts in trend of temperature in China. J. Geogr. Sci. 2017, 27, 801–816. [Google Scholar] [CrossRef]
  19. Zhou, L.; Tucker, C.J.; Kaufmann, R.K.; Slayback, D.; Shabanov, N.V.; Myneni, R.B. Variations in northern vegetation activity inferred from satellite data of vegetation index during 1981 to 1999. J. Geophys. Res. Atmos. 2001, 106, 20069–20083. [Google Scholar] [CrossRef]
  20. Myneni, R.B.; Keeling, C.D.; Tucker, C.J.; Asrar, G.; Nemani, R.R. Increased plant growth in the northern high latitudes from 1981 to 1991. Nature 1997, 386, 698–702. [Google Scholar] [CrossRef]
  21. Yuan, W.; Zheng, Y.; Piao, S.; Ciais, P.; Lombardozzi, D.; Wang, Y.; Ryu, Y.; Chen, G.; Dong, W.; Hu, Z.; et al. Increased atmospheric vapor pressure deficit reduces global vegetation growth. Sci. Adv. 2019, 5, eaax1396. [Google Scholar] [CrossRef] [PubMed]
  22. Piao, S.; Wang, X.; Ciais, P.; Zhu, B.; Wang, T.; Liu, J. Changes in satellite−derived vegetation growth trend in temperate and boreal Eurasia from 1982 to 2006. Glob. Chang. Biol. 2011, 17, 3228–3239. [Google Scholar] [CrossRef]
  23. Tan, J.; Piao, S.; Chen, A.; Zeng, Z.; Ciais, P.; Janssens, I.A.; Mao, J.; Myneni, R.B.; Peng, S.; Penuelas, J.; et al. Seasonally different response of photosynthetic activity to daytime and night−time warming in the Northern Hemisphere. Glob. Chang. Biol. 2015, 21, 377–387. [Google Scholar] [CrossRef] [PubMed]
  24. Gao, M.; Piao, S.; Chen, A.; Yang, H.; Liu, Q.; Fu, Y.H.; Janssens, I.A. Divergent changes in the elevational gradient of vegetation activities over the last 30 years. Nat. Commun. 2019, 10, 2970. [Google Scholar] [CrossRef]
  25. Piao, S.; Fang, J.; Ciais, P.; Peylin, P.; Huang, Y.; Sitch, S.; Wang, T. The carbon balance of terrestrial ecosystems in China. Nature 2009, 458, 1009–1013. [Google Scholar] [CrossRef]
  26. Qie, L.; Lewis, S.L.; Sullivan, M.J.P.; Lopez−Gonzalez, G.; Pickavance, G.C.; Sunderland, T.; Ashton, P.; Hubau, W.; Abu Salim, K.; Aiba, S.I.; et al. Long−term carbon sink in Borneo’s forests halted by drought and vulnerable to edge effects. Nat. Commun. 2017, 8, 1966. [Google Scholar] [CrossRef]
  27. Andreu−Hayles, L.; D’Arrigo, R.; Anchukaitis, K.J.; Beck, P.S.A.; Frank, D.; Goetz, S. Varying boreal forest response to Arctic environmental change at the Firth River, Alaska. Environ. Res. Lett. 2011, 6, 45503. [Google Scholar] [CrossRef]
  28. Fu, Y.H.; Zhao, H.; Piao, S.; Peaucelle, M.; Peng, S.; Zhou, G.; Ciais, P.; Huang, M.; Menzel, A.; Penuelas, J.; et al. Declining global warming effects on the phenology of spring leaf unfolding. Nature 2015, 526, 104–107. [Google Scholar] [CrossRef]
  29. Wang, J.; Xi, Z.; He, X.; Chen, S.; Rossi, S.; Smith, N.G.; Liu, J.; Chen, L. Contrasting temporal variations in responses of leaf unfolding to daytime and nighttime warming. Glob. Chang. Biol. 2021, 27, 5084–5093. [Google Scholar] [CrossRef]
  30. Huang, M.; Piao, S.; Ciais, P.; Penuelas, J.; Wang, X.; Keenan, T.F.; Peng, S.; Berry, J.A.; Wang, K.; Mao, J.; et al. Air temperature optima of vegetation productivity across global biomes. Nat. Ecol. Evol. 2019, 3, 772–779. [Google Scholar] [CrossRef]
  31. Cheng, G.; Wu, T. Responses of permafrost to climate change and their environmental significance, Qinghai−Tibet Plateau. J. Geophys. Res. 2007, 112, F02S03. [Google Scholar] [CrossRef]
  32. Jin, H.; He, R.; Cheng, G.; Wu, Q.; Wang, S.; Lü, L.; Chang, X. Changes in frozen ground in the Source Area of the Yellow River on the Qinghai–Tibet Plateau, China, and their eco−environmental impacts. Environ. Res. Lett. 2009, 4, 45206. [Google Scholar] [CrossRef]
  33. Batllori, E.; Lloret, F.; Aakala, T.; Anderegg, W.R.L.; Aynekulu, E.; Bendixsen, D.P.; Bentouati, A.; Bigler, C.; Burk, C.J.; Camarero, J.J.; et al. Forest and woodland replacement patterns following drought−related mortality. Proc. Natl. Acad. Sci. USA 2020, 117, 29720–29729. [Google Scholar] [CrossRef] [PubMed]
  34. Dai, A. Characteristics and trends in various forms of the Palmer Drought Severity Index during 1900–2008. J. Geophys. Res. 2011, 116, D12115. [Google Scholar] [CrossRef]
  35. Kurz, W.A.; Dymond, C.C.; Stinson, G.; Rampley, G.J.; Neilson, E.T.; Carroll, A.L.; Ebata, T.; Safranyik, L. Mountain pine beetle and forest carbon feedback to climate change. Nature 2008, 452, 987–990. [Google Scholar] [CrossRef] [PubMed]
  36. Tao, J.; Zhang, Y.; Yuan, X.; Wang, J.; Zhang, X. Analysis of forest fires in Northeast China from 2003 to 2011. Int. J. Remote Sens. 2013, 34, 8235–8251. [Google Scholar] [CrossRef]
  37. Ying, L.; Han, J.; Du, Y.; Shen, Z. Forest fire characteristics in China: Spatial patterns and determinants with thresholds. For. Ecol. Manag. 2018, 424, 345–354. [Google Scholar] [CrossRef]
  38. Lepers, E.; Lambin, E.F.; Janetos, A.C.; DeFries, R.; Achard, F.; Ramankutty, N.; Scholes, R.J. A Synthesis of Information on Rapid Land−Cover Change for the Period 1981–2000. BioScience 2005, 55, 115–124. [Google Scholar] [CrossRef]
  39. Roca, A.L.; Bar−Gal, G.K.; Eizirik, E.; Helgen, K.M.; Maria, R.; Springer, M.S.; O’Brien, S.J.; Murphy, W.J. Mesozoic origin for West Indian insectivores. Nature 2004, 429, 649–651. [Google Scholar] [CrossRef]
  40. Lian, X.; Piao, S.; Chen, A.; Wang, K.; Li, X.; Buermann, W.; Huntingford, C.; Penuelas, J.; Xu, H.; Myneni, R.B. Seasonal biological carryover dominates northern vegetation growth. Nat. Commun. 2021, 12, 983. [Google Scholar] [CrossRef]
Figure 1. Spatial distribution of elevation and vegetation types in temperate regions of China. Data sources: (a) Resource and Environment Science and Data Center (https://www.resdc.cn/data.aspx?DATAID=123, accessed on 22 September 2022). (b) Land cover map data set of MODIS MCD12Q1 derived from NASA’s Land Processes Distributed Active Archive Center (https://lpdaac.usgs.gov/, accessed on 22 September 2022).
Atmosphere 13 01574 g001
Figure 2. Changes in the partial correlation coefficients between seasonal NDVI and corresponding air temperature (the x axis is the center year of the 17−year moving window, for example, 1990 represents a moving window from 1982–1998, and so on.). Images (ad) are the partial correlation coefficients between NDVI and air temperature during GS (a), spring (b), summer (c) and autumn (d), respectively. Solid (dashed) lines represent significant (insignificant) linear regression lines between the partial correlation coefficients and the corresponding center year of the 17−year moving window.
Atmosphere 13 01574 g002
Figure 3. Spatial distribution of the trend of partial correlation coefficient between NDVI and daily mean temperature (RNDVI−Tmean) during 1982–2015 for growing season (a), spring (b), summer (c) and autumn (d).
Atmosphere 13 01574 g003
Figure 4. Spatial distribution of the trend of partial correlation coefficient between NDVI and daytime temperature (RNDVI−Tmax) during 1982–2015 for growing season (a), spring (b), summer (c) and autumn (d).
Atmosphere 13 01574 g004
Figure 5. Spatial distribution of the trend of partial correlation coefficient between NDVI and nighttime temperature (RNDVI−Tmin) during 1982–2015 for growing season (a), spring (b), summer (c) and autumn (d).
Atmosphere 13 01574 g005
Figure 6. Changes in RNDVI−T (include RNDVI−Tmean, RNDVI−Tmax, and RNDVI−Tmin, represent the partial correlation between NDVI and Tmean, Tmax, and Tmin, respectively) over the TC in warm and cold years. Year on the horizontal axis is the central year of each 20−year moving window used to derive RNDVI−T (for example, 1992 represents period 1982–2001 in the 20−year time window). For each 20−year series, we divide the 20 years into two groups based on their ranks in GS temperature: the 10 years with higher GS temperature are defined as warm years, and the other 10 years are cold years. We then calculate RNDVI−T for warm and cold years, separately, through controlling for corresponding precipitation. (a) Changes in RNDVI−Tmean over the TC in warm and cold years. (b) Changes in RNDVI−Tmax over the TC in warm and cold years. (c) Changes in RNDVI−Tmin over the TC in warm and cold years.
Atmosphere 13 01574 g006
Publisher’s Note: MDPI stays neutral with regard to jurisdictional claims in published maps and institutional affiliations.

