Article

Impact of Aviation Emissions and its Changes Due to the COVID-19 Pandemic on Air Quality in South Korea

1
Department of Environmental Engineering, Konkuk University, Seoul 05029, Korea
2
Department of Civil and Environmental Engineering, Konkuk University, Seoul 05029, Korea
*
Author to whom correspondence should be addressed.
Atmosphere 2022, 13(10), 1553; https://doi.org/10.3390/atmos13101553
Submission received: 16 August 2022 / Revised: 1 September 2022 / Accepted: 5 September 2022 / Published: 23 September 2022
(This article belongs to the Special Issue Feature Papers in Air Quality)

Abstract

:
This study analyzed the impact of aviation emissions based on the 2017 CAPSS (Clean Air Policy Support System) data. We focused on major airports in South Korea and examined the concentration of NO2 and PM2.5 by the WRF-SMOKE-CMAQ modeling system. Furthermore, the number of flights in Korea greatly declined in response to the COVID-19 pandemic. To assess the impact of COVID-19 on aviation emissions, time resolution data were newly derived and air pollutant emissions for 2020 were calculated. Additional BAU (Business as Usual) emissions were calculated as well for comparison. Among airports in Korea, RKSI (Incheon International Airport) had the greatest impact on air quality in nearby areas. Changes in emissions due to COVID-19 showed a large deviation by airports for domestic emissions while international emissions had a consistent decrease. The reduced emissions had the strongest impact on air quality in the RKSI area as well. By analyzing aviation emissions due to COVID-19, this study confirmed the notable relationship with the pandemic and air quality. We conclusively recommend that policymakers and industry take note of trends in aviation emissions while establishing future atmospheric environment plans.

1. Introduction

Aviation-related activities produce various types of air pollutants, such as NOX, VOCs, CO, PM, SOX, and other HAPs [1]. The number of flights in Korea increased from 549,910/yr to 618,941/yr between 2010 and 2019 [2]. Along with the increase in the number of flights, the emissions of air pollutants from the aviation sector have risen. According to CAPSS (Clean Air Policy Support System), the Korean emissions inventory, the emissions from aviation activities, including aircraft and GSE (ground support equipment), have been renewing their peak for the last three years from 2015 to 2017.
A large amount of research has been conducted regarding the contribution of pollutants emitted from airports [3,4,5]. Chemistry-transport models have been used on various scales and locations to simulate how LTO (Landing and Take-Off) emissions [6,7,8,9,10,11] and cruise emissions affect air quality [12,13]. Some studies indicated the health risks of aircraft emissions as well [14,15]. While most research related to aviation emissions in Korea focused on greenhouse gases [16,17], studies also found that aircraft emissions had a significant negative impact on O3 concentration [18].
Since it was first discovered in 2019, COVID-19 has spread across the globe, precipitating the WHO (World Health Organization) to declare it as a pandemic on 11 March 2020 [19]. Governments enforced social distancing to slow down the spread of the virus. Such restrictions affected various sectors around the world, causing an impact on both air pollutant emissions and air quality. Most noticeably, a decline in NO2 and PM2.5 was found in various locations around the world [20,21,22]. The effect of the pandemic on air quality was identified in South Korea as well. PM2.5 concentration has decreased after social distancing on a city-scale, as in the capital city of Seoul, and on a nationwide scale [23,24]. Further studies examined the health benefits due to the positive change in air quality [25] but also mentioned that such a simple diagnosis of short-term measurement data may also lead to exaggerated and potentially erroneous conclusions [26].
For the aviation industry, the pandemic caused a global decrease in air traffic demand. In 2020, the number of passengers showed an overall decline of 2699 million compared to the previous year with Asia and the Pacific region showing the largest reduction [27]. The impact of COVID-19 is unprecedented when compared to the past shocks on air travel, such as the SARS pandemic in 2003 and the global financial crisis in 2008. COVID-19 has shown the biggest and longest-lasting impact [28]. According to the Korea Airports Corporation, the number of international passengers and domestic passengers in Korea dropped by 82.3% and 24.1%, respectively, in 2020 compared to the previous year. The number of flights, which had been continuously increasing since 2010, also decreased by 44.3%.
In this research, aviation emissions were newly calculated for 2020 and a chemical transport model was utilized to simulate four different scenarios to examine the effect of aviation sources and the impact of COVID-19 on air quality in Korea. Though the emissions data for all 15 commercial airports in Korea were estimated, this study mostly focuses on the four major airports, namely Incheon International Airport (RKSI, Incheon, Korea), Gimpo International Airport (RKSS, Seoul, Korea), Gimhae International Airport (RKPK, Busan, Korea), and Jeju International Airport (RKPC, Jeju, Korea) which account for more than 90% of the total aviation emissions in Korea.

2. Materials and Methods

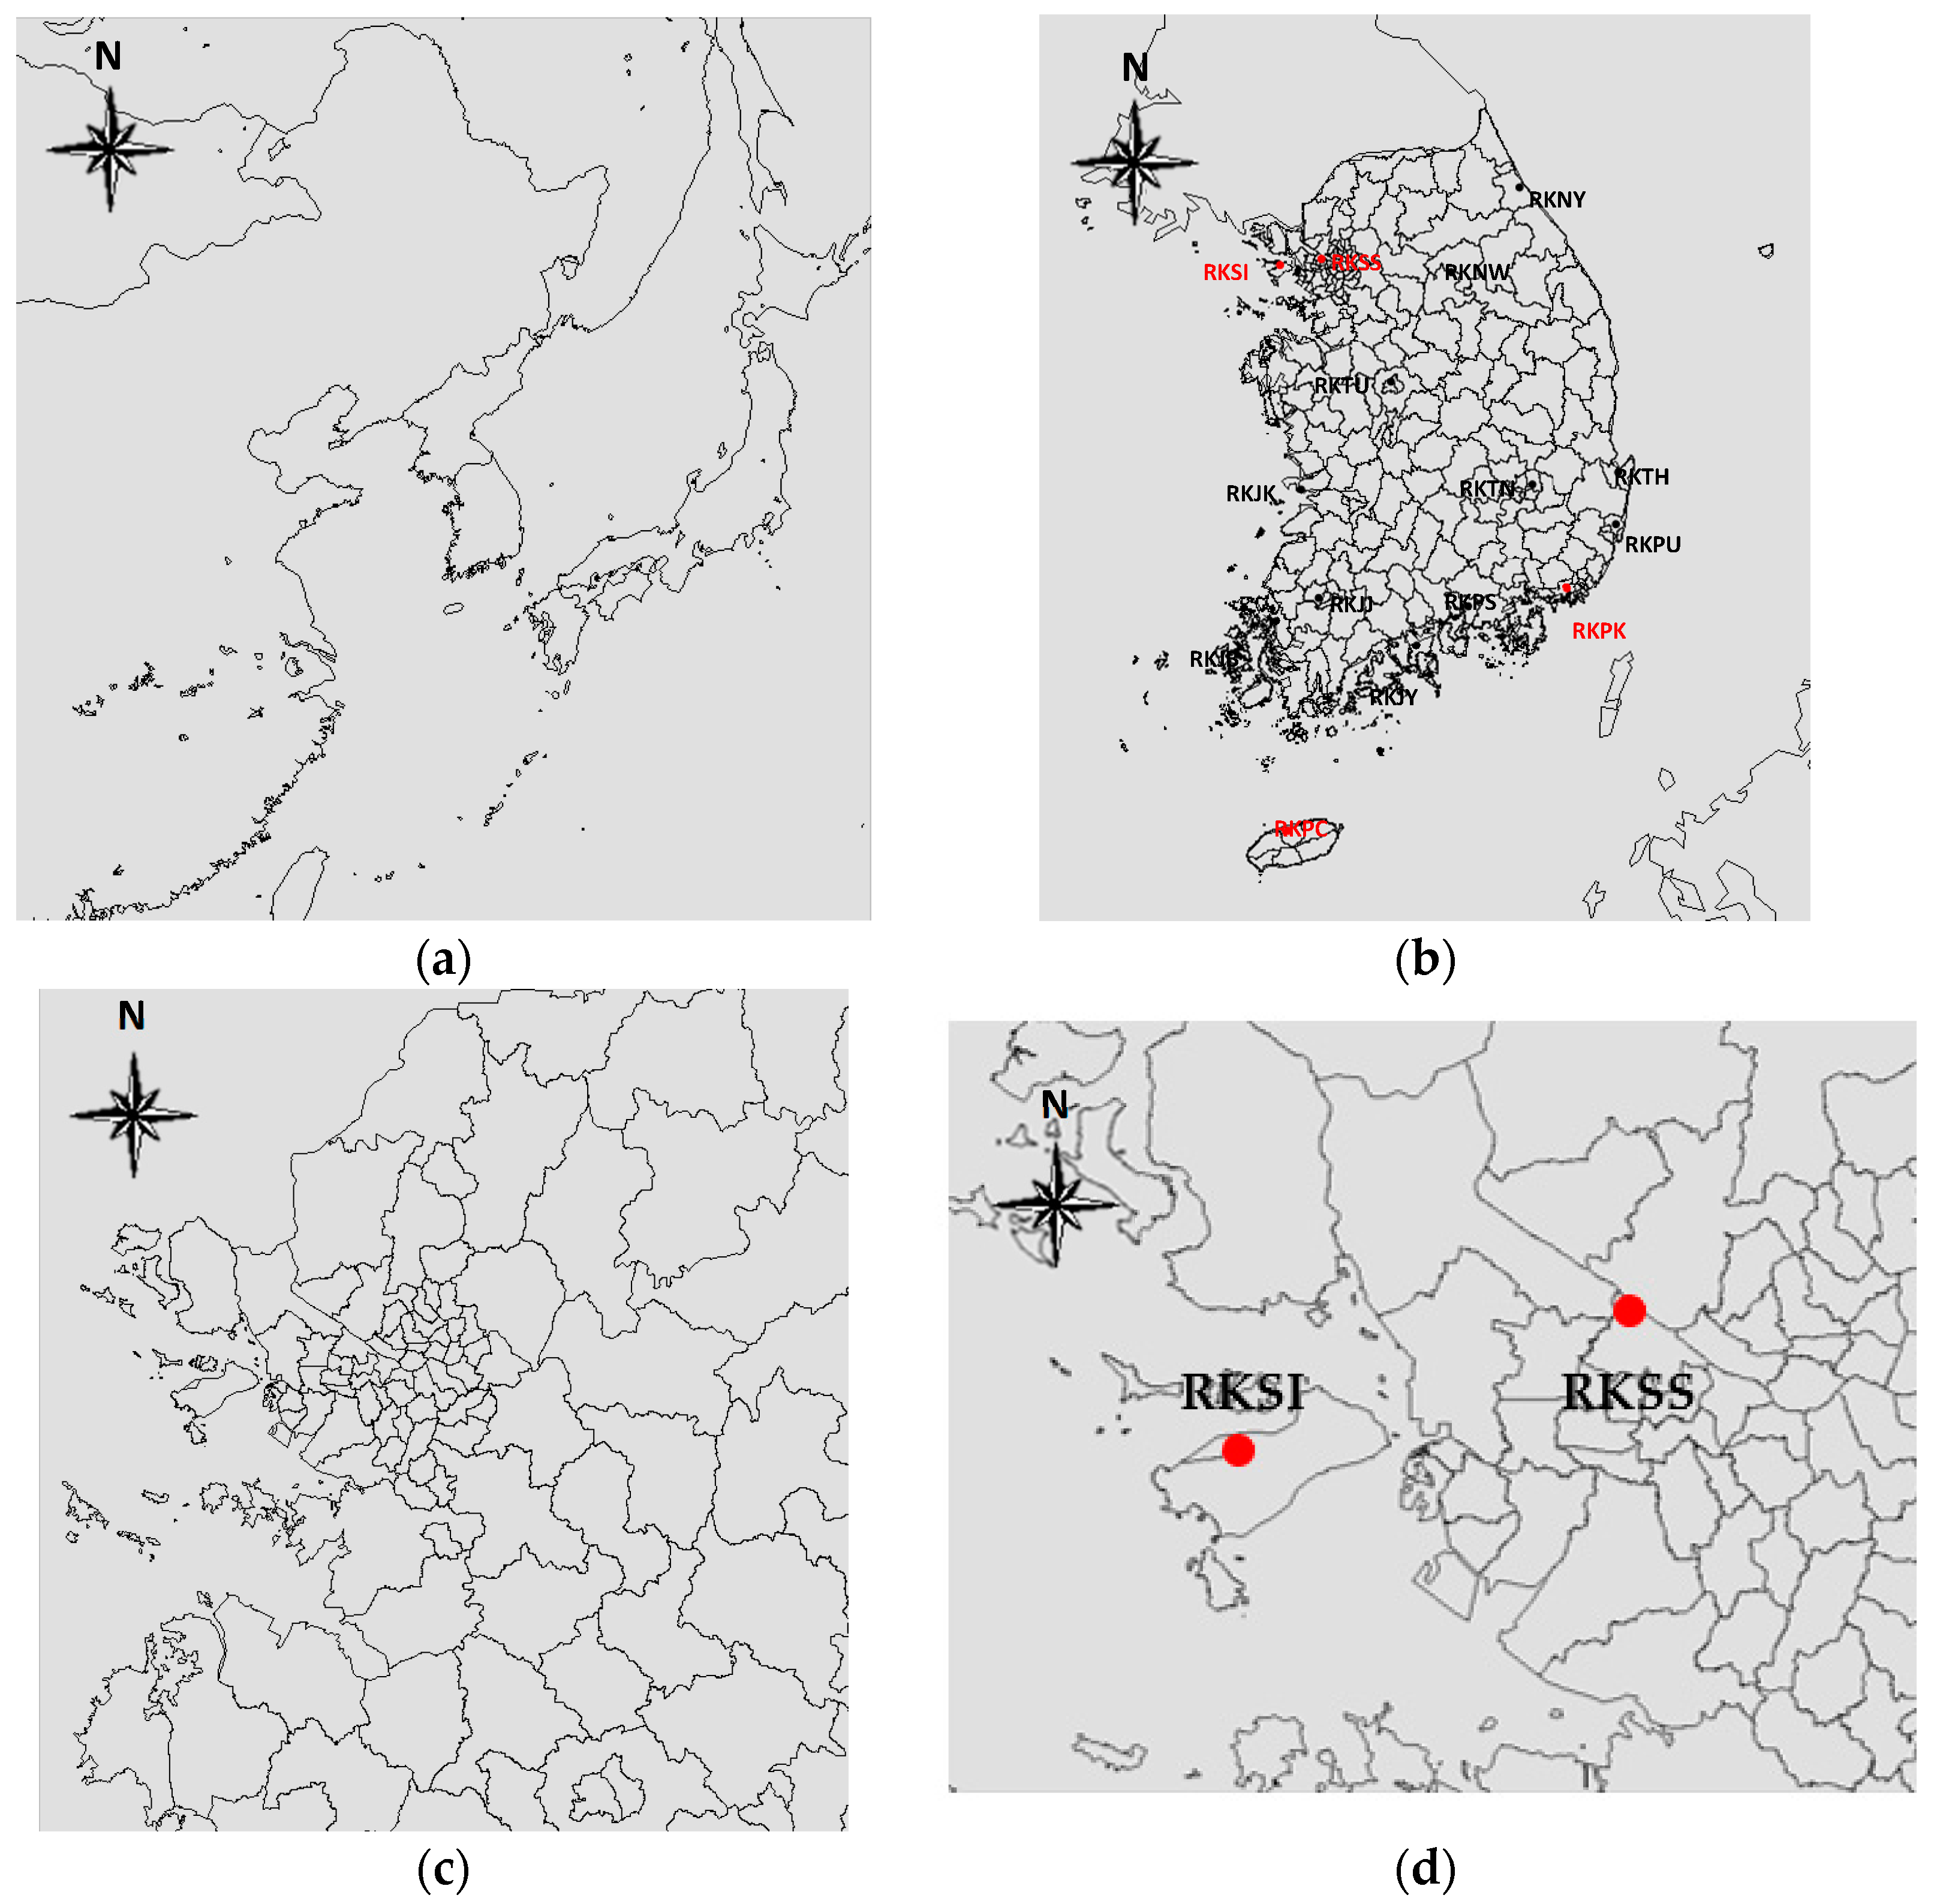
2.1. Study Domain, Study Period and Scenarios

The Weather Research and Forecast (WRFv3.6), Sparse Matrix Operator Kernel Emission (SMOKEv3.5), and Community Multi-scale Air Quality Modeling (CMAQv5.0.2) model were used to estimate the air quality in the selected domain. WRF is a mesoscale numerical weather prediction system which provides meteorological data for the atmospheric chemistry model CMAQ [29]. The emission model SMOKE uses the emission inventory to produce grid-formatted data suitable for CMAQ through time and spatial allocation process [30]. NCEP FNL Operational Global Analysis data was used as the input data for the meteorological model and INTEX (Intercontinental Chemical Transport Experiment)-B and CAPSS were used as emission inventories for the emission model. By using the meteorological data and gridded emission data as inputs, CMAQ is able to simulate the air condition for the domain. For specific CMAQ model settings, CB05 was used for the gas-phase chemical mechanism, AERO-5 was used as aerosol module, and SAPRC99 and YAMO were each applied for the chemical mechanism and advection scheme option.
The study was conducted using four domains while applying the nesting method. Selected domains are shown in Figure 1. A 118 × 125 domain of 27 km square grid (D01) encompassing East Asia includes Japan, Korea, and the eastern part of China. A 67 × 79 domain of 9 km square grid (D02) focuses on the Korean peninsula. According to the CAPSS national emissions inventory for 2017, RKSI accounted for about 50% of the total aviation emissions among the fifteen airports in Korea. Also, the four major international airports (RKSI, RKSS, RKPK, and RKPC) are responsible for more than 90% of total aviation emissions. To more efficiently analyze the pollutants emitted from the two airports serving the capital area of Seoul, a 60 × 63 domain of 3 km square grid (D03) and an 82 × 64 domain of 1 km square grid (D04) were utilized for the Seoul metropolitan area and the airport area, respectively, which includes RKSI and RKSS. Specific boundaries were decided based on the standard modeling domain used for national atmospheric policy studies [31].
The modeling period was selected taking into consideration the PM2.5 concentration pattern, the reduction of flights during 2020, and availability of the most recent national emissions inventory. Considering all of these factors, monthly average PM2.5 concentrations of 2017 for Incheon and Seoul were selected for this study. To evaluate the decreased number of flights during the COVID-19 pandemic, the difference between the number of 2020 flights and 2019 flights was calculated. Monthly average PM2.5 concentration and the reduction in number of flights for RKSS showed a peak in March [2,32], at the onset of the pandemic. For RKSI, the number of flights also drastically reduced in March and showed a steady trend until the end of the year [2]. Therefore, March was selected as the research period to analyze the impact of aviation emissions and COVID.
The model simulations utilized four different scenarios described in Table 1. The BASE scenario is based on the original CAPSS emission inventory for 2017. By comparing its result with the noAVI (no Aviation) scenario, the impact of aviation emissions was calculated. The aviation emissions for the BAU scenario is under the premise that the COVID-19 pandemic has not occurred while in the COVID scenario, the actual emissions during the pandemic were estimated. Through these two scenarios, the impact of COVID-19 may be inferred. Changes in monthly average concentration were calculated to examine the difference in air quality between scenarios.

2.2. Emissions Calculation

For the BASE scenario, aviation emissions data from CAPSS were used without modification and the noAVI scenario was performed with aviation emissions as zero. Aviation emissions for BAU and COVID scenarios were estimated and calculated applying the flight reduction data.
The National Air Emission Inventory and Research Center has provided yearly emission inventory data of Korea since 1999. To estimate the emissions for 2020 without the impact of COVID-19, a linear regression of past data was performed. Each emissions data set for the 15 airports were divided into domestic and international flights and calculated separately. The number of flights in minor airports can easily fluctuate due to the launching and suspension of air routes, which may lead to some error. Therefore, to increase accuracy, we compared the emission inventory with actual flight data and adjusted for the period with linear regression. Due to a change of emission factors starting from the 2007 national inventory, data from 2007 to 2017 were mostly used. However, different periods had to be applied for Ulsan Airport (RKPU, Ulsan, Korea) and Pohang Gyeongju Airport (RKTH, Pohang, Korea) for the following reasons. A new express train line launch in the area led to a drastic decrease in flights for RKPU and a new runway construction affected aviation operations for RKTH.
Emissions calculation for the COVID scenario followed the national air pollutant emission calculation method manual [33]. The number of flights for every airport was obtained from the Korea Airports Corporation (KAC) and Incheon International Airport Corporation. For aircraft emissions, only pollutants emitted during the LTO phase were taken into account while emissions from the cruise phase were excluded regarding the fact that its impact on ground level concentrations would be minor. To quantify the emissions, operation time, emission coefficients based on operation mode (Taxi out, Takeoff, Climb out, Approach, Landing and Taxi in) and the number of engines were applied. Types of GSE differ according to the type and size of aircraft but in this study, only a maximum number of eight different types were applied according to the scale of the airport and the associated number of flights.
The formulas for aircraft emissions and GSE emissions are shown below (Equations (1) and (2)) [33].
E i j = A j 2 × N × t j , m o d e × E F i j , m o d e
where: E i j : Emission of pollutant i for aircraft j (kg/yr), A j : Number of take-off and landings of aircraft j, N : Number of engines for aircraft j, t j , m o d e : Engine running time for aircraft j by flight mode (min), E F i j , m o d e : Emission factor of pollutant i for aircraft j by flight mode (kg/min-engine).
E i j k = A j k / 2 × E F i j k , m o d e
where: E i j k : Emission of pollutant i for GSE j in airport k (kg/yr), A j k : Number of take-off and landings in airport k, E F i j k , m o d e : Emission factor of pollutant i for GSE j in airport k (kg/LTO).
For the BASE, noAVI, and BAU scenarios, aviation emissions were temporally allocated by flight data of 2017. Meanwhile, emissions were divided monthly, daily, and hourly by 2020 flight data in the COVID scenario to closely examine the effect of the pandemic.
Through the SMOKE model, these aviation emissions were applied in the domain along the location of the airports.

3. Results and Discussion

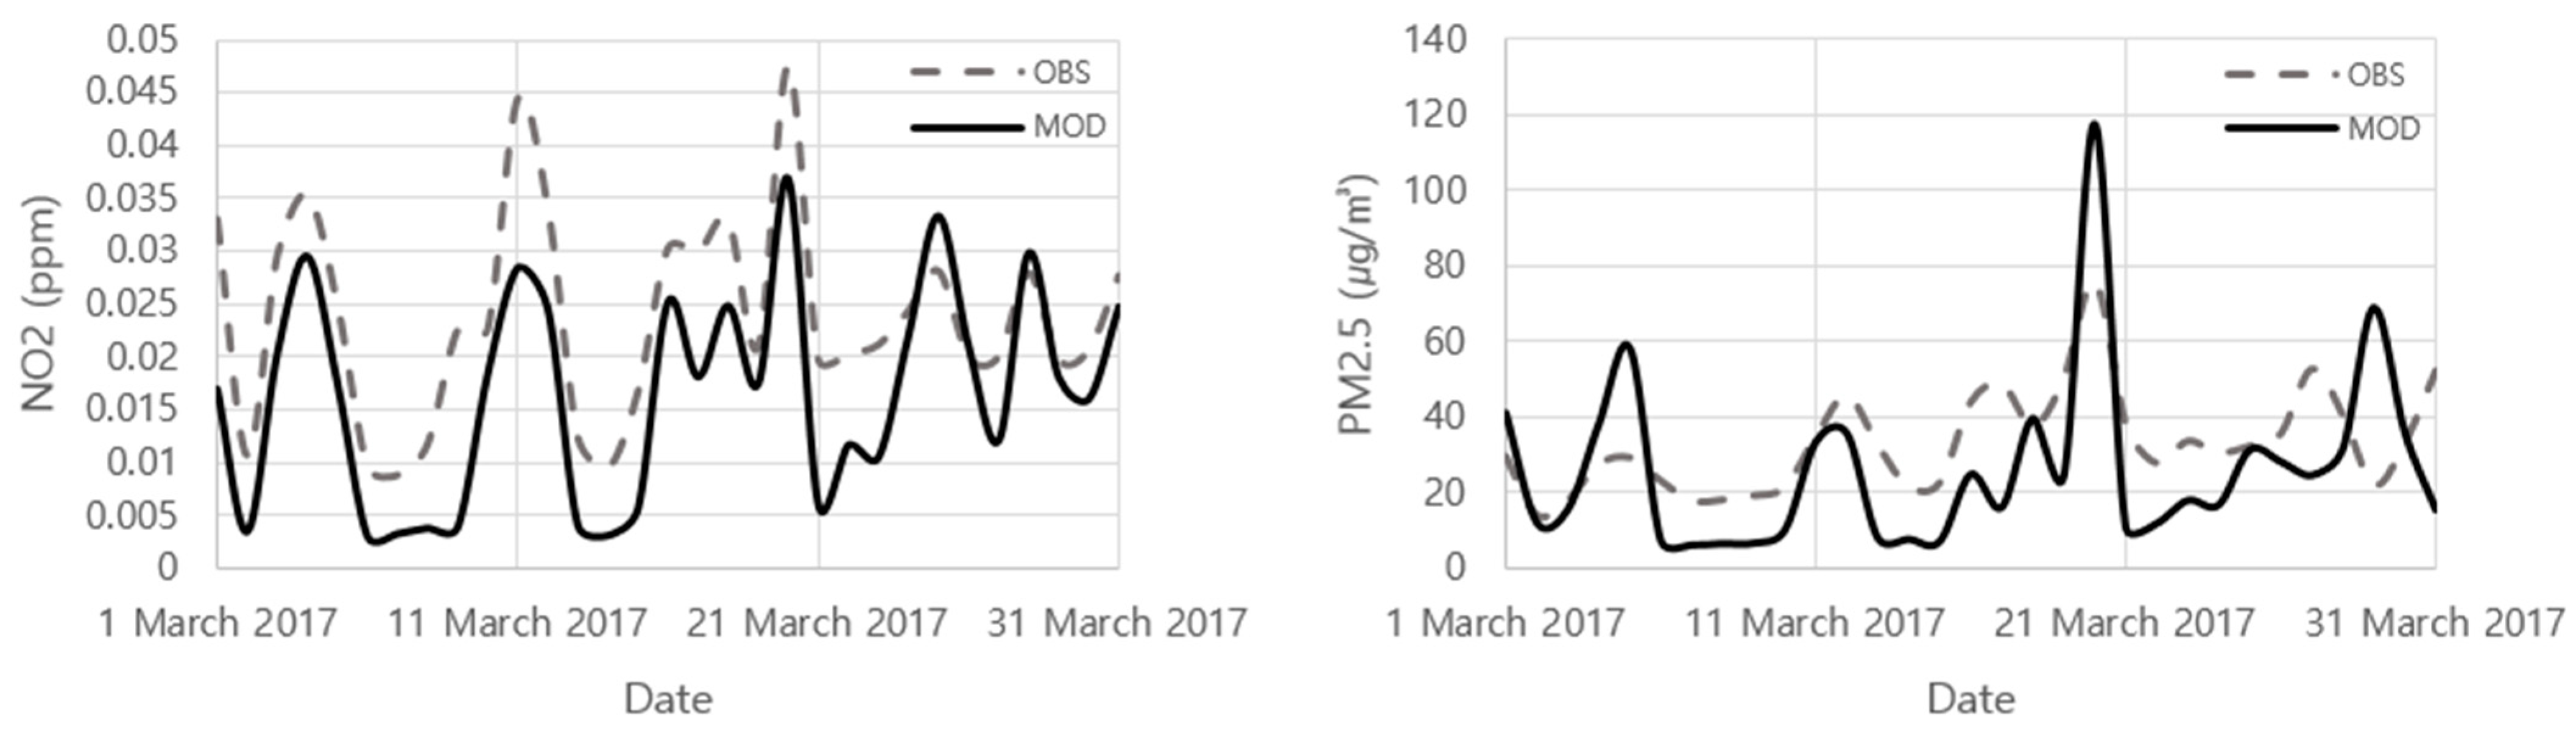
3.1. Model Evaluation

In order to effectively utilize the model, its result must undergo an evaluation process. For the assessment of the CMAQ model, the concentrations of NO2 and PM2.5 were compared to monitoring station data. Among the monitoring stations, Un-seo station which is closest to RKSI was chosen for a full evaluation. Figure 2 shows the time series plots of PM2.5 and NO2 concentration for both observation and model data near RKSI. The measurement data was taken from AirKorea’s final confirmed data [34]. Although the Incheon International Airport Corporation is operating its own monitoring station, it was not utilized since it does not belong to the official air measurement network operated by the Korean Environment Corporation.
The model’s average concentration for NO2 for the cell including the comparison monitoring site was 0.017 ppm, underestimated compared to the observation data’s 0.024 ppm. The daily concentration showed a similar trend, with the model result mostly lower than the measured values except for 25th and 28th of March 2017. The average PM2.5 concentration of 26 μg/m3 was also underestimated in comparison to the measurement data average of 33 μg/m3. However, the trends between the two values are again quite similar while modeled values are relatively smaller overall.
Evaluation statistics for the model are shown in Table 2. Since daily average concentration data were used, the total number of data is 31. The FAC2 for NO2 is 0.68 meaning that 68% of the model results versus measurements ratio are between 0.5 and 2.0. MB, MAE, and RMSE were respectively calculated as −0.01 ppm, 0.01 ppm, and 0.01 ppm. The correlation coefficient r is 0.86 meaning a relatively strong positive linear relationship. The FAC2 for PM2.5 is 0.52. MB, MAE, and RMSE is −7.33 μg/m3, 16.59 μg/m3, and 20.43 μg/m3. The correlation coefficient and IOA for PM2.5 was lower than for NO2 [35].

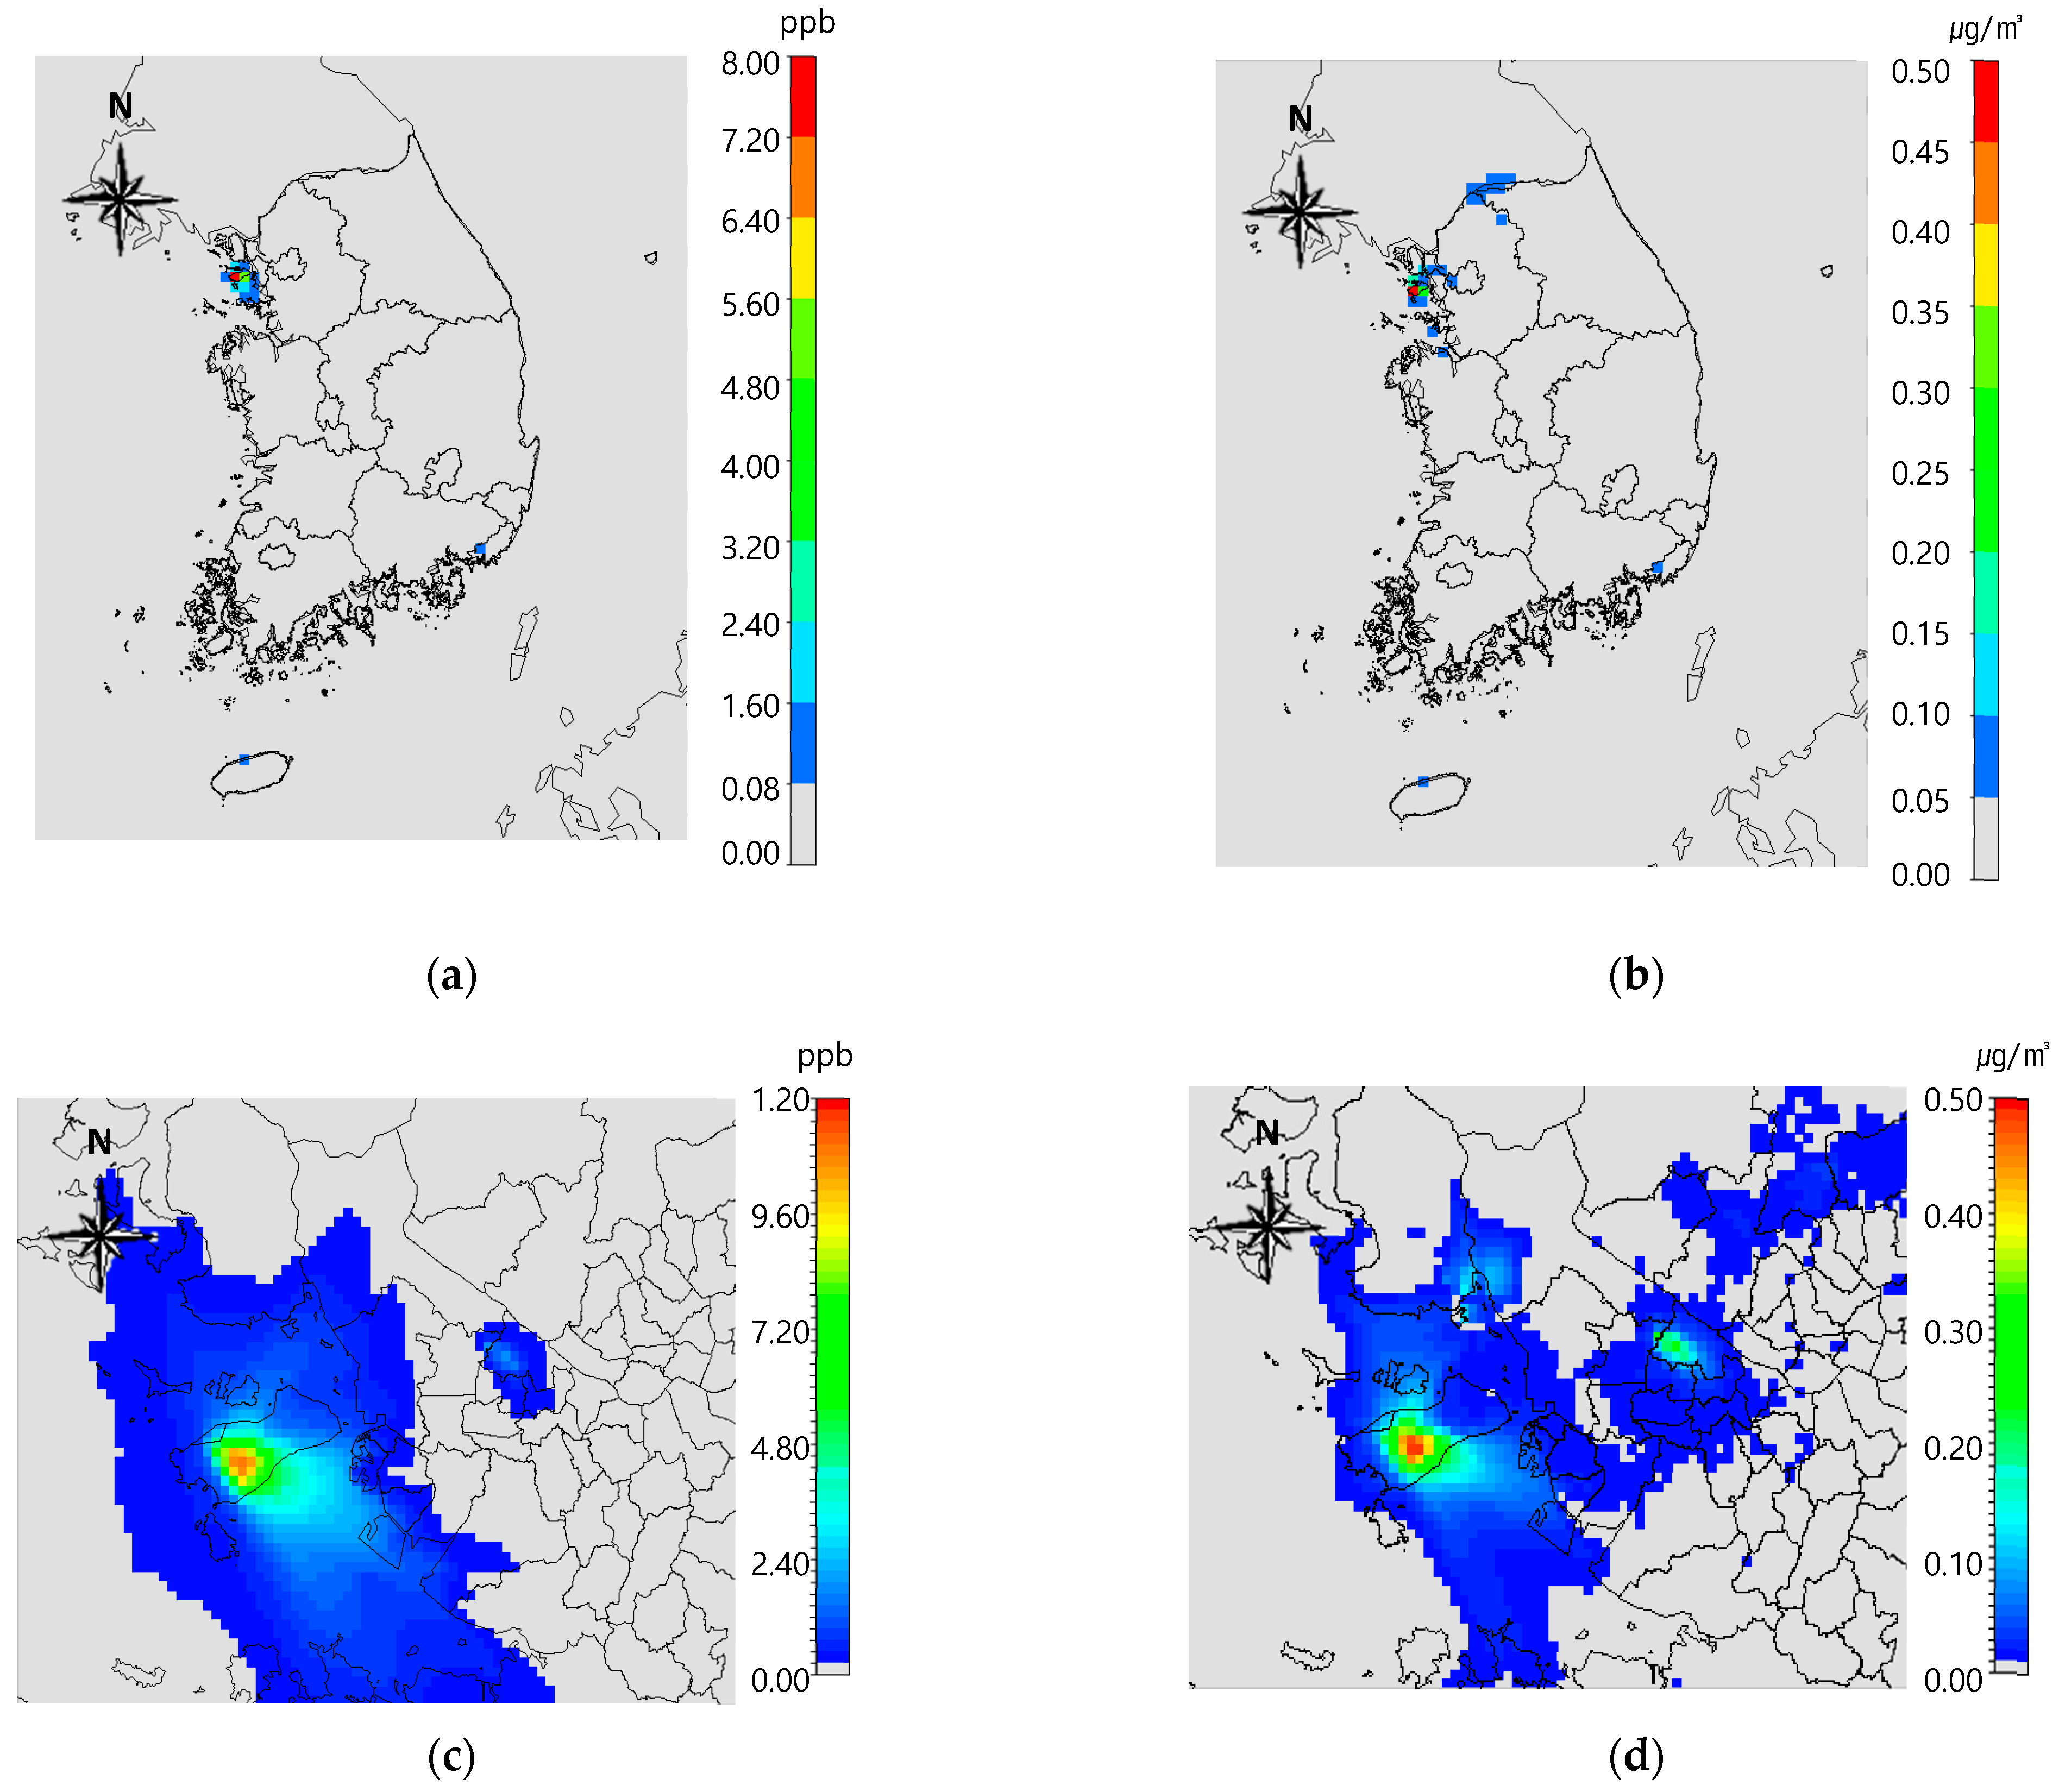
3.2. Impact of Aviation on Air Quality

Figure 3 provides the differences in NO2 and PM2.5 concentrations between the BASE and noAVI scenarios. On a national scale, the average concentration of NO2 showed the largest change near RKSI. The monthly average concentration of NO2 changed by up to 13.4 ppb in the Incheon area, while RKPC and RKPK followed with 2.4 ppb and 1.2 ppb. The contribution of the other 12 airports on NO2 concentration was less than 1.0 ppb. Based on the finer resolution results focusing on RKSI and RKSS, the maximum change of monthly average concentration in NO2 was 21.9 ppb near RKSI meaning a 75.8% decrease. The change rate near RKSS was 15.6% with 4.5 ppb. PM2.5 concentration also showed the greatest difference in RKSI with RKSS and RKPC following. According to domain D04, the maximum change of PM2.5 near RKSI was 1.11 μg/m3 (6.1%), while RKSS had a smaller change of 0.97 μg/m3 (2.3%).
While RKSS has the third-largest number of flights, its contribution to NO2 was lower than expected. This may be due to the fact that RKSS is located near the Seoul metropolitan area where various types of mobile sources aside from airports affect air quality while airports such as RKSI are located in a rather rural area.
In comparison to NO2, PM2.5 showed a smaller change. Due to the incineration process in jet engines, thermal NOX is released in large quantities. Therefore, NOX emissions constitute the largest proportion among aviation emissions. Naturally, the reduction of NOX emissions led to a substantial amount of decrease in NO2 concentration. On the other hand, PM2.5 follows a more complex process than NO2. As for the concentration of PM2.5, not only direct PM emissions, but also materials, such as NOX, SOX, and VOCs, form PM2.5 through atmospheric chemical reactions. The reasons for the relatively minor impact on PM2.5 is that, for one, the reduction of direct PM emissions was much less than that of NOX. Second, NOX, which was greatly reduced, also acts as a precursor for the secondary formation of PM2.5 as well. However, since it reacts with other pollutants and has a nonlinear relationship, its impact on PM2.5 concentration should be comparatively smaller.

3.3. Impact of COVID-19 on Aviation Emission and Air Quality

3.3.1. Emissions Reduction

The reduction of emissions for the BAU and COVID scenarios are shown in Table 3, Table 4 and Table 5, divided into domestic, international, and total sectors. For the case of domestic flights, the changes vary greatly by airport. While RKSI, RKPC, RKTH, Muan International Airport (RKJB, Muan, Korea), Gunsan Airport (RKJK, Gunsan, Korea), Sacheon Airport (RKPS, Sacheon, Korea), and Wonju Airport (RKNW, Wonju, Korea) had an overall decline, minor airports, such as Yeosu Airport (RKJY, Yeosu, Korea) and Yangyang International Airport (RKNY, Yangyang, Korea), had a slight increase for all pollutants. In the case of airports such as RKSS, RKPK, RKPU, Daegu International Airport (RKTN, Daegu, Korea), Cheongju International Airport (RKTU, Cheongju, Korea), and Gwangju Airport (RKJJ, Gwangju, Korea), the increase and decrease appeared alternatively depending on the pollutant. Among 15 airports in Korea, RKSI, RKSS, RKPC, RKPK, RKTN, RKTU, RKJB, and RKNY manage international aviation. International emissions from these airports dropped on a larger scale compared to domestic aviation. Unlike the domestic sector, all airports showed a decline in its international aviation emissions.
The total changes of emissions are shown in Table 5. While emissions of certain pollutants increased in the domestic sector, the large decrease in the international sector led to a total decrease in aviation emissions. All pollutant emissions decreased by more than 30% with NOX having the largest reduction of 4,860.33 tons. Among all airports, RKSI and RKPK had the largest reduction with both airports decreasing more than 30% for all pollutants. The reduction of these two airports account for more than 70% of the total reduction. RKSI and RKPK are among the top 4 major airports in Korea and both airports have a high percentage of international flights. Due to the decrease of international flights after the COVID-19 outbreak, the emissions of airports with a high number of international flights plummeted.
The change in emissions for the same airport varies according to pollutant. For instance, domestic aviation emissions for CO and NOX have increased in RKSS, while other pollutants showed a decline. This is presumed to be partly due to the calculation method. Emissions for the BAU scenario were estimated by linearly scaling past data. However, the data for pollutants, such as PM2.5 and BC, are available only for recent years, causing a lack in the number of data points for linear regression analysis. Moreover, emission factors for aviation emission vary by aircraft and pollutant. Therefore, emissions are estimated for each pollutant according to the number of flights per each type of aircraft.
Emissions for RKJY and RKNY increased in the COVID scenario. This is opposed to the general idea that COVID-19 lockdowns led to a reduced number of flights and ultimately a decline in aviation emissions. However, in the case of RKJY and RKNY, the number of flights in 2020 increased compared to the previous year. The number of flights in RKNY has been below 1000 for the past five years from 2015 to 2019 but peaked at 2542 in 2020, which is the largest value since 2004. The international lockdown caused by the pandemic raised demands for domestic travel, and new routes have been launched for these airports. Though emissions for RKJY and RKNY have increased, it is considerably minimal compared to the reduction in other major airports. Changes in the number of flights can be found in Supplementary Material (Tables S1–S3).
According to the Special Act on Air Quality Improvement in Air Control Zones, four areas in the Korean peninsula were designated as air pollutant control zones according to their contribution to PM2.5 concentration. All zones must produce a master plan and airports located within the air control zones must additionally establish air quality improvement plans. A list of target airports is shown in Table 6.
Each air control zone has a target emission reduction according to its implementation plan. We’ve compared the decrease of emissions due to COVID-19 and the target emission reduction for non-road emissions according to the air control zone master plan in Table 7 [36,37,38,39]. The capital area’s reduction was closest to the target with emissions for NOX and VOCs achieving its goal. Abatement in the southeast region also came near its target with NOX and VOCs emissions having the highest rate as well. The two airports with the largest reductions (RKSI and RKPK) are each located in the capital area and southeast region of the peninsula, respectively, which led to high reductions area-wise. Airports in the central region of the country are relatively small, resulting in a slight decrease compared to its target. Meanwhile, emissions in the southern regions increased due to the change in RKJY. While the air control zone master plan aims to reduce emissions for the non-road sector, most plans are directed toward shipping and construction machinery rather than aviation. Therefore, a direct comparison between these two values has its limits. However, considering the cost drawn up as budgets to cut back emissions and the impact of COVID-19 on aviation emission being large enough to reach the target, this comparison demonstrates one of the economic effects of the pandemic on air pollution.

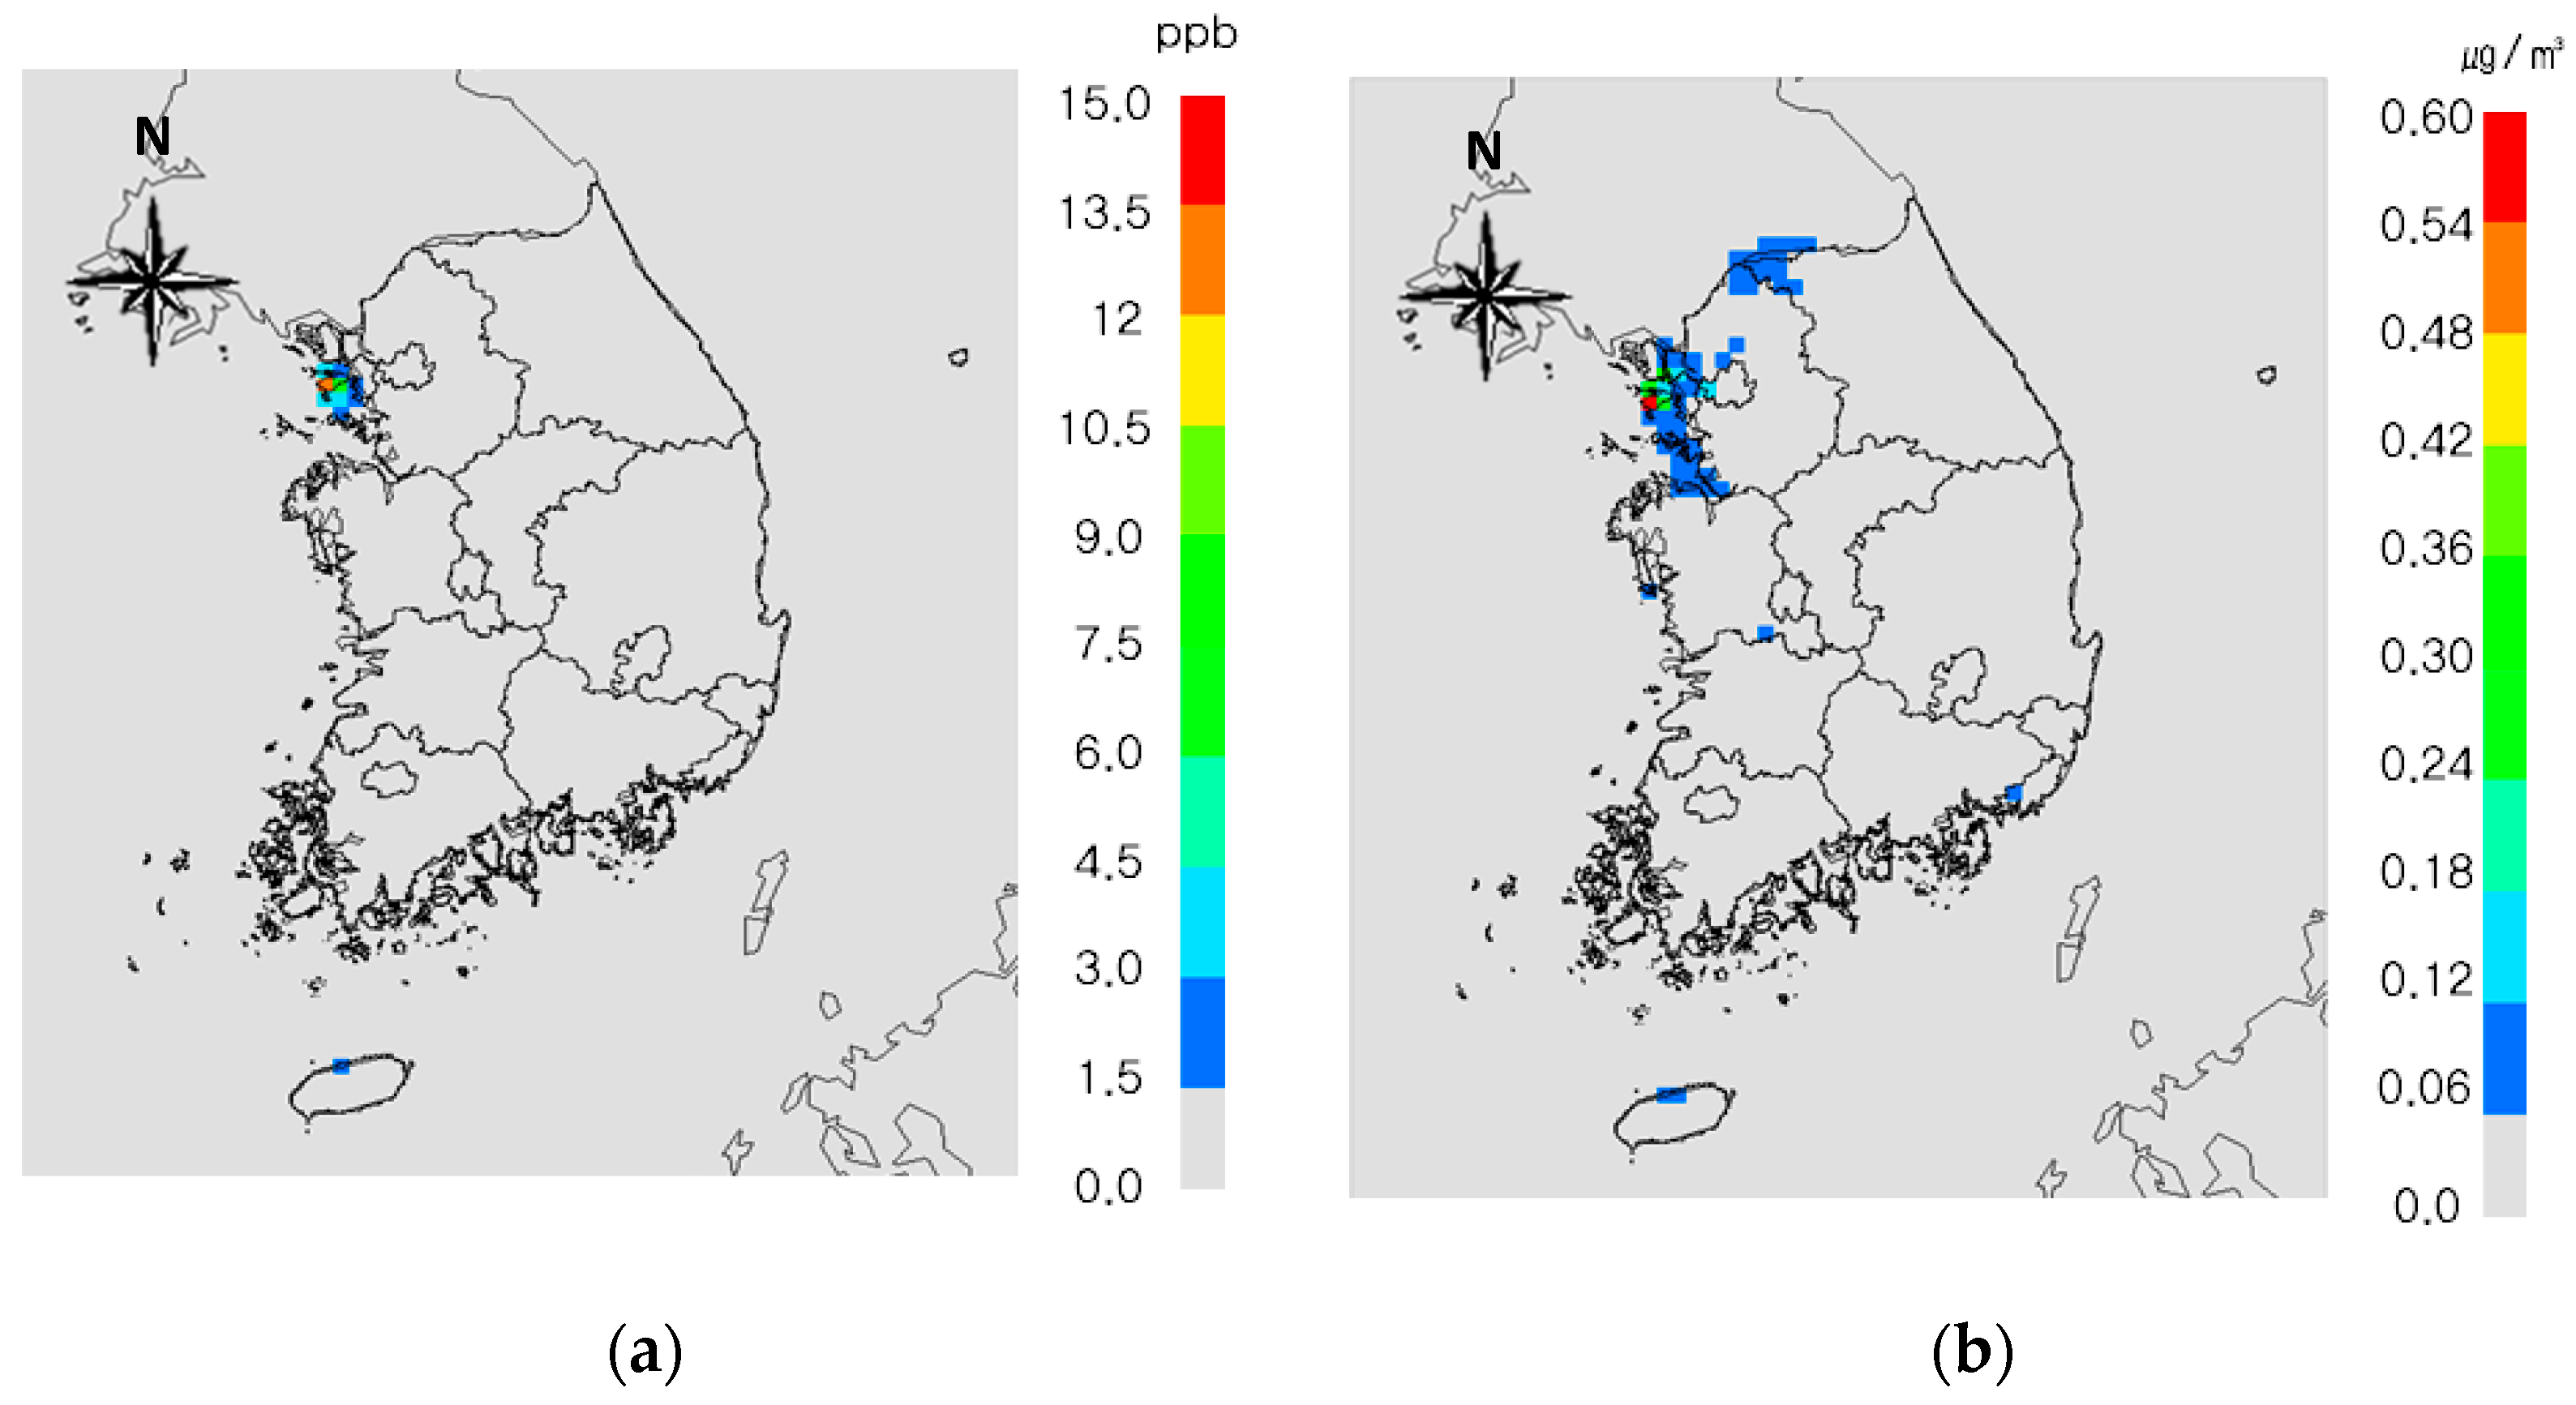
3.3.2. Changes in Air Pollutant Concentrations

Changes in the monthly averaged concentration for NO2 and PM2.5 were examined in two domains shown in Figure 4. Based on the nationwide domain (D02), areas near RKSI showed the maximum reduction of concentration for NO2 with 7.8 ppb. RKPC followed RKSI for reduction in NO2 concentration with 1.4 ppb while other areas showed only very small changes of less than 1.0 ppb. The highest resolution domain (D04) focusing on RKSI and RKSS displays a more detailed result. The maximum reduction in the RKSI area was 11.0 ppb, which accounts for about 42% of NO2 concentration. RKSS showed a relatively smaller amount of change with an average change of concentration of 1.9 ppb (6.6%). For PM2.5, the areas surrounding RKSI showed the largest reduction of 0.47 μg/m3. This was followed by RKPC, RKPK, and RKSS with 0.09 μg/m3, 0.08 μg/m3, and 0.07 μg/m3, respectively in the nationwide domain (D02). When one takes a deeper look in the capital area with the high-resolution domain (D04), the maximum reduction of PM2.5 concentration in RKSI was 0.98 μg/m3 and RKSS was 0.56 μg/m3.
The drastic decrease of air pollutant concentration in RKSI is mainly due to the large reduction of pollutant emissions. Both concentrations of NO2 and PM2.5 had the biggest change in RKSI. However, the amount of emission reduction did not always correspond to a decrease of concentration. While RKPK had the second-largest reduction, the air quality in its nearby areas showed very little improvement. The change of concentration in RKPK was less than RKPC which had a relatively smaller reduction of emissions. This may be due to the location of the airport and the characteristics of its surrounding areas. While RKPC is located in Jeju island, quite distant from the mainland, RKPK is based in Busan where it has more diverse types of pollutants affecting its nearby regions.
Overall, we observed the impact of aviation emissions on its nearby areas. Concentrations of NO2 and PM2.5, respectively increased up to 21.9 ppb and 1.11 μg/m3. While major airports had a noticeable effect, many airports did not have a significant impact on air quality. This result was predictable since the 4 major airports hold most of air traffic capacity. Moreover, since the major sources are sparsely located, extensive air quality improvement cannot be expected. Due to this perceived limitation, emission control in airports is discussed less compared to other mobile pollutant sources, such as ships or construction machineries.
However, this study confirmed that aviation emissions decreased substantially due to COVID-19 and as the pandemic is prolonged, this trend has a possibility to become a new normal. Emissions in large airports cannot be neglected and they have a distinct impact on air quality nearby. Therefore, it is crucial to be attentive to these social phenomena and reflect upon them and their variations in establishing atmospheric environment goals.

4. Conclusions

This study analyzed the impact of aviation emissions on NO2 and PM2.5 concentrations and their change due to COVID-19 in 2020. The reduced emissions based on the decreased number of flights during the pandemic were recalculated and their influence was evaluated through the chemical transport model CMAQ.
RKSI accounts for the largest proportion of emissions among airports followed by RKPC, RKSS, and RKPK. These four airports account for 90% of aviation emissions in Korea and had a significant impact on air quality in its surroundings. Monthly concentration in areas near RKSI showed a 21.9 ppb increase in NO2 and 1.11 μg/m3 increase in PM2.5 due to the presence of the airline hub.
The change in emissions during the 2020 COVID-19 pandemic was evaluated by contrasting estimated values between linearly estimated data and calculated data from the number of flights in 2020. A drastic decrease in international flights occurred due to the pandemic while the change in emissions for domestic sectors varied by airport. These reductions are compelling when compared to the non-road emission target set by the Special Act on Air Quality Improvement in Air Control Zones with some control zones achieving their target only due to the impact of COVID-19. Though its reductions were not intended, its impact on the atmospheric environment was quite significant. Nevertheless, some airports showed an increase in emissions due to the elevated demand for domestic travel coinciding with the international border restrictions during the pandemic. Airlines launched new domestic routes as well, but the total increase was insignificant.
Air pollutant concentration dropped the most near RKSI, with NO2 declining up to 11.0 ppb and PM2.5 0.98 μg/m3 due to the pandemic. Among the four major airports (RKSI, RKPS, RKSS, RKPK), RKSS, closest to Seoul, had the smallest change in air pollutant concentration. RKSS showed the smallest change in emissions, and its location near the metropolitan area also makes it exposed to various complicated pollutants aside from aviation.
The emissions for aircraft are estimated based on emission factors for each type of aircraft. However, aircraft without designated emission factors are categorized into a miscellaneous group and calculated altogether. For instance, aircraft C300, for which the number of flights has been increasing since 2018 and reached more than 10,000 in 2020, is still classified with the others in this group. Based on year 2020, the number of aircraft classified as miscellaneous accounts for up to 18.7% of the total number of flights, leading to a notable limitation of this research. In the case of RKSI, 11% of NOX emissions and 21% of PM2.5 emissions are sorted as miscellaneous. For a more accurate aircraft emission inventory, a more detailed subdivision of emission factors needs to be developed.
The future of aviation emission is unclear. COVID-19 has shown an unprecedented effect resulting in significant aircraft emission savings. With the spread of vaccination, the aviation industry is presumed to recover, but it is unclear whether it will reach its previous state. For instance, people have adjusted to digital forms of meetings as the pandemic progressed for the long term and this trend may continue where face-to-face meetings are no longer a necessity [40,41]. On the other hand, apart from the pandemic, additional airports are being planned to be constructed in Korea, which could lead to an upward trend in air travel and subsequent air-related emissions [42]. Though the future of the aviation business appears to be vague, it is clear that this is an important time for the aviation industry to cautiously review and recalibrate its environmental impact while applying such unprecedented impact analysis data as this research has presented.

Supplementary Materials

The following supporting information can be downloaded at: https://www.mdpi.com/article/10.3390/atmos13101553/s1, Table S1: Number of Domestic Flights in Each Airport for 2007–2020, Table S2. Number of International Flights in Each Airport for 2007–2020, Table S3. Number of Total Flights in Each Airport for 2007–2020.

Author Contributions

Conceptualization, Y.C. and Y.S.; methodology, Y.C.; software, Y.C.; validation, Y.C.; formal analysis, Y.C.; investigation, Y.C.; resources, Y.C.; data curation, Y.C.; writing—original draft preparation, Y.C.; writing—review and editing, Y.S.; visualization, Y.C.; supervision, Y.S. All authors have read and agreed to the published version of the manuscript.

Funding

This research was supported by the Ministry of Environment as “the Graduate School of Particulate Matter Specialization”.

Institutional Review Board Statement

Not applicable.

Informed Consent Statement

Not applicable.

Data Availability Statement

Data for Figure 2 are openly available in Figshare at https://doi.org/10.6084/m9.figshare.21078223. Additional data presented in the study are avilable on the request from the corresponding author.

Conflicts of Interest

The authors declare no conflict of interest.

References

  1. ICAO. Airport Air Quality Manual.; ICAO: Montreal, QC, Canada, 2016; p. 33.
  2. KAC. Available online: https://airport.co.kr/www/cms/frCon/index.do?MENU_ID=1250 (accessed on 8 August 2022).
  3. Hudda, N.; Durant, L.; Fruin, S.; Durant, J. Impact of Aviation Emissions on Near-Airport Residential Air Quality. Environ. Sci. Technol. 2020, 54, 8580–8588. [Google Scholar] [CrossRef] [PubMed]
  4. Carslaw, D.; Beevers, S.; Ropkins, K.; Bell, M. Detecting and quantifying the contribution made by aircraft emissions to ambient concentrations of nitrogen oxides in the vicinity of a large international airport. Atmos. Environ. 2006, 40, 5424–5434. [Google Scholar] [CrossRef]
  5. Li, J.; Yang, H.; Liu, X.; Yu, N.; Tian, Y.; Zhou, X.; Zhang, P.; Wang, K. Aircraft Emission Inventory and Characteristics of the Airport Cluster in the Guangdong-Hong Kong-Macao Greater Bay Area, China. Atmosphere 2020, 11, 323. [Google Scholar] [CrossRef]
  6. Ratliff, G.; Sequeira, C.; Waitz, I. Aircraft Impacts on Local and Regional Air Quality in the United States. In Partnership for AiR Transportation Noise and Emissions Reduction; Massachusetts Institute of Technology: Cambridge, MA, USA, 2009; pp. 11–12. [Google Scholar]
  7. Arter, C.; Arunachalam, S. Assessing the importance of nonlinearity for aircraft emissions’ impact on O3 and PM2.5. Sci. Total Environ. 2021, 777, 146121. [Google Scholar] [CrossRef]
  8. Bo, X.; Xue, X.; Xu, J.; Du, X.; Zhou, B.; Tang, L. Aviation’s emissions and contribution to the air quality in China. Atmos. Environ. 2019, 201, 121–131. [Google Scholar] [CrossRef]
  9. Yang, X.; Cheng, S.; Lang, J.; XU, R.; Lv, Z. Characterization of aircraft emissions and air quality impacts of an international airport. J. Environ. Sci. 2018, 72, 198–207. [Google Scholar] [CrossRef]
  10. Arunachalam, S.; Wang, B.; Davis, N.; Baek, B.H.; Levy, J.I. Effect of chemistry-transport model scale and resolution on population exposure to PM2.5 from aircraft emissions during landing and takeoff. Atmos. Environ. 2011, 45, 3294–3300. [Google Scholar] [CrossRef]
  11. Woody, M.c.; West, J.J.; Jathar, S.H.; Robinson, A.L.; Arunachalam, S. Estimates of non-traditional secondary organic aerosols from aircraft SVOC and IVOC emissions using CMAQ. Atmos. Chem. Phys. 2015, 15, 6929–6942. [Google Scholar] [CrossRef]
  12. Grobler, C.; Wolfe, P.; Dasadhikari, K.; Dedoussi, I.; Allroggen, F.; Speth, R.; Eastham, S.; Agarwal, A.; Staples, M.; Sabnis, J.; et al. Marginal climate and air quality costs of aviation emissions. Environ. Res. Lett. 2019, 14, 114031. [Google Scholar] [CrossRef]
  13. Vennam, L.; Vizuete, W.; Talgo, K.; Omar, M.; Binkowski, F.S.; Xing, J.; Mathur, R.; Arunachalam, S. Modeled full-flight aircraft emissions impacts on air quality and their sensitivity to grid resolution. J. Geophys. Res. 2017, 122, 13472–13494. [Google Scholar] [CrossRef] [Green Version]
  14. Yim, S.; Lee, G.; Lee, I.; Allroggen, F.; Ashok, A.; Caiazzo, F.; Eastham, S.; Malina, R.; Barett, S. Global, regional and local health impacts of civil aviation emissions. Environ. Res. Lett. 2015, 10, 034001. [Google Scholar] [CrossRef]
  15. Jonsdottir, H.; Delaval, M.; Leni, Z.; Keller, A.; Brem, B.T.; Siegerist, F.; Schönenberger, D.; Durdina, L.L.; Elser, M.; Burtshcer, H.; et al. Non-volatile particle emissions from aircraft turbine engines at ground-idle induce oxidative stress in bronchial cells. Commun. Biol. 2019, 2, 90. [Google Scholar] [CrossRef] [PubMed]
  16. Song, S.; Shon, Z. Emissions of greenhouse gases and air pollutants from commercial aircraft at international airports in Korea. Atmos. Environ. 2012, 61, 148–158. [Google Scholar] [CrossRef]
  17. Lee, J.; Kim, W.; Kim, Y.; Choi, S. A study on the approach to reduce in the aviation GHG emissions in Korea. J. Korean Soc. Aviat. Aeronaut. 2016, 24, 47–54. [Google Scholar] [CrossRef]
  18. Song, S.; Shon, Z.; Kang, Y. Comparison of impacts of aircraft emissions within the boundary layer on the regional ozone in South Korea. Atmos. Environ. 2015, 117, 169–179. [Google Scholar] [CrossRef]
  19. Cucinotta, D.; Vanelli, M. WHO declares COVID-19 a pandemic. Acta Biomed. 2020, 91, 157–160. [Google Scholar] [CrossRef] [PubMed]
  20. Venter, Z.; Aunan, K.; Chowdhury, S.; Lelieveld, J. COVID-19 lockdowns cause global air pollution declines. Proc. Natl. Acad. Sci. USA 2020, 117, 18984–18990. [Google Scholar] [CrossRef] [PubMed]
  21. He, G.; Pan, Y.; Tanaka, T. The short-term impacts of COVID-19 lockdown on urban air pollution in China. Nat. Sustain. 2020, 3, 1005–1011. [Google Scholar] [CrossRef]
  22. Amouei Torkmahalleh, M.; Akhmetvaliyeva, Z.; Omran, A.; Omran, F.; Kazemitabar, M.; Naseri, M.; Naseri, M.; Sharifi, H.; Malekipirbazari, M.; Adotey, E.; et al. Global air quality and COVID-19 pandemic:do we breathe cleaner air? Aerosol Air Qual. Res. 2021, 21, 200567. [Google Scholar] [CrossRef]
  23. Han, B.; Park, K.; Kwa, K.-H.; Park, S.-B.; Jin, H.-B.; Moon, S.; Kim, J.-W.; Baik, J.-J. Air quality change in Seoul, South Korea under COVID-19 social distancing: Focusing on PM2.5. Int. J. Environ. Res. 2020, 17, 6208. [Google Scholar] [CrossRef]
  24. Ju, M.; Oh, J.; Schoi, Y.-H. Changes in air pollution levels after COVID-19 outbreak in Korea. Sci. Total Environ. 2021, 750, 141251. [Google Scholar] [CrossRef] [PubMed]
  25. Seo, J.; Kim, J.; Yang, J.; Yun, H.; Roh, M.; Kim, J.; Yu, S.; Jeong, N.; Jeon, H.; Choi, J.; et al. Changes in air quality during the COVID-19 pandemic and associated health benefits in Korea. Appl. Sci. 2020, 10, 8720. [Google Scholar] [CrossRef]
  26. Koo, J.; Kim, J.; Lee, Y.; Park, S.; Lee, S.; Chong, H.; Cho, Y.; Kim, J.; Hoi, K.; Lee, T. The implication of the air quality pattern in South Korea after the COVID-19 outbreak. Sci. Rep. 2020, 10, 22462. [Google Scholar] [CrossRef] [PubMed]
  27. ICAO, Effects of Novel Coronavirus (COVID-19) on Civil Aviation: Economic Impact Analysis. Available online: https://www.icao.int/sustainability/Pages/Economic-Impacts-of-COVID-19.aspx (accessed on 8 August 2022).
  28. IATA, COVID-19 has been an unprecedented shock. Available online: Https://iata.org/en/iata-repository/publications/economic-reports/covid-19-has-been-an-unprecedented-shock/ (accessed on 8 August 2022.).
  29. Weather Research and Forecasting Model┃MMM: Mesoscale & Microscale Meteorology Laboratory. Available online: https://www.mmm.ucar.edu/weather-research-and-forecasting-model (accessed on 8 August 2022).
  30. UNC (University of North Carolina at Chaper Hill). SMOKE v3.5.1 User’s Manual; UNC (University of North Carolina at Chaper Hill): Chaper Hill, NC, USA, 2013; p. 5. [Google Scholar]
  31. NIER. Air Quality Modeling Guideline for National Atmospheric Policy Establishment and Evaluation; NIER: Incheon, Korea, 2013; pp. 9–14.
  32. NIER. Atmospheric Environment Yearbook 2017; NIER: Incheon, Korea, 2018; p. 219.
  33. National Air Emission Inventory and Research center. National Air Pollutant Emission Calculation Method Manual; National Air Emission Inventory and Research Center: Osong, Korea, 2020; pp. 189–207.
  34. Airkorea. Available online: https://airkorea.or.kr/web (accessed on 8 August 2022).
  35. Carslaw, D. The Openair Manual Open-Source Tools for Analyzing Air Pollution Data; University of York and Ricardo Energy & Environment: Oxford, UK, 2019; pp. 165–170. [Google Scholar]
  36. Ministry of Environment. Basic Plan for Atmospheric Environment Management in the Central Region [2020–2024]; Ministry of Environment: Sejong, Korea, 2020.
  37. Ministry of Environment. Basic Plan for Atmospheric Environment Management in the Southeast Region [2020–2024]; Ministry of Environment: Sejong, Korea, 2020.
  38. Ministry of Environment. Basic Plan for Atmospheric Environment Management in the Southern Region [2020–2024]; Ministry of Environment: Sejong, Korea, 2020.
  39. Ministry of Environment. Basic Plan for Atmospheric Environment Management in the Capital Region [2020–2024]; Ministry of Environment: Sejong, Korea, 2020.
  40. Beaverstock, J.V.; Derudder, B.; Faulconbridge, J.; Witlox, F. Inernational buissness travel: Some expectations. Geogr. Ann. B Hum. Geogr. 2009, 91, 193–202. [Google Scholar] [CrossRef]
  41. Hernandez, M.; Xu, S.; Toh, L.; Attwood, A. Buisness air travel and climate: Changing behaviors before, during, and beyond the COVID-19 pandemic. Available online: https://doi.org/10.46830/wriwp.20.00148 (accessed on 8 August 2022).
  42. Ministry of Land, Infrastructure and Transport. 6th Comprehensive Plan for Airport Development (2021–2025); Ministry of Land, Infrastructure and Transport: Sejong, Korea, 2020.
Figure 1. Nested domains of CMAQ model (a) East Asia (27 km × 27 km) domain, (b) Korean Peninsula (9 km × 9 km) domain (c) Capital Area (3 km × 3 km), (d) Airport Area) (1 km × 1 km).
Atmosphere 13 01553 g001
Figure 2. Time Series Plots of Model and Observation Data.
Atmosphere 13 01553 g002
Figure 3. Impact of aviation on NO2 for nationwide domain (a) and airport area domain (c). Impact of aviation on PM2.5 for nationwide domain (b) and airport area domain (d).
Atmosphere 13 01553 g003aAtmosphere 13 01553 g003b
Figure 4. Changes in NO2 between BAU and COVID scenario for nationwide domain (a) and airport area domain (c). Changes in PM2.5 between BAU and COVID scenario for nationwide domain (b) and airport area domain (d).
Atmosphere 13 01553 g004
Table 1. Input emissions data for each scenario.
Non-Aviation EmissionsAviation Emissions
Base2017 CAPSS2017 CAPSS
noAVI2017 CAPSS-
BAU2017 CAPSS2020 Predicted Data
COVID2017 CAPSS2020 Calculated Data
Table 2. Model evaluation values.
nFAC2MBMAENMBNMERMSERIOA
NO2310.68−0.01 ppm0.01 ppm−0.300.320.01 ppm0.860.49
PM2.5310.52−7.33 μg/m316.59 μg/m3−0.220.5020.43 μg/m30.550.18
Table 3. Emissions Change due to COVID-19 in Domestic Aviation Sector.
Domestic Aviation Emission Change
Emission (ton/yr)Ratio (%)
CONOXSOXTSPPM10PM2.5VOCsBCCONOXSOXTSPPM10PM2.5VOCsBC
RKSI−29.61−31.35−2.05−0.57−0.54−0.47−3.04−0.34−82.57%−82.61%−73.04%−81.31%−81.33%−80.35%−83.55%−79.23%
RKSS109.31102.3−3.42−1.62−1.61−1.86−42.95−1.910.27%9.29%−3.12%−10.53%−10.87%−13.27%−40.02%−16.88%
RKPC−15.48−26.94−15.1−3.72−3.63−3.85−48.17−3.951.14%−1.91%−10.71%−17.81%−18.07%−20.28%−38.11%−25.28%
RKPK57.8256.464.890.650.61−0.537.76−1.2414.84%14.03%13.71%13.83%13.44%−10.01%47.12%−25.32%
RKTN−29.77−30.05−1.12−0.03−0.03−0.40.94−0.33−30.25%−29.85%−11.91%−2.63%−2.68%−26.80%17.37%−27.78%
RKTU35.8335.82.540.10.1−0.161.92−0.554.36%52.48%30.54%8.08%7.80%−10.88%32.43%−32.94%
RKJB−2.83−2.93−0.4−0.07−0.07−0.11−0.33−0.08−65.28%−65.46%−70.59%−75.33%−75.20%−84.61%−74.57%−84.54%
RKJJ−3.02−2.761.80.420.40.122.890.12−2.76%−2.48%19.80%39.04%38.84%10.50%67.87%14.08%
RKJY4.44.691.330.310.30.181.420.2110.42%10.93%41.98%91.84%92.07%45.34%139.65%89.22%
RKPU31.9332.011.750−0.01−0.010.55−0.06127.84%124.26%56.47%−0.63%−1.41%−1.31%22.65%−15.51%
RKJK−6.42−6.52−0.4−0.04−0.04−0.03−0.12−0.04−49.12%−48.86%−33.20%−26.30%−26.59%−21.12%−15.20%−33.03%
RKPS−5.44−5.65−0.68−0.11−0.11−0.13−0.47−0.11−50.18%−50.87%−61.59%−73.27%−73.60%−78.75%−64.97%−80.61%
RKTH−0.83−0.93−0.29−0.06−0.06−0.05−0.31−0.04−13.28%−14.25%−30.46%−38.24%−38.45%−38.48%−36.17%−38.36%
RKNW−1.57−1.6−0.1−0.01−0.01−0.03−0.03−0.03−32.29%−32.33%−22.32%−22.09%−22.92%−43.46%−8.44%−48.78%
RKNY10.7811.191.640.270.260.241.490.18NaNNaNNaNNaNNaNNaNNaNNaN
Total155.1133.73−9.61−4.48−4.43−7.09−78.45−8.114.80%4.00%−2.94%−9.54%−9.83%−15.92%−28.43%−21.94%
Table 4. Emissions Change due to COVID-19 in International Aviation Sector.
International Aviation Emission Change
Emission (ton/yr)Ratio (%)
CONOXSOXTSPPM10PM2.5VOCsBCCONOXSOXTSPPM10PM2.5VOCsBC
RKSI−1612.64−3335.17−265.64−27.08−25.79−30.01−276.78−26−31.89%−64.26%−60.66%−53.27%−52.83%−58.62%−65.06%−61.41%
RKSS−285.76−290.43−20.53−1.1−1.05−0.97−29.62−1.3−85.25%−85.23%−84.35%−64.88%−64.86%−64.86%−90.97%−76.29%
RKPC−253.44−257.51−16.56−1.11−1.07−1.37−20.95−0.24−89.01%−88.98%−88.10%−83.63%−83.64%−87.73%−89.37%−62.14%
RKPK−906.85−921.26−59.49−4.81−4.63−5.27−71.84−4.89−83.73%−83.75%−83.73%−79.71%−79.72%−82.96%−85.88%−85.42%
RKTN−94.69−95.46−5.56−0.43−0.42−0.79−8.65−1.06−64.61%−64.65%−65.00%−66.44%−66.47%−80.37%−70.19%−87.69%
RKTU−75.86−76.49−4.8−0.37−0.36−0.33−5−0.05−89.12%−89.12%−89.49%−89.26%−89.27%−89.28%−88.13%−62.48%
RKJB−5.33−5.52−0.64−0.07−0.06−0.09−0.59−0.04−22.03%−22.55%−36.80%−44.81%−45.11%−55.42%−29.78%−41.98%
RKJJ----------------
RKJY----------------
RKPU----------------
RKJK----------------
RKPS----------------
RKTH----------------
RKNW----------------
RKNY−12.19−12.22−0.75−0.07−0.07−0.09−0.87−0.04−75.76%−75.67%−76.58%−79.68−79.68%−85.60%−75.18%−75.37%
Total−3246.77−4994.06−373.98−35.05−33.44−38.93−414.29−33.63−46.18%−69.42%−65.75%−57.26%−56.90%−62.55%−70.67%−65.18%
Table 5. Emissions Change due to COVID-19 in Total Aviation Sector.
Total Aviation Emission Change
Emission (ton/yr)Ratio (%)
CONOXSOXTSPPM10PM2.5VOCsBCCONOXSOXTSPPM10PM2.5VOCsBC
RKSI−1642.25−3366.52−267.69−27.65−26.33−30.48−279.82−26.33−32.25%−64.40%−60.74%−53.65%−53.21%−58.86%−65.21%−61.58%
RKSS−176.45−188.14−23.95−2.72−2.66−2.83−72.56−3.24−12.60%−13.05%−17.90%−15.90%−16.20%−18.24%−51.89%−24.70%
RKPC−268.92−284.45−31.67−4.83−4.69−5.22−69.12−4.19−16.32%−16.73%−19.81%−21.74%−21.99%−25.42%−46.13%−26.18%
RKPK−849.03−864.79−54.6−4.16−4.02−5.8−64.08−6.13−57.65%−57.56%−51.17%−38.65%−38.84%−49.92%−64.00%−57.74%
RKTN−124.46−125.5−6.68−0.47−0.45−1.2−7.71−1.39−50.80%−50.55%−37.25%−224.15%−24.22%−48.00%−43.55%−58.19%
RKTU−40.04−40.69−2.26−0.26−0.26−0.49−3.08−0.55−26.51%−26.41%−16.55%−14.47%−14.71%−26.55%−26.53%−34.44%
RKJB−8.16−8.46−1.03−0.13−0.13−0.2−0.92−0.12−28.61%−29.18%−45.05%−56.42%−56.49%−68.36%−37.92%−63.59%
RKJJ−3.02−2.761.80.420.40.122.890.12−2.76%−2.48%19.80%39.04%38.84%−10.50%67.87%14.08%
RKJY4.44.691.330.310.30.181.420.2110.42%10.93%41.98%91.84%92.01%45.34%139.65%89.22%
RKPU31.9332.011.750−0.01−0.010.55−0.06127.84%124.26%56.47%−0.63%−1.41%−1.31%22.65%−15.51%
RKJK−6.42−6.52−0.4−0.04−0.04−0.03−0.12−0.04−49.12%−48.86%−33.20%−26.30%−26.59%−21.12%−15.20%−33.03%
RKPS−5.44−5.65−0.68−0.11−0.11−0.13−0.47−0.11−50.18%−50.87%−61.59%−73.27%−73.60%−78.75%−64.97%−80.61%
RKTH−0.83−0.93−0.29−0.06−0.06−0.05−0.31−0.04−13.28%−14.25%−30.46%−38.24%−38.45%−38.48%−36.17%−38.36%
RKNW−1.57−1.6−0.1−0.01−0.01−0.03−0.03−0.03−32.29%−32.33%−22.32%−22.09%−22.92%−43.46%−8.44%−48.78%
RKNY−1.41−1.030.880.20.190.150.610.15−8.78%−6.36%89.74%231.40%231.21%134.78%52.90%304.51%
Total−3091.66−4860.33−383.59−39.53−37.88−46.02−492.75−41.74−30.12%−46.13%−42.86%−36.54%−36.46%−43.11%−57.15%−47.13%
Table 6. Air Control Zones and its Corresponding Airports.
Capital AreaCentral RegionSoutheast RegionSouthern Region
RKSS
RKSI
RKTU
RKJK
RKPK
RKTN
RKPS
RKPU
RKTH
RKJJ
RKJY
Table 7. Emission Reduction due to COVID-19 and Non-road Emission Reduction Target in Air Control Zones.
PM10PM2.5NOXSOXVOCs
Reduction (ton)Non-Road Target (ton)RateReduction (ton)Non-Road Target (ton)RateReduction (ton)Non-Road Target (ton)RateReduction (ton)Non-Road Target (ton)RateReduction (ton)Non-Road Target (ton)Rate
Capital29.011425.4%33.310432.0%3554.71300273.4%291.6224413.0%352.4319110.5%
Central0.3340.9%0.5331.6%47.2%40311.7%2.714420.2%3.2973.3%
South-East4.7935.0%7.2858.5%964.9138669.6%60.578300.8%72.015945.3%
Southern−0.716−4.4%−0.315−2.0%−1.9237−0.8%−3.13219−0.1%−4.331−13.9%
Publisher’s Note: MDPI stays neutral with regard to jurisdictional claims in published maps and institutional affiliations.

