Impact of Aviation Emissions and its Changes Due to the COVID-19 Pandemic on Air Quality in South Korea
Abstract
1. Introduction
2. Materials and Methods
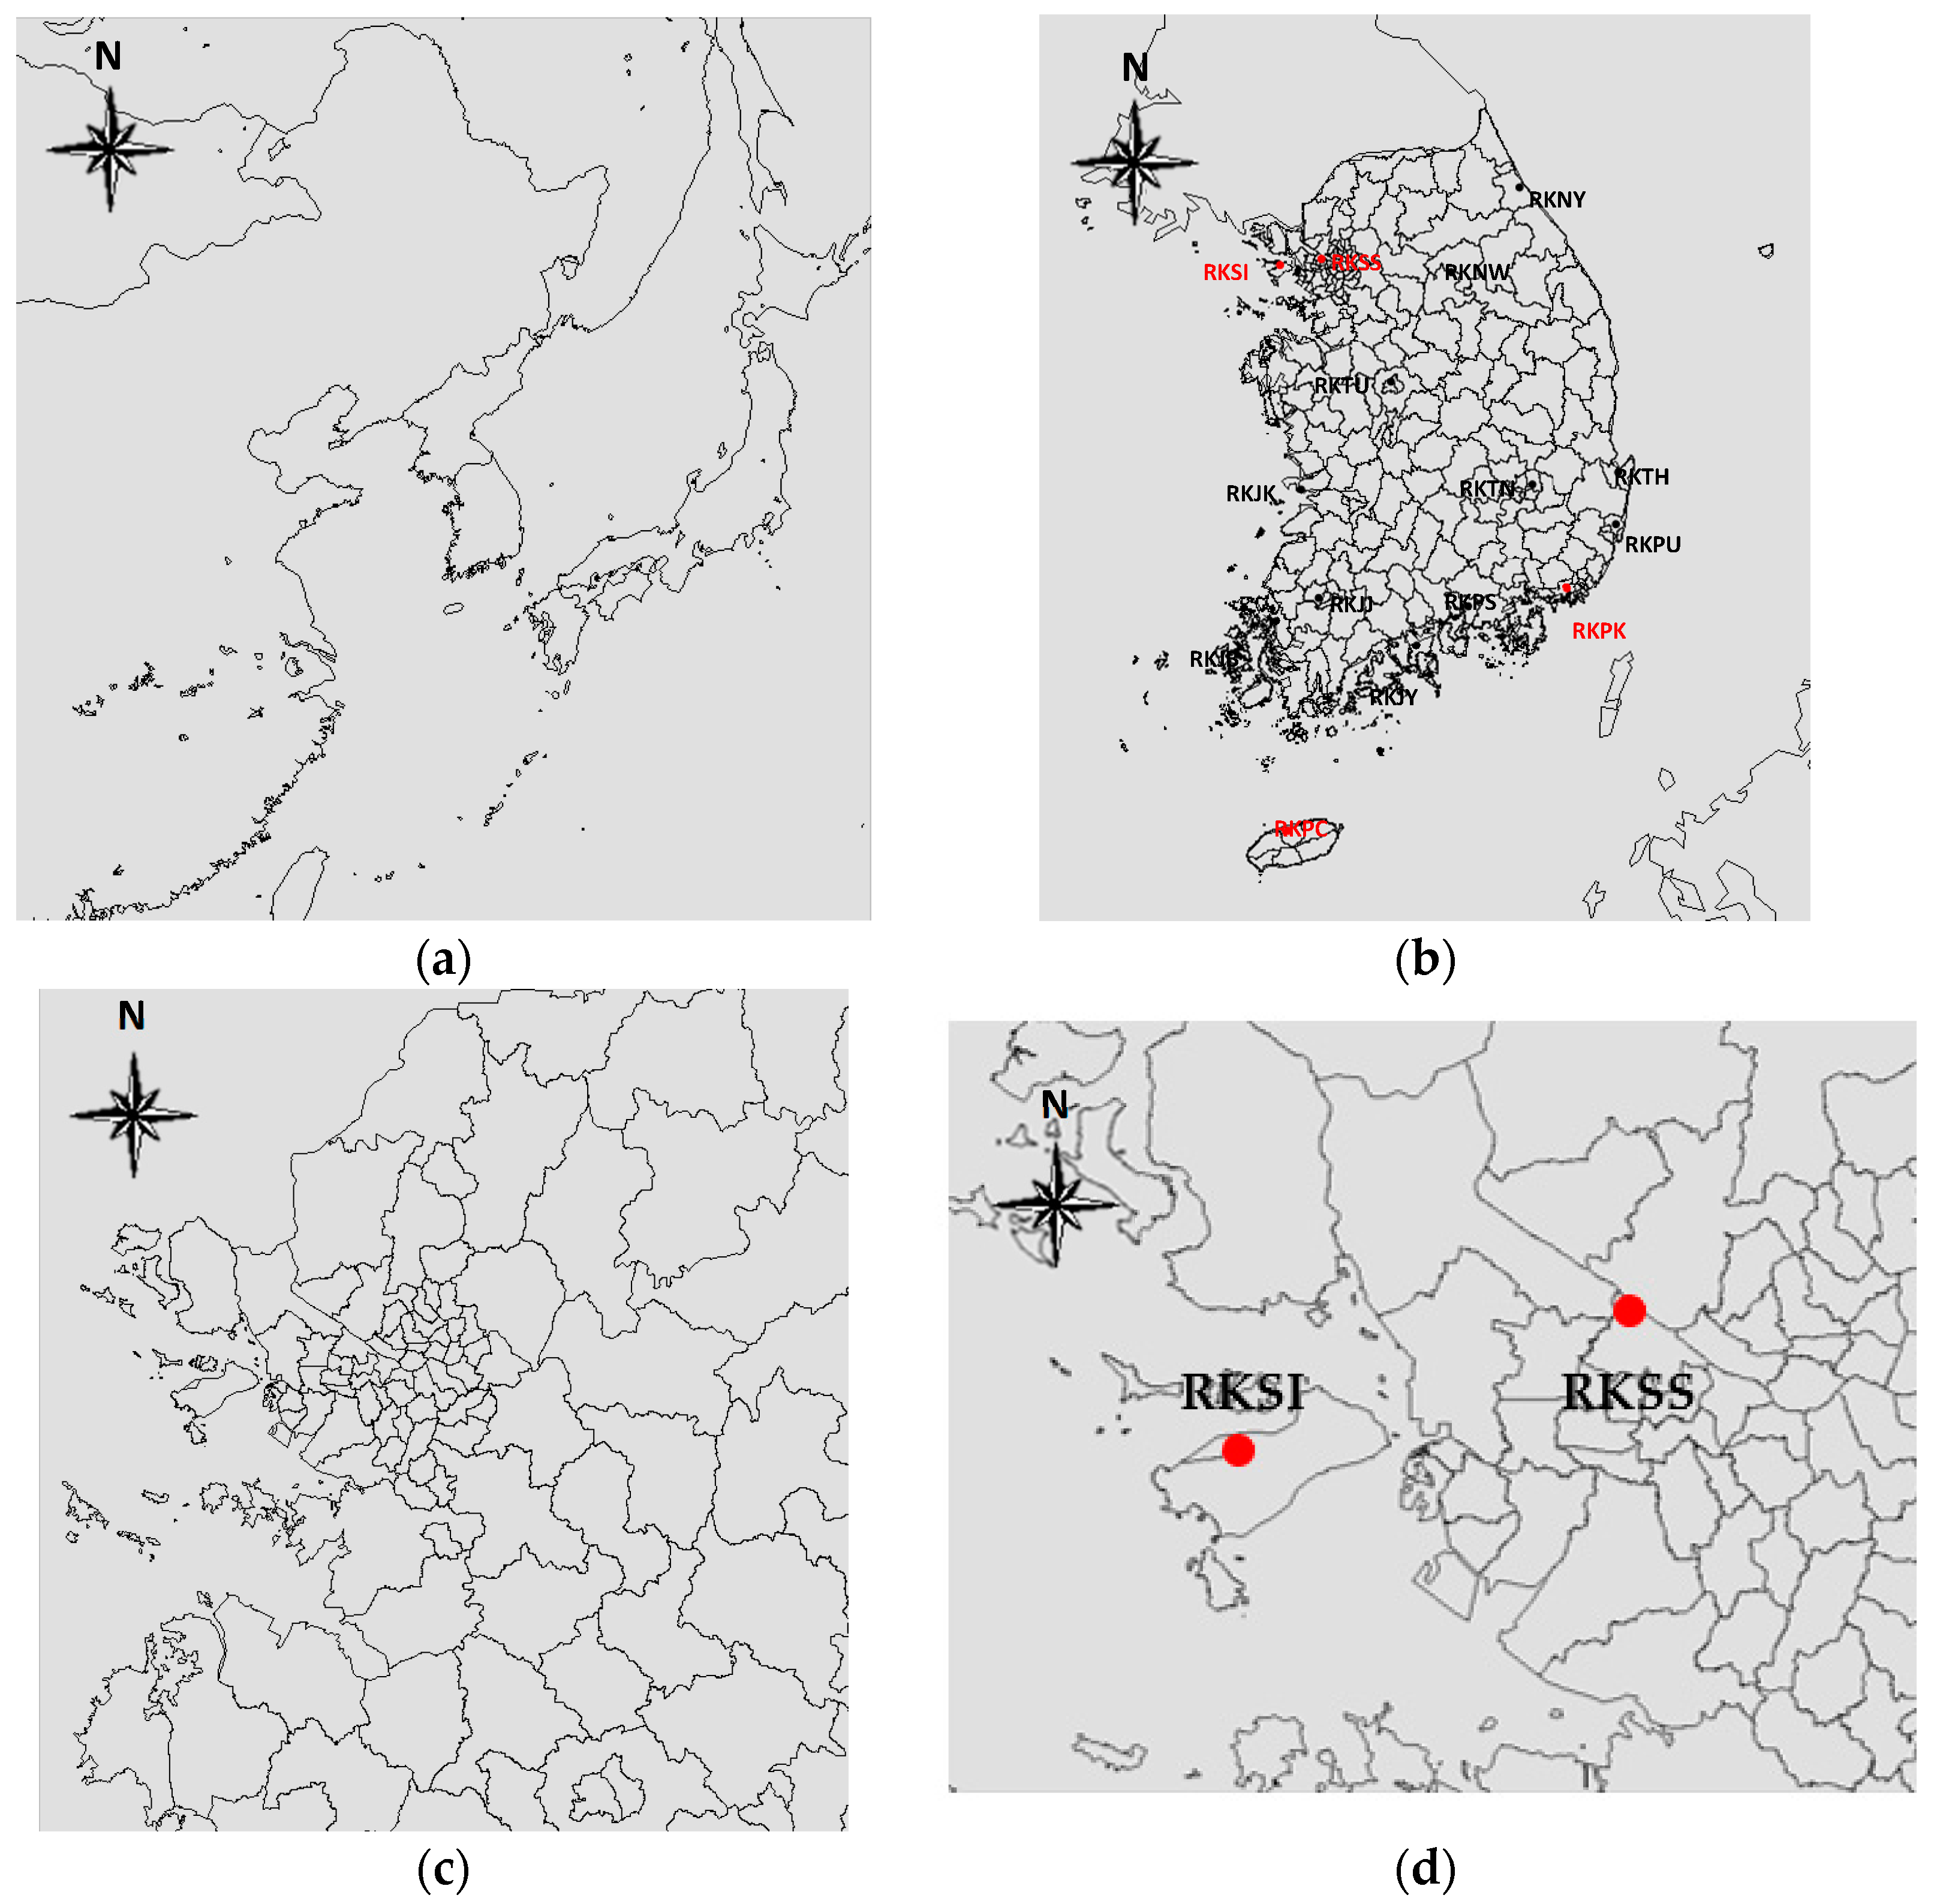
2.1. Study Domain, Study Period and Scenarios
2.2. Emissions Calculation
3. Results and Discussion
3.1. Model Evaluation
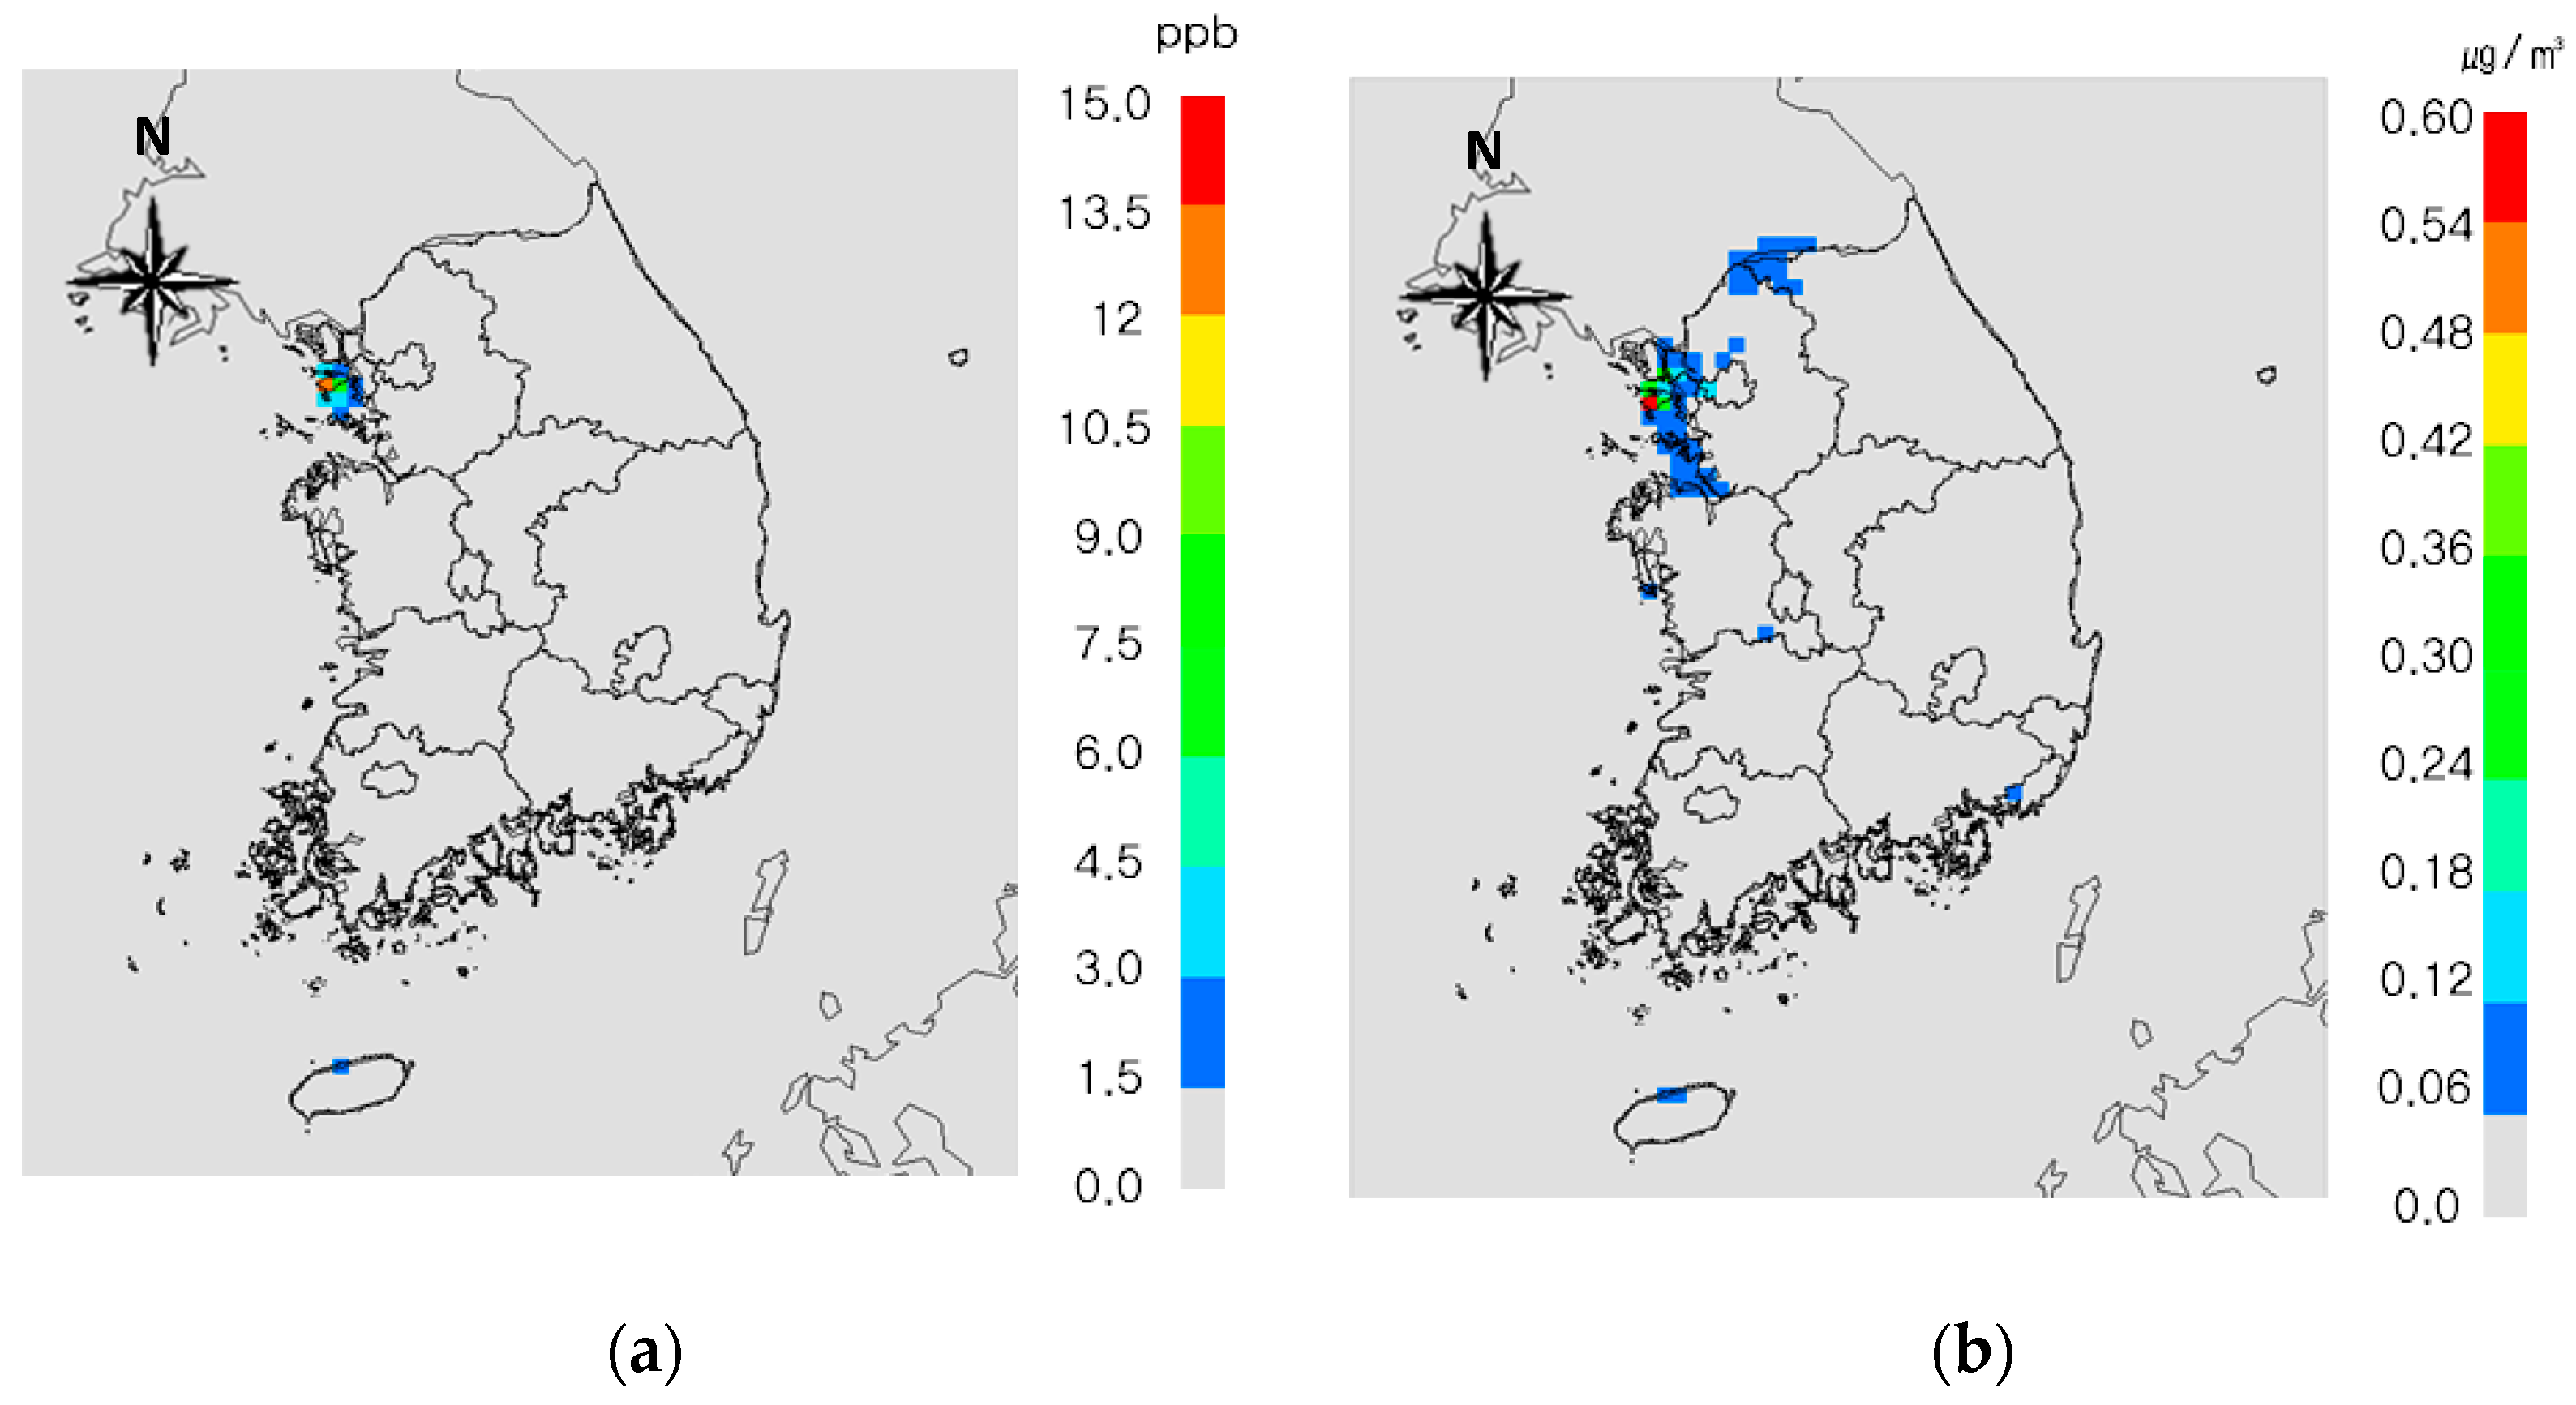
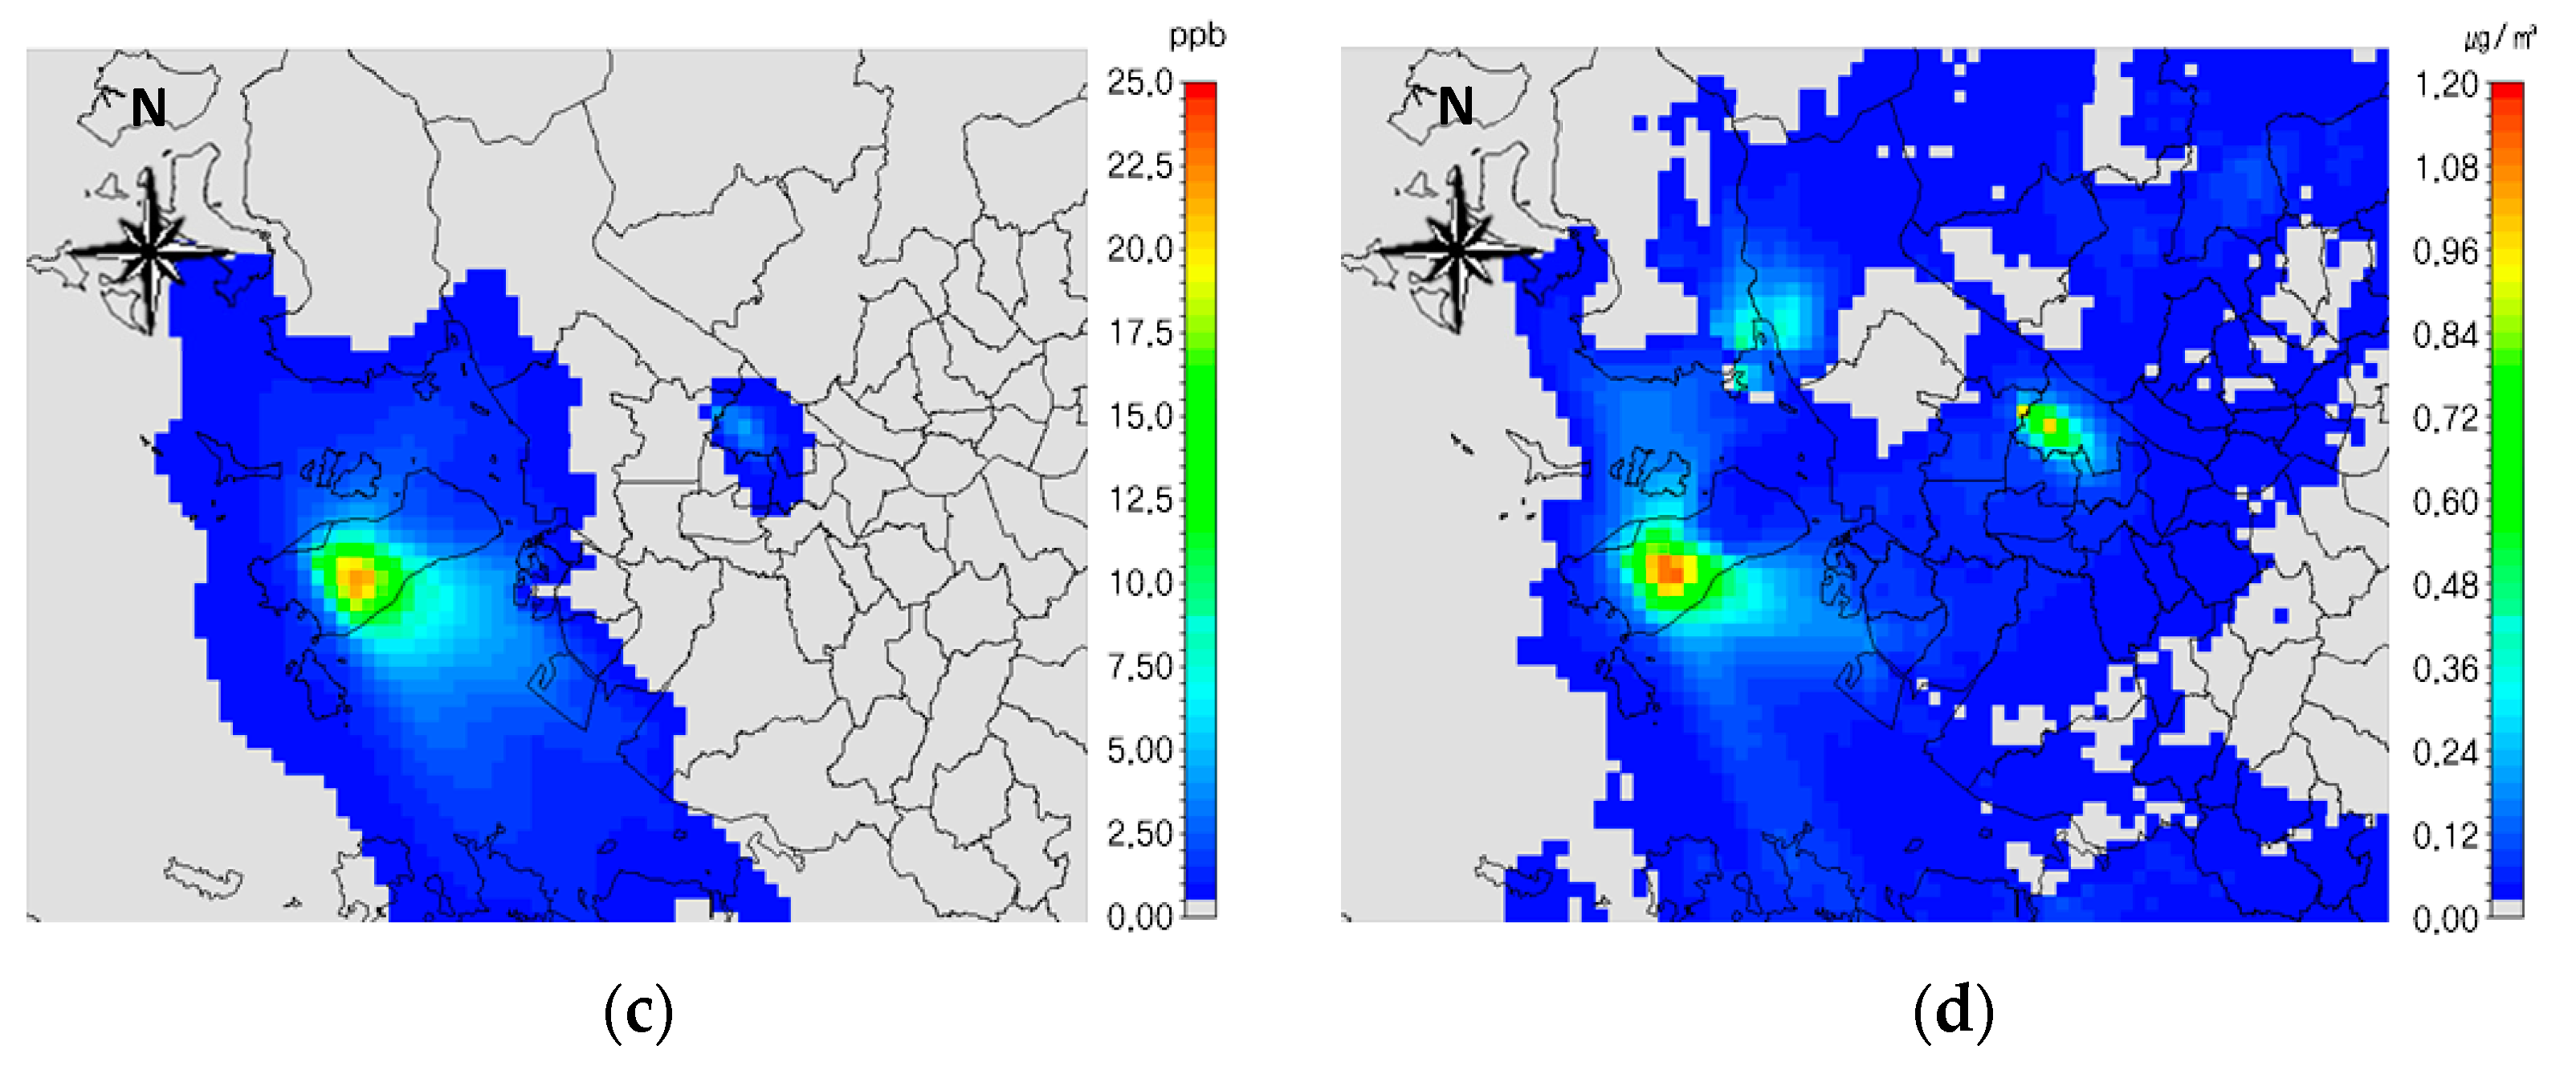
3.2. Impact of Aviation on Air Quality
3.3. Impact of COVID-19 on Aviation Emission and Air Quality
3.3.1. Emissions Reduction
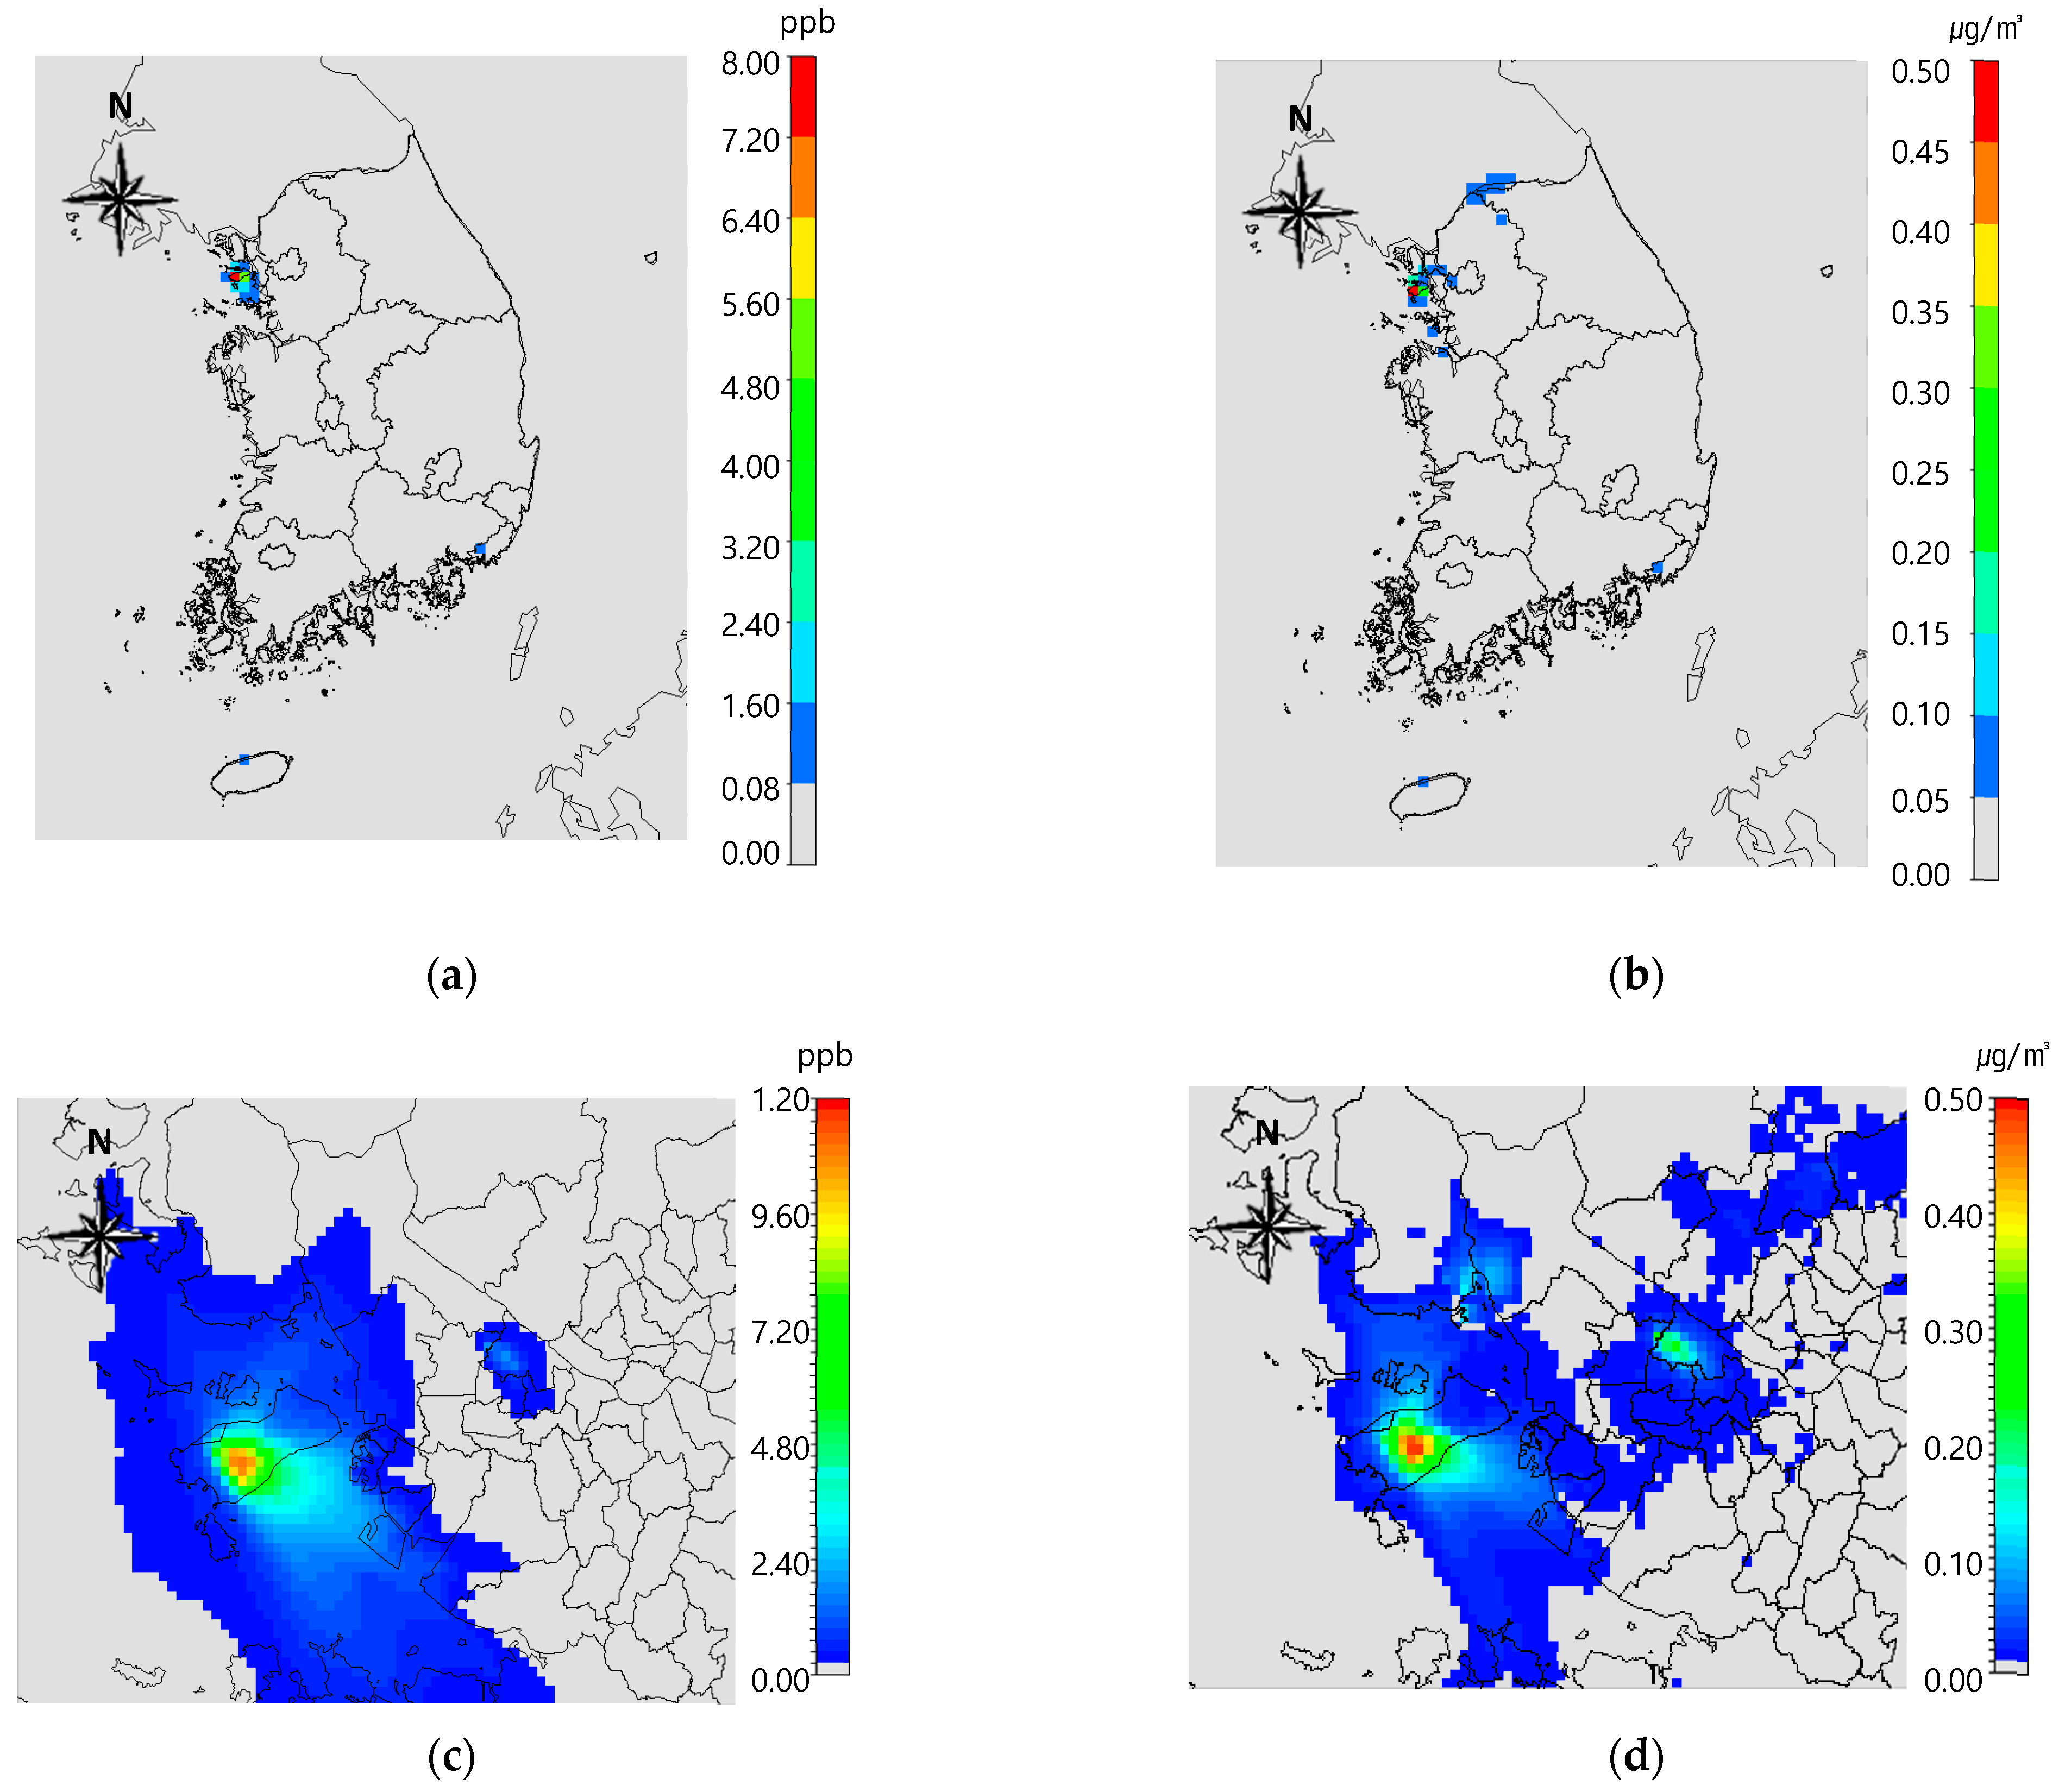
3.3.2. Changes in Air Pollutant Concentrations
4. Conclusions
Supplementary Materials
Author Contributions
Funding
Institutional Review Board Statement
Informed Consent Statement
Data Availability Statement
Conflicts of Interest
References
- ICAO. Airport Air Quality Manual.; ICAO: Montreal, QC, Canada, 2016; p. 33.
- KAC. Available online: https://airport.co.kr/www/cms/frCon/index.do?MENU_ID=1250 (accessed on 8 August 2022).
- Hudda, N.; Durant, L.; Fruin, S.; Durant, J. Impact of Aviation Emissions on Near-Airport Residential Air Quality. Environ. Sci. Technol. 2020, 54, 8580–8588. [Google Scholar] [CrossRef] [PubMed]
- Carslaw, D.; Beevers, S.; Ropkins, K.; Bell, M. Detecting and quantifying the contribution made by aircraft emissions to ambient concentrations of nitrogen oxides in the vicinity of a large international airport. Atmos. Environ. 2006, 40, 5424–5434. [Google Scholar] [CrossRef]
- Li, J.; Yang, H.; Liu, X.; Yu, N.; Tian, Y.; Zhou, X.; Zhang, P.; Wang, K. Aircraft Emission Inventory and Characteristics of the Airport Cluster in the Guangdong-Hong Kong-Macao Greater Bay Area, China. Atmosphere 2020, 11, 323. [Google Scholar] [CrossRef]
- Ratliff, G.; Sequeira, C.; Waitz, I. Aircraft Impacts on Local and Regional Air Quality in the United States. In Partnership for AiR Transportation Noise and Emissions Reduction; Massachusetts Institute of Technology: Cambridge, MA, USA, 2009; pp. 11–12. [Google Scholar]
- Arter, C.; Arunachalam, S. Assessing the importance of nonlinearity for aircraft emissions’ impact on O3 and PM2.5. Sci. Total Environ. 2021, 777, 146121. [Google Scholar] [CrossRef]
- Bo, X.; Xue, X.; Xu, J.; Du, X.; Zhou, B.; Tang, L. Aviation’s emissions and contribution to the air quality in China. Atmos. Environ. 2019, 201, 121–131. [Google Scholar] [CrossRef]
- Yang, X.; Cheng, S.; Lang, J.; XU, R.; Lv, Z. Characterization of aircraft emissions and air quality impacts of an international airport. J. Environ. Sci. 2018, 72, 198–207. [Google Scholar] [CrossRef]
- Arunachalam, S.; Wang, B.; Davis, N.; Baek, B.H.; Levy, J.I. Effect of chemistry-transport model scale and resolution on population exposure to PM2.5 from aircraft emissions during landing and takeoff. Atmos. Environ. 2011, 45, 3294–3300. [Google Scholar] [CrossRef]
- Woody, M.c.; West, J.J.; Jathar, S.H.; Robinson, A.L.; Arunachalam, S. Estimates of non-traditional secondary organic aerosols from aircraft SVOC and IVOC emissions using CMAQ. Atmos. Chem. Phys. 2015, 15, 6929–6942. [Google Scholar] [CrossRef]
- Grobler, C.; Wolfe, P.; Dasadhikari, K.; Dedoussi, I.; Allroggen, F.; Speth, R.; Eastham, S.; Agarwal, A.; Staples, M.; Sabnis, J.; et al. Marginal climate and air quality costs of aviation emissions. Environ. Res. Lett. 2019, 14, 114031. [Google Scholar] [CrossRef]
- Vennam, L.; Vizuete, W.; Talgo, K.; Omar, M.; Binkowski, F.S.; Xing, J.; Mathur, R.; Arunachalam, S. Modeled full-flight aircraft emissions impacts on air quality and their sensitivity to grid resolution. J. Geophys. Res. 2017, 122, 13472–13494. [Google Scholar] [CrossRef]
- Yim, S.; Lee, G.; Lee, I.; Allroggen, F.; Ashok, A.; Caiazzo, F.; Eastham, S.; Malina, R.; Barett, S. Global, regional and local health impacts of civil aviation emissions. Environ. Res. Lett. 2015, 10, 034001. [Google Scholar] [CrossRef]
- Jonsdottir, H.; Delaval, M.; Leni, Z.; Keller, A.; Brem, B.T.; Siegerist, F.; Schönenberger, D.; Durdina, L.L.; Elser, M.; Burtshcer, H.; et al. Non-volatile particle emissions from aircraft turbine engines at ground-idle induce oxidative stress in bronchial cells. Commun. Biol. 2019, 2, 90. [Google Scholar] [CrossRef] [PubMed]
- Song, S.; Shon, Z. Emissions of greenhouse gases and air pollutants from commercial aircraft at international airports in Korea. Atmos. Environ. 2012, 61, 148–158. [Google Scholar] [CrossRef]
- Lee, J.; Kim, W.; Kim, Y.; Choi, S. A study on the approach to reduce in the aviation GHG emissions in Korea. J. Korean Soc. Aviat. Aeronaut. 2016, 24, 47–54. [Google Scholar] [CrossRef][Green Version]
- Song, S.; Shon, Z.; Kang, Y. Comparison of impacts of aircraft emissions within the boundary layer on the regional ozone in South Korea. Atmos. Environ. 2015, 117, 169–179. [Google Scholar] [CrossRef]
- Cucinotta, D.; Vanelli, M. WHO declares COVID-19 a pandemic. Acta Biomed. 2020, 91, 157–160. [Google Scholar] [CrossRef] [PubMed]
- Venter, Z.; Aunan, K.; Chowdhury, S.; Lelieveld, J. COVID-19 lockdowns cause global air pollution declines. Proc. Natl. Acad. Sci. USA 2020, 117, 18984–18990. [Google Scholar] [CrossRef] [PubMed]
- He, G.; Pan, Y.; Tanaka, T. The short-term impacts of COVID-19 lockdown on urban air pollution in China. Nat. Sustain. 2020, 3, 1005–1011. [Google Scholar] [CrossRef]
- Amouei Torkmahalleh, M.; Akhmetvaliyeva, Z.; Omran, A.; Omran, F.; Kazemitabar, M.; Naseri, M.; Naseri, M.; Sharifi, H.; Malekipirbazari, M.; Adotey, E.; et al. Global air quality and COVID-19 pandemic:do we breathe cleaner air? Aerosol Air Qual. Res. 2021, 21, 200567. [Google Scholar] [CrossRef]
- Han, B.; Park, K.; Kwa, K.-H.; Park, S.-B.; Jin, H.-B.; Moon, S.; Kim, J.-W.; Baik, J.-J. Air quality change in Seoul, South Korea under COVID-19 social distancing: Focusing on PM2.5. Int. J. Environ. Res. 2020, 17, 6208. [Google Scholar] [CrossRef]
- Ju, M.; Oh, J.; Schoi, Y.-H. Changes in air pollution levels after COVID-19 outbreak in Korea. Sci. Total Environ. 2021, 750, 141251. [Google Scholar] [CrossRef] [PubMed]
- Seo, J.; Kim, J.; Yang, J.; Yun, H.; Roh, M.; Kim, J.; Yu, S.; Jeong, N.; Jeon, H.; Choi, J.; et al. Changes in air quality during the COVID-19 pandemic and associated health benefits in Korea. Appl. Sci. 2020, 10, 8720. [Google Scholar] [CrossRef]
- Koo, J.; Kim, J.; Lee, Y.; Park, S.; Lee, S.; Chong, H.; Cho, Y.; Kim, J.; Hoi, K.; Lee, T. The implication of the air quality pattern in South Korea after the COVID-19 outbreak. Sci. Rep. 2020, 10, 22462. [Google Scholar] [CrossRef] [PubMed]
- ICAO, Effects of Novel Coronavirus (COVID-19) on Civil Aviation: Economic Impact Analysis. Available online: https://www.icao.int/sustainability/Pages/Economic-Impacts-of-COVID-19.aspx (accessed on 8 August 2022).
- IATA, COVID-19 has been an unprecedented shock. Available online: Https://iata.org/en/iata-repository/publications/economic-reports/covid-19-has-been-an-unprecedented-shock/ (accessed on 8 August 2022.).
- Weather Research and Forecasting Model┃MMM: Mesoscale & Microscale Meteorology Laboratory. Available online: https://www.mmm.ucar.edu/weather-research-and-forecasting-model (accessed on 8 August 2022).
- UNC (University of North Carolina at Chaper Hill). SMOKE v3.5.1 User’s Manual; UNC (University of North Carolina at Chaper Hill): Chaper Hill, NC, USA, 2013; p. 5. [Google Scholar]
- NIER. Air Quality Modeling Guideline for National Atmospheric Policy Establishment and Evaluation; NIER: Incheon, Korea, 2013; pp. 9–14.
- NIER. Atmospheric Environment Yearbook 2017; NIER: Incheon, Korea, 2018; p. 219.
- National Air Emission Inventory and Research center. National Air Pollutant Emission Calculation Method Manual; National Air Emission Inventory and Research Center: Osong, Korea, 2020; pp. 189–207.
- Airkorea. Available online: https://airkorea.or.kr/web (accessed on 8 August 2022).
- Carslaw, D. The Openair Manual Open-Source Tools for Analyzing Air Pollution Data; University of York and Ricardo Energy & Environment: Oxford, UK, 2019; pp. 165–170. [Google Scholar]
- Ministry of Environment. Basic Plan for Atmospheric Environment Management in the Central Region [2020–2024]; Ministry of Environment: Sejong, Korea, 2020.
- Ministry of Environment. Basic Plan for Atmospheric Environment Management in the Southeast Region [2020–2024]; Ministry of Environment: Sejong, Korea, 2020.
- Ministry of Environment. Basic Plan for Atmospheric Environment Management in the Southern Region [2020–2024]; Ministry of Environment: Sejong, Korea, 2020.
- Ministry of Environment. Basic Plan for Atmospheric Environment Management in the Capital Region [2020–2024]; Ministry of Environment: Sejong, Korea, 2020.
- Beaverstock, J.V.; Derudder, B.; Faulconbridge, J.; Witlox, F. Inernational buissness travel: Some expectations. Geogr. Ann. B Hum. Geogr. 2009, 91, 193–202. [Google Scholar] [CrossRef]
- Hernandez, M.; Xu, S.; Toh, L.; Attwood, A. Buisness air travel and climate: Changing behaviors before, during, and beyond the COVID-19 pandemic. Available online: https://doi.org/10.46830/wriwp.20.00148 (accessed on 8 August 2022).
- Ministry of Land, Infrastructure and Transport. 6th Comprehensive Plan for Airport Development (2021–2025); Ministry of Land, Infrastructure and Transport: Sejong, Korea, 2020.


| Non-Aviation Emissions | Aviation Emissions | |
|---|---|---|
| Base | 2017 CAPSS | 2017 CAPSS |
| noAVI | 2017 CAPSS | - |
| BAU | 2017 CAPSS | 2020 Predicted Data |
| COVID | 2017 CAPSS | 2020 Calculated Data |
| n | FAC2 | MB | MAE | NMB | NME | RMSE | R | IOA | |
|---|---|---|---|---|---|---|---|---|---|
| NO2 | 31 | 0.68 | −0.01 ppm | 0.01 ppm | −0.30 | 0.32 | 0.01 ppm | 0.86 | 0.49 |
| PM2.5 | 31 | 0.52 | −7.33 μg/m3 | 16.59 μg/m3 | −0.22 | 0.50 | 20.43 μg/m3 | 0.55 | 0.18 |
| Domestic Aviation Emission Change | ||||||||||||||||
|---|---|---|---|---|---|---|---|---|---|---|---|---|---|---|---|---|
| Emission (ton/yr) | Ratio (%) | |||||||||||||||
| CO | NOX | SOX | TSP | PM10 | PM2.5 | VOCs | BC | CO | NOX | SOX | TSP | PM10 | PM2.5 | VOCs | BC | |
| RKSI | −29.61 | −31.35 | −2.05 | −0.57 | −0.54 | −0.47 | −3.04 | −0.34 | −82.57% | −82.61% | −73.04% | −81.31% | −81.33% | −80.35% | −83.55% | −79.23% |
| RKSS | 109.31 | 102.3 | −3.42 | −1.62 | −1.61 | −1.86 | −42.95 | −1.9 | 10.27% | 9.29% | −3.12% | −10.53% | −10.87% | −13.27% | −40.02% | −16.88% |
| RKPC | −15.48 | −26.94 | −15.1 | −3.72 | −3.63 | −3.85 | −48.17 | −3.95 | 1.14% | −1.91% | −10.71% | −17.81% | −18.07% | −20.28% | −38.11% | −25.28% |
| RKPK | 57.82 | 56.46 | 4.89 | 0.65 | 0.61 | −0.53 | 7.76 | −1.24 | 14.84% | 14.03% | 13.71% | 13.83% | 13.44% | −10.01% | 47.12% | −25.32% |
| RKTN | −29.77 | −30.05 | −1.12 | −0.03 | −0.03 | −0.4 | 0.94 | −0.33 | −30.25% | −29.85% | −11.91% | −2.63% | −2.68% | −26.80% | 17.37% | −27.78% |
| RKTU | 35.83 | 35.8 | 2.54 | 0.1 | 0.1 | −0.16 | 1.92 | −0.5 | 54.36% | 52.48% | 30.54% | 8.08% | 7.80% | −10.88% | 32.43% | −32.94% |
| RKJB | −2.83 | −2.93 | −0.4 | −0.07 | −0.07 | −0.11 | −0.33 | −0.08 | −65.28% | −65.46% | −70.59% | −75.33% | −75.20% | −84.61% | −74.57% | −84.54% |
| RKJJ | −3.02 | −2.76 | 1.8 | 0.42 | 0.4 | 0.12 | 2.89 | 0.12 | −2.76% | −2.48% | 19.80% | 39.04% | 38.84% | 10.50% | 67.87% | 14.08% |
| RKJY | 4.4 | 4.69 | 1.33 | 0.31 | 0.3 | 0.18 | 1.42 | 0.21 | 10.42% | 10.93% | 41.98% | 91.84% | 92.07% | 45.34% | 139.65% | 89.22% |
| RKPU | 31.93 | 32.01 | 1.75 | 0 | −0.01 | −0.01 | 0.55 | −0.06 | 127.84% | 124.26% | 56.47% | −0.63% | −1.41% | −1.31% | 22.65% | −15.51% |
| RKJK | −6.42 | −6.52 | −0.4 | −0.04 | −0.04 | −0.03 | −0.12 | −0.04 | −49.12% | −48.86% | −33.20% | −26.30% | −26.59% | −21.12% | −15.20% | −33.03% |
| RKPS | −5.44 | −5.65 | −0.68 | −0.11 | −0.11 | −0.13 | −0.47 | −0.11 | −50.18% | −50.87% | −61.59% | −73.27% | −73.60% | −78.75% | −64.97% | −80.61% |
| RKTH | −0.83 | −0.93 | −0.29 | −0.06 | −0.06 | −0.05 | −0.31 | −0.04 | −13.28% | −14.25% | −30.46% | −38.24% | −38.45% | −38.48% | −36.17% | −38.36% |
| RKNW | −1.57 | −1.6 | −0.1 | −0.01 | −0.01 | −0.03 | −0.03 | −0.03 | −32.29% | −32.33% | −22.32% | −22.09% | −22.92% | −43.46% | −8.44% | −48.78% |
| RKNY | 10.78 | 11.19 | 1.64 | 0.27 | 0.26 | 0.24 | 1.49 | 0.18 | NaN | NaN | NaN | NaN | NaN | NaN | NaN | NaN |
| Total | 155.1 | 133.73 | −9.61 | −4.48 | −4.43 | −7.09 | −78.45 | −8.11 | 4.80% | 4.00% | −2.94% | −9.54% | −9.83% | −15.92% | −28.43% | −21.94% |
| International Aviation Emission Change | ||||||||||||||||
|---|---|---|---|---|---|---|---|---|---|---|---|---|---|---|---|---|
| Emission (ton/yr) | Ratio (%) | |||||||||||||||
| CO | NOX | SOX | TSP | PM10 | PM2.5 | VOCs | BC | CO | NOX | SOX | TSP | PM10 | PM2.5 | VOCs | BC | |
| RKSI | −1612.64 | −3335.17 | −265.64 | −27.08 | −25.79 | −30.01 | −276.78 | −26 | −31.89% | −64.26% | −60.66% | −53.27% | −52.83% | −58.62% | −65.06% | −61.41% |
| RKSS | −285.76 | −290.43 | −20.53 | −1.1 | −1.05 | −0.97 | −29.62 | −1.3 | −85.25% | −85.23% | −84.35% | −64.88% | −64.86% | −64.86% | −90.97% | −76.29% |
| RKPC | −253.44 | −257.51 | −16.56 | −1.11 | −1.07 | −1.37 | −20.95 | −0.24 | −89.01% | −88.98% | −88.10% | −83.63% | −83.64% | −87.73% | −89.37% | −62.14% |
| RKPK | −906.85 | −921.26 | −59.49 | −4.81 | −4.63 | −5.27 | −71.84 | −4.89 | −83.73% | −83.75% | −83.73% | −79.71% | −79.72% | −82.96% | −85.88% | −85.42% |
| RKTN | −94.69 | −95.46 | −5.56 | −0.43 | −0.42 | −0.79 | −8.65 | −1.06 | −64.61% | −64.65% | −65.00% | −66.44% | −66.47% | −80.37% | −70.19% | −87.69% |
| RKTU | −75.86 | −76.49 | −4.8 | −0.37 | −0.36 | −0.33 | −5 | −0.05 | −89.12% | −89.12% | −89.49% | −89.26% | −89.27% | −89.28% | −88.13% | −62.48% |
| RKJB | −5.33 | −5.52 | −0.64 | −0.07 | −0.06 | −0.09 | −0.59 | −0.04 | −22.03% | −22.55% | −36.80% | −44.81% | −45.11% | −55.42% | −29.78% | −41.98% |
| RKJJ | - | - | - | - | - | - | - | - | - | - | - | - | - | - | - | - |
| RKJY | - | - | - | - | - | - | - | - | - | - | - | - | - | - | - | - |
| RKPU | - | - | - | - | - | - | - | - | - | - | - | - | - | - | - | - |
| RKJK | - | - | - | - | - | - | - | - | - | - | - | - | - | - | - | - |
| RKPS | - | - | - | - | - | - | - | - | - | - | - | - | - | - | - | - |
| RKTH | - | - | - | - | - | - | - | - | - | - | - | - | - | - | - | - |
| RKNW | - | - | - | - | - | - | - | - | - | - | - | - | - | - | - | - |
| RKNY | −12.19 | −12.22 | −0.75 | −0.07 | −0.07 | −0.09 | −0.87 | −0.04 | −75.76% | −75.67% | −76.58% | −79.68 | −79.68% | −85.60% | −75.18% | −75.37% |
| Total | −3246.77 | −4994.06 | −373.98 | −35.05 | −33.44 | −38.93 | −414.29 | −33.63 | −46.18% | −69.42% | −65.75% | −57.26% | −56.90% | −62.55% | −70.67% | −65.18% |
| Total Aviation Emission Change | ||||||||||||||||
|---|---|---|---|---|---|---|---|---|---|---|---|---|---|---|---|---|
| Emission (ton/yr) | Ratio (%) | |||||||||||||||
| CO | NOX | SOX | TSP | PM10 | PM2.5 | VOCs | BC | CO | NOX | SOX | TSP | PM10 | PM2.5 | VOCs | BC | |
| RKSI | −1642.25 | −3366.52 | −267.69 | −27.65 | −26.33 | −30.48 | −279.82 | −26.33 | −32.25% | −64.40% | −60.74% | −53.65% | −53.21% | −58.86% | −65.21% | −61.58% |
| RKSS | −176.45 | −188.14 | −23.95 | −2.72 | −2.66 | −2.83 | −72.56 | −3.24 | −12.60% | −13.05% | −17.90% | −15.90% | −16.20% | −18.24% | −51.89% | −24.70% |
| RKPC | −268.92 | −284.45 | −31.67 | −4.83 | −4.69 | −5.22 | −69.12 | −4.19 | −16.32% | −16.73% | −19.81% | −21.74% | −21.99% | −25.42% | −46.13% | −26.18% |
| RKPK | −849.03 | −864.79 | −54.6 | −4.16 | −4.02 | −5.8 | −64.08 | −6.13 | −57.65% | −57.56% | −51.17% | −38.65% | −38.84% | −49.92% | −64.00% | −57.74% |
| RKTN | −124.46 | −125.5 | −6.68 | −0.47 | −0.45 | −1.2 | −7.71 | −1.39 | −50.80% | −50.55% | −37.25% | −224.15% | −24.22% | −48.00% | −43.55% | −58.19% |
| RKTU | −40.04 | −40.69 | −2.26 | −0.26 | −0.26 | −0.49 | −3.08 | −0.55 | −26.51% | −26.41% | −16.55% | −14.47% | −14.71% | −26.55% | −26.53% | −34.44% |
| RKJB | −8.16 | −8.46 | −1.03 | −0.13 | −0.13 | −0.2 | −0.92 | −0.12 | −28.61% | −29.18% | −45.05% | −56.42% | −56.49% | −68.36% | −37.92% | −63.59% |
| RKJJ | −3.02 | −2.76 | 1.8 | 0.42 | 0.4 | 0.12 | 2.89 | 0.12 | −2.76% | −2.48% | 19.80% | 39.04% | 38.84% | −10.50% | 67.87% | 14.08% |
| RKJY | 4.4 | 4.69 | 1.33 | 0.31 | 0.3 | 0.18 | 1.42 | 0.21 | 10.42% | 10.93% | 41.98% | 91.84% | 92.01% | 45.34% | 139.65% | 89.22% |
| RKPU | 31.93 | 32.01 | 1.75 | 0 | −0.01 | −0.01 | 0.55 | −0.06 | 127.84% | 124.26% | 56.47% | −0.63% | −1.41% | −1.31% | 22.65% | −15.51% |
| RKJK | −6.42 | −6.52 | −0.4 | −0.04 | −0.04 | −0.03 | −0.12 | −0.04 | −49.12% | −48.86% | −33.20% | −26.30% | −26.59% | −21.12% | −15.20% | −33.03% |
| RKPS | −5.44 | −5.65 | −0.68 | −0.11 | −0.11 | −0.13 | −0.47 | −0.11 | −50.18% | −50.87% | −61.59% | −73.27% | −73.60% | −78.75% | −64.97% | −80.61% |
| RKTH | −0.83 | −0.93 | −0.29 | −0.06 | −0.06 | −0.05 | −0.31 | −0.04 | −13.28% | −14.25% | −30.46% | −38.24% | −38.45% | −38.48% | −36.17% | −38.36% |
| RKNW | −1.57 | −1.6 | −0.1 | −0.01 | −0.01 | −0.03 | −0.03 | −0.03 | −32.29% | −32.33% | −22.32% | −22.09% | −22.92% | −43.46% | −8.44% | −48.78% |
| RKNY | −1.41 | −1.03 | 0.88 | 0.2 | 0.19 | 0.15 | 0.61 | 0.15 | −8.78% | −6.36% | 89.74% | 231.40% | 231.21% | 134.78% | 52.90% | 304.51% |
| Total | −3091.66 | −4860.33 | −383.59 | −39.53 | −37.88 | −46.02 | −492.75 | −41.74 | −30.12% | −46.13% | −42.86% | −36.54% | −36.46% | −43.11% | −57.15% | −47.13% |
| Capital Area | Central Region | Southeast Region | Southern Region |
|---|---|---|---|
| RKSS RKSI | RKTU RKJK | RKPK RKTN RKPS RKPU RKTH | RKJJ RKJY |
| PM10 | PM2.5 | NOX | SOX | VOCs | |||||||||||
|---|---|---|---|---|---|---|---|---|---|---|---|---|---|---|---|
| Reduction (ton) | Non-Road Target (ton) | Rate | Reduction (ton) | Non-Road Target (ton) | Rate | Reduction (ton) | Non-Road Target (ton) | Rate | Reduction (ton) | Non-Road Target (ton) | Rate | Reduction (ton) | Non-Road Target (ton) | Rate | |
| Capital | 29.0 | 114 | 25.4% | 33.3 | 104 | 32.0% | 3554.7 | 1300 | 273.4% | 291.6 | 2244 | 13.0% | 352.4 | 319 | 110.5% |
| Central | 0.3 | 34 | 0.9% | 0.5 | 33 | 1.6% | 47.2% | 403 | 11.7% | 2.7 | 1442 | 0.2% | 3.2 | 97 | 3.3% |
| South-East | 4.7 | 93 | 5.0% | 7.2 | 85 | 8.5% | 964.9 | 1386 | 69.6% | 60.5 | 7830 | 0.8% | 72.0 | 159 | 45.3% |
| Southern | −0.7 | 16 | −4.4% | −0.3 | 15 | −2.0% | −1.9 | 237 | −0.8% | −3.1 | 3219 | −0.1% | −4.3 | 31 | −13.9% |
Publisher’s Note: MDPI stays neutral with regard to jurisdictional claims in published maps and institutional affiliations. |
© 2022 by the authors. Licensee MDPI, Basel, Switzerland. This article is an open access article distributed under the terms and conditions of the Creative Commons Attribution (CC BY) license (https://creativecommons.org/licenses/by/4.0/).
Share and Cite
Chung, Y.; Sunwoo, Y. Impact of Aviation Emissions and its Changes Due to the COVID-19 Pandemic on Air Quality in South Korea. Atmosphere 2022, 13, 1553. https://doi.org/10.3390/atmos13101553
Chung Y, Sunwoo Y. Impact of Aviation Emissions and its Changes Due to the COVID-19 Pandemic on Air Quality in South Korea. Atmosphere. 2022; 13(10):1553. https://doi.org/10.3390/atmos13101553
Chicago/Turabian StyleChung, Yoonbae, and Young Sunwoo. 2022. "Impact of Aviation Emissions and its Changes Due to the COVID-19 Pandemic on Air Quality in South Korea" Atmosphere 13, no. 10: 1553. https://doi.org/10.3390/atmos13101553
APA StyleChung, Y., & Sunwoo, Y. (2022). Impact of Aviation Emissions and its Changes Due to the COVID-19 Pandemic on Air Quality in South Korea. Atmosphere, 13(10), 1553. https://doi.org/10.3390/atmos13101553


