Article

The Carbon Emission Reduction Effect of Technological Innovation on the Transportation Industry and Its Spatial Heterogeneity: Evidence from China

1
Economics Institute, Henan Academy of Social Science, Zhengzhou 450002, China
2
Economics Department, University of California San Diego, La Jolla, CA 92093, USA
3
China Academy of Transportation Science, Beijing 100029, China
4
Graduate School of Management, Management and Science University, University Drive, Off Persiaran Olahraga, Section 13, Shah Alam 40100, Malaysia
*
Author to whom correspondence should be addressed.
Atmosphere 2021, 12(9), 1169; https://doi.org/10.3390/atmos12091169
Submission received: 25 July 2021 / Revised: 5 September 2021 / Accepted: 6 September 2021 / Published: 12 September 2021

Abstract

:
The carbon reduction effect of technological innovation in the transportation industry is conducive to China’s anticipated realization of carbon neutrality. Therefore, we evaluated carbon emission reduction effect of technological innovation in the transportation industry in China. Based on the panel data of 30 sample provinces in China (excluding Hong Kong, Macao, Taiwan and Tibet) from 2012 to 2018, using the Moran’I index and Getis-Ord Gi index, this paper analyzes the evolutionary trend and spatial autocorrelation of carbon emission in the transportation industry, and analyzes the impact of technological innovation on carbon emission levels of the transportation industry and its spatiotemporal differences by using the geographical and temporal weighted regression (GTWR) model by using ArcGIS 10.4 software. The conclusions are as follows: The carbon emission level of China’s transportation industry generally has been rising steadily, showing a spatial distribution pattern of high emissions in the east and low emissions in the west. The cold spots are concentrated in the western region, and the hot spots are situated in the central and eastern regions. Technological innovation has a carbon reduction effect on the transportation industry in the eastern and north-eastern regions, while the effect in other regions is not obvious. However, there is an obvious “inverted U-shaped” relationship between technological innovation and the transportation industry’s carbon emissions. The technological innovation in the transportation industry will have a significant carbon reduction effect after breaking through the technical pain points. This carbon reduction effect has a higher effect on the western region than on the eastern region. In addition, the economic development level, the fiscal expenditure proportion of the transportation industry, the higher education level, and the proportion of fixed asset investment in the transportation industry have played a positive role in reducing carbon in the transportation industry, but the spatial heterogeneity of this carbon reduction effect is relatively strong. Therefore, during the “14th Five-Year Plan” development period in China, it is necessary to continuously promote the low-carbon development of the transportation industry with technological innovation, while highlighting the differentiated carbon reduction governance, and consolidating the role of talents and fiscal support.

1. Introduction

As the constant growth of China’s economic development, the exponential growth of transportations associated with Internet-based shopping, and the continuously increasing use of private cars, the growth rate of energy consumption in the transportation industry has risen ceaselessly [1,2]. The increasing demand for transportation has led the carbon emission problem to become increasingly serious, and the transportation industry has become the third largest energy consuming industry of China [3]. It is therefore a key factor for China to achieve and promote the transformation towards green and low-carbon development. Statistics show that from 2001 to 2018, the carbon emissions of China’s transportation industry increased by an average annual rate of 7.69% [4], and total carbon emissions of this industry in 2019 was 1.1 billion t, accounting for 10% of the total national carbon emissions. In order to promote the green, circular, and low-carbon development of the transportation industry, China issued a series of policies dedicated to reducing carbon emission in the transportation industry, as the “Medium and Long-term Development Plan for Comprehensive Transportation Network” (2007), “Guiding Opinions on Building a Low-Carbon Transportation System” (2011) and “The 13th Five-Year Plan for Modern Comprehensive Transportation System” (2017), etc., especially during the “14th Five-Year Plan” period, China will promote low-carbon transportation equipment to adjust the energy consuming structure of the transportation industry, improve multimodal transport capabilities to adjust the transportation structure, and emphasize the leading role of technological progress in the low-carbon development of the transportation industry. In fact, the improvement of the carbon emission efficiency in China’s transportation industry is mainly driven by technological innovation, and technology transfer between regions can further stimulate the carbon reduction potential in the transportation field [5]. Therefore, exploring the effect of technological innovation on carbon emission reduction in the transportation industry has significant practical values for the green development of China’s transportation industry.
In 2020, in order to achieve the green development pathway, the Chinese government announced that it will achieve the goal of peaking carbon in 2030. Recently, even though the Chinese government has adopted a series of emission reduction regulations, the current situation of carbon emission reduction in China’s transportation industry is still grim. Achieving carbon emission reduction in the transportation industry is one of the key areas for China to achieve carbon peaks, and promote green and low-carbon transformation, however, how to achieve low-carbon transportation while achieving sustainable economic and social development is a major issue facing by Chinese transportation industry. The development of carbon emission reduction technology in the transportation industry through technological innovation has become the current development trend in the new times. The Chinese government will actively promote low-carbon transportation equipment innovation in the future to adjust the energy structure of the transportation industry. At the same time, it has proposed to accelerate the construction of a modern transportation system and improve the green and low-carbon construction of the transportation infrastructure with convenience, high-speed, lightweight, and high-tech as key characteristics. They plan to continuously strengthen the support of technological innovation in the green transportation system and develop intelligent low-carbon transportation. Can China’s technological innovation in the transportation industry really reduce carbon emissions? In order to answer this question, this paper will explore the carbon reduction effect of technological innovation in the transportation industry. The research contributions of this article are as follows: First, this article uses spatial autocorrelation, and spatial cold and hot spots models to analyze the spatiotemporal evolution of carbon emissions in China’s transportation industry. Second, using the GTWR model, this article analyzes the carbon reduction effect of technological innovation on the transportation industry and the spatial heterogeneity of such effect.
The remaining sections of this article are as follows: Section 2 is a literature review, which summarizes the research methods and conclusions about transportation carbon emissions, and the carbon reduction effect of technological innovation in the transportation industry. Section 3 is the methodology section, which introduces the spatial autocorrelation, the cold and hot spots models, and the geographical and temporal weighted regression (GTWR) model. Section 4 reveals the result, which analyzes the spatiotemporal evolution trend, spatial autocorrelation, cold and hot spots of the carbon emission in the transportation industry, and the carbon reduction effect and its spatial heterogeneity of technological innovation in the transportation industry by using the GTWR model. Section 5 is the discussion, which focuses on the study’s result and the limitations. Finally, in Section 6 the authors make conclusions and enlightenments.

2. Literature Review

Technological innovation can effectively reduce carbon dioxide emissions [6]. In particular, clean technology innovation and renewable energy have a significant positive effect on reducing greenhouse gas emissions [7]. Based on China’s carbon emissions from 1995 to 2019, Ma Q., Murshed M. and Khan Z. [8] confirmed that energy investment, technological innovation, renewable energy, and R&D (Research and Development) expenditure have a positive effect on reducing carbon emissions, and the ecological innovation and R&D expenditure also favor to reduce energy consumption [9].The R&D investment can significantly reduce the carbon emission in the transportation industry, and technical cooperation in the transportation field in different regions has different impacts on carbon emission. For example, technological progress in the transportation field, rather than other fields, in the southern region has a more extensive impact on carbon emissions [10]. Based on the panel data of 30 provinces in China from 2008 to 2017, Zhang, Jiang et al. [11] established a DEA (Data Envelopment Analysis) model to estimate the carbon emission efficiency of the transportation industry. Their results showed that the innovation of low-carbon and energy-saving (LCES) technology has led the carbon emission efficiency of China’s transportation industry to increase by about 7% on average, and 28% in the eastern region, showing that technological innovations should take into account differences among regions and balance the research and development investments in different regions. Technological progress comes from independent innovation and technological spillover. In order to achieve the overall carbon emission reducing goal, independent innovation increases energy efficiency from internal technological improvements, while technological spillover improves the energy technology levels in different regions through horizontal or vertical flows of technology [12].
The improvements to the technological innovation capability of the transportation industry can reduce carbon emissions in this field from different angles. Technological innovation and technical efficiency improvements can both promote the green efficiency of transportation energy [13], in particular, focusing on developing hydrogen energy and battery storage to increase energy efficiency is beneficial for reducing carbon emissions [14,15]. Compared to energy substitution, the pathway of technological innovation or energy efficiency has a comparative cost advantage, and plays a more important role in reducing the cost of vehicle carbon emission reduction [16]. Through case study methods, Dillman, K., et al. [17] modeled and decomposed the impact of technological and behavioral changes on carbon emissions. Their results showed that the development of electronic car technology can significantly reduce carbon emissions, meanwhile the changes in people’s social behaviors and urban infrastructure facilities will significantly reduce the carbon emission level. Haftor, D.M. and R.C. [18] combined heavy vehicles and related long-distance transportation services to conduct a longitudinal case study of an industrial company’s innovative product. Such products can reduce fuel consumption of road transportation by a quarter, while also reducing fuel costs and carbon dioxide emissions. Li, B., et al. [19] believed that the average emission of CO2 of electric vehicles reach to be 1/10 of that of gasoline vehicles per kilometer, and the active development of electric vehicles and the related smart charging devices can significantly reduce future carbon emissions. Zhao, J., et al. [20] introduced artificial intelligence to design value-added vehicle power, used high-swing batteries and replaced batteries as needed to reduce their life cycle costs and reduce greenhouse gas emissions.
In addition, through technological innovation, resource allocation, and industrial substitution effects, high-speed rail has significantly reduced its carbon emissions by 7.35% [21]. The development and implementation of China’s high-speed rail technology has improved average environmental efficiency by 48.7% [22], and China’s overall carbon emissions can be reduced by 0.14% on average for every additional 100 high-speed rails [23], showing that the development of China’s high-speed rail technology plays an equally important role in reducing carbon emissions. However, there are also studies that hold different opinions. Erdoğan, S., et al. [24] adopt CCE (Common Correlated Effects) and AMG (Adaptive Model Generator) methods to study the impact of G20 innovative products development and innovative technological upgrades on carbon emissions, and found that the impact of innovations on long-term carbon emissions in the energy and transportation sectors is not statistically significant. The reason for this is that the improvement of energy technology brought about by innovation has promoted an increased demand for related industries such as tourism, personal driving, and air transportation, which actually failed to achieve the effect of reducing carbon emissions. The “rebound effect” generated by technological innovation is greater than the energy-saving effect brought about by technological innovation, and whether the “rebound effect” will bring about energy-saving effects need to be studied further [25].
Generally, from different perspectives, scholars focused on the carbon emission problems in the transportation industry and the carbon reduction effect of the electric vehicles and related new technologies in the transportation industry [23,26,27], and most affirmed the positive carbon emission reduction effect of the technological innovation. However, some scholars analyzed the carbon reduction effect on the transportation industry from the perspective of technological innovation, but not in one specific field such as high-speed rail technology or management innovations. Secondly, few scholars have analyzed the carbon reduction effect of technological innovation on the transportation industry from the geographical perspective, especially using the GTWR model to explore its spatial heterogeneity. These provide a certain space for the present study.
The spatial correlation effect in China’s transportation industry displays an increasing trend, and the effect of inter-province synergetic governance of carbon emissions shows a decreasing trend. The expansion of the difference in research and development investment has a significant promotion effect on spatial correlation [28]. Therefore, this article focuses on the carbon reduction effect of technological innovation on the transportation industry and its spatial heterogeneity. By using the China’s transportation sample from 2012 to 2018, this article firstly analyzes the evolutionary trend of carbon emission in the transportation industry by ArcGIS 10.4. Secondly, we will analyze the local autocorrelation by using the local Moran’s I index, and then, adopt the Getis-Ord Gi index to analyze the hot-cold regions. Thirdly, this article analyses the carbon emission reduction effect of technological innovation in the transportation industry using GTWR model.

3. Methodology

3.1. The Spatial Relationship Analysis Model

Before analyzing the spatial autoregression relationship, we need to verify the spatial weighted relationship between different spatial units to calculate the Moran’s I index of the carbon emission in China’s transportation industry. According to the Liu, C., et al. [29], this article uses the spatial inversed distance matrix to reflect the spatial relationship between different spatial units, and adopts the distance between different provincial capital cities to reflect the distance between different provinces. Then, we can calculate the spatial Moran’s I index between different regions [30], and have:
M o r a n I = i = 1 n j = 1 m W i j ( x i x _ ) ( x j x _ ) S 2 i = 1 n j = 1 m W i j
In Formula (1), xi refers to the spatial observe of unit i, S2 refers to the sample variance as 1 n i = 1 n ( x i x _ ) 2 , x _ refers to sample mean as 1 n i = 1 n x i . However, the spatial Moran’s I index only calculates the spatial condition of all units as a whole, and cannot divide to more precise types with different regions. The local Moran’s I index can reflect the local regions’ spatial relationship, with four different types as “high-high cluster”, “high-low cluster”, “low-low cluster” and “low-high cluster”, and have:
I = ( x i x _ ) S 2 j = 1 n W i j ( x i x _ )
Next, we use the Getis-Ord Gi index to divide the spatial hot and cold regions [31], and check the result of local Moran’s I index above, and have:
G i = i = 1 n j = 1 n W i j x i x j i = 1 n j 1 n x i x j
Formula (3) refers to the value setting of the ArcGIS 10.4 software, when Gi > 1.96. It indicates that these are hot spot regions of carbon emission in China’s transportation industry; when Gi < 1.96, it indicates that these are cold spot regions of carbon emission in China’s transportation industry.

3.2. The Spatiotemporal Heterogeneity Analysis Model

Compared with the traditional spatial econometrical model, the GTWR model not only reflects the spatial locational characteristics of sample units, but also fully considers the time factor in the model [32], and it is more comprehensive in reflecting the spatiotemporal heterogeneity between variables. Therefore, by using the GTWR model, this article analyzes the impacts of technological innovation on the carbon emissions of the transportation industry, and have:
ln Y i = α 0 ( m i , n i , t i ) + k = 1 K α k ( m i , n i , t i ) X + ε i
In Formula (4), Yi refers to the carbon emission of the transportation industry, X is the factors that impact on Yi, ak(mi,ni,ti) refers to the coefficients of sample i at time k, (mi,ni) refers to the spatial two-dimensional coordinates of the i-th city, and (mi,ni,ti) refers to the spatiotemporal location of sample i, εi represents the random factor. Before using the GTWR model, it is needed to analyze the spatiotemporal weighted relationship between variables. The sample spatiotemporal distance dST is the linear function of the distance dS and dT between the provincial capital cities of region i and region j [32,33], and thus: dST = dS + dT, where γ, λ are the correlation coefficients. The spatiotemporal distance between region i and region j can be calculated as following:
d i j = γ ( x i x j ) 2 + ( y i y j ) 2 + λ ( t i t j ) 2
Using Gaussian distance-decay-based kernel functions to construct a spatial weight matrix WS and time distance matrix WT, we obtain the spatiotemporal matrix WST of sample i in time t, as: WST = WS × WT. Furthermore, the spatiotemporal weight Wij between region i and region j is determined by the Gaussian function, as: W i j = exp ( D i j 2 / h s 2 ) . hs refers to the non-negative bandwidth parameter, and according to the corrected Akaike Information Criterion (AIC) [34], hs’s minimum value can be calculated as:
c v ( h ) = min ( i = 1 n [ y i y i ( h ) ] 2 )
In Formula (6), y i ( h ) refers to the fitted value of yi. According to Ref. [32], the influence coefficient of the carbon emission of transportation industry can be calculated as:
α k ( m i , n i , t i ) = [ X T W ( m i , n i ) ] 1 X T W ( m i , n i ) Y
In all the formulas above, we are using the ArcGIS 10.4 software to calculate the results.

3.3. Variable Definition

3.3.1. The Dependent Variable

We choose the carbon emissions of the transportation industry (total) as the dependent variable. At present, there is a lack of official statistics on the carbon emission of China’s provincial transportation industry. Considering the availability of data, referring to Xie, R., et al. [35], this paper uses the provincial data of the Carbon Emission Accouts & Datasets (CEADs) (https://www.ceads.net/data/province/, accessed on 22 June 2021) database, and the provincial transportation industry carbon emissions are the sum of carbon emissions from transportation, warehouses, and transportation equipment in the transportation industry.

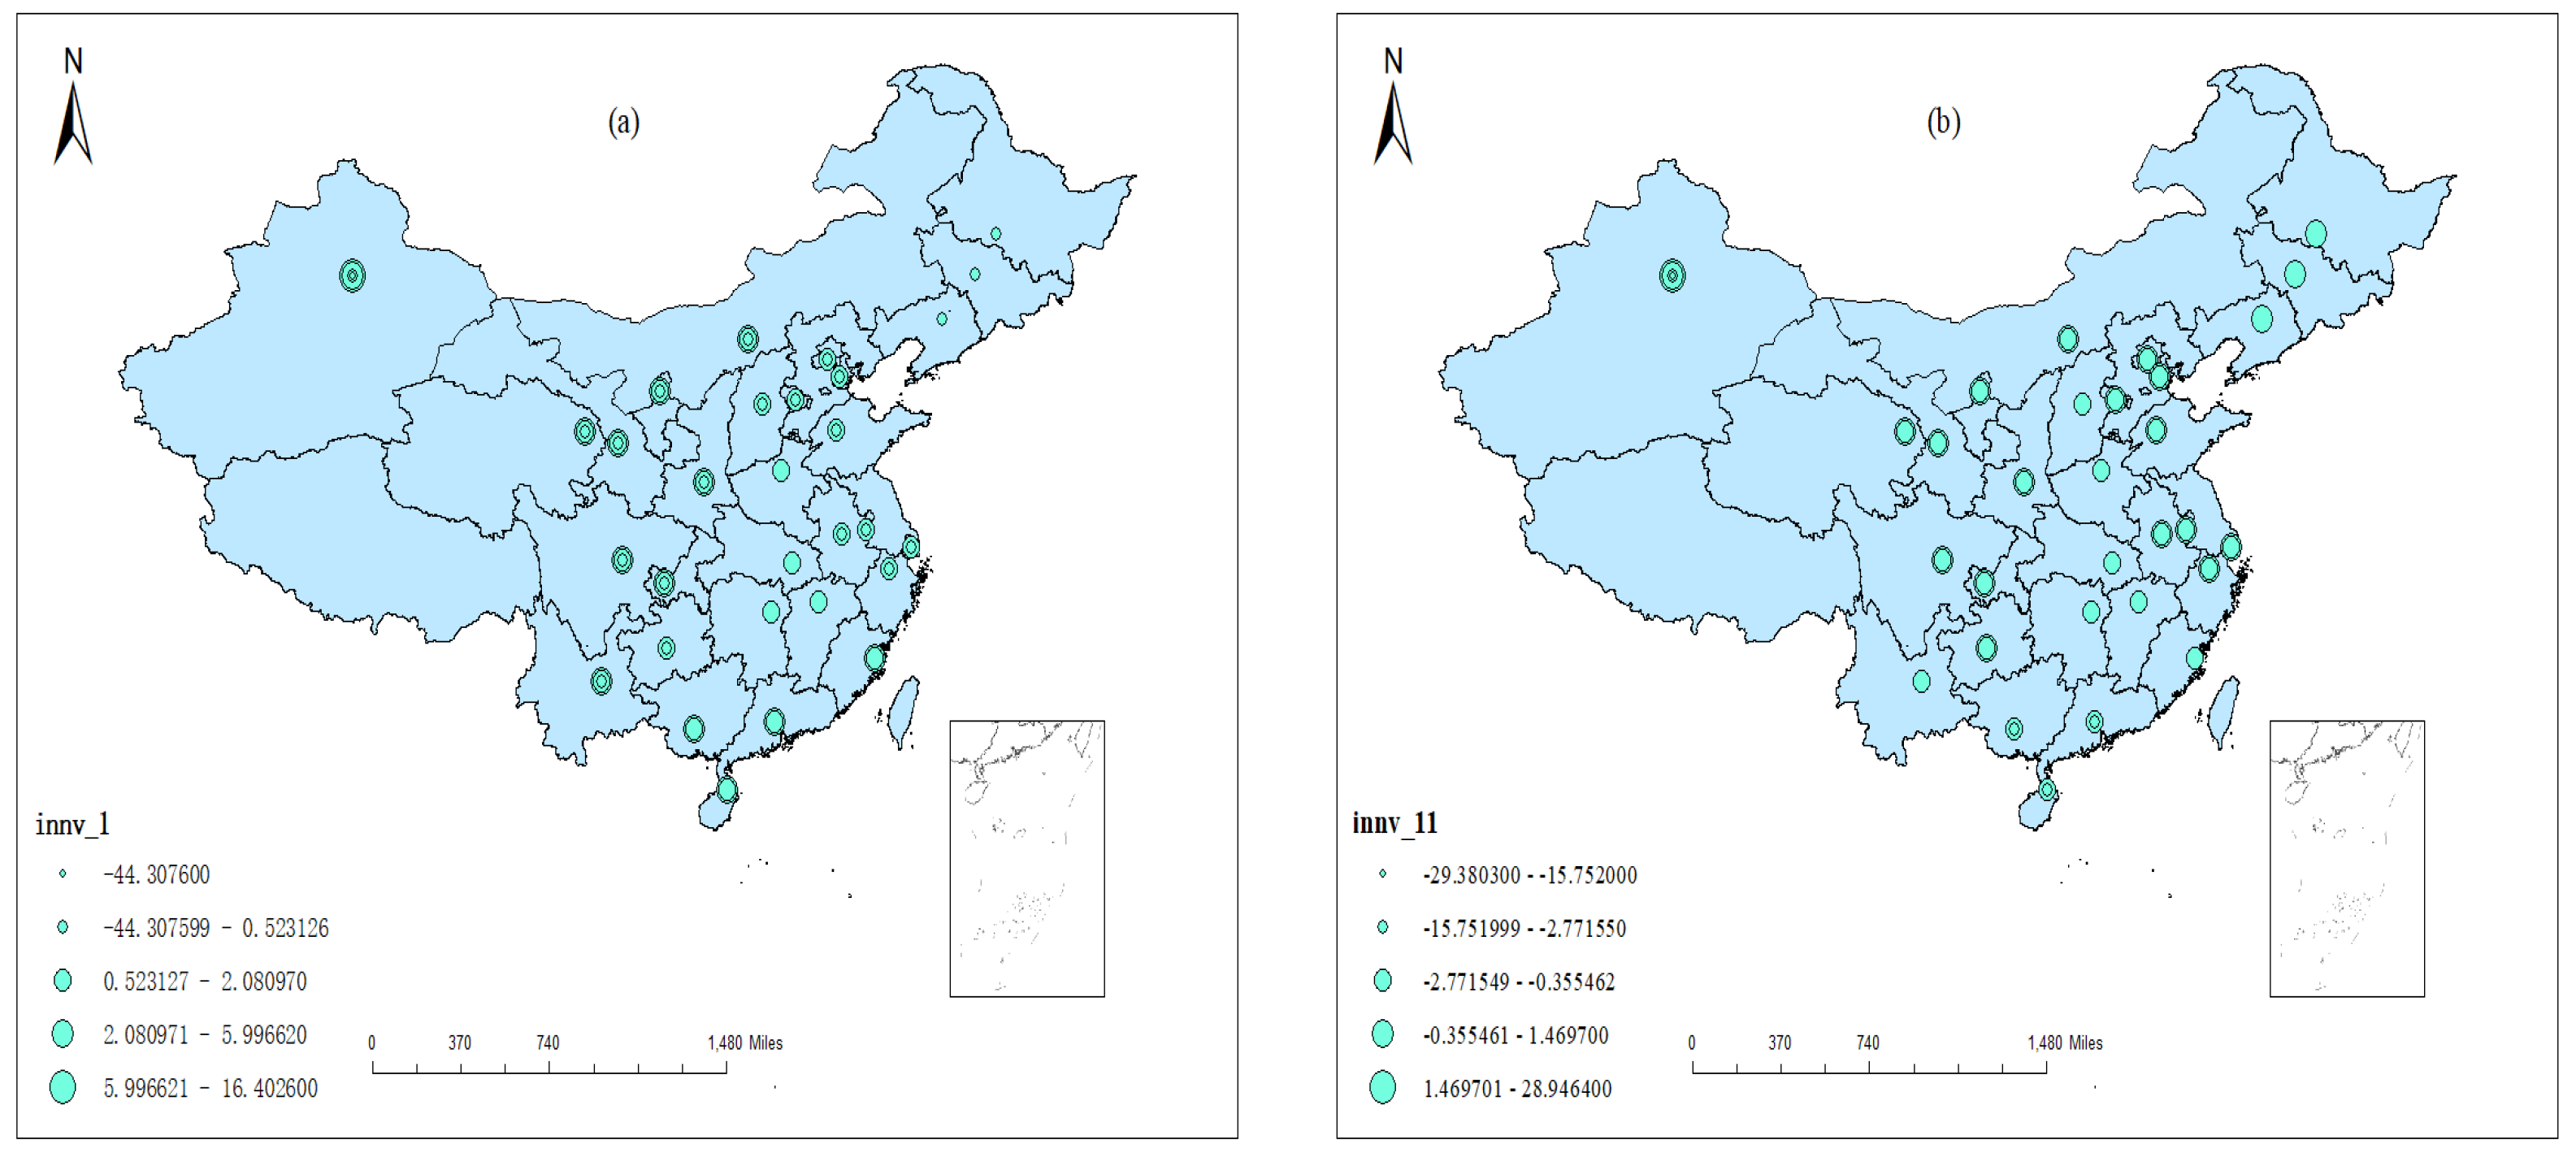
3.3.2. The Core Variable

Transportation scientific research institutions are the main sector of the transportation technology innovation, and the more the institutions, the higher technological innovation level in the transportation industry [10]. From China’s transportation statistic yearbook, it merely shows the provincial number of the transportation research institutions, and the technological innovation in the transportation industry (innv_1) is represented by the number of transportation scientific research institutions. Among them, the scientific research institutions in the transportation industry include laboratories, research centers, engineering technology (research) centers, etc. We chose the quadratic of the technology innovation in the transportation industry (innv_11) to verify the nonlinear relationship between the technology innovation and carbon emission in the transportation industry.

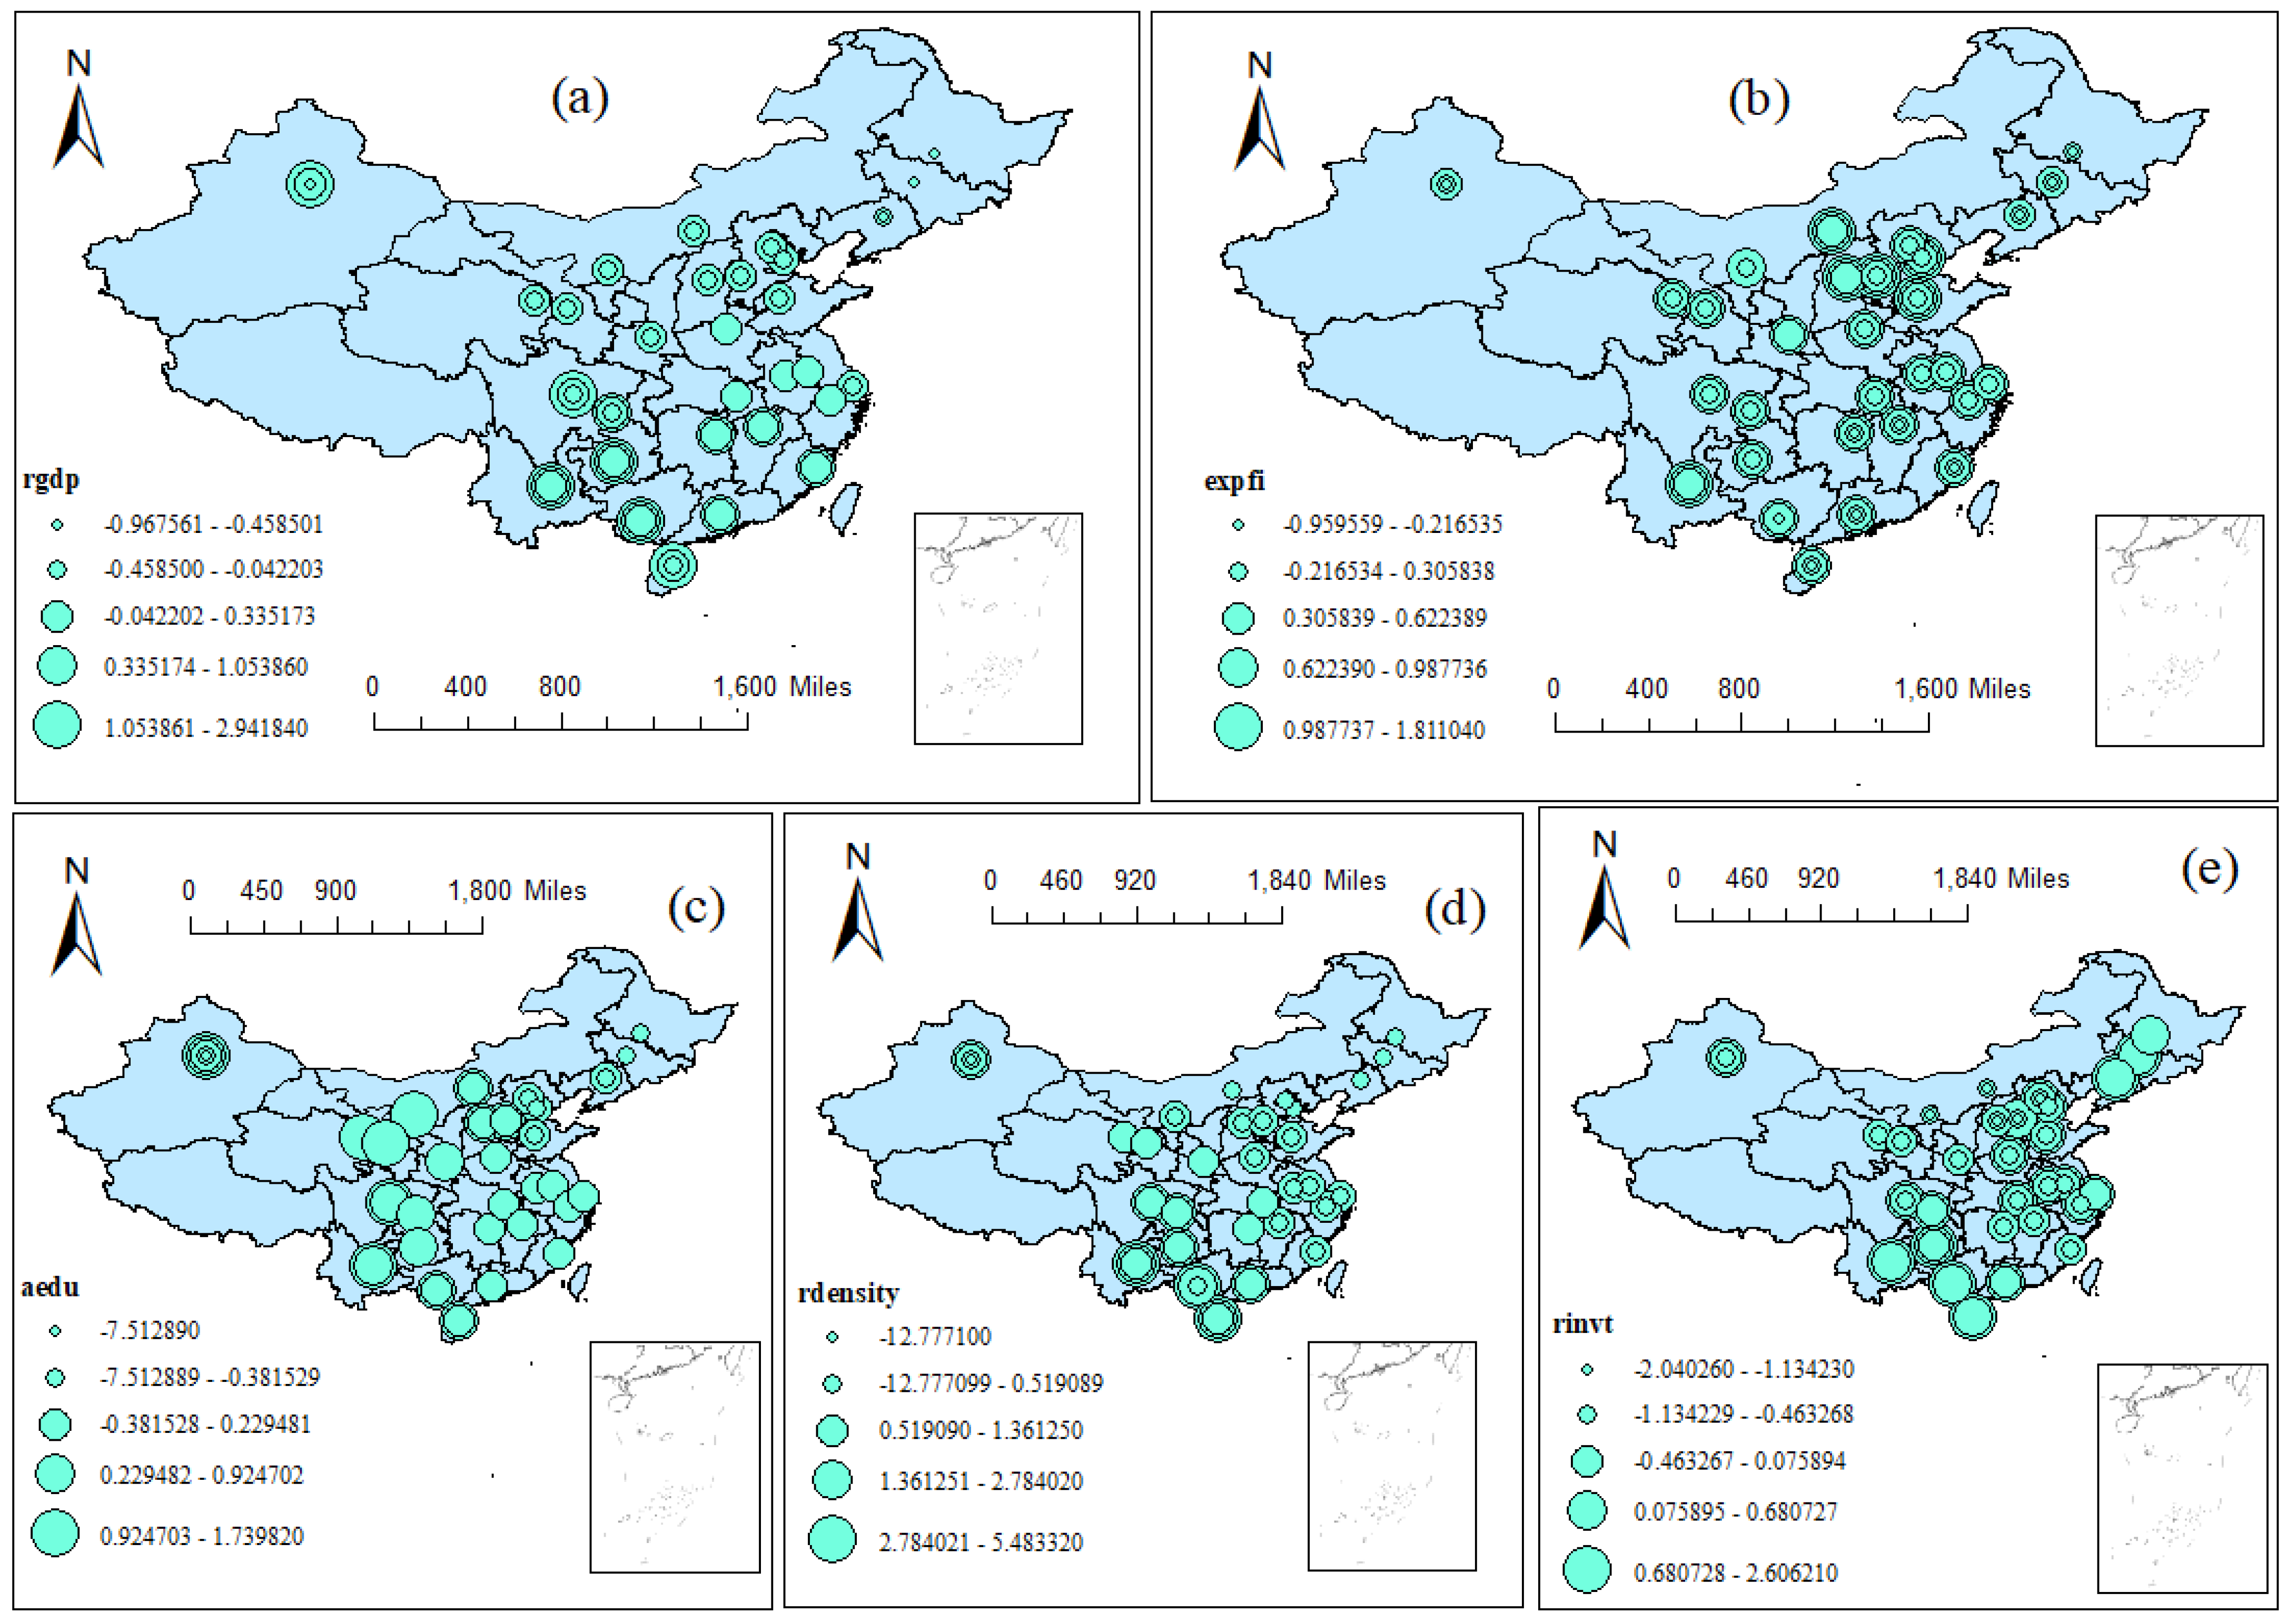
3.3.3. The Control Variable

(1)
GDP per capita (rgdp). The increase in the GDP per capita is often accompanied by a higher transportation intensity, and the higher transportation intensity will lead to a growth in carbon emission per capita [36].
(2)
The proportion of fiscal expenditure on the transportation industry (expfi). From the beginning of the “13th Five-Year Plan” period, China has been promoting the green development of the transportation industry, and the fiscal expenditure in the transportation industry can encourage a low-carbon and intelligent transportation, combined with the transportation tax policy.
(3)
Higher education level (aedu). The level of higher education represents the regional technological innovation ability. The stronger the technological innovation ability, the more technological innovation achievements in the transportation industry, especially in terms of new energy vehicles, energy saving, and emission reduction which can significantly reduce the carbon emission in the transportation industry [37]. Referring to Wu, N. and Z. Liu. (2021) [38], the regional higher education level is represented by the students of local colleges and universities.
(4)
Population density (rdensity). The higher population density, the higher transportation demand, the stronger the transportation density, and the more carbon emission can be generated [39]. Since the city population density can only represent the urban population but not the rural population, in order to reflect the provincial population density, this article adopts the ratio of the total population to the area of the region to represent the population density.
(5)
The proportion of fixed assets investment in the transportation industry (rinvt). The proportion of fixed assets investment in the transportation industry is mainly used to measure the degree of fixed assets investment in the transportation industry. The fixed assets investment in the transportation industry is mainly used in the construction of road, railway, bridge and other attachments. There is a higher proportion of the fixed assets investment in the transportation industry currently on the road construction in China [40], and the higher the fixed assets investment in the transportation industry, the longer the road mileage, and the more potential of carbon emission in the transportation industry.

3.4. The Data Resources

Without special statements, the data used in this article are from the China’s Transportation Statistical Yearbook, China’s Energy Statistical Yearbook, China’s Statistical Yearbook, Carbon Emission Accouts & Datasets (CEADs) and EPS database. In this article, the time range from 2012 to 2018, with the time limited in the CEADs. We construct a provincial panel data sample including 30 provinces (exclude Hongkong, Macau, Taiwan and Tibet). Table 1 shows descriptive statistics of the relevant variables.

4. Results

4.1. The Overall Trend of the Carbon Emission Level of China’s Transportation Industry

Using the equidistant method and selecting four nodes of 10 t, 30 t, 50 t, and 70 t, we divide the carbon emission level of China’s transportation industry into four areas: lowest (0–10), lower (10–30), medium (30–50), and high (50–70), and correspondingly with colors grey, yellow, blue and red respectively. Figure 1 shows the development trend of the carbon emission level of China’s transportation industry from 2012 to 2018. In general, the average carbon emission levels of China’s transportation industry in 2012, 2014, 2016, and 2018 were 20.71 t, 21.38 t, 23.39 t, and 24.389 t, respectively; the highest value of carbon emissions of the transportation industry in the sample provinces increased from 64.2 t in 2012 to 69.82 t in 2018, and the carbon emission level of China’s transportation industry is showing an upward trend. In terms of spatiotemporal changes, low carbon emission areas of the transportation industry maintain a relatively concentrated spatial distribution, while high carbon emission areas maintain a relatively scattered spatial distribution.
Specifically, first, the number of provinces with the lowest carbon emissions in the transportation industry is small and showing a decreasing trend, from 7 in 2012 to 5 in 2018. In terms of spatial distribution, lowest carbon emission areas have always been concentrated in the western regions such as Qinghai, Gansu, and Ningxia, and this spatial distribution pattern has been relatively stable since 2014. The western regions have a sparse population and relatively underdeveloped economies in China, and the density of transportation is relatively low, therefore, carbon emission is relatively low in these regions. Second, the number of provinces with lower carbon emissions in the transportation industry is large and relatively stable, remaining at 16 between 2012 and 2018. In terms of spatial distribution, lower carbon emission areas were relatively scattered in the central-western regions such as Sichuan, Shaanxi, Chongqing, and Guizhou, in the north-eastern regions such as Jilin, and in the central regions such as Hebei and Henan in 2012 and were concentrated in the central-western regions and the north-eastern regions in 2018. Similarly to the lowest carbon emission areas, the central-western regions and the north-eastern regions are relatively sparsely populated, the economy is relatively underdeveloped, the transportation density is relatively low, and carbon emission is relatively low in these regions. Third, the number of provinces with medium carbon emissions in the transportation industry is relatively large and is increasing, from 5 in 2012 to 7 in 2018. In terms of spatial distribution, medium carbon emission areas were scattered in provinces such as Nei Mongol, Liaoning, Hubei, and Jiangsu in 2012, and gradually moved to central regions such as Hubei and Henan and eastern regions such as Jiangsu and Shandong in 2018. Central provinces such as Hubei and Henan have convenient transportation, high population densities, and large economic aggregates. Driven rapidly by network economics such as online shopping, especially given the fact that lots of large e-commerce and logistics enterprises such as JD.com and SF Express have set up logistics centers in the central provinces, transportation has become more frequent and carbon emission has increased significantly in these regions. The eastern regions are economically developed, and most of them are highway, sea, and railway transportation hubs, holding a large number of traditional fossil fuel vehicles. At the same time, the eastern regions have a high population density and high traffic congestion, and the number of private traditional fossil fuel cars is also relatively large, resulting in the significant increase in carbon emissions from the transportation industry. Fourth, the number of provinces with high carbon emissions in the transportation industry is small and relatively stable, remaining at 2 in 2012 and 2018. In terms of spatial distribution, high carbon emission areas moved from Shandong and Guangdong in 2012 to Guangdong and Shanghai in 2018. Guangdong and Shanghai are located in the economically developed areas or densely populated areas of China, as well as domestic or regional railways, highways, and shipping centers. They have dense logistics and still use traditional fossil energy such as petroleum as the primary transportation energy, producing high carbon emissions.

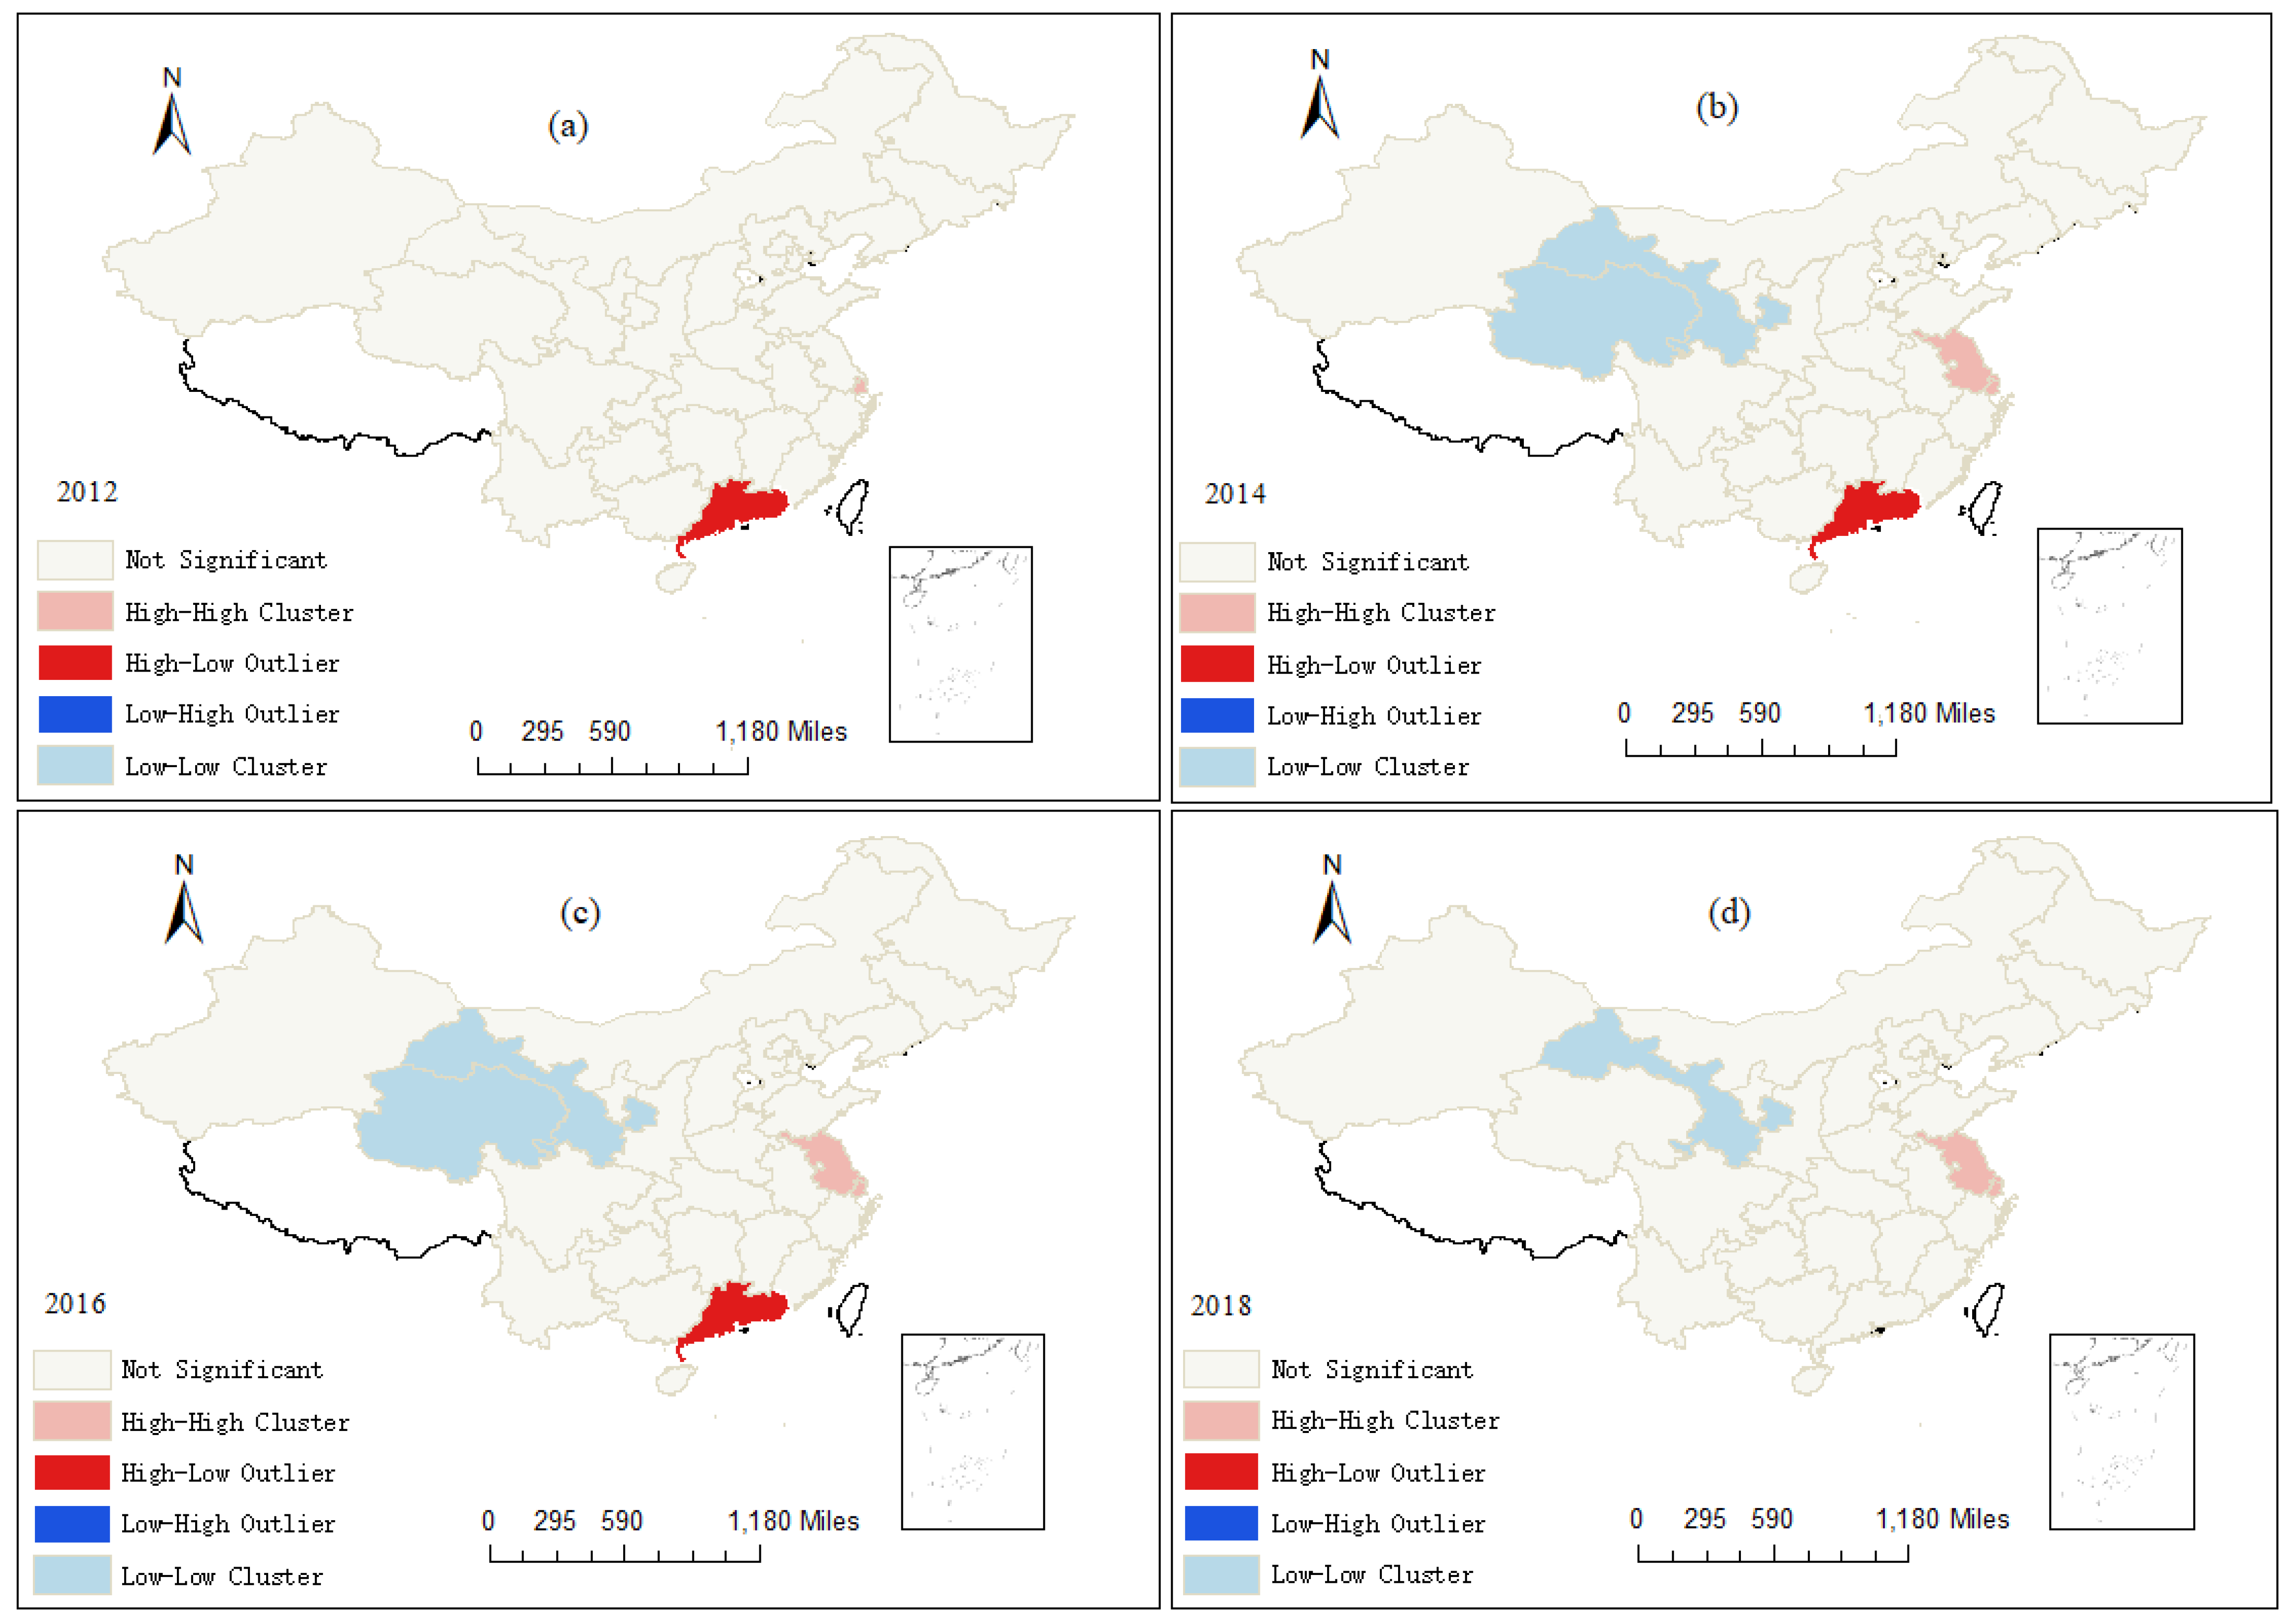
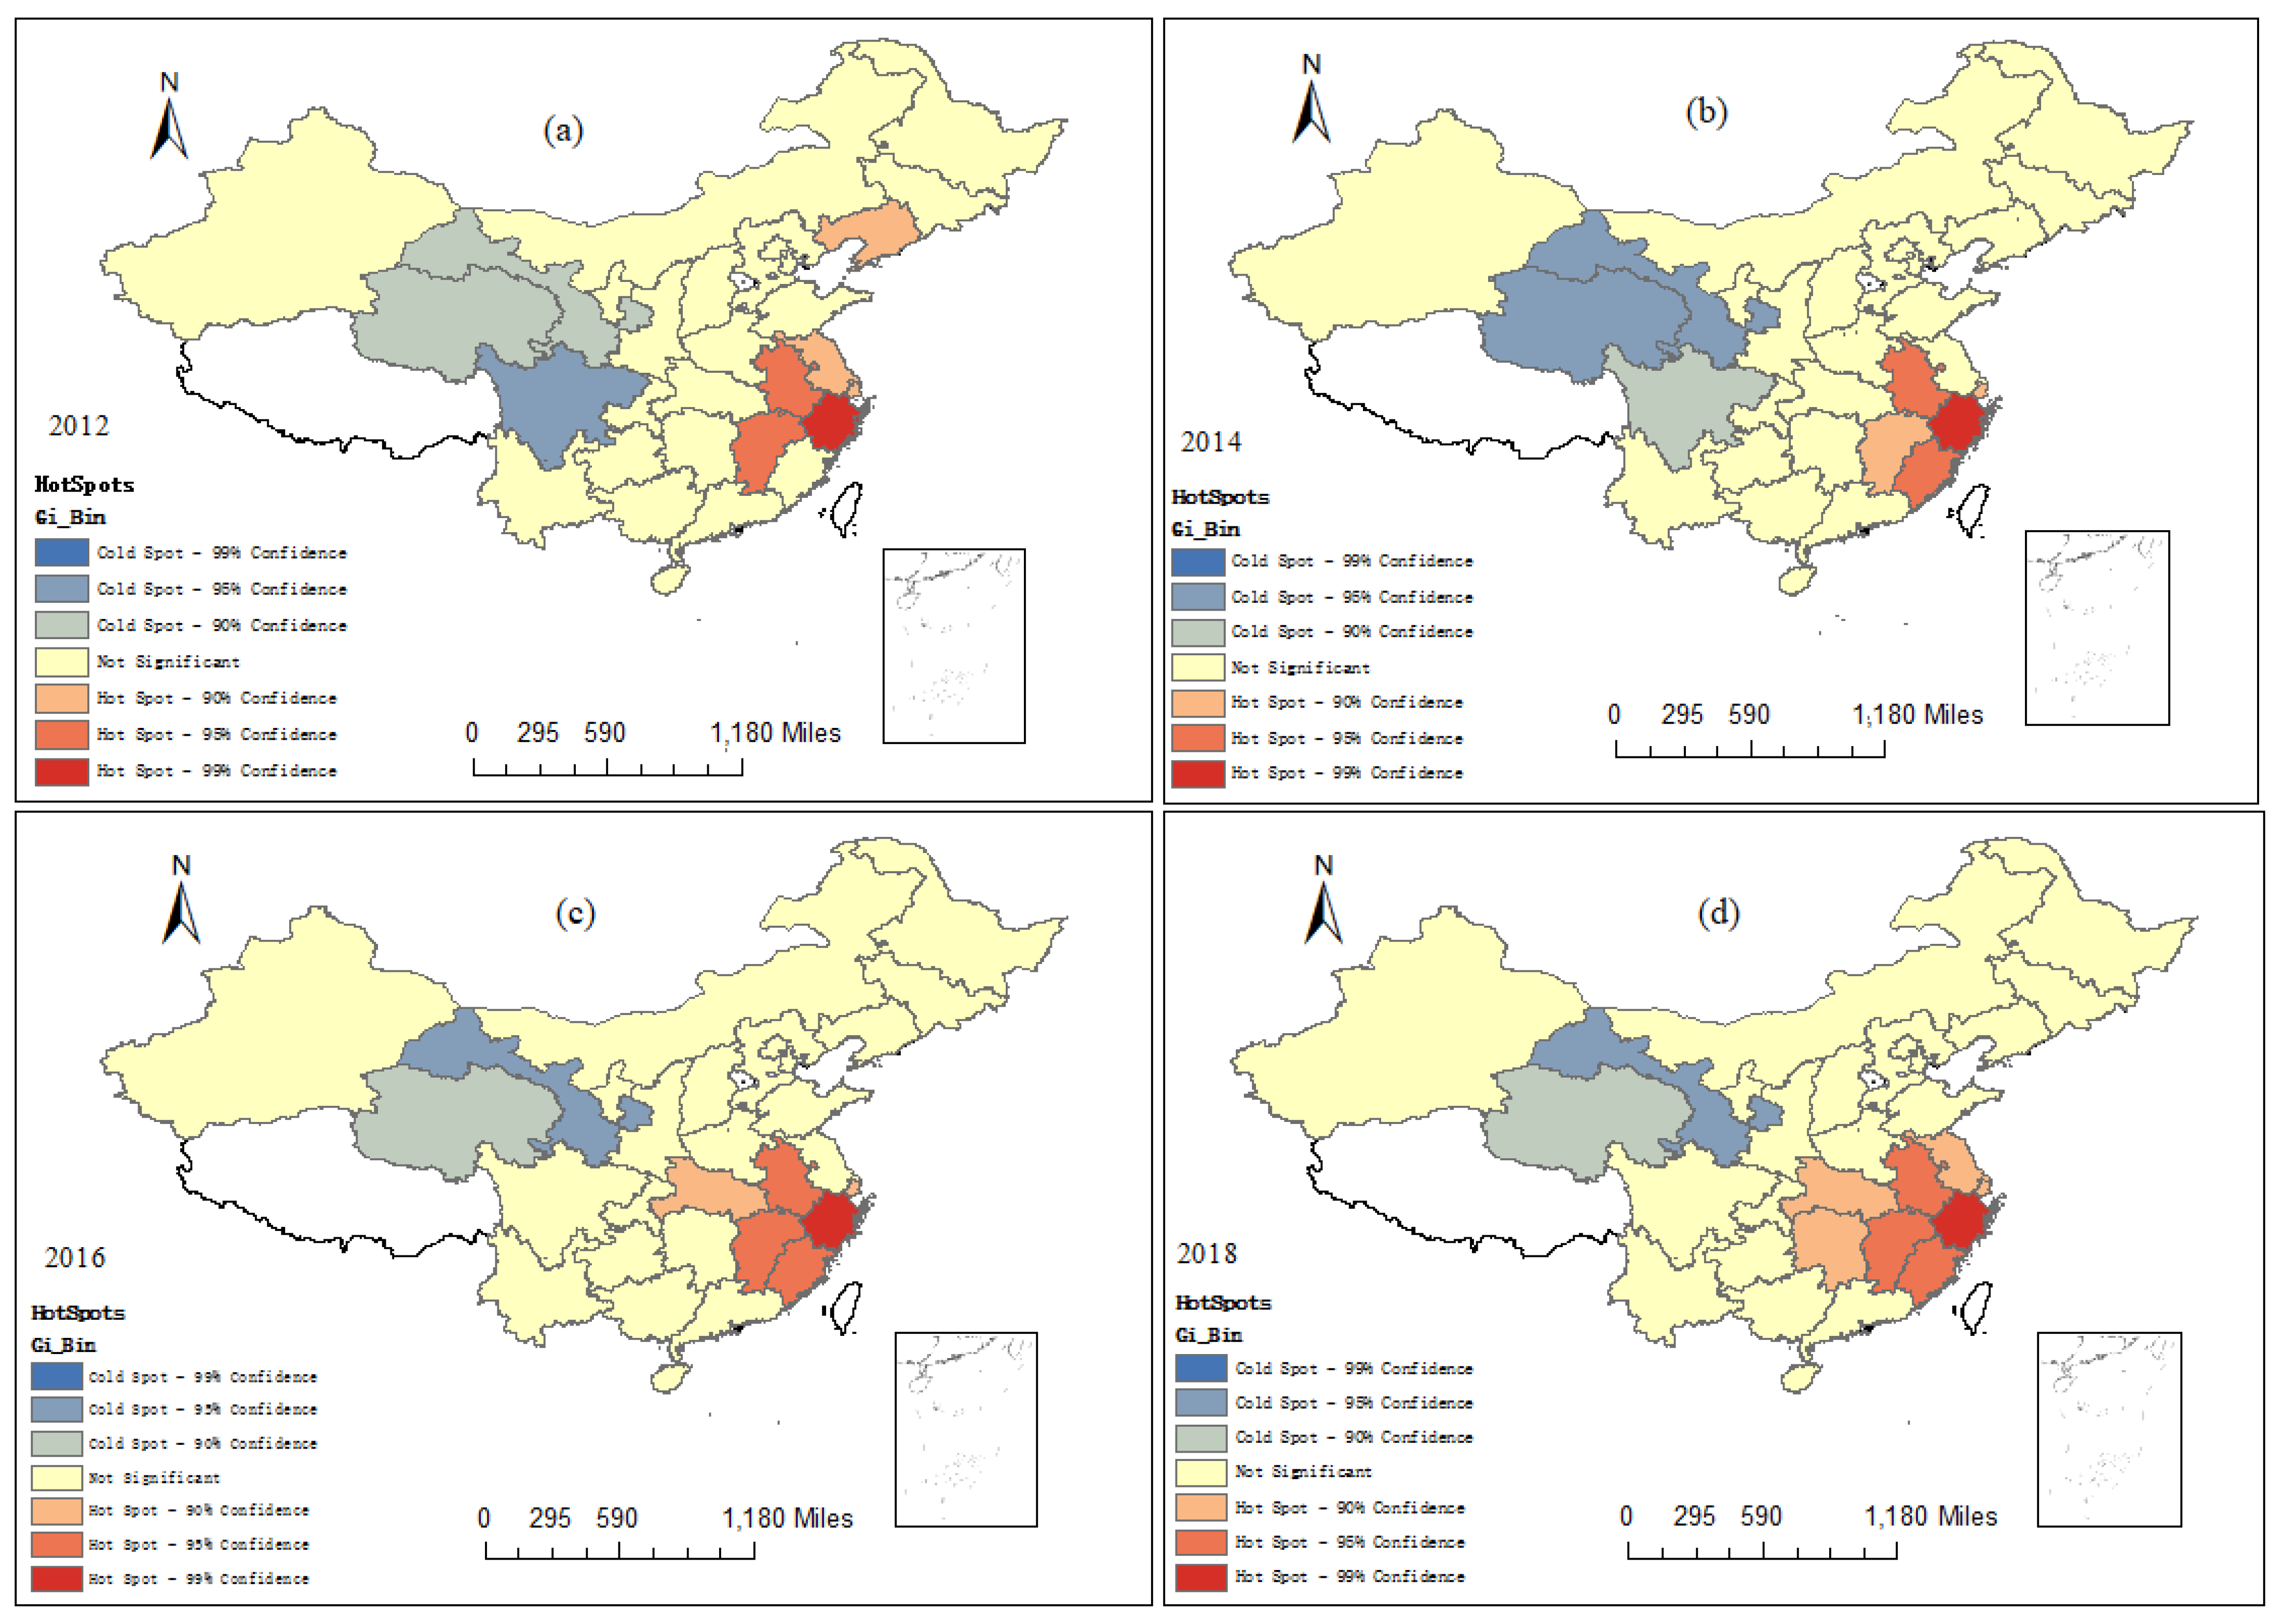
4.2. Spatial Local Autocorrelation Analysis

Local spatial autocorrelation is a measure of whether the aggregation or dispersion of the local space in general is significant, and it can be divided into spatial positively correlation and spatial negatively correlation. Spatial positively correlation stands for certain attributes being spatially aggregated similarly, while spatial negativity stands for certain attributes being spatially dispersed differently. Based on these properties, it can be tested whether certain attributes of adjacent spatial objects exhibit a “high-high” and “low-low” positive correlation, or a “high-low” and “low-high” negative correlation [41,42,43,44,45].
Figure 2 shows the local spatial correlation of the carbon emission level in China’s transportation industry. In this figure, during the survey time of the sample, the spatial correlation of the total carbon emission from the transportation industry is not significant in most of the provinces, but is significant in some provinces. First, the “high-high” clusters are small in number and are concentrated in the developed eastern coastal regions. The “high-high” clusters only included Shanghai in 2012, and gradually evolved to include provinces like Shanghai and Jiangsu, indicating that the surrounding areas of Jiangsu and Shanghai have high carbon emissions from the transportation industry, and they are the center of high carbon emissions of the transportation industry in the surrounding areas. As pointed out above, eastern coastal regions are the economically developed and densely populated regions, and they have high carbon emissions from the transportation industry. In 2018, the GDP per capita of Shanghai and Jiangsu were 135,000 yuan and 115,000 yuan, and population densities were 3823 people/km2 and 2176 people/km2, respectively. Meanwhile, in 2017, Shanghai had 3.905 million motor vehicles, ranking fourth in the country; Jiangsu had 16.2 million private vehicles, ranking third in the country, which is relatively more than the surrounding areas. Given the fact that motor vehicle energy is still dominated by traditional energy, transportation vehicles have a relatively high carbon emission. Second, the “high-lower” clusters are few and are distributed in Guangdong province. From 2012 to 2016, the “high-lower” clusters were primarily distributed in Guangdong province, indicating that Guangdong province had a relatively high transportation carbon emission level and the surrounding provinces had relatively low carbon emission levels, and there was a relatively large gap between them. As shown by Figure 1, from 2012 to 2016, the carbon emissions from the transportation industry in the surrounding provinces and cities of Guangdong province were maintaining at relatively low levels, while the carbon emission in Guangdong province was maintaining at a high level, and therefore forming a “high-lower” cluster phenomenon. With the increase in the carbon emission levels from the transportation industry in the central regions in 2018, the “high-lower” cluster in Guangdong province was no longer significant. Third, the “lower-lower” clusters were few and distributed in the western regions. In 2014 and 2016, “lower-lower” clusters included Qinghai and Gansu, and only included Gansu in 2018, showing that Qinghai, Gansu, and their surrounding areas all had relatively low carbon emission levels from the transportation industry. As pointed out above, the population density of the western regions is low and the degree of economic development is not high. Under the national promotion of the Yellow River basin ecological protection and high-quality development strategy, the western regions have a rather stronger ecological conservation function, and the carbon emission level of the transportation industry is relatively low. The “low-higher” cluster is insignificant.
Figure 3 shows the distribution map of spatial cold and hot spots of total carbon emissions of the transportation industry. From light to dark, the blue color represents the cold spots of the 90% to 99% confidence interval of the total low carbon emissions, and the red color represents the hot spots of the 90% to 99% confidence interval of the total high carbon emissions. In Figure 3, the cold spots of the carbon emission levels of the transportation industry in most of China’s provinces are mainly concentrated in the western regions, and hot spots are concentrated in the central and eastern regions. First, the cold spots of carbon emissions in the transportation industry are few and are mainly concentrated in the western regions. In 2012, the cold spots of transportation carbon emissions were distributed in Sichuan, Gansu, and Qinghai, and were reduced to Gansu and Qinghai in 2018, indicating that the transportation industry in these areas have low carbon emission, and generate the spatial aggregation of low carbon emission. Second, the hot spots of carbon emissions in the transportation industry are many and are concentrated in the central regions and eastern regions. In 2012, the hot spots of carbon emissions in the transportation industry were distributed in the eastern regions such as Jiangsu, Zhejiang, and Shanghai, and the central regions such as Jiangxi and Anhui; the hot spots continued to expand in 2018, with the increase mainly in the central regions such as Hunan and Hubei, and eastern regions such as Fujian. The central and eastern regions are the hot spots areas of carbon emissions of the transportation industry, which is consistent with above.

4.3. The Stableness Result of GTWR Model Estimation

Based on Formula (2), we empirically analyze the impacts of various variables on transportation carbon emissions. According to the results, the coefficient of determination R value is 0.6437 and the adjusted R value is 0.6314. Meanwhile, the spatiotemporal distance ratio is 1.2493, the AICc value is −268.4543, the sigma value is 0.1271, and the bandwidth value is 5.8273, showing that the model has a good fit and can better explain the statistical relationship between variables.

4.4. The Empirical Result Analysis

Based on the estimated coefficients of GTWR model, we use the method of Natural Breaks Jenks to divide the different types of the estimated coefficients. Meanwhile, the value of “0” is forced to be set as the interval value, to distinguish the positive and negative of the coefficient, and draw the spatiotemporal distribution of estimated coefficient accordingly, as is shown in Figure 4 and Figure 5.

4.4.1. The Impact of Technological Innovation

In Figure 4a, the coefficient of technological innovation in the transportation industry presents a spatial distribution pattern of high in the east and low in the west. Among them, the coefficients of Shanghai, Tianjin, Zhejiang and other regions turn from positive to negative gradually, and the coefficients of western regions such as Xinjiang, Gansu and Ningxia turn from negative to positive, and the coefficient of central regions such as Henan and Hubei are always positive. The results indicate that technological innovation in the transportation industry has not yet taken effect on carbon emissions in the transportation industry in most regions in China, while the areas where carbon reduction occurs are mainly gathered in the eastern and northeastern regions. China’s official statistics show that China has a land area of about 9.6 million square kilometers, spanning about 5200 km from east to west, and about 5500 km from north to south. Due to the large span of east to west and south to north in China, the demands of long-distance transportation are heavy, but the comprehensive endurance of new energy vehicles is far less than that of traditional energy vehicles such as petroleum vehicles recently.
Technological constraints have also restricted the use of new energy public transportation in cities and surrounding areas. Long-distance transportation with over 500 km is still dominated by traditional fossil energy transportation, and traditional fossil energy is still the main energy source for public long-distance transportation in most regions, and the currently existing technological innovations cannot effectively play a positive role in reducing carbon emission. At the same time, as pointed out above, with the rapid development of China’s online economy, the logistics economy has become larger than before, and has led to an increase in carbon emissions in the transportation industry. However, the developed economic regions in east, such as Shanghai and Zhejiang, have many transportation research institutions and stronger technological innovation capabilities, and the carbon reduction effect is significant. Shanghai has introduced internationally renowned new energy vehicle manufacturers such as Tesla in 2019. With a strong ability to transform the technological innovation achievements of the transportation industry, the technological innovation can effectively improve the energy structure of regional transportation in Shanghai, and thus play a positive role in regional carbon emissions reducing.
However, this does not mean that technological innovation cannot play an effective role in reducing carbon emission. In Figure 4b, the quadratic coefficients of the transportation industry technological innovation in most regions are negative, and the coefficients in the western region are lower than that in the eastern region, indicating that there is an obvious inverted “U-shaped” relationship between the transportation industry technological innovation and the transportation industry carbon emission. The level of technological innovation in the transportation industry will have a significant carbon reduction effect when it breaks through the technical pain points. This carbon reduction effect is more effective in the western region than in the eastern region. At present, new energy vehicles which based on pure electricity and hydrogen energy have technological constraint as short endurance, high overall cost and high opportunity cost. However, once it breaks through the above-mentioned technical and economic difficulties, it will effectively change the energy structure of China’s transportation vehicles, thereby reducing carbon emissions. Meanwhile, the carbon emissions of vehicles in the western region are low, and the marginal carbon reduction effect of technological innovation is higher than that of other regions.

4.4.2. The Impact of Other Factors

The impact of economic development. As is shown in Figure 5, The coefficients of GDP per capita present a spatial distribution pattern of high in the south and low in the north. Among them, the coefficients in north regions as Beijing, Tianjin, Nei Mongol, Qinghai, Hebei, Shanxi, Gansu, and Ningxia have changed from positive to negative, and the coefficients in most south regions are always positive, meaning that the increase in GDP per capita will reduce the carbon emission of the transportation industry in the north regions, but it does not play a positive role in the southern areas. Taking the Qinling and Huaihe River as the dividing line [46], in 2018, the GDP per capita of China’s southern and northern regions were 68,516.88 yuan and 63,447.24 yuan, respectively. The economic development level in the south is significantly higher than that in the north, and the marginal effect of carbon emissions from the transportation industry in the north is higher than that in the south accordingly [47]. At the same time, there is still much more space in the southern region to promote green economic development.
The impact of transportation expenditures. The coefficients of transportation proportion in the fiscal expenditures presents a spatial distribution characteristic as higher along the Yellow River and the Yangtze River, and lower in other regions. Among them, the coefficients of the Pearl River Basin and other regions have changed from positive to negative, and the coefficients of the Yellow River and the Yangtze River are always positive, indicating that the increasing proportion offiscal expenditure held by the transportation industry has played a positive role in reducing carbon emissions of the transportation industry in the north-east and the Pearl River Basin. In recent years, Guangdong and other Pearl River Basin regions have made full use of the water transportation advantages of the Pearl River Basin, especially in that they have taken action to increase the oil price as well as provided financial subsidies for the operation of low-carbon transportation such as waterways, which has played an important role in reducing carbon emissions. The Yangtze River is mainly navigable in the middle and lower basin, and the Yellow River does not have navigable conditions in most basins. The Yellow River and Yangtze River basins are China’s industrial economic intensive belts, especially in the middle and upper basins, with heavy industry such as steel and fossils, and covered large mountainous areas, and these regions need the heavy-duty trucks and other fuel-based vehicles for a large proportion of the transportation. In addition, the fiscal expenditures in the Yellow River and Yangtze River basins are mainly used for road and urban transportation construction, and the marginal effect of investing in low-carbon vehicles such as waterways and railways to reduce carbon emissions is not significant.
The impact of education level. The coefficients of the higher education average number of students present a spatial distribution pattern of high in the northwest and low in the southeast. Among them, the coefficients in the eastern, central and northeastern regions are negative, and the coefficients in other regions are positive, indicating that the improvement of higher education level has a positive effect on carbon reduction in the transportation industry in the eastern, central and northeastern regions. The higher the level of higher education, the stronger the capacity for technological innovation and management model change in transportation. There are more universities and scientific research institutes in the eastern and central regions of China, so the carbon reduction effect there are better than other regions.
The impact of population density. The coefficients of population density in most areas in China are positive, and the coefficients of Xinjiang, Heilongjiang, Liaoning, Jilin and other places have changed from negative to positive, implying that the higher the population density, the higher the carbon emission level of the regional transportation industry, and there is no carbon reduction effect. The higher the population density, the more in the flow frequency and scale of people and logistics caused by urban density. Without changing the transportation energy structure, the higher population density will lead to an increase in the carbon emissions of the transportation industry.
The impact of investment in fixed assets in the transportation industry. The coefficients of the fixed asset investment proportion of the transportation industry presents a spatial distribution pattern of high in the eastern region and low in the western region. Among them, the coefficients in western regions such as Ningxia, Gansu, Xinjiang, and Chongqing are negative, and the coefficient in other regions are positive, indicating that the increase in the proportion of fixed asset investment in the transportation industry has a carbon reduction effect on the transportation industry in the western region, while it is not obvious in other regions. Increasing highway mileage has become the main direction of fixed asset investment in the transportation industry in the sample provinces and cities. In 2018, the average value of fixed asset investment in the transportation industry in the 30 sample provinces and cities was 91.23%. Especially in Ningxia, Gansu, Xinjiang, Chongqing and other western regions, the proportion of fixed asset investment for roads in the transportation industry was 95.20%, 97.6%, 99.53%, and 93.94%, which far exceeded the national average, and the improvement of transportation conditions has greatly reduced the energy consumption of vehicles, and produced emission reduction effects. At the same time, compared to the western region, other regions have relatively complete roads and other transportation infrastructures, and the marginal effect of the decrease in energy consumption of vehicles brought about by the increase of highway mileage is relatively low, and the incremental effect of increasing carbon emissions is large.

5. Discussion

This article analyzes the spatiotemporal heterogeneity of the carbon emissions in the transportation industry from 2012 to 2018, and the results suggest that the carbon emission level of China’s transportation industry has been generally rising steadily. The lowest emission regions are small and concentrated in the western region, and the lower emission regions are large and gathered in the central and northeastern region. The number of medium emission regions are growing rapidly and located in the central region, there are few high emission regions and most of them are situated in the eastern region. From the local difference perspective, there are few “High-High” clusters, and they are concentrated in the eastern coastal developed areas. Meanwhile, “High-Lower” clusters are few and distributed in Guangdong Province, and “Lower-Lower” clusters are also few and gathered in the western region. At the same time, cold spots are mainly distributed in the western region, and hot spots are concentrated in the central and eastern regions. This result is similar to another study, in which the spatial autocorrelation analysis verifies a positive spatial aggregation effect, with high-high aggregation in the east and low-low aggregation in the northwest [48]. Related research has explored the carbon emissions and driving factors in various regions of China, and the results show that the carbon emission levels of eastern provinces such as Guangdong, Zhejiang, and Jiangsu are much higher than other provinces in China [49], provinces which located in the eastern coastal areas of China such as Beijing, Tianjin, Hebei, and Jiangsu have the highest carbon emissions in the country, while Gansu, Qinghai, and provinces have the lowest carbon emissions [50], and our results confirm this spatial heterogeneity of carbon emission in the transportation industry.
The GTWR model is used in this study to analyze the carbon emission effect of the technological innovation on the transportation industry, and the result shows that the impact of technological innovation on the carbon emission level of the transportation industry differs greatly. In most sample provinces, technological innovation in the transportation industry has not yet played a positive role in reducing carbon emissions. Those samples with carbon reduction effects are mainly concentrated in the eastern and northeastern regions, indicating a spatial heterogeneity of the carbon reduction effect. Similar results were also found by Yang, Z., Y. Zhang and J. Yin. [51]. However, the quadratic coefficients of the technological innovation of the transportation industry in most regions is negative, and the coefficient in the western region is lower than that in the eastern region, showing an obvious “inverted U-shaped” relationship between the technological innovation and the carbon emissions of the transportation industry, and when it breaks through the technical pain points, this carbon reduction effect is more effective in the western region than in the eastern region. This result indicates an “inverted U-shaped” relationship between the number of patents and carbon dioxide emissions [52]. The impact of increased innovation capabilities on carbon dioxide emissions differs in different regions: some regions are n-shaped, while others have U-shaped associations [53].
Finally, we also analyze the influence of other factors on the carbon emission in the transportation industry, and the results indicate that other influence of these factors vary. Economic development will reduce the carbon emission level of the transportation industry in the north, but it has not played a positive role in carbon emission reduction in the south. This is consistent with the conclusion that GDP per capita has different effects on transportation carbon emissions according to the development stage of different cities [54]. The increasing proportion of the fiscal expenditure on the transportation industry has played a vital role in reducing the carbon emissions of the transportation industry in the northeast and in the Pearl River Basin, especially the fiscal subsidies for waterway transportation. However, due to the differentiated industrial structure, the marginal effect of fiscal expenditure on carbon reduction in the Yellow River and Yangtze River basins is not obvious. This suggests fiscal expenditure has not played a positive role in reducing carbon. This result is similar to Cheng, S., et al. [55] who explores how local government fiscal expenditures will affect CO2 emissions in Chinese cities. Improvement in higher education rates has a carbon reduction effect on the transportation industry in the eastern, central and northeastern regions, and the key is the technological innovation ability promoted by the higher education level, and this result confirmed the conclusions by Zaman, Q. U., et al. [56]. Meanwhile, the higher the population density, the higher the carbon emission level of the regional transportation industry, and there is no carbon reduction effect. This is similar to the previous research view, which believes that an increase in population density will increase greenhouse gas emissions [57,58]. In addition, the increasing proportion of fixed asset investment in the transportation industry has a carbon reduction effect on the transportation industry in the western region, though such an effect is not obvious in other regions. This result shows the same conclusion to that of road investments with regards to its promotion a greater emission reduction in CO2 in China [59]. The main reason is that the marginal effect of the improvement of the traffic infrastructure in the western region is better than that of other regions.
Compared with the empirical findings of the current study, we have found similar conclusions to previous studies with some difference. We confirm the growth trend of transportation carbon dioxide emissions in China, as B, Bo Wang A, et al. [60]. However, we find the “inverted U-shaped” relationship between the technological innovation and the carbon emissions of the transportation industry, not the linear relationship as Zhao, P., et al. [61]. In addition, we confirm that the factors affecting carbon dioxide emissions in China’s transportation are heterogeneous in spatial distribution, similar to Yang, X., et al. [62]. However, our study has several limitations. First, the study period was from 2012 to 2018. For data limitation, we did not extend the data to 2019 or before 2012, and statistical bias may underestimate the carbon reduction effect. Second, the technological innovation level was not valued by the number of patent and investment in the transportation industry. This might have resulted in underestimation of carbon reduction effect. Third, this paper directly analyzed the carbon reduction effect of the technological innovation in the transportation industry, but did not conduct an empirical analysis on the medium mechanism. Therefore, we may have to empirically analyze the mediation mechanism in a further study.

6. Conclusions and Policy Implications

In this study, using the GTWR model, we empirically analyze the carbon emission reduction effect of technological innovation on the transportation industry from the spatiotemporal perspective in China. The spatiotemporal evolutionary trend and spatial autocorrelation of the carbon emission in the transportation industry is also analyzed by using the local Moran’s index and Getis-Ord Gi index. And the carbon emission of China’s transportation industry has shown an increasing trend with the improvement of the level of economic development, and carbon reduction effect of technological innovation on the transportation industry varies by regions. There is an obvious “inverted U-shaped” relationship between technological innovation and carbon emission in the transportation industry in China. This means that the government’s long-term investment in technological innovation in the transportation industry will inhibit carbon emissions after the initial stage of technological breakthroughs. The impact of other factors on carbon emissions in the transportation industry also shows regional heterogeneity.
During the “14th Five-Year Plan” period, green transportation development is an important measure for China to implement the green development, and technological innovation is a critical factor in this. Based on the conclusions above, the policy implications are as follows:
Firstly, continuously promote the low-carbon development of transportation industry in China. The green and coordinated development mode is a development approach proposed by China facing global environmental governance tendency [13]. Emission reduction in the transportation industry is an effective way for China to get rid of the dual-carbon constraint. On the one hand, we should adhere to strengthen the national green development direction, pay attention to the low-carbon development of the transportation industry, and highlight the carbon emission reduction effects of technological innovation. We should also promote the transformation and upgrading of conventional fuels in the traditional transportation industry, and accelerate the popularization of automobile energy-saving technology and the construction of hydrogen energy utilization and storage sites, to let technological innovation play a more prominent role in alleviating the pressure on China’s transportation energy environment. On the other hand, we should improve the precise configuration of transportation service efficiency and apply modern internet means and big data operation management to the optimized configuration of transportation intensity, to improve the comprehensive transportation intelligence level and network management capabilities and reduce transportation carbon emissions efficiently.
Secondly, it is important to promote the low-carbon transformation of the transportation industry with technological innovation. The impact of transportation technology on transportation carbon emissions presents an “inverted U-shaped” relationship, showing that it is necessary to break through the initial stage of the slow effect of transportation technology development on carbon emissions, and insist on long-term support for transportation research [52]. In terms of the government’s top-level design, a comprehensive development plan for technological innovation in the transportation industry should be formulated, the long-term and basic nature of technological innovation should be highlighted, and long-term planning and investment in technological innovation in the transportation industry should be focused on. At the same time, strengthen green energy technology innovation, and continuous research is needed especially in the fields with long R&D cycles and strong foundations such as battery energy storage technology, clean electric energy conversion and electric motors, etc., to create a batch of original technological innovations in the transportation industry, and change the energy structure of the transportation industry and the structure of transportation vehicles. In addition, we must establish a market-based, enterprise-led, and government-assisted integration system for the transformation of scientific and technological achievements of enterprises, universities, and scientific research institutes, as well as a platform for transportation data sharing and technology exchange to accelerate the transformation of technological intellectual property into economic value.
Thirdly, we must highlight the regional differentiation of the emission reduction effects of technological innovation. Strengthening the construction of transportation science and technology is an important way to reduce transportation carbon emissions in various regions. The government should pay more attention to the regional balance of transportation technology development while paying attention to the construction of scientific and technological innovation capabilities [54]. It is necessary to give full use to the advantages of Beijing, Shanghai, Zhejiang and other eastern regions in the transportation industry in terms of numerous technology innovation carriers, flexible innovation systems, and high-level talents to focus on building a national key laboratory and a transportation technology research center dedicated to innovation and low-carbon transportation technology, rely on the cooperation of universities and scientific research institutions in various provinces to form a transportation technology innovation consortium, and shape a technological innovation highland of the national transportation industry, and pay attention to the leading role of technological innovation and emission reduction demonstration in the transportation industry. The central-western and the northeastern regions can focus on the transformation of scientific and technological innovation achievements to build an innovative transformation platform for new energy vehicles and other transportation industry technologies, and form multiple highlands of technological innovation, application, and transformation in the transportation industry.
Fourthly, it is important to strengthen financial and human resources support for the low-carbon transformation of the transportation industry. Transportation technology investment is an important public strategic investment in the national budget system. A stable transportation technology investment mechanism should be established to ensure the support of transportation budget for transportation technology innovation. Give full commitment to the financial support of the central and local governments for transportation technology, guide and promote the incentive effect of market factors, give preferential policies to enterprises and units with strong technological innovation capabilities in transportation technology, and establish scientific research funds with financial support, social investment, and financial capital as the mainstay to support technological innovation. At the same time, make use of the talents in institutions like universities and research institutes and strengthen scientific research investment and discipline construction in transportation. In particular, we should encourage and support universities and research institutes to introduce high-level talents in transportation technology and promote the construction of a low-carbon transportation talent team guided by leaders to provide strong talent support for the low-carbonization of the transportation industry.

Author Contributions

Conceptualization, L.Z.; Data curation, L.Z.; Formal analysis, L.Z.; Methodology, T.S. and J.C.; Writing—original draft, L.Z.; Writing—review and editing, T.S. and S.S. All authors have read and agreed to the published version of the manuscript.

Funding

This research was granted by National Social Science Foundation of China(2020JCY064).

Institutional Review Board Statement

Not applicable.

Informed Consent Statement

Not applicable.

Data Availability Statement

The provincial transportation industry carbon emissions dataset can be derived from Carbon Emission Accouts & Datasets (CEADs; https://www.ceads.net/data/province/, last accessed on 22 June 2021). The innv_1, expfi, rinvt dateset can be derived from China Transportation Statistical Yearbook (https://data.cnki.net/yearbook/Single/N2021040178, last accessed on 24 June 2021). The rgdp, aedu, rdensity dateset can be derived from China Statistical Yearbook (https://data.cnki.net/yearbook/Single/N2020100004, last accessed on 17 June 2021).

Conflicts of Interest

The authors declare no conflict of interest.

References

  1. Zhou, Y.; Fang, W.; Li, M.; Liu, W. Exploring the impacts of a low-carbon policy instrument: A case of carbon tax on transportation in China. Resour. Conserv. Recycl. 2018, 139, 307–314. [Google Scholar] [CrossRef]
  2. Zhang, J.; Jin, W.; Philbin, S.; Lu, Q.-C.; Ballesteros-Pérez, P.; Skitmore, M.; Li, H. Impact of Environmental Regulations on Carbon Emissions of Transportation Infrastructure: China’s Evidence. Clean. Responsible Consum. 2021, 2, 100010. [Google Scholar] [CrossRef]
  3. Lu, S.; Jiang, H.; Liu, Y.; Huang, S. Regional disparities and influencing factors of Average CO 2 Emissions from transportation industry in Yangtze River Economic Belt. Transp. Res. Part D Transp. Environ. 2017, 57, 112–123. [Google Scholar] [CrossRef]
  4. Liu, M.; Zhang, X.; Zhang, M.; Feng, Y.; Liu, Y.; Wen, J.; Liu, L. Influencing factors of carbon emissions in transportation industry based on CD function and LMDI decomposition model: China as an example. Environ. Impact Assess. Rev. 2021, 90, 106623. [Google Scholar] [CrossRef]
  5. Zhang, N.; Wei, X. Dynamic total factor carbon emissions performance changes in the Chinese transportation industry. Appl. Energy 2015, 146, 409–420. [Google Scholar] [CrossRef]
  6. Danish; Ulucak, R. Renewable energy, technological innovation and the environment: A novel dynamic auto-regressive distributive lag simulation. Renew. Sustain. Energy Rev. 2021, 150, 111433. [Google Scholar] [CrossRef]
  7. Ali, S.A.; Alharthi, M.; Hussain, H.I.; Rasul, F.; Hanif, I.; Haider, J.; Ullah, S.; ur Rahman, S.; Abbas, Q. A clean technological innovation and eco-efficiency enhancement: A multi-index assessment of sustainable economic and environmental management. Technol. Forecast. Soc. Chang. 2021, 166, 120573. [Google Scholar] [CrossRef]
  8. Ma, Q.; Murshed, M.; Khan, Z. The nexuses between energy investments, technological innovations, emission taxes, and carbon emissions in China. Energy Policy 2021, 155, 112345. [Google Scholar] [CrossRef]
  9. Khan, Z.; Malik, M.Y.; Latif, K.; Jiao, Z. Heterogeneous effect of eco-innovation and human capital on renewable & non-renewable energy consumption: Disaggregate analysis for G-7 countries. Energy 2020, 209, 118405. [Google Scholar] [CrossRef]
  10. Zhang, J.; Chang, Y.; Zhang, L.; Li, D. Do technological innovations promote urban green development?—A spatial econometric analysis of 105 cities in China. J. Clean. Prod. 2018, 182, 395–403. [Google Scholar] [CrossRef]
  11. Zhang, Y.-J.; Jiang, L.; Shi, W. Exploring the growth-adjusted energy-emission efficiency of transportation industry in China. Energy Econ. 2020, 90, 104873. [Google Scholar] [CrossRef]
  12. Dong, F.; Yu, B.; Hadachin, T.; Yuanju, D.; Wang, Y.; Zhang, S.; Long, R. Drivers of carbon emission intensity change in China. Resour. Conserv. Recycl. 2018, 129, 187–201. [Google Scholar] [CrossRef]
  13. Ma, Q.; Jia, P.; Kuang, H. Green efficiency changes of comprehensive transportation in China: Technological change or technical efficiency change? J. Clean. Prod. 2021, 304, 127115. [Google Scholar] [CrossRef]
  14. Yu, Y.; Li, S.; Sun, H.; Taghizadeh-Hesary, F. Energy carbon emission reduction of China’s transportation sector: An input–output approach. Econ. Anal. Policy 2021, 69, 378–393. [Google Scholar] [CrossRef]
  15. Bach, H.; Bergek, A.; Bjørgum, Ø.; Hansen, T.; Kenzhegaliyeva, A.; Steen, M. Implementing maritime battery-electric and hydrogen solutions: A technological innovation systems analysis. Transp. Res. Part D Transp. Environ. 2020, 87, 102492. [Google Scholar] [CrossRef]
  16. Fan, Y.; Peng, B.-B.; Xu, J.-H. The effect of technology adoption on CO2 abatement costs under uncertainty in China’s passenger car sector. J. Clean. Prod. 2017, 154, 578–592. [Google Scholar] [CrossRef]
  17. Dillman, K.; Czepkiewicz, M.; Heinonen, J.; Fazeli, R.; Davidsdottir, B.; Shafiei, E. Decarbonization scenarios for Reykjavik’s passenger transport: The combined effects of behavioural changes and technological developments. Sustain. Cities Soc. 2020, 65, 102614. [Google Scholar] [CrossRef]
  18. Haftor, D.M.; Climent, R.C. CO2 reduction through digital transformation in long-haul transportation: Institutional entrepreneurship to unlock product-service system innovation. Ind. Mark. Manag. 2021, 94, 115–127. [Google Scholar] [CrossRef]
  19. Li, B.; Ma, Z.; Hidalgo-Gonzalez, P.; Lathem, A.; Fedorova, N.; He, G.; Zhong, H.; Chen, M.; Kammen, D. Modeling the impact of EVs in the Chinese power system: Pathways for implementing emissions reduction commitments in the power and transportation sectors. Energy Policy 2021, 149, 111962. [Google Scholar] [CrossRef]
  20. Zhao, J.; Xi, X.; Na, Q.; Wang, S.; Kadry, S.N.; Kumar, M.P. The technological innovation of hybrid and plug-in electric vehicles for environment carbon pollution control. Environ. Impact Assess. Rev. 2021, 86, 106506. [Google Scholar] [CrossRef]
  21. Yang, X.; Lin, S.; Li, Y.; He, M. Can high-speed rail reduce environmental pollution? Evidence from China. J. Clean. Prod. 2019, 239, 118135. [Google Scholar] [CrossRef]
  22. Sun, X.; Yan, S.; Liu, T.; Wu, J. High-speed rail development and urban environmental efficiency in China: A city-level examination. Transp. Res. Part D Transp. Environ. 2020, 86, 102456. [Google Scholar] [CrossRef]
  23. Jia, R.; Shao, S.; Yang, L. High-speed rail and CO2 emissions in urban China: A spatial difference-in-differences approach. Energy Econ. 2021, 99, 105271. [Google Scholar] [CrossRef]
  24. Erdoğan, S.; Yıldırım, S.; Yıldırım, D.Ç.; Gedikli, A. The effects of innovation on sectoral carbon emissions: Evidence from G20 countries. J. Environ. Manag. 2020, 267, 110637. [Google Scholar] [CrossRef]
  25. Liu, Y.; Li, Z.; Yin, X. Environmental regulation, technological innovation and energy consumption—A cross-region analysis in China. J. Clean. Prod. 2018, 203, 885–897. [Google Scholar] [CrossRef]
  26. Zhang, C.; Nian, J. Panel estimation for transport sector CO2 emissions and its affecting factors: A regional analysis in China. Energy Policy 2013, 63, 918–926. [Google Scholar] [CrossRef]
  27. Ye, L.; Xie, N.; Hu, A. A novel time-delay multivariate grey model for impact analysis of CO2 emissions from China’s transportation sectors. Appl. Math. Model. 2020, 91, 493–507. [Google Scholar] [CrossRef]
  28. Bai, C.; Zhou, L.; Minle, X.; Feng, C. Analysis of the spatial association network structure of China’s transportation carbon emissions and its driving factors. J. Environ. Manag. 2019, 253, 109765. [Google Scholar] [CrossRef]
  29. Liu, C.; Li, W.; Wang, W.; Zhou, H.; Liang, T.; Hou, F.; Xu, J.; Xue, P. Quantitative spatial analysis of vegetation dynamics and potential driving factors in a typical alpine region on the northeastern Tibetan Plateau using the Google Earth Engine. Catena 2021, 206, 105500. [Google Scholar] [CrossRef]
  30. Chao, W.; Wood, J.; Wang, Y.; Geng, X.; Long, X. CO2 emission in transportation sector across 51 countries along the Belt and Road from 2000 to 2014. J. Clean. Prod. 2020, 266, 122000. [Google Scholar] [CrossRef]
  31. Catchpole, S.; Rivera, R.; Hernández, C.; De la Peña, J.; González, P. Predicting spatial distribution patterns and hotspots of fish assemblage in a coastal basin of the central-south of Chile, by geostatistical techniques. J. Limnol. 2019, 78. [Google Scholar] [CrossRef] [Green Version]
  32. Huang, B.; Wu, B.; Barry, M. Geographically and Temporally Weighted Regression for Modeling Spatio-Temporal Variation in House Prices. Int. J. Geogr. Inf. Sci. 2010, 24, 383–401. [Google Scholar] [CrossRef]
  33. Shi, T.; Zhang, W.; Zhou, Q.; Wang, K. Industrial structure, urban governance and haze pollution: Spatiotemporal evidence from China. Sci. Total Environ. 2020, 742, 139228. [Google Scholar] [CrossRef] [PubMed]
  34. Brunsdon, C.; Fotheringham, A.; Charlton, M. Geographically Weighted Summary Statistics—A Framework for Localised Exploratory Data Analysis. Comput. Environ. Urban Syst. 2002, 26, 501–524. [Google Scholar] [CrossRef] [Green Version]
  35. Xie, R.; Wei, D.; Han, F.; Lu, Y.; Fang, J.; Yu, L.; Wang, J. The effect of traffic density on smog pollution: Evidence from Chinese cities. Technol. Forecast. Soc. Chang. 2018, 144, 421–427. [Google Scholar] [CrossRef]
  36. Zaekhan, Z.; Nachrowi, N. The lmpact of Renewable Energy and GDP per Capita on Carbon Dioxide Emission in the G-20 Countries. Econ. Financ. Indones. 2015, 60, 145. [Google Scholar] [CrossRef]
  37. Wang, L.; Zhao, Z.; Wang, X.; Xue, X. Transportation de-carbonization pathways and effect in China: A systematic analysis using STIRPAT-SD model. J. Clean. Prod. 2020, 288, 125574. [Google Scholar] [CrossRef]
  38. Wu, N.; Liu, Z. Higher education development, technological innovation and industrial structure upgrade. Technol. Forecast. Soc. Chang. 2021, 162, 120400. [Google Scholar] [CrossRef]
  39. Wu, J.; Wu, Y.; Guo, X. Urban Density and Carbon Emissions in China. 2016, Volume 1, pp. 479–499. Available online: https://www.jstor.org/stable/j.ctt1rrd7n9.27?seq=1#metadata_info_tab_contents (accessed on 4 September 2021). [CrossRef]
  40. Wanke, P.; Chen, Z.; Dong, Q.; Antunes, J. Transportation Sustainability, Macroeconomics, and Endogeneity in China: A Hybrid Neural-Markowitz-Variable Reduction Approach. Technol. Forecast. Soc. Chang. 2021, 170, 120860. [Google Scholar] [CrossRef]
  41. Melecky, L. Spatial Autocorrelation Method for Local Analysis of The EU. Procedia Econ. Financ. 2015, 23, 1102–1109. [Google Scholar] [CrossRef] [Green Version]
  42. Hu, K.; Luo, Q.; Qi, K.; Yang, S.; Mao, J.; Fu, X.; Zheng, J.; Wu, H.; Guo, Y.; Zhu, Q. Understanding the topic evolution of scientific literatures like an evolving city: Using Google Word2Vec model and spatial autocorrelation analysis. Inf. Process. Manag. 2019, 56, 1185–1203. [Google Scholar] [CrossRef]
  43. Ren, H.; Shang, Y.; Zhang, S. Measuring the spatiotemporal variations of vegetation net primary productivity in Inner Mongolia using spatial autocorrelation. Ecol. Indic. 2020, 112, 106108. [Google Scholar] [CrossRef]
  44. Zhang, J.; Zhang, K.; Zhao, F. Research on the regional spatial effects of green development and environmental governance in China based on a spatial autocorrelation model. Struct. Chang. Econ. Dyn. 2020, 55, 1–11. [Google Scholar] [CrossRef]
  45. Hu, X.; Ma, C.; Huang, P.; Guo, X. Ecological vulnerability assessment based on AHP-PSR method and analysis of its single parameter sensitivity and spatial autocorrelation for ecological protection—A case of Weifang City, China. Ecol. Indic. 2021, 125, 107464. [Google Scholar] [CrossRef]
  46. Lu, S.; Li, J.; Guan, X.; Gao, X.; Gu, Y.; Zhang, D.; Mi, F.; Li, D. The evaluation of forestry ecological security in China: Developing a decision support system. Ecol. Indic. 2018, 91, 664–678. [Google Scholar] [CrossRef]
  47. Li, L.; McMurray, A.; Li, X.; Gao, Y.; Xue, J. The diminishing marginal effect of R&D input and carbon emission mitigation. J. Clean. Prod. 2021, 282, 124423. [Google Scholar] [CrossRef]
  48. Wang, Y.; Song, J.; Yang, W.; Fang, K.; Duan, H. Seeking spatiotemporal patterns and driving mechanism of atmospheric pollutant emissions from road transportation in china. Resour. Conserv. Recycl. 2020, 162, 105032. [Google Scholar] [CrossRef]
  49. Zhang, K.; Liu, X.; Yao, J. Identifying the driving forces of CO2 emissions of China’s transport sector from temporal and spatial decomposition perspectives. Environ. Sci. Pollut. Res. 2019, 26, 17383–17406. [Google Scholar] [CrossRef]
  50. Li, H.; Zhao, Y.; Qiao, X.; Liu, Y.; Ye, C.; Li, Y.; Wang, S.; Zhang, Z.; Zhang, Y.; Weng, J. Identifying the driving forces of national and regional CO 2 emissions in China: Based on temporal and spatial decomposition analysis models. Energy Econ. 2017, 68, 522–538. [Google Scholar] [CrossRef]
  51. Yang, Z.; Zhang, Y.; Yin, J. Energy technology patents-CO2 emissions nexus: An empirical analysis from China. Energy Policy 2012, 42, 248–260. [Google Scholar] [CrossRef]
  52. Li, W.; Elheddad, M.; Doytch, N. The impact of innovation on environmental quality: Evidence for the non-linear relationship of patents and CO2 emissions in China. J. Environ. Manag. 2021, 292, 112781. [Google Scholar] [CrossRef] [PubMed]
  53. Xu, B.; Lin, B. Investigating drivers of CO2 emission in China’s heavy industry: A quantile regression analysis. Energy 2020, 206, 118159. [Google Scholar] [CrossRef]
  54. Li, F.; Cai, B.; Ye, Z.; Wang, Z.; Zhang, W.; Zhou, P.; Chen, J. Changing patterns and determinants of transportation carbon emissions in Chinese cities. Energy 2019, 174, 562–575. [Google Scholar] [CrossRef]
  55. Cheng, S.; Chen, Y.; Meng, F.; Chen, J.; Liu, G.; Song, M. Impacts of local public expenditure on CO2 emissions in Chinese cities: A spatial cluster decomposition analysis. Resour. Conserv. Recycl. 2021, 164, 105217. [Google Scholar] [CrossRef]
  56. Zaman, Q.u.; Wang, Z.; Zaman, S.; Rasool, S.F. Investigating the nexus between education expenditure, female employers, renewable energy consumption and CO2 emission: Evidence from China. J. Clean. Prod. 2021, 312, 127824. [Google Scholar] [CrossRef]
  57. Wang, Q.; Li, L. The effects of population aging, life expectancy, unemployment rate, population density, per capita GDP, urbanization on per capita carbon emissions. Sustain. Prod. Consum. 2021, 28, 760–774. [Google Scholar] [CrossRef]
  58. Saleem, H.; Jiandong, W.; Zaman, K.; Elsherbini Elashkar, E.; Mohamd Shoukry, A. The impact of air-railways transportation, energy demand, bilateral aid flows, and population density on environmental degradation: Evidence from a panel of next-11 countries. Transp. Res. Part D Transp. Environ. 2018, 62, 152–168. [Google Scholar] [CrossRef]
  59. Yang, Q.; Hu, X.; Wang, Y.; Liu, Y.; Liu, J.; Ma, J.; Wang, X.; Wan, Y.; Hu, J.; Zhang, Z.; et al. Comparison of the impact of China’s railway investment and road investment on the economy and air pollution emissions. J. Clean. Prod. 2021, 293, 126100. [Google Scholar] [CrossRef]
  60. Wang, B.; Sun, Y.; Chen, Q.; Wang, Z. Determinants analysis of carbon dioxide emissions in passenger and freight transportation sectors in China. Struct. Chang. Econ. Dyn. 2018, 47, 127–132. [Google Scholar] [CrossRef]
  61. Zhao, P.; Zeng, L.; Li, P.; Lu, H.-y.; Hu, H.; Li, C.; Zheng, M.; Li, H.; Yu, Z.; Yuan, D.; et al. China’s transportation sector carbon dioxide emissions efficiency and its influencing factors based on the EBM DEA model with undesirable outputs and Spatial Durbin model. Energy 2021, 121934. [Google Scholar] [CrossRef]
  62. Yang, X.; Jia, Z.; Yang, Z.; Yuan, X. The effects of technological factors on carbon emissions from various sectors in China—A spatial perspective. J. Clean. Prod. 2021, 301, 126949. [Google Scholar] [CrossRef]
Figure 1. The development trend of the carbon emission level of China’s transportation industry from 2012 to 2018 (ad). Note: (1) the initial value in the grey legend is the minimum value of the sample, and it is automatically set by the ArcGIS 10.4 software system. (2) the province names are same to the figure below.
Atmosphere 12 01169 g001
Figure 2. The local spatial correlation of total carbon emission of the transportation industry (ad).
Atmosphere 12 01169 g002
Figure 3. The distribution map of spatial cold and hot spots of total carbon emission in the transportation industry (ad).
Atmosphere 12 01169 g003
Figure 4. The spatiotemporal differences in the impact of technological innovation on the carbon emissions level in the transportation industry (a,b).
Atmosphere 12 01169 g004
Figure 5. The spatiotemporal distribution of the impact coefficient of carbon emissions in the transportation industry (ae).
Atmosphere 12 01169 g005
Table 1. The descriptive statistics of variables.
VariableDescriptionUnitMeanStd. Dev.MinMax
totalCarbon emission in the transportation industryMt22.3213.640.4069.82
innv_1the number of transportation scientific research institutions 4.194.85027
innv_11Quadratic of innv_1 11.0913.670.0066.00
rgdpGDP per capitaCNY54,636.4725,048.6819,710.00140,211.20
expfithe proportion of fiscal expenditure on the transportation industry%6.732.312.6716.12
aeduhigh education levelperson2575.53781.061133.005534.00
rdensitypopulation densityperson/km2471.08702.807.933850.79
rinvtthe proportion of fixed assets investment in the transportation industry%3.633.230.3017.21
Note: (1) Obs. is 210; (2) Std. Dev. indicates standard deviation.
Publisher’s Note: MDPI stays neutral with regard to jurisdictional claims in published maps and institutional affiliations.

