Analysis of Spatiotemporal Variability in Extreme Climate and Potential Driving Factors on the Yunnan Plateau (Southwest China) during 1960–2019
Abstract
:1. Introduction
2. Study Area
3. Materials and Methods
3.1. Materials
3.2. Methods
3.2.1. Extreme Climate Indices
3.2.2. Statistical Methods
4. Result
4.1. Spatiotemporal Variation of Extreme Temperature Indices
4.2. Spatiotemporal Variation of Extreme Precipitation Indices
4.3. Co-Relationships of Extreme Climate Indices
4.4. Main Reasons for Changes in Extreme Climate Indices
4.4.1. The Influence of Geographic Location on Extreme Climate Indices Variation
4.4.2. The Influence of Atmospheric Circulation Patterns on Extreme Climate Indices Variation
5. Discussion
5.1. Variation Characteristics of Extreme Temperature Indices in Yunnan during 1960–2019
5.2. Variation Characteristics of Extreme Precipitation Indices in Yunnan during 1960–2019
5.3. Influencing Factors (Geographical Factors (Longitude, Latitude, and Altitude)) of Extreme Climate Characteristics in Yunnan
5.4. Influencing Factors (Atmospheric Circulation Patterns (NAO, AO, and NAO)) of Extreme Climate Characteristics in Yunnan
6. Conclusions
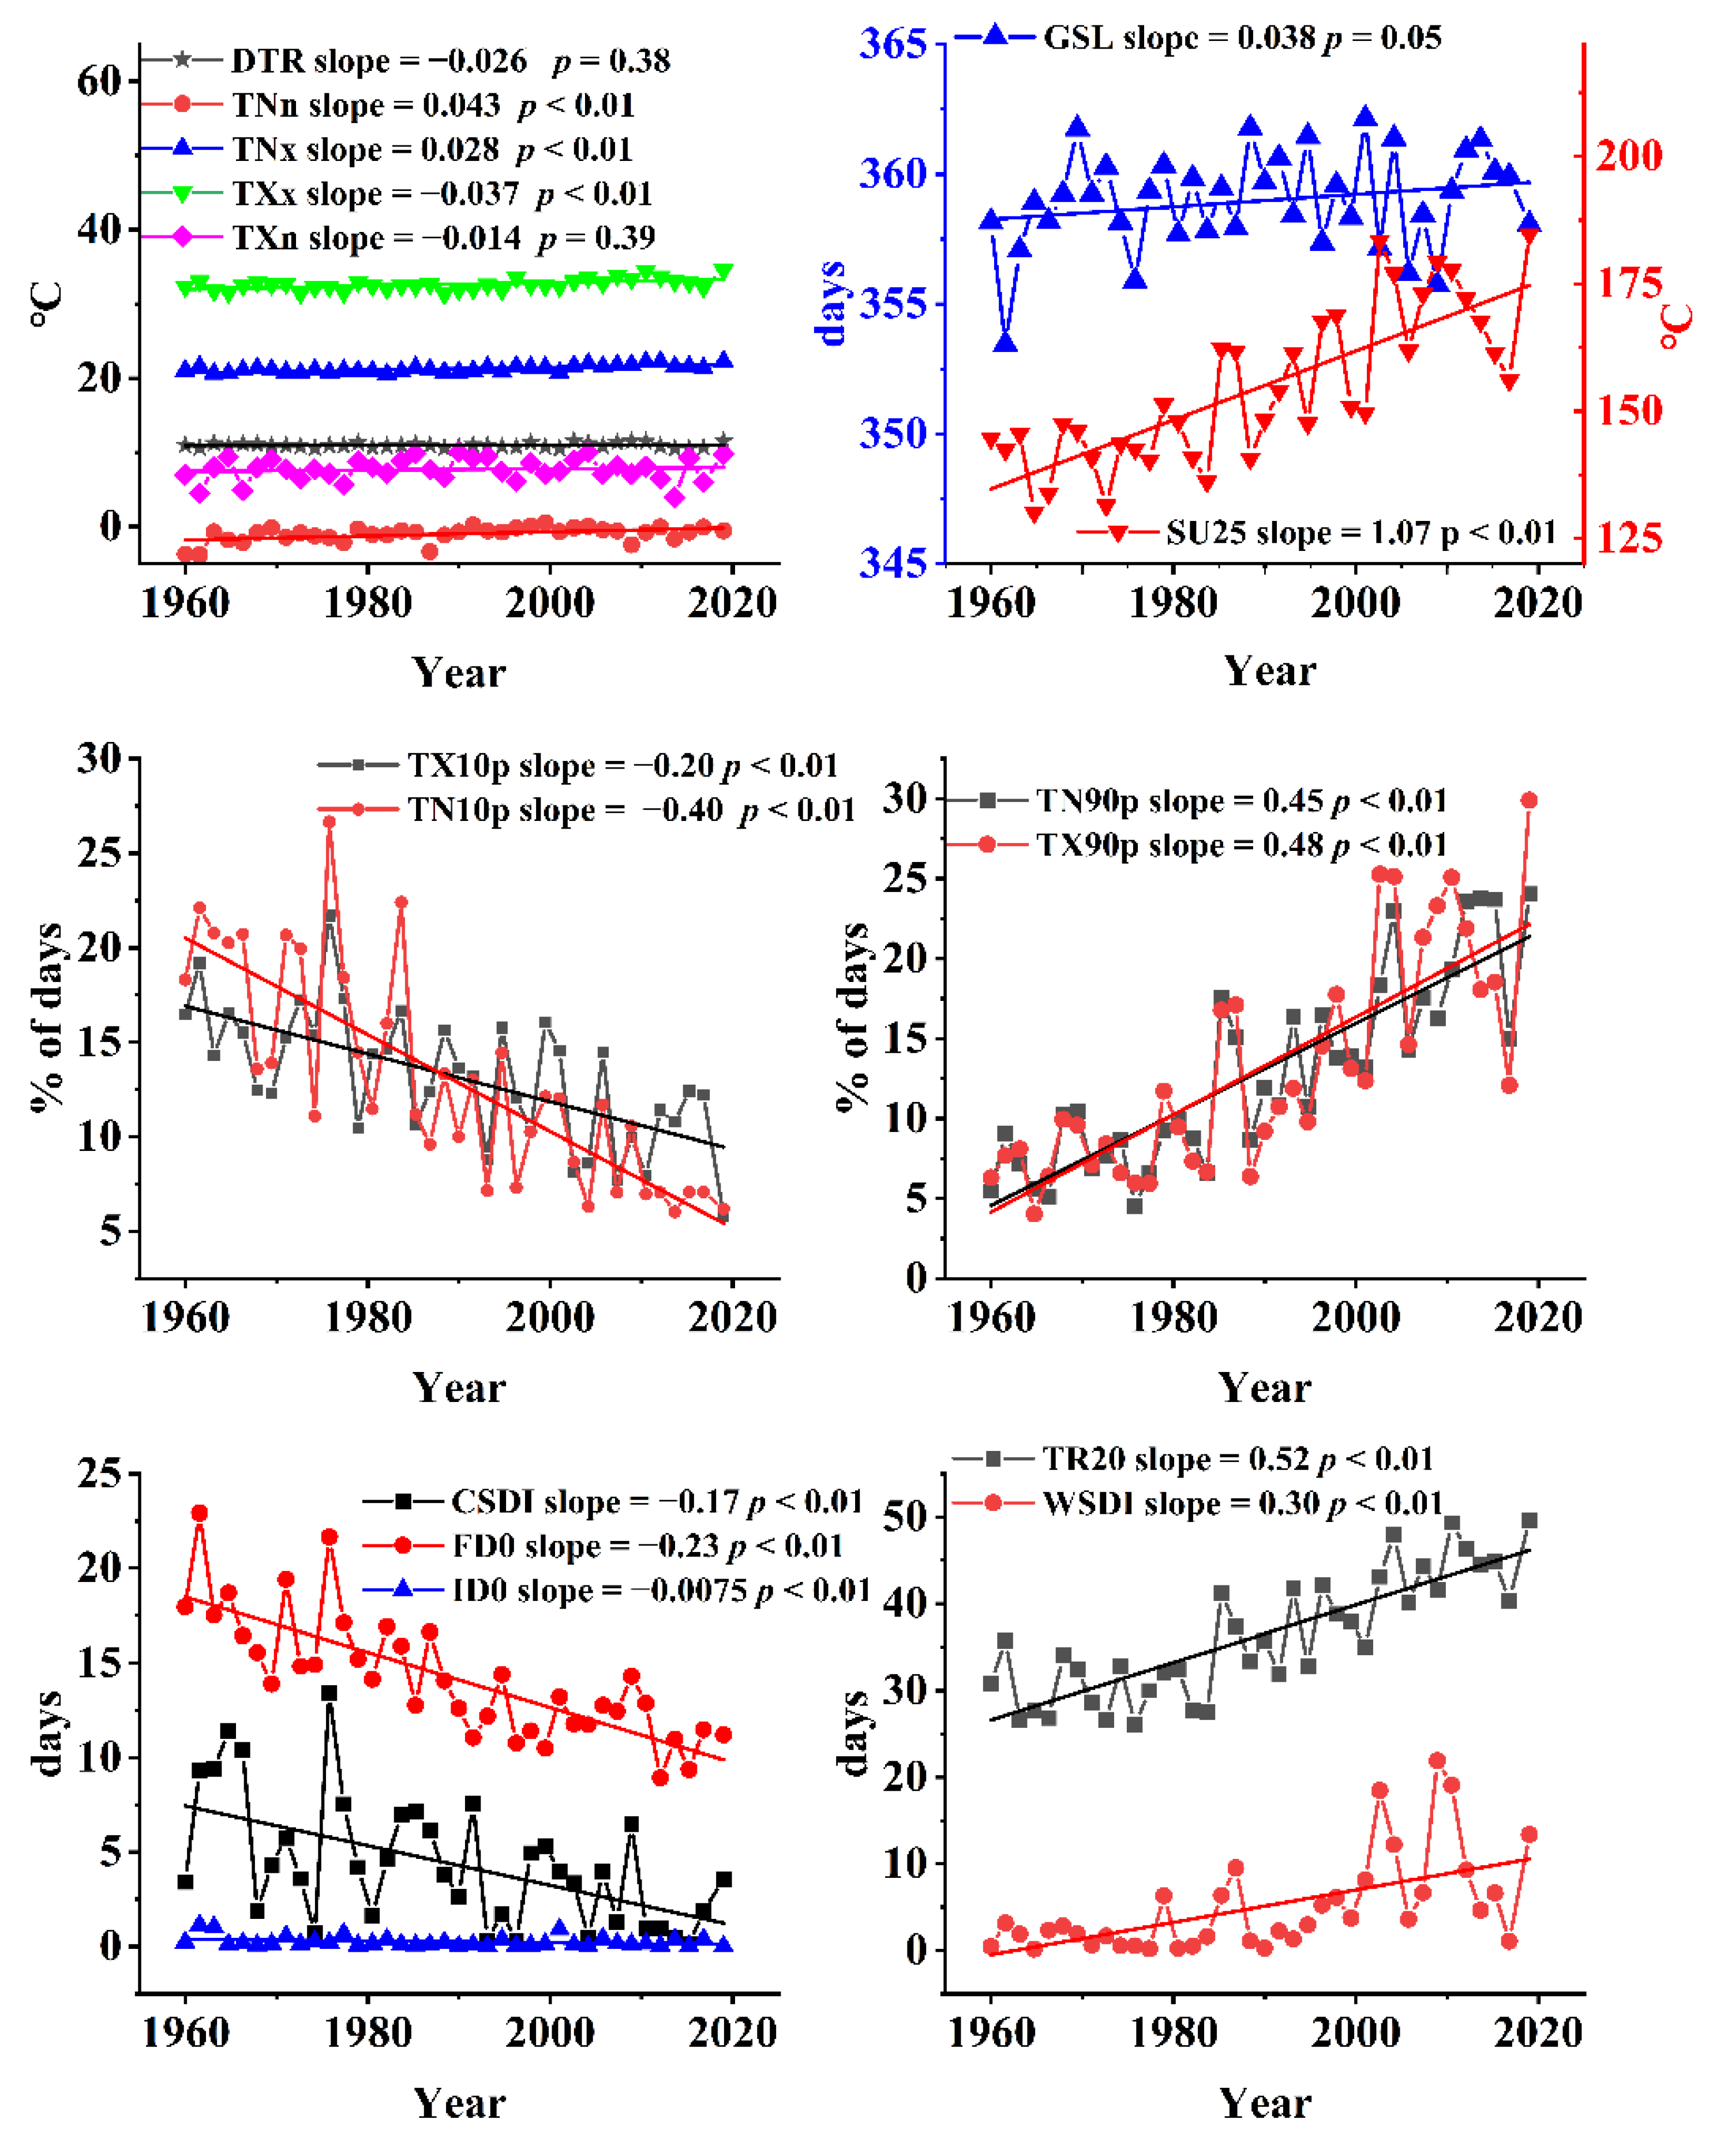
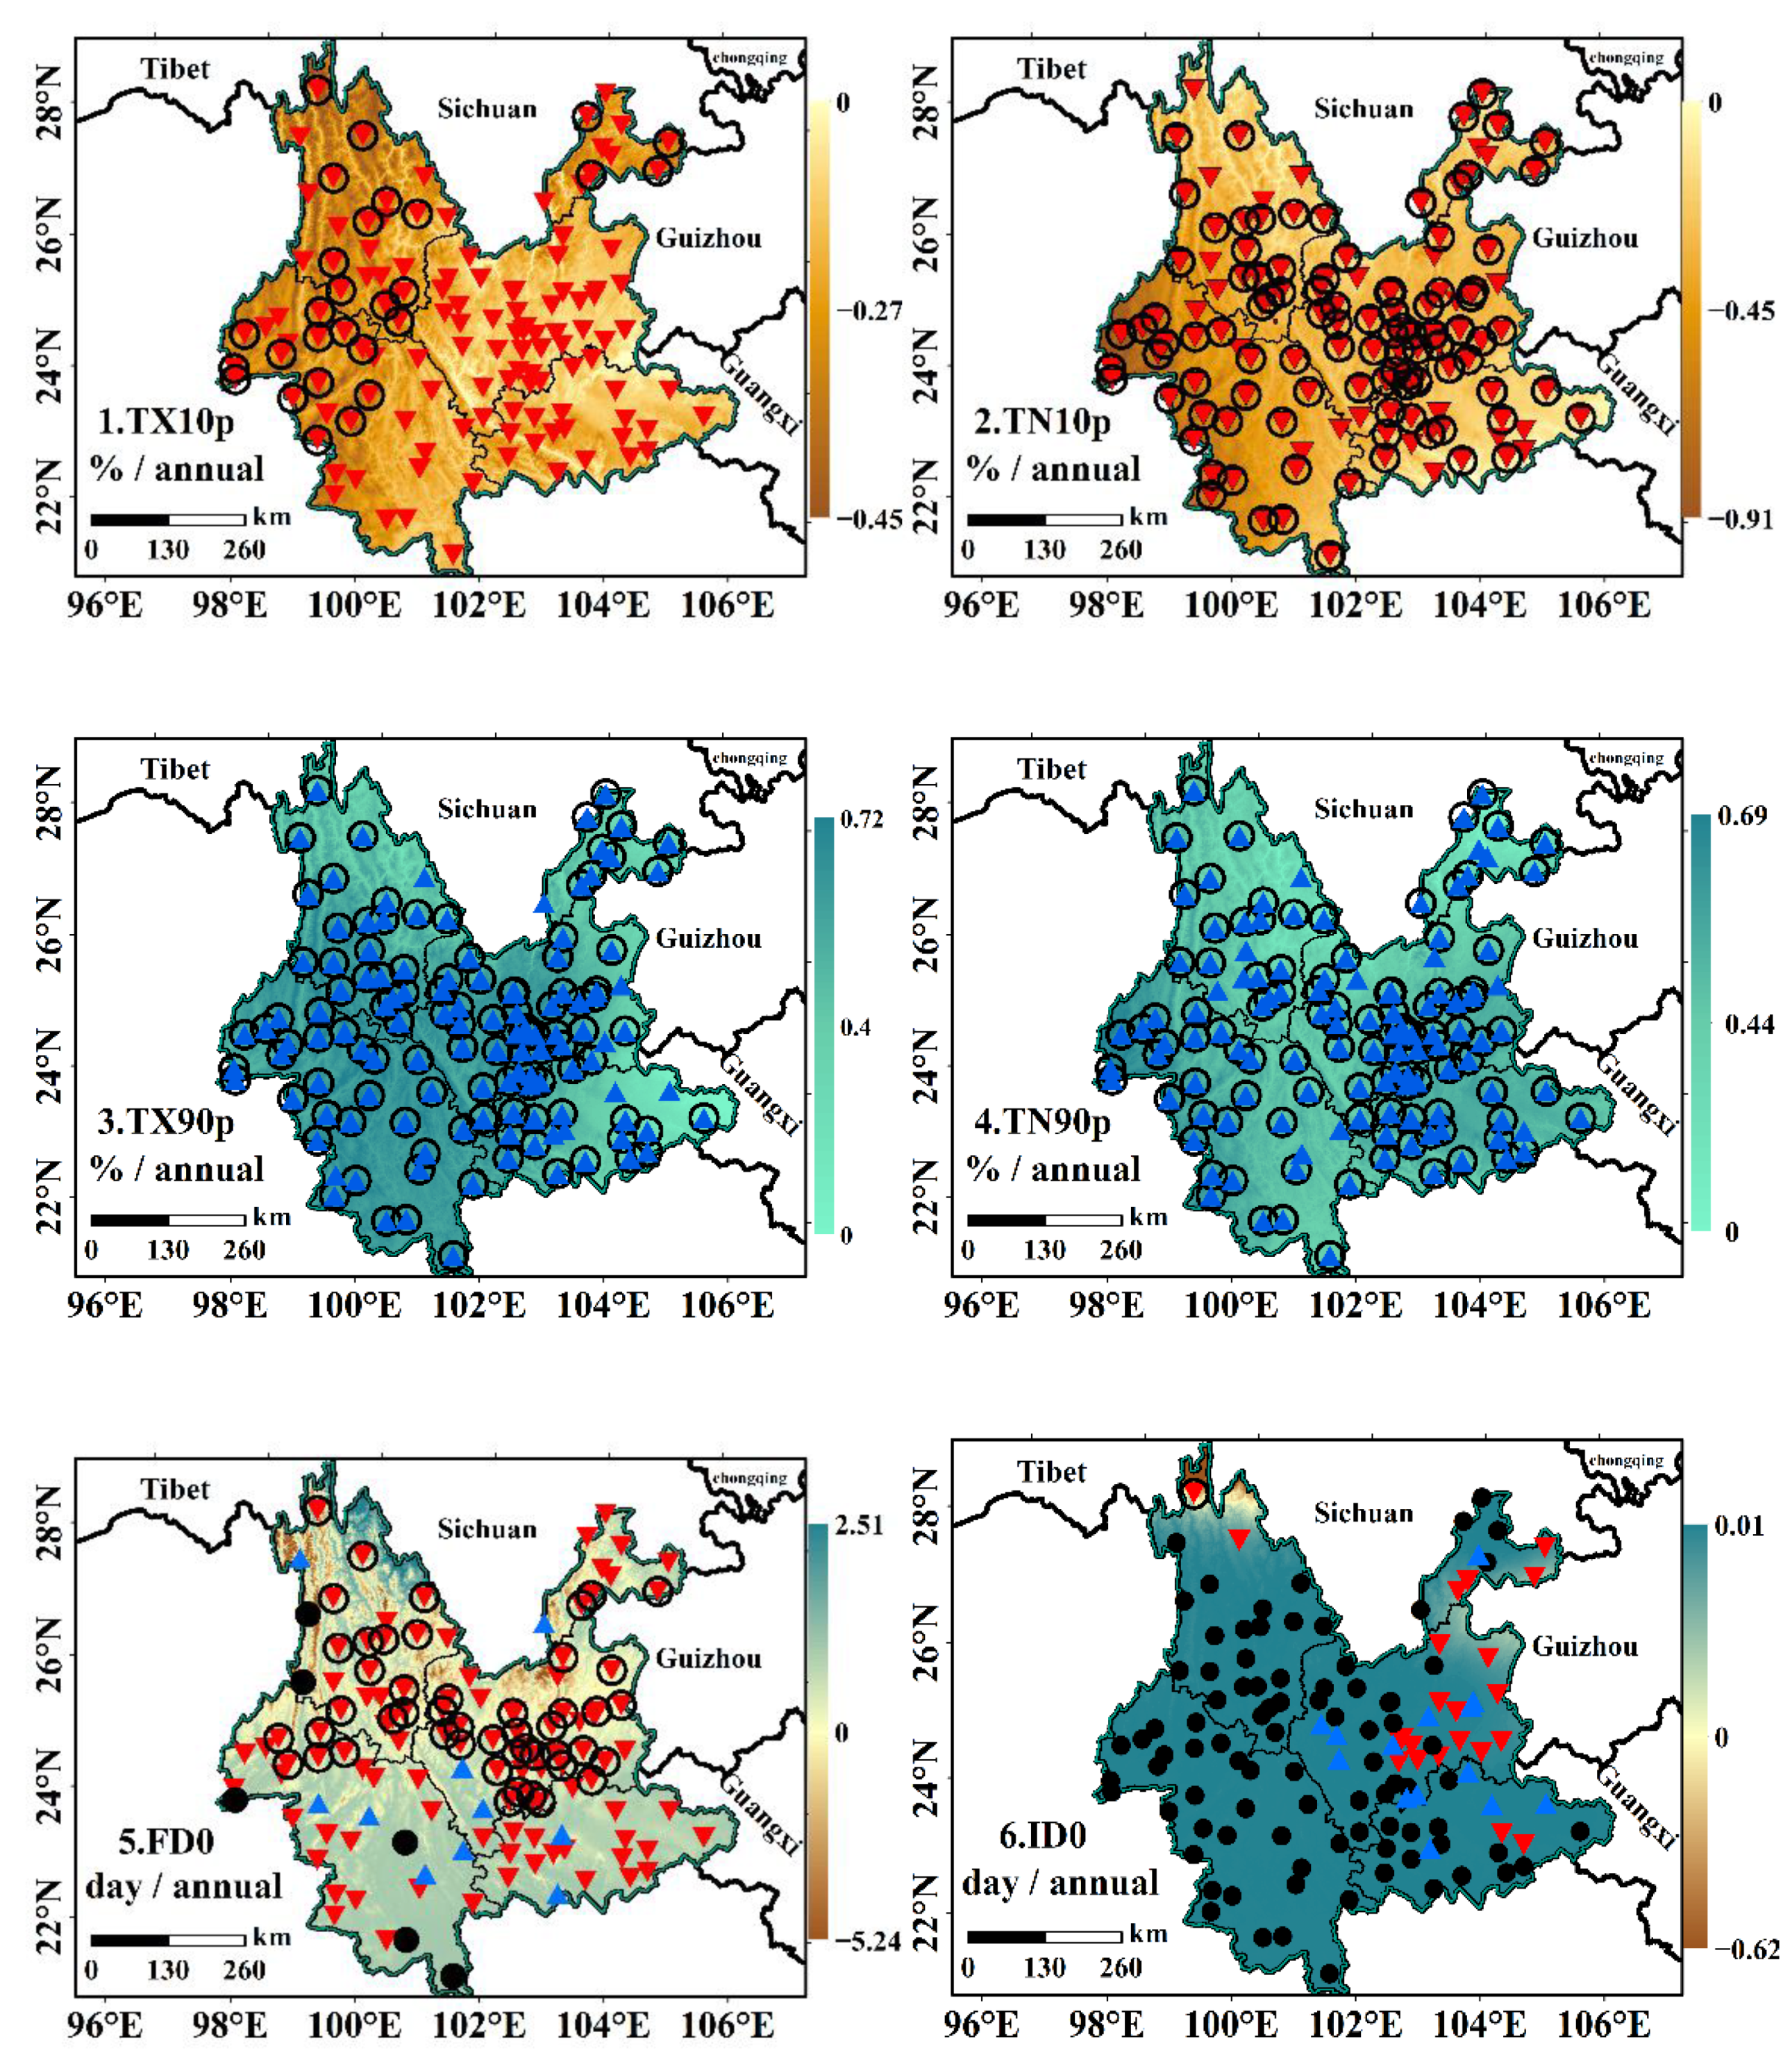
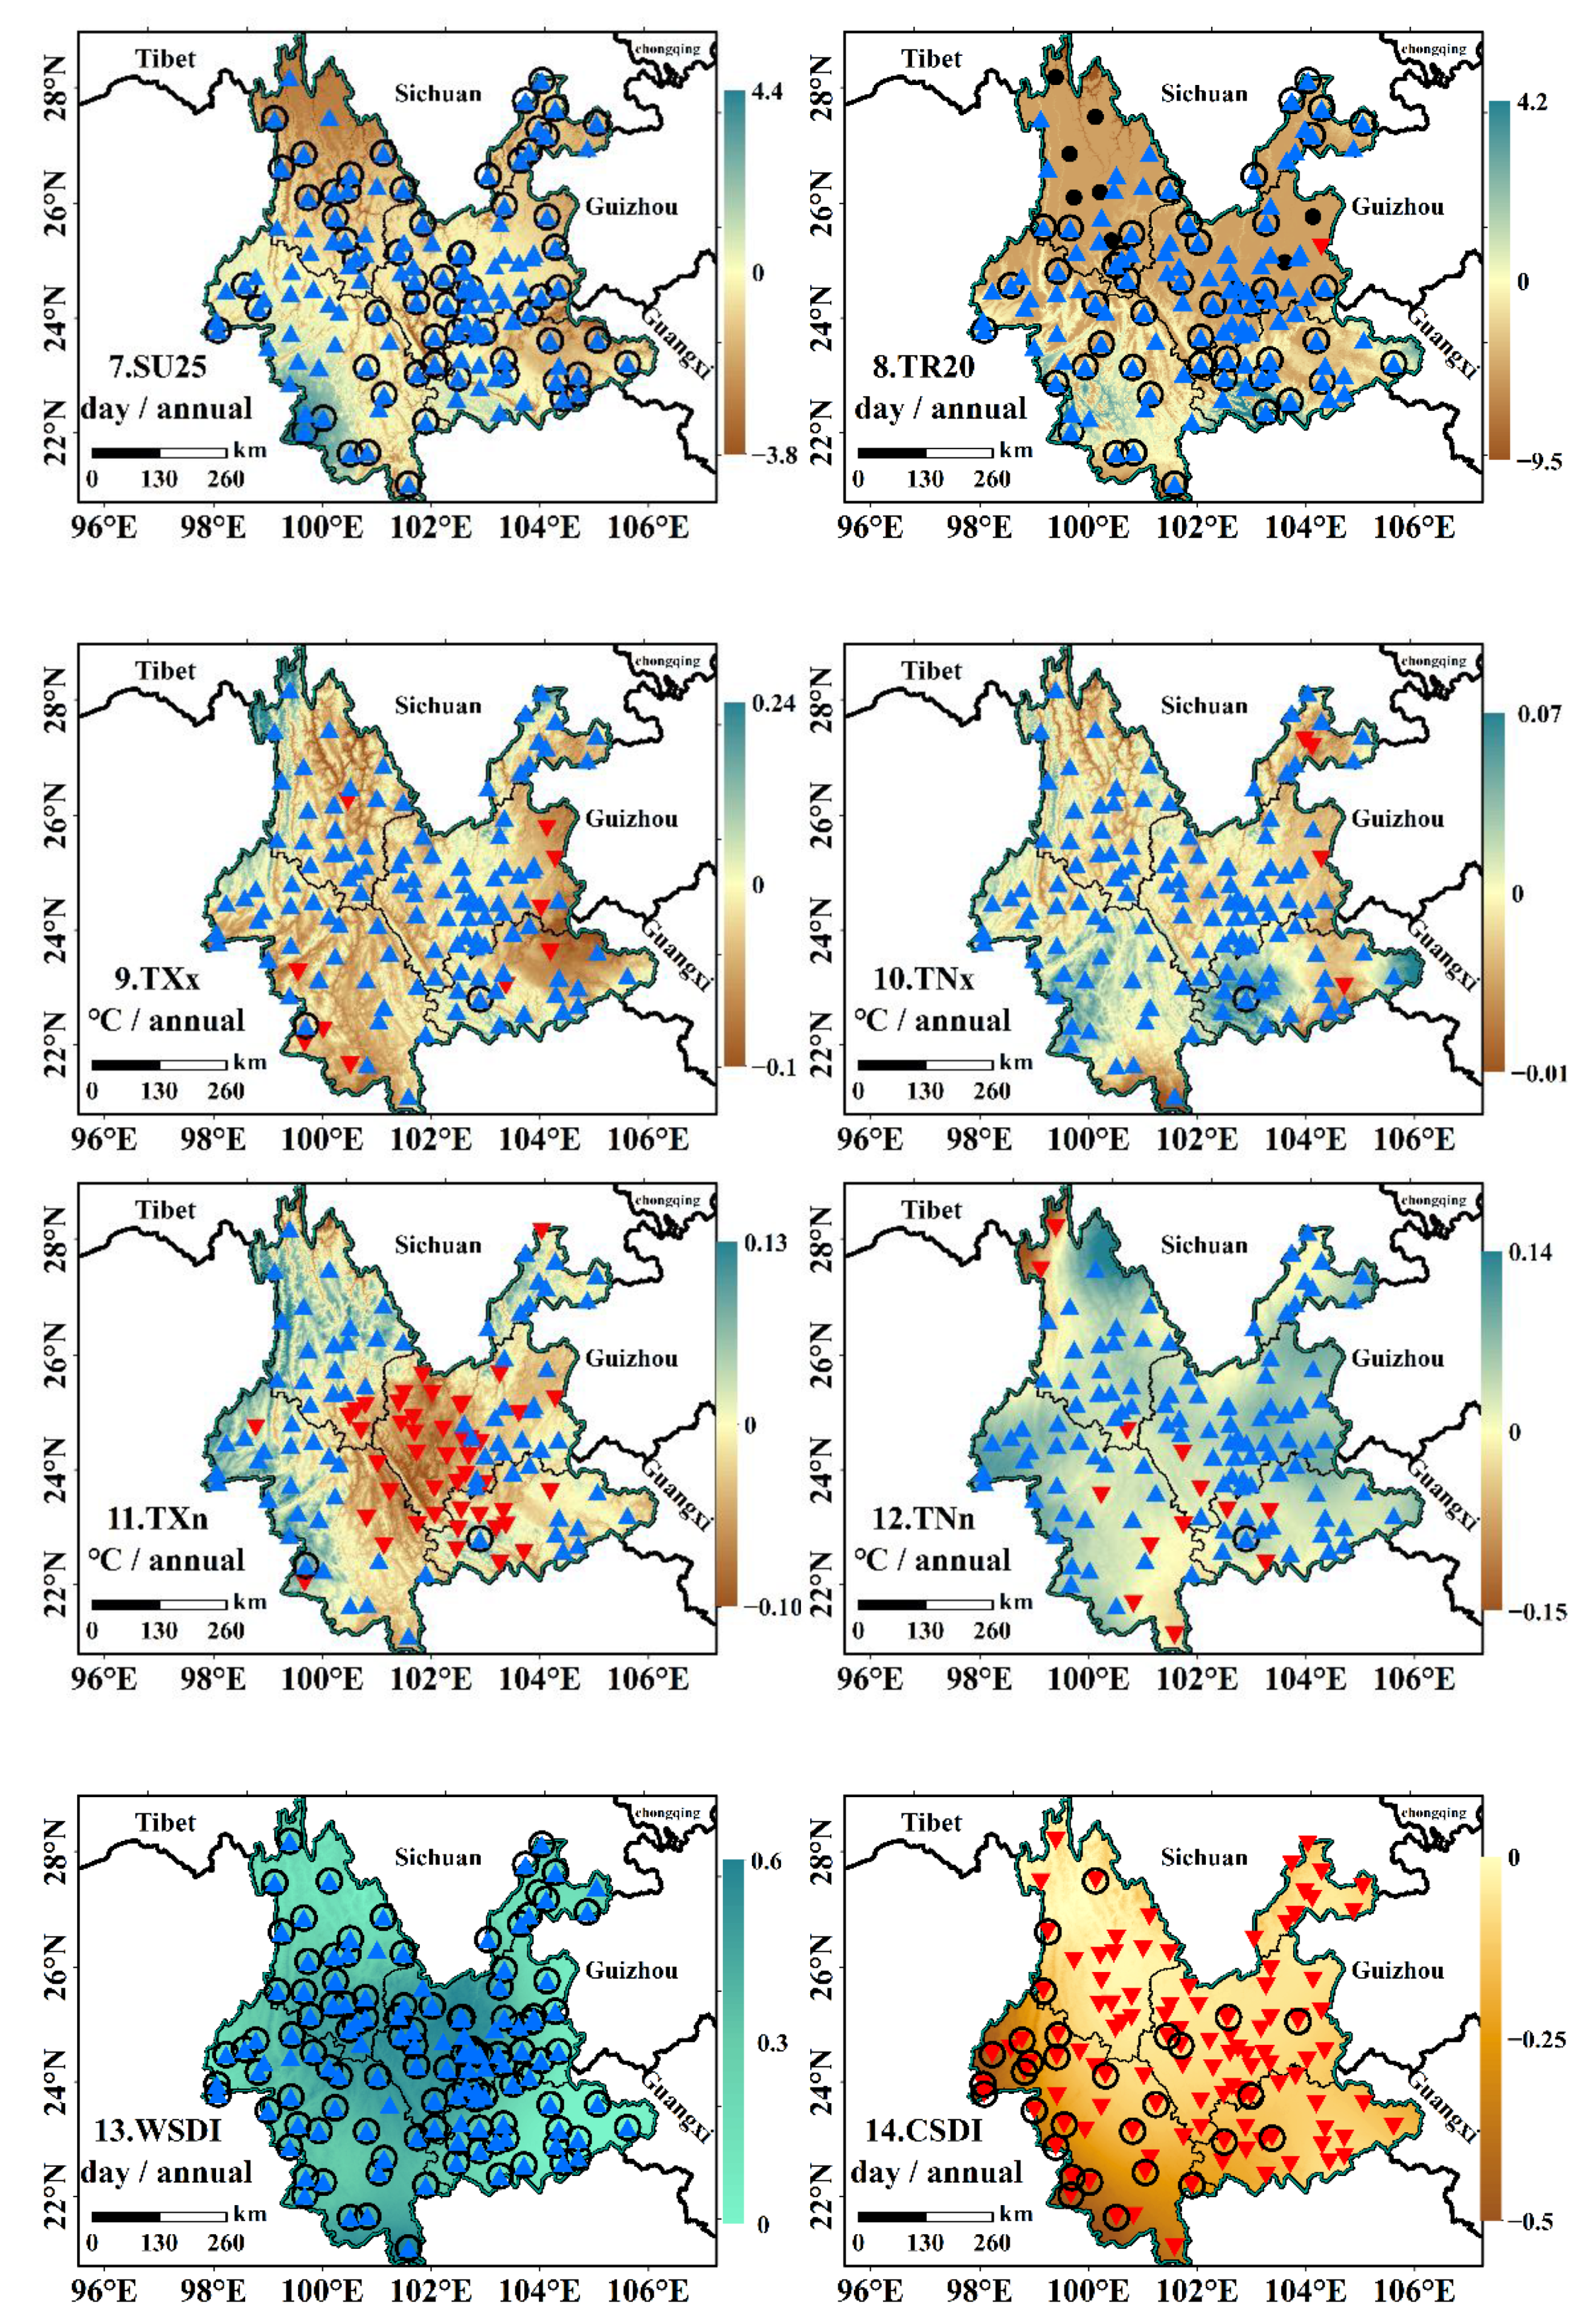
- In the past 60 years, the extreme temperature has been increasing in Yunnan. The warming rate at night is higher than that during the daytime. The most apparent warming area is located in the southwest of Yunnan.
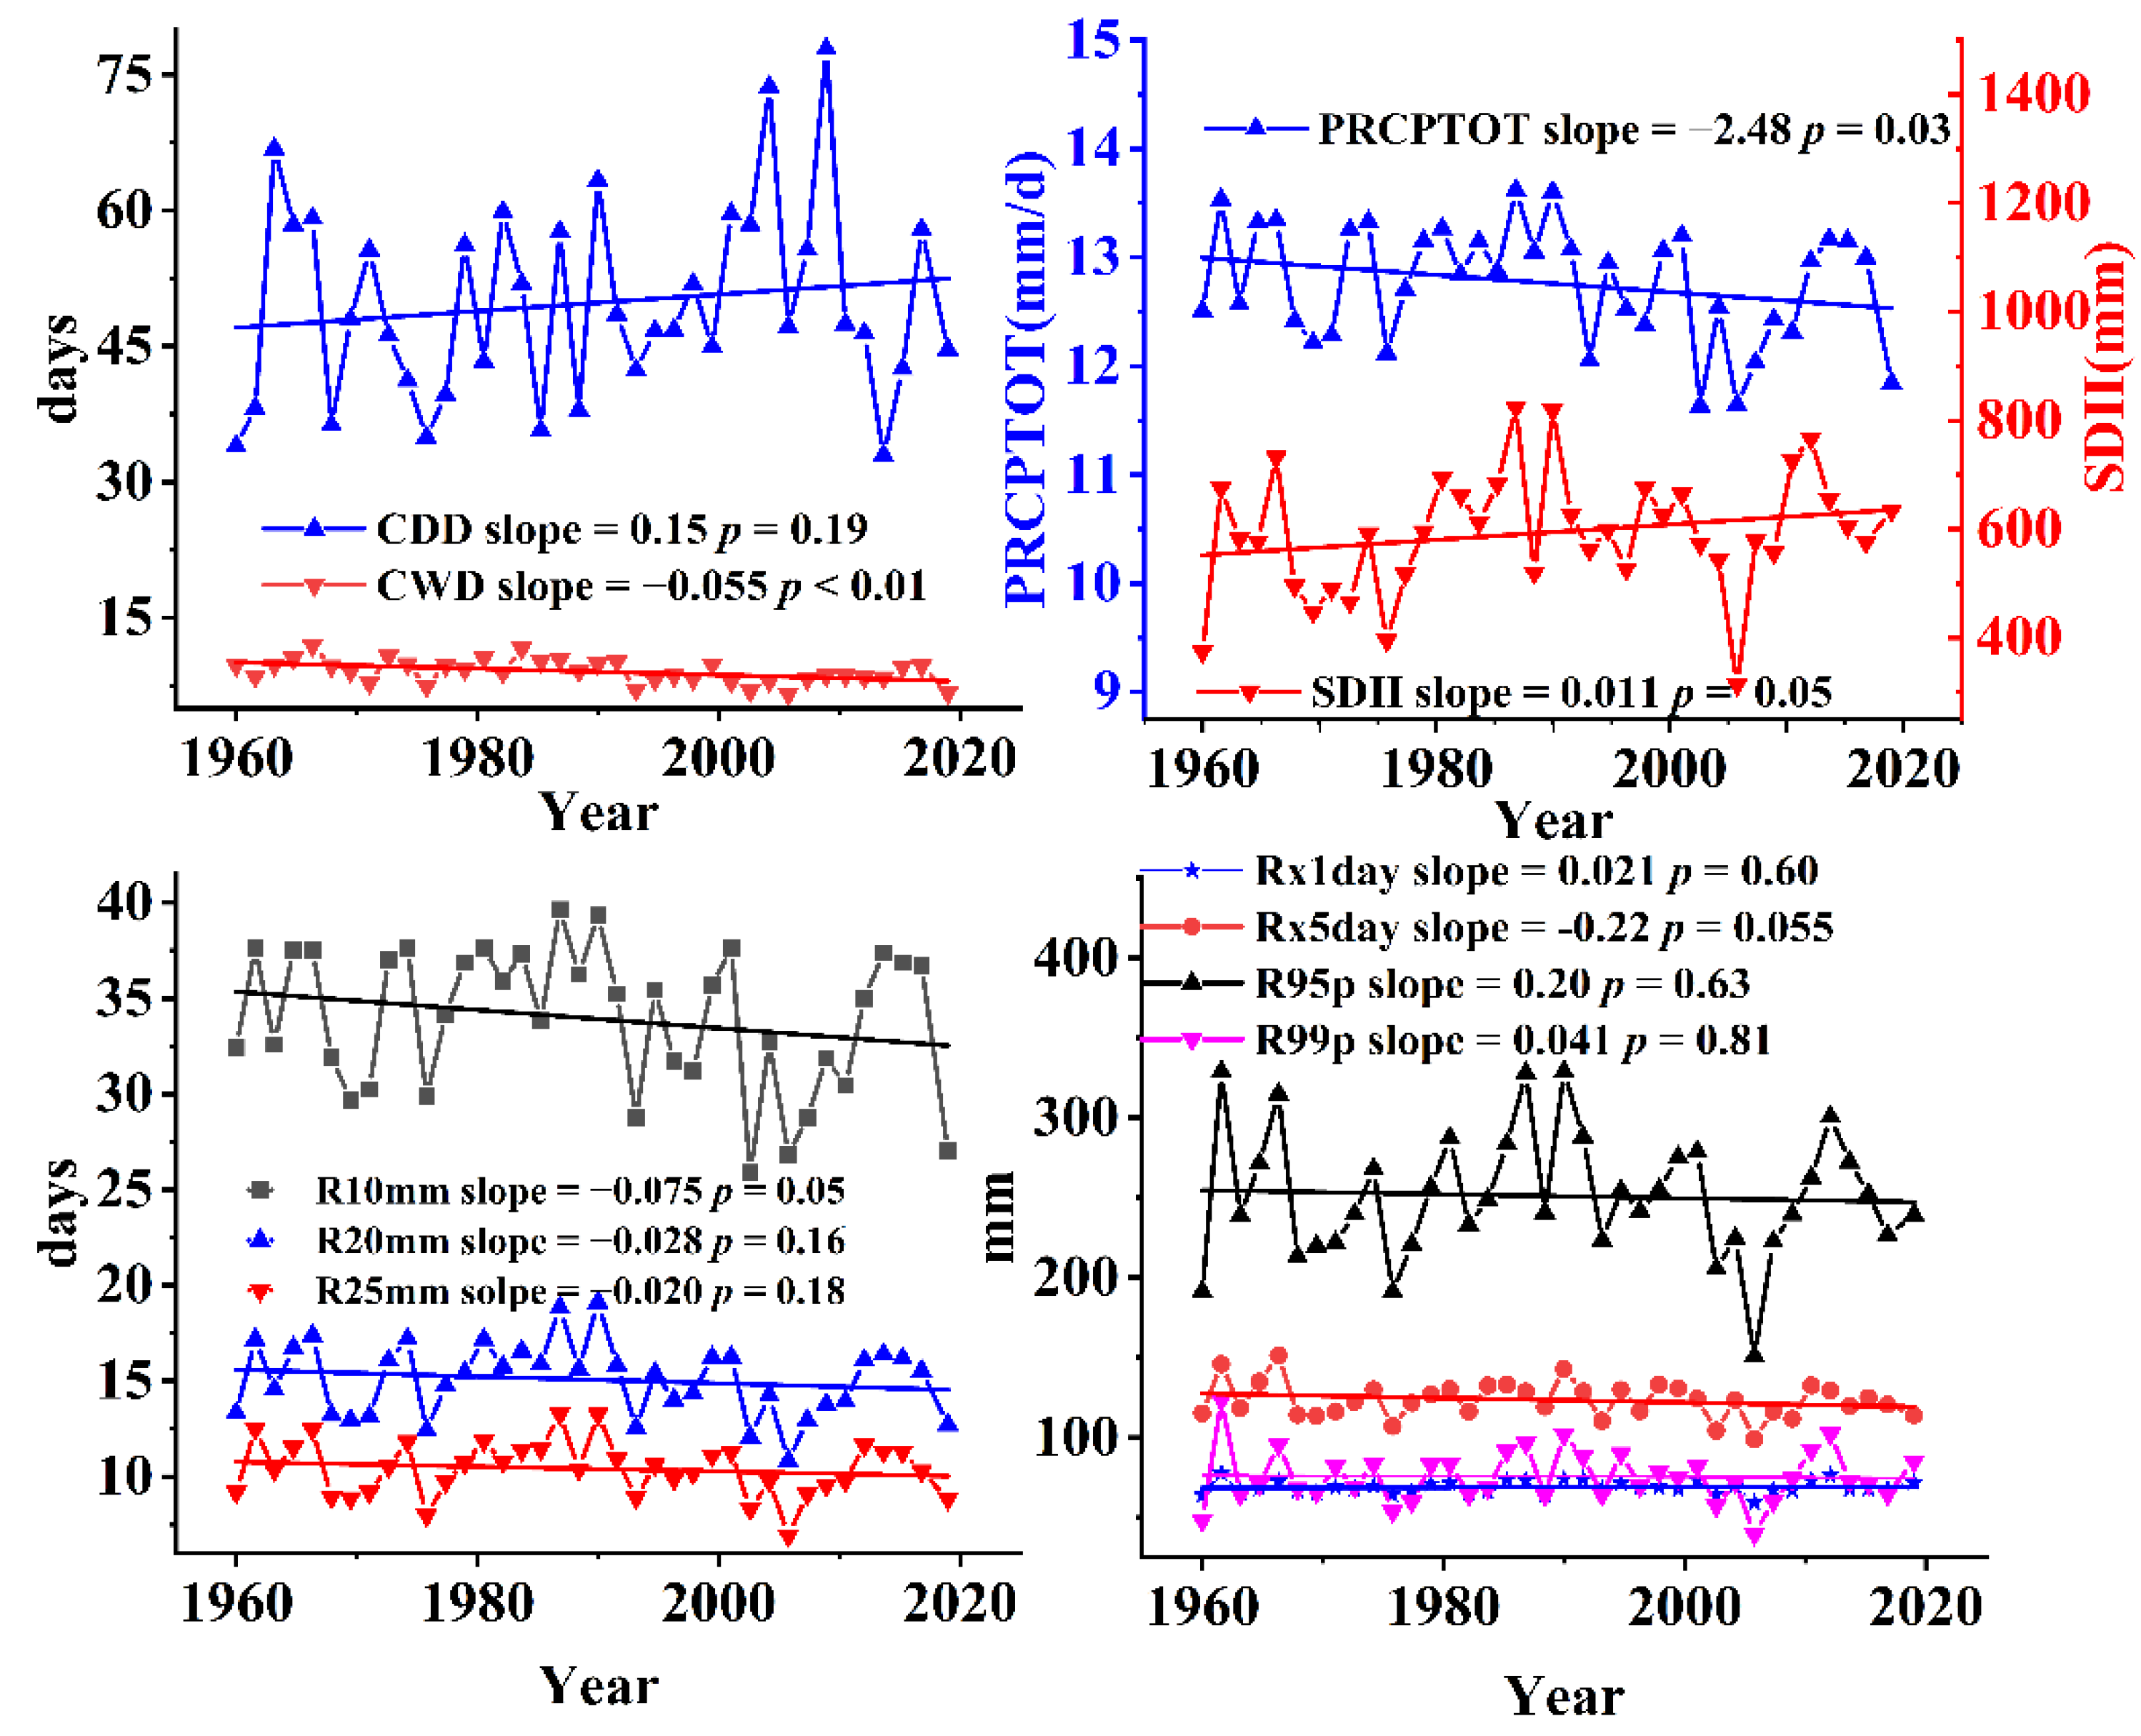
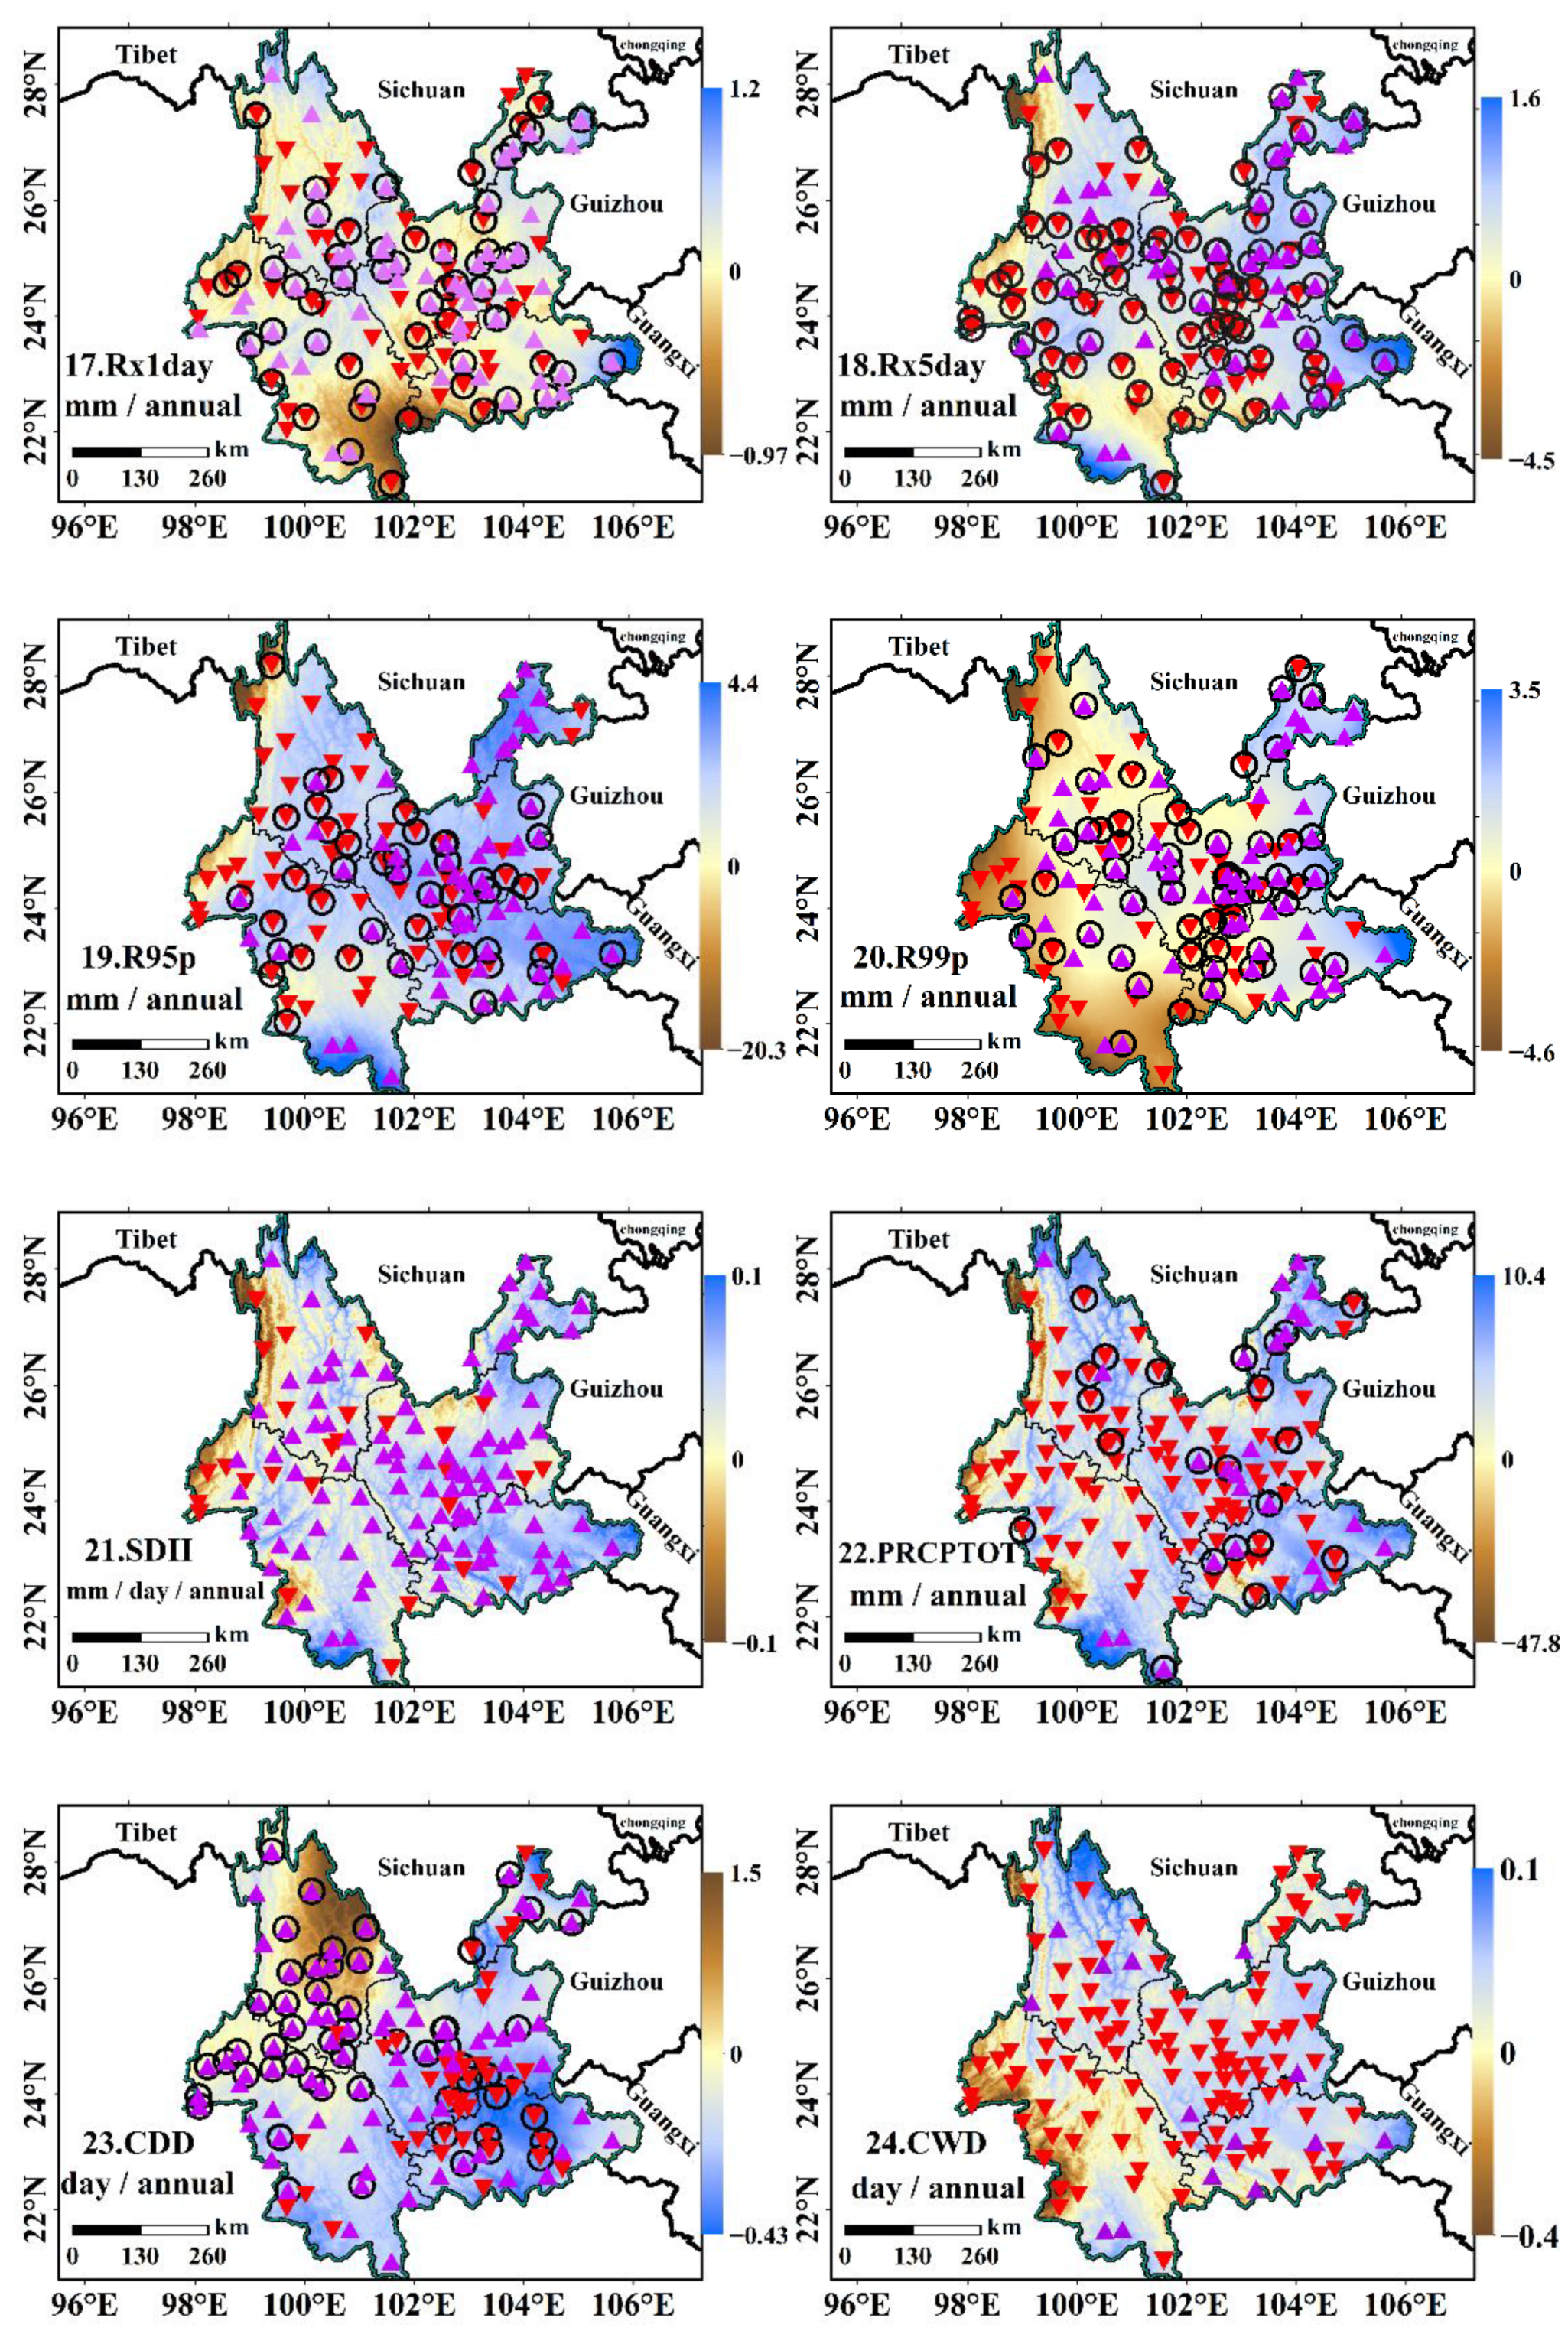
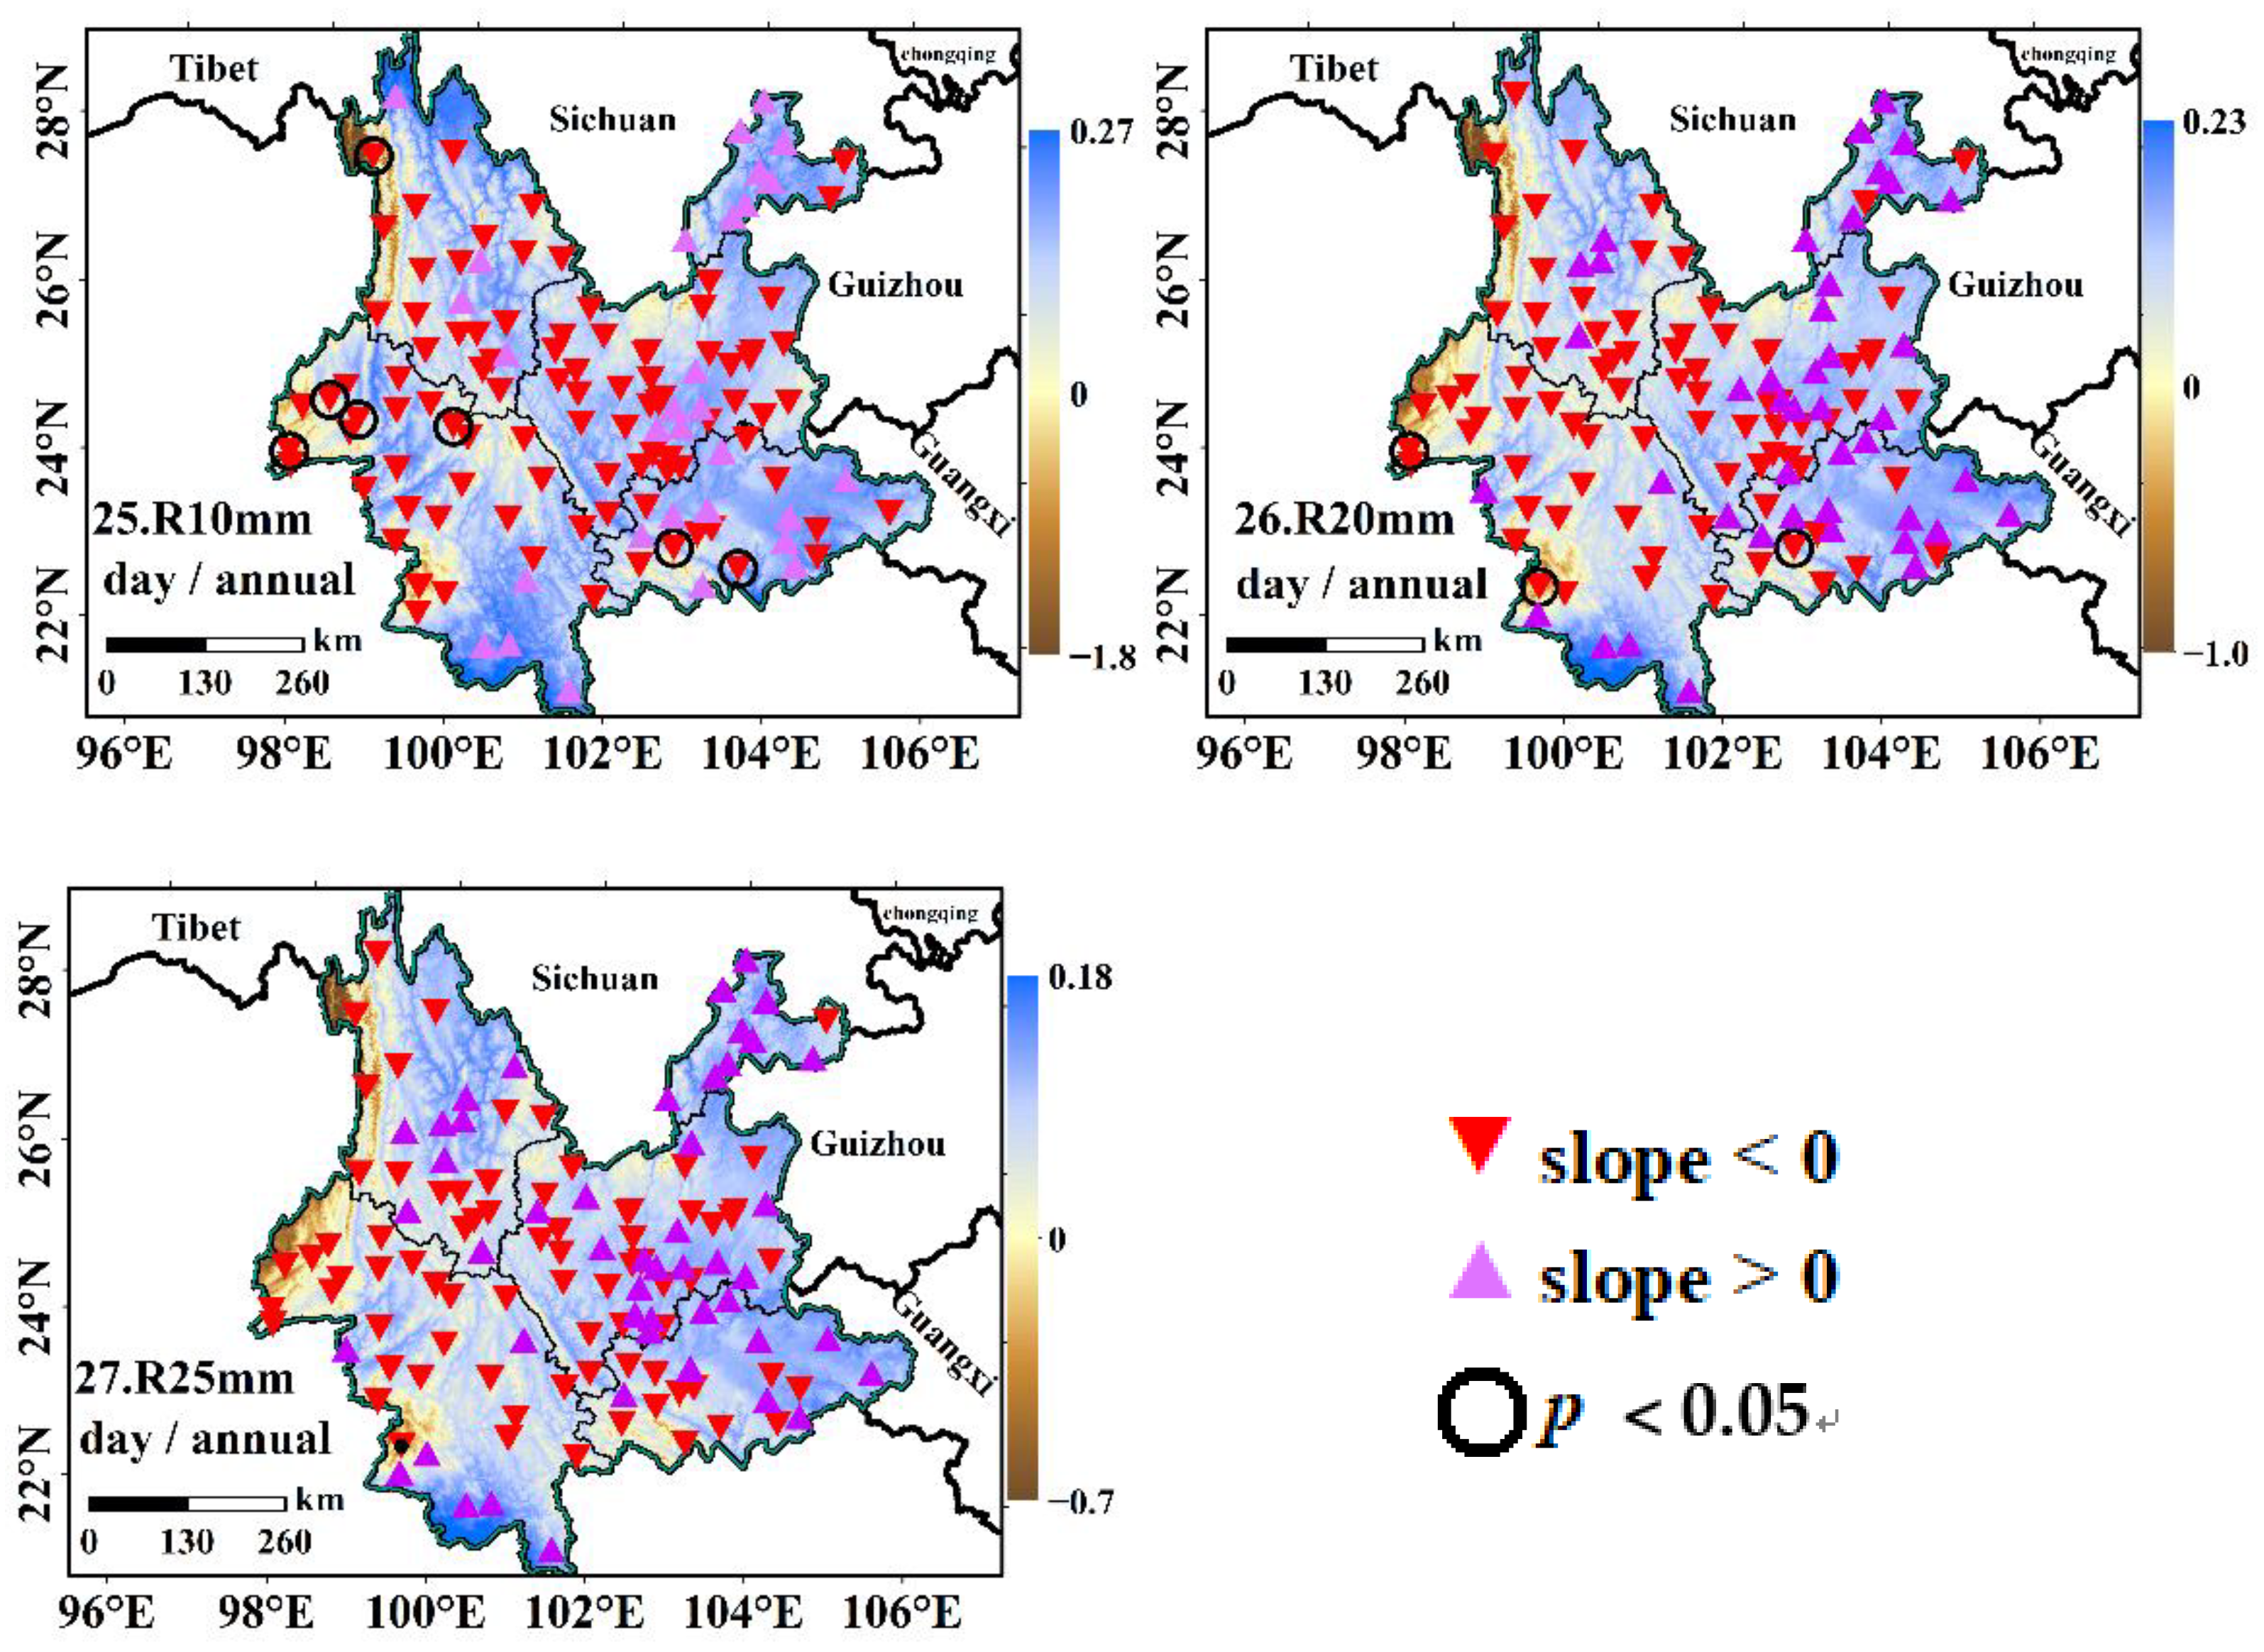
- Yunnan showed a gradual drying trend, and the extreme precipitation was concentrated into more intense bursts from 1960 to 2019. Most of the extreme precipitation indices showed no significant changes. Only CWD and PRCPTOT showed a significant downward trend (p < 0.05). The spatial difference of extreme precipitation is very different. There was an apparent wetness trend in northeast Yunnan, and the persistent drought (CDD) intensified in the northwest and southwest Yunnan.
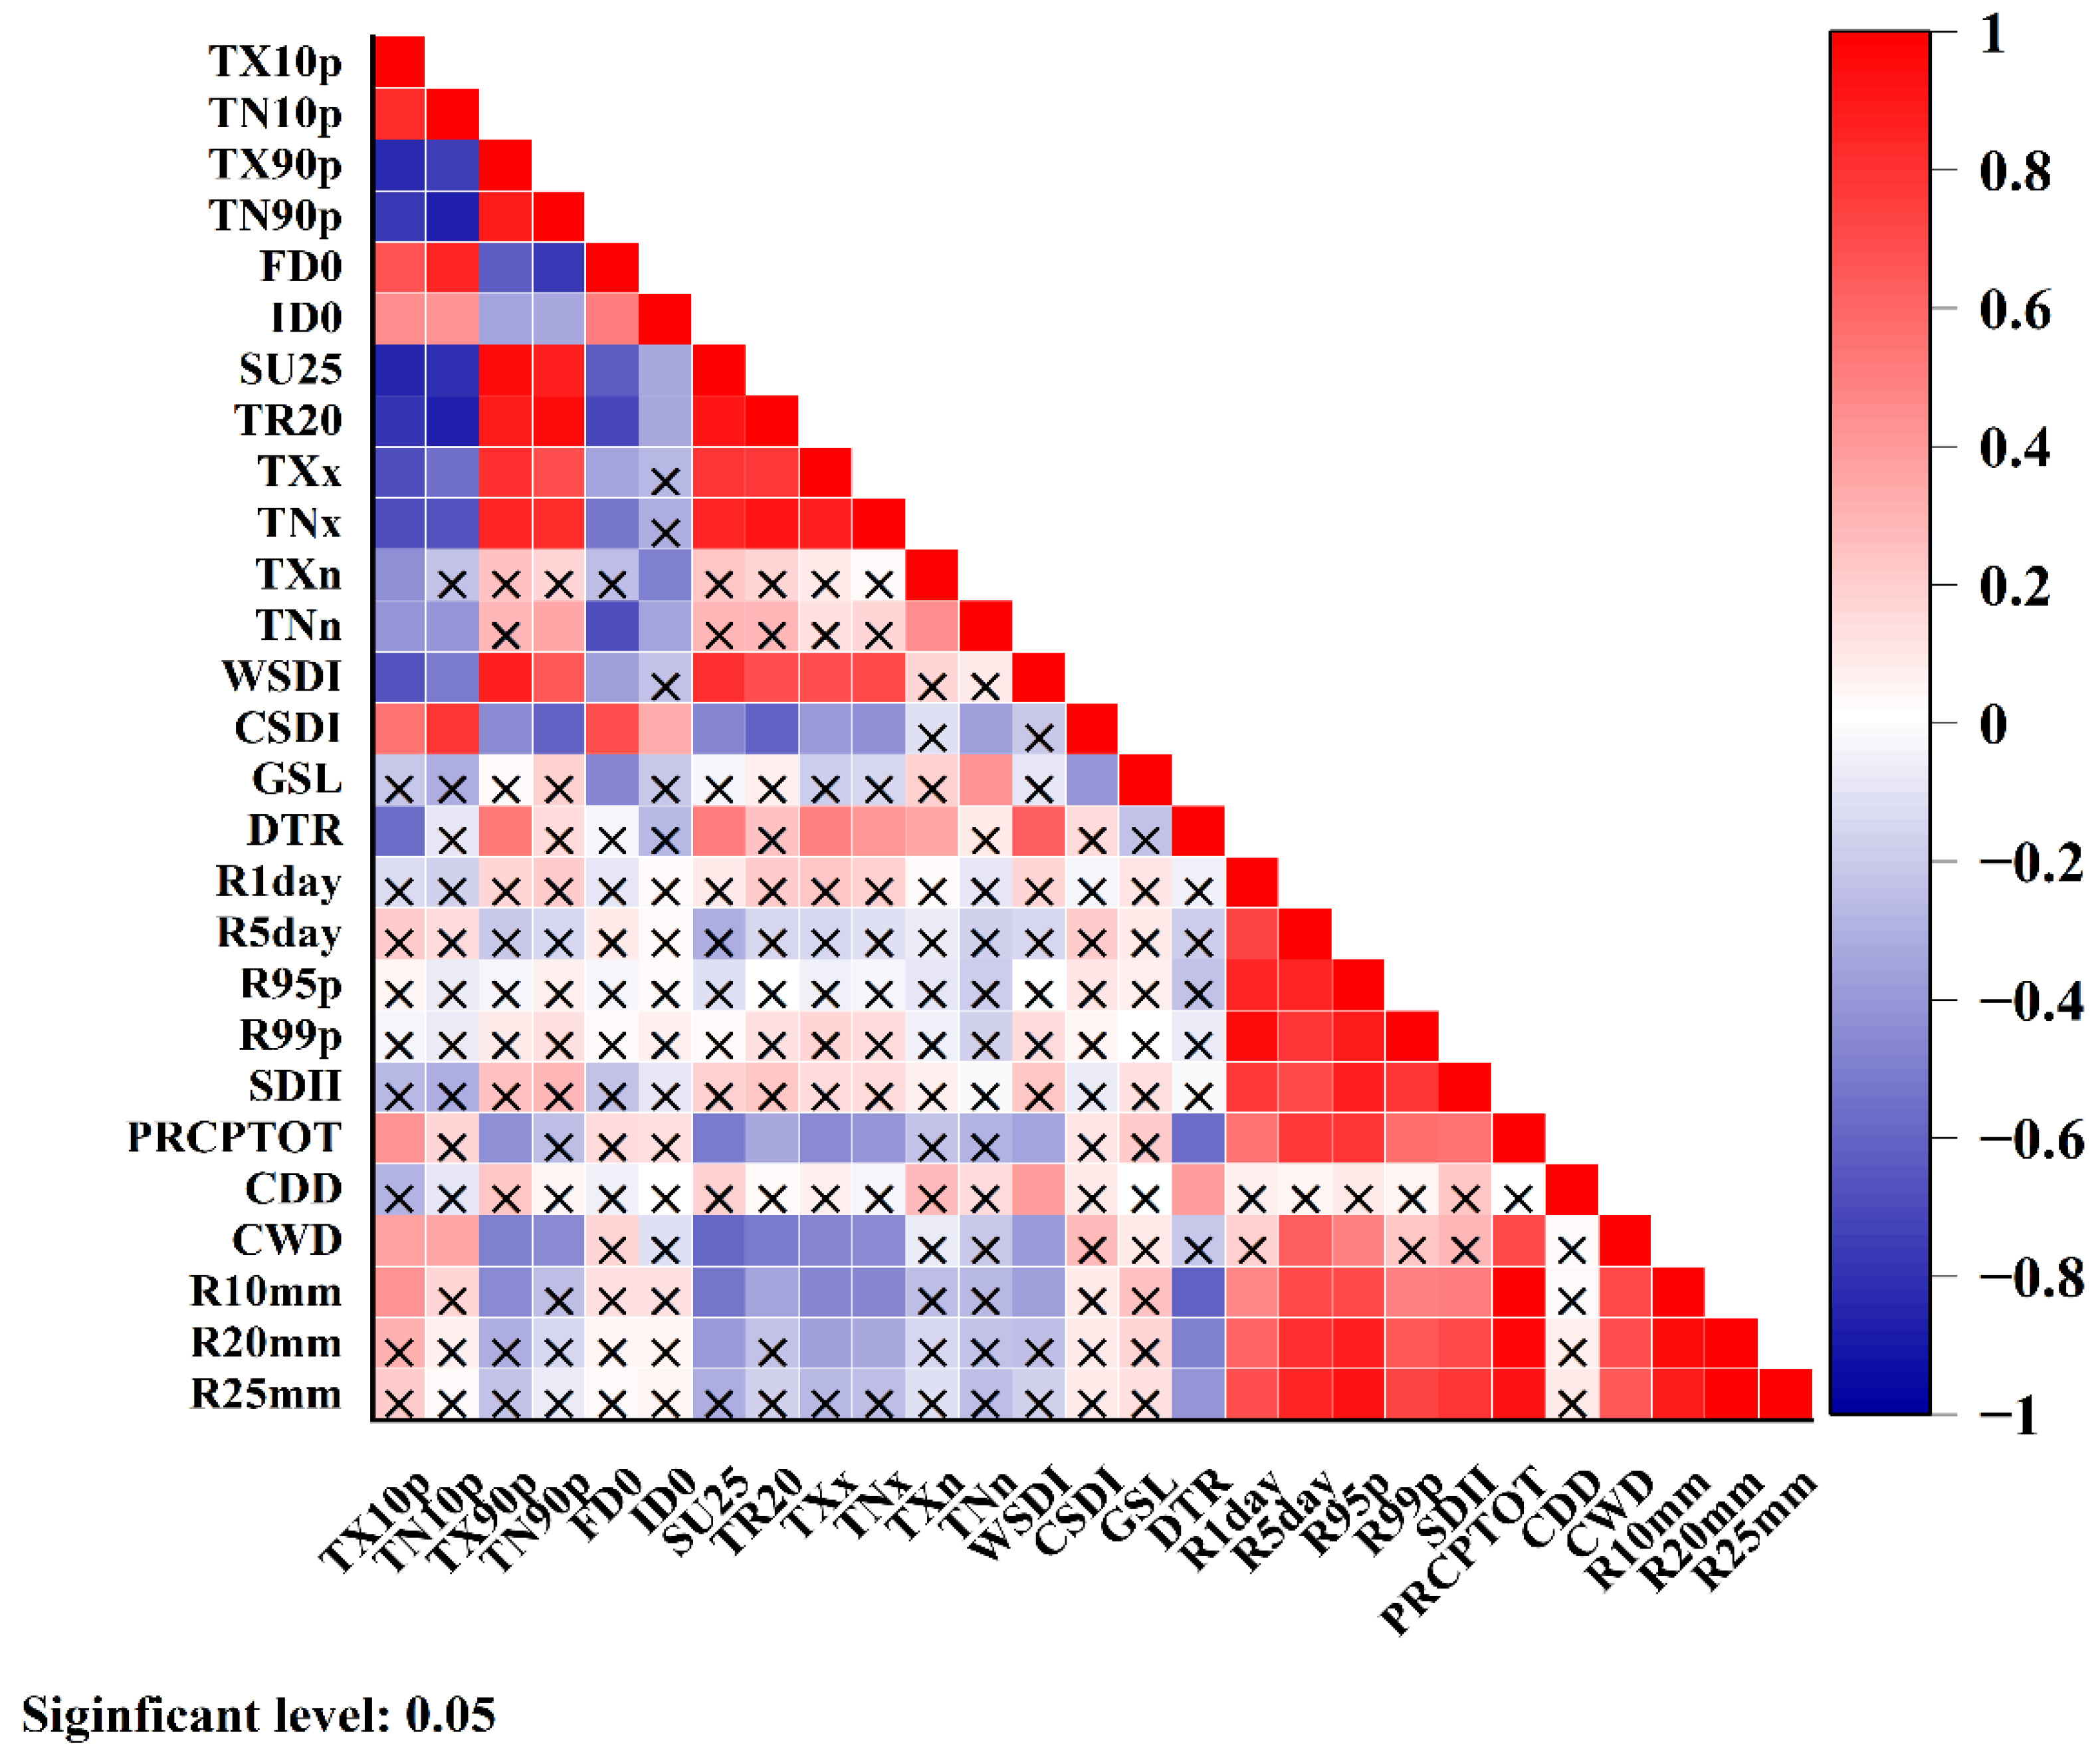
- The cold indices (TX10p TN10p, FD0, ID0, and CSDI) of extreme temperature were negatively correlated with extreme precipitation indices (R × 5 day, PRCPTOT, R10 mm, R20 mm, and R25 mm). Extreme temperature warm indices (TX90p and TN90p) positively correlated with extreme precipitation indices (R × 5 day, CWD, PRCPTOT, R10 mm, R20 mm and R25 mm) in each sub-region. The correlation is most prominent in central Yunnan.
- Compared with longitude and latitude, altitude is the most critical factor affecting extreme climate change in Yunnan. The change rate of extreme temperature does not increase linearly with altitude. In general, the warming rate in the middle- and high-altitude region is more significant than that in the low altitude region.
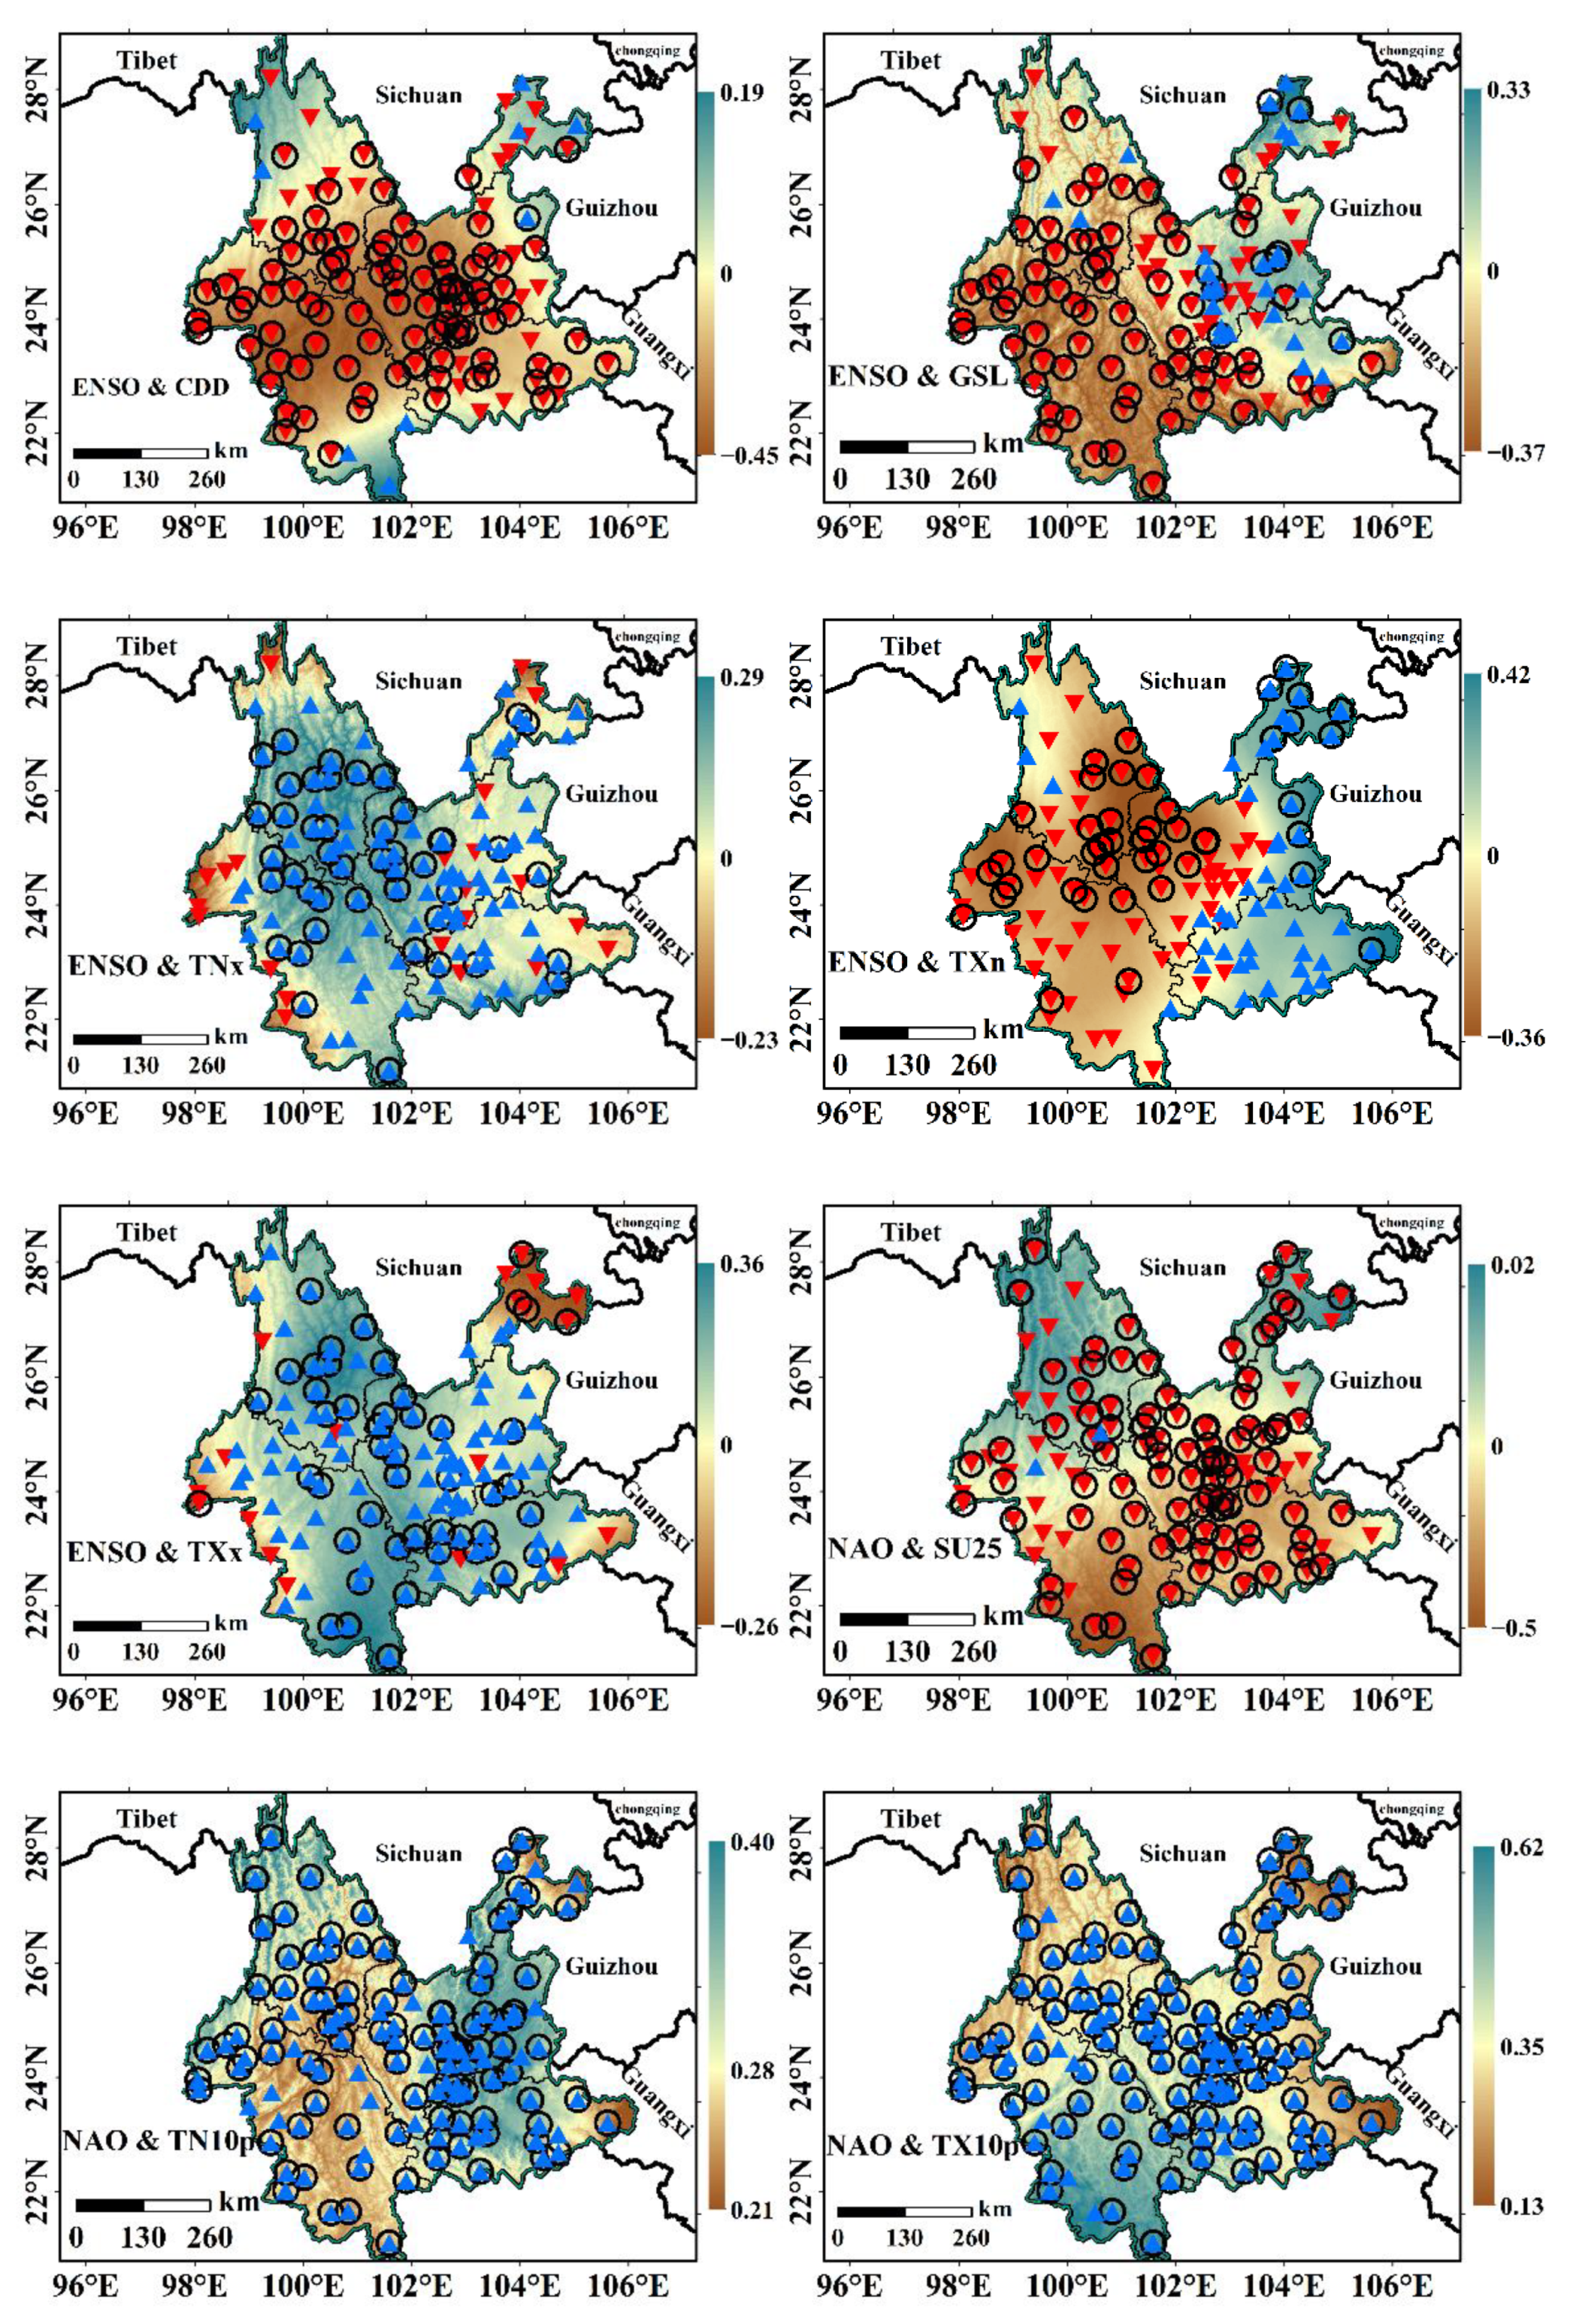
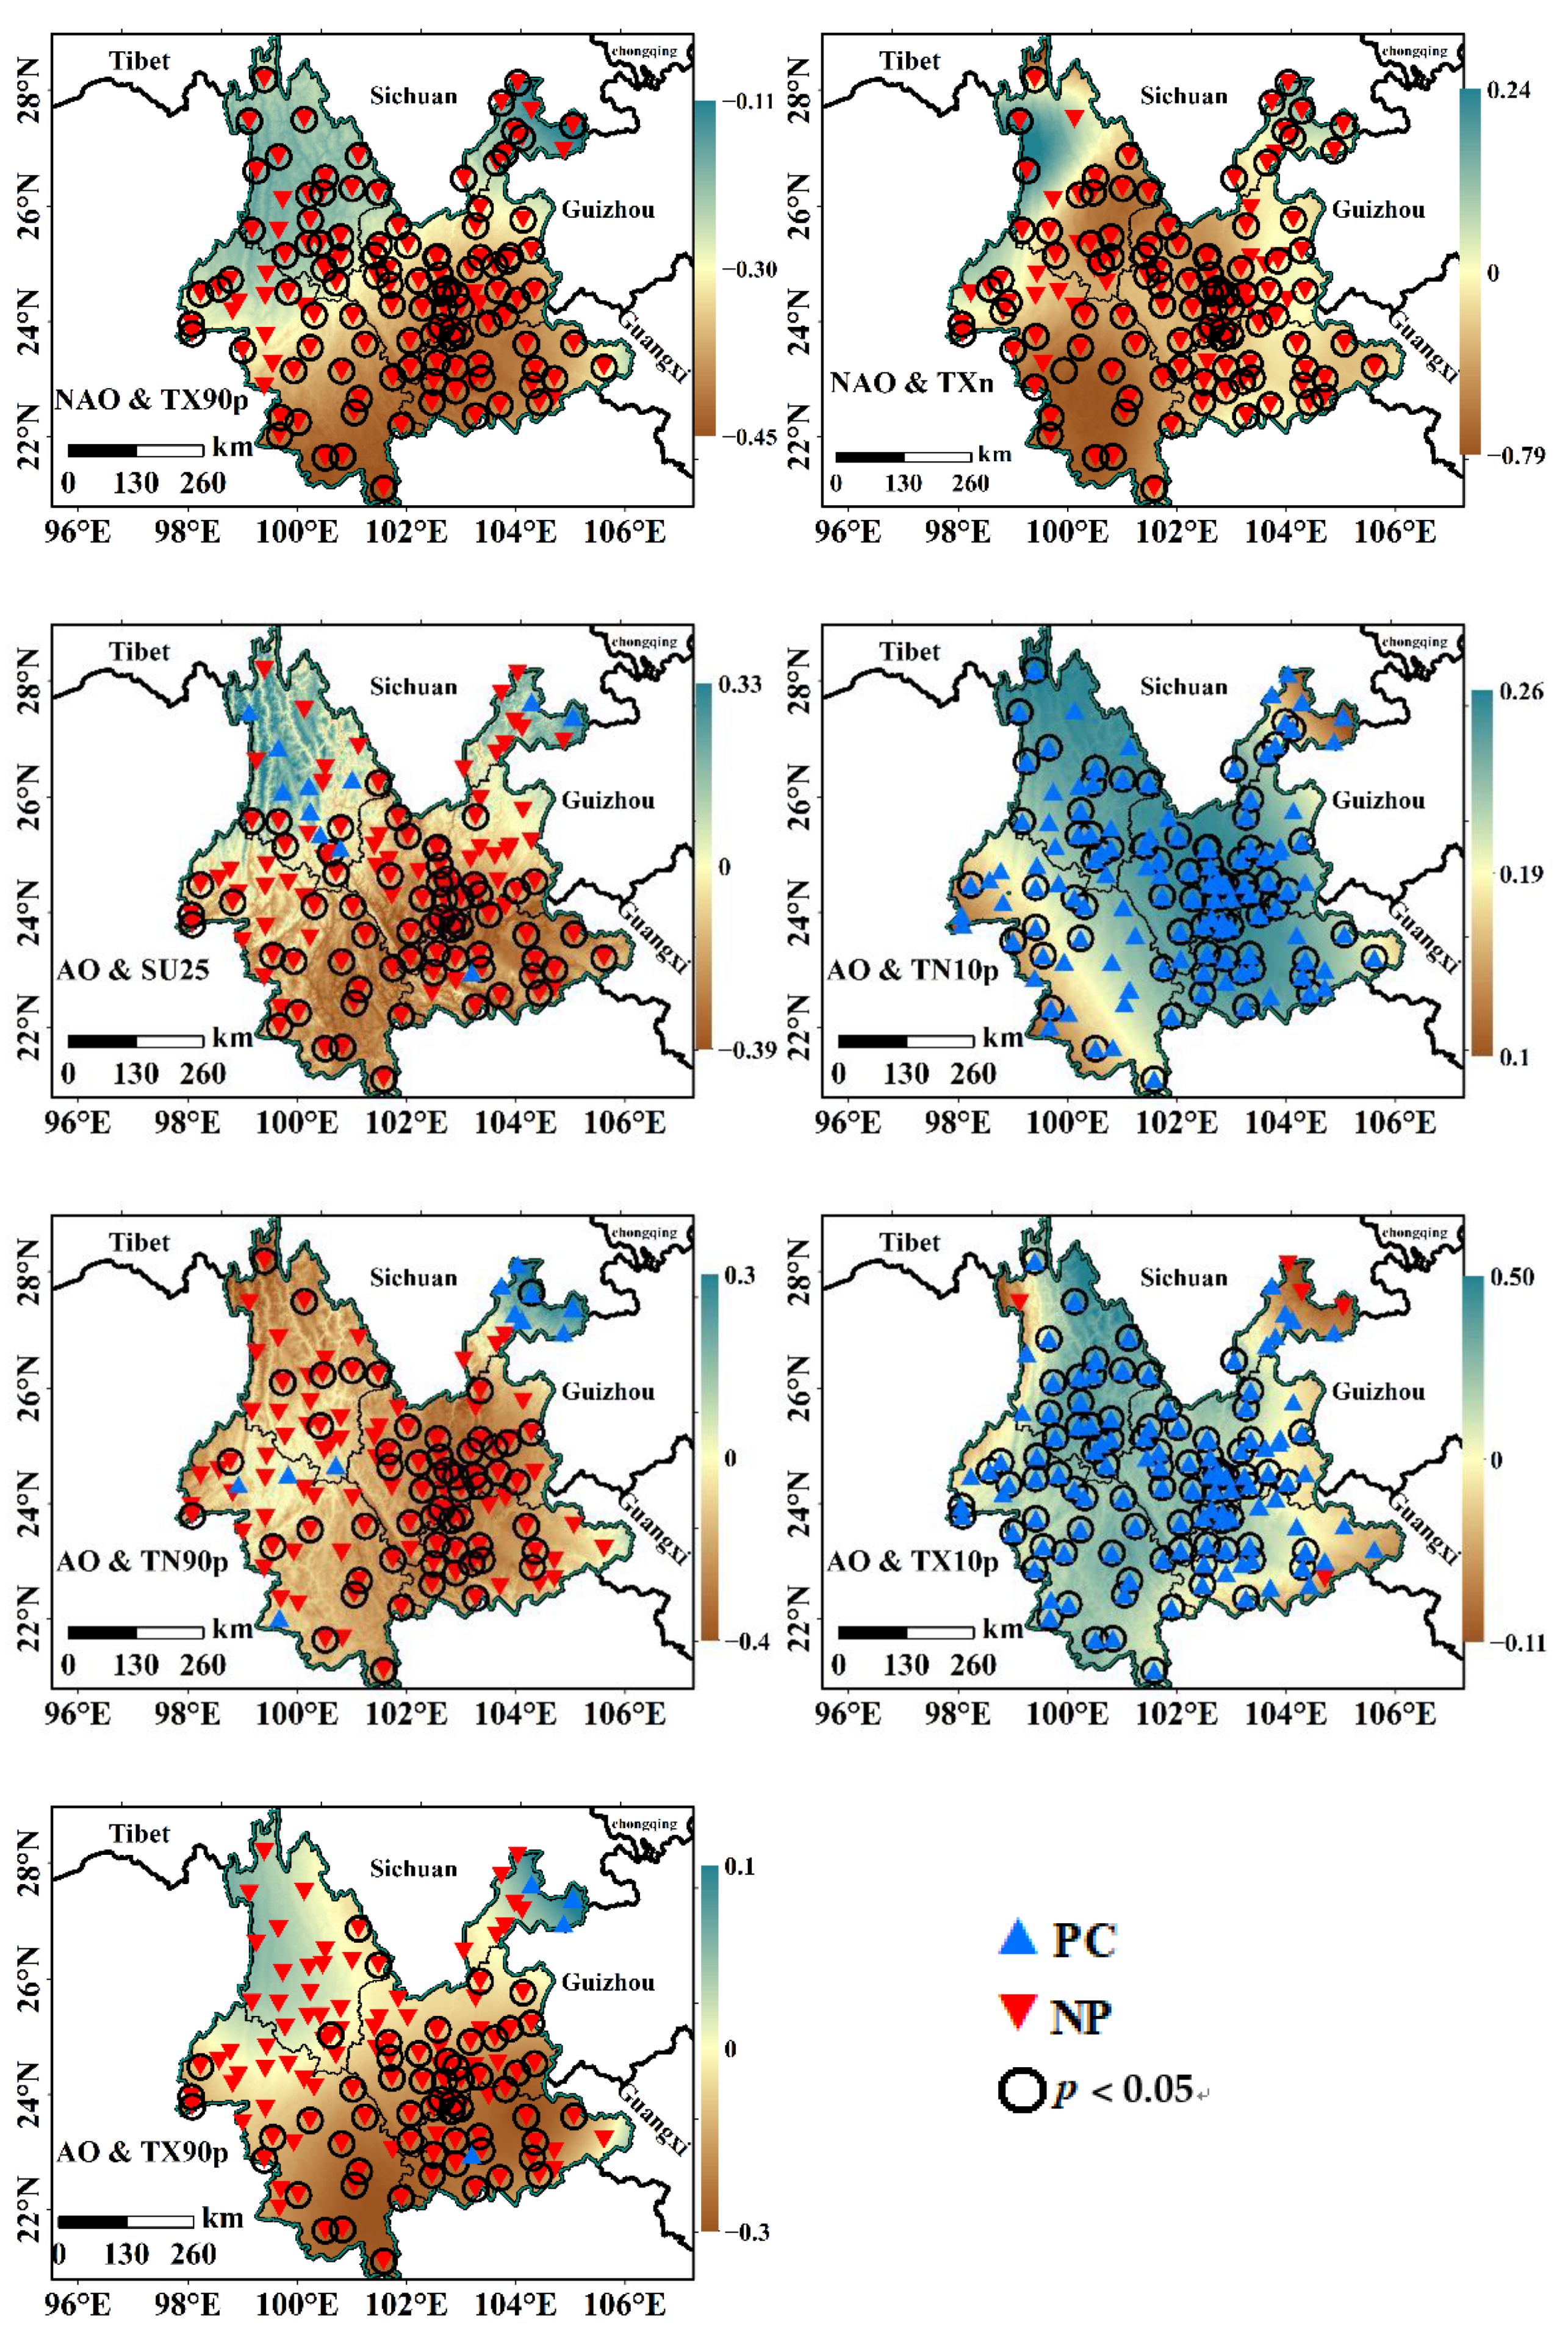
- Compared with ENSO and AO, NAO is a vital circulation pattern affecting extreme climate in Yunnan. NAO had the most significant influence on Yunnan’s extreme climate indices in that month and its following second month. NAO is negatively correlated with extreme temperature warming indices (TN90p, TX90p, SU25, and TR20). The North Atlantic Oscillation (NAO) positively correlates with the temperature cooling indices (TN10p and TX10p).
- The influence of atmospheric circulation patterns on extreme temperature is more significant than extreme precipitation. In addition to the high correlation between CDD and ENSO, the top five correlations between atmospheric circulation patterns and extreme climate indices that passed the significance test were extreme temperature indices.
Author Contributions
Funding
Informed Consent Statement
Acknowledgments
Conflicts of Interest
References
- Shi, X.Y.; Chen, J.; Gu, L.; Xu, C.Y.; Chen, H.; Zhang, L.P. Impacts and socioeconomic exposures of global extreme precipitation events in 1.5 and 2.0 degrees C warmer climates. Sci. Total Environ. 2021, 766, 142655–142668. [Google Scholar] [CrossRef]
- Wallace, J.M.; Held, I.M.; Thompson, D.W.J.; Trenberth, K.E.; Walsh, J.E. Global Warming and Winter Weather. Science 2014, 343, 729–730. [Google Scholar] [CrossRef]
- Liu, Y.; Geng, X.; Hao, Z.X.; Zheng, J.Y. Changes in Climate Extremes in Central Asia under 1.5 and 2 degrees C Global Warming and their Impacts on Agricultural Productions. Atmosphere 2020, 11, 1076. [Google Scholar] [CrossRef]
- Paparrizos, S.; Matzarakis, A. Assessment of future climate change impacts on the hydrological regime of selected Greek areas with different climate conditions. Hydrol. Res. 2017, 48, 1327–1342. [Google Scholar] [CrossRef]
- Solecki, W.; Grimm, N.; Marcotullio, P.; Boone, C.; Lobo, J.; Luque, A.; Romero-Lankao, P.; Young, A.; Zimmerman, R.; Breitzer, R.; et al. Extreme events and climate adaptation-mitigation linkages: Understanding low-carbon transitions in the era of global urbanization. Wiley Interdiscip. Rev.-Clim. Chang. 2019, 10, 616–648. [Google Scholar] [CrossRef]
- Sad, H.P.; Kumar, P.; Panda, S.K. Doppler weather radar data assimilation at convective-allowing grid spacing for predicting an extreme weather event in Southern India. Int. J. Remote Sens. 2021, 42, 3681–3707. [Google Scholar] [CrossRef]
- Fathian, F.; Ghadami, M.; Haghighi, P.; Amini, M.; Naderi, S.; Ghaedi, Z. Assessment of changes in climate extremes of temperature and precipitation over Iran. Theor. Appl. Climatol. 2020, 141, 1119–1133. [Google Scholar] [CrossRef]
- Jiang, D.J.; Zhang, H.; Zhang, Y.; Wang, K. Interannual variability and correlation of vegetation cover and precipitation in Eastern China. Theor. Appl. Climatol. 2014, 118, 93–105. [Google Scholar] [CrossRef]
- Xiong, J.N.; Yong, Z.W.; Wang, Z.G.; Cheng, W.M.; Li, Y.; Zhang, H.; Ye, C.C.; Yang, Y.M. Spatial and Temporal Patterns of the Extreme Precipitation across the Tibetan Plateau (1986–2015). Water 2019, 11, 1453. [Google Scholar] [CrossRef] [Green Version]
- Yao, J.Q.; Chen, Y.N.; Zhao, Y.; Mao, W.Y.; Xu, X.B.; Liu, Y.; Yang, Q. Response of vegetation NDVI to climatic extremes in the arid region of Central Asia: A case study in Xinjiang, China. Theor. Appl. Climatol. 2018, 131, 1503–1515. [Google Scholar] [CrossRef]
- Jenkins, K.; Warren, R. Drought-Damage Functions for the Estimation of Drought Costs under Future Projections of Climate Change. J. Extrem. Events 2015, 2, 29–45. [Google Scholar] [CrossRef] [Green Version]
- Wang, X.X.; Jiang, D.B.; Lang, X.M. Future extreme climate changes linked to global warming intensity. Sci. Bull. 2017, 62, 1673–1680. [Google Scholar] [CrossRef] [Green Version]
- Gujree, I.; Wani, I.; Muslim, M.; Farooq, M.; Meraj, G. Evaluating the variability and trends in extreme climate events in the Kashmir Valley using PRECIS RCM simulations. Modeling Earth Syst. Environ. 2017, 3, 1647–1662. [Google Scholar] [CrossRef]
- Alexander, L.V.; Zhang, X.; Peterson, T.C.; Caesar, J.; Gleason, B.; Tank, A.; Haylock, M.; Collins, D.; Trewin, B.; Rahimzadeh, F.; et al. Global observed changes in daily climate extremes of temperature and precipitation. J. Geophys. Res.-Atmos. 2006, 111, 1–22. [Google Scholar] [CrossRef] [Green Version]
- Groisman, P.Y.; Knight, R.W.; Easterling, D.R.; Karl, T.R.; Hegerl, G.C.; Razuvaev, V.A.N. Trends in intense precipitation in the climate record. J. Clim. 2005, 18, 1326–1350. [Google Scholar] [CrossRef]
- Westra, S.; Alexander, L.V.; Zwiers, F.W. Global Increasing Trends in Annual Maximum Daily Precipitation. J. Clim. 2013, 26, 3904–3918. [Google Scholar] [CrossRef] [Green Version]
- Donat, M.G.; Alexander, L.V.; Yang, H.; Durre, I.; Vose, R.; Dunn, R.J.H.; Willett, K.M.; Aguilar, E.; Brunet, M.; Caesar, J.; et al. Updated analyses of temperature and precipitation extreme indices since the beginning of the twentieth century: The HadEX2 dataset. J. Geophys. Res.-Atmos. 2013, 118, 2098–2118. [Google Scholar] [CrossRef]
- Bagtasa, G. 118-year climate and extreme weather events of Metropolitan Manila in the Philippines. Int. J. Climatol. 2020, 40, 1228–1240. [Google Scholar] [CrossRef]
- Saha, U.; Singh, T.; Sharma, P.; Das Gupta, M.; Prasad, V.S. Deciphering the extreme rainfall scenario over Indian landmass using satellite observations, reanalysis and model forecast: Case studies. Atmos. Res. 2020, 240, 104943–104961. [Google Scholar] [CrossRef]
- Zhu, Y. Temporal and Spatial Trends of Extreme Temperature and Precipitation in Coastal Areas of Mainland China and Their Effects on Vegetation. Master’s Thesis, East China Normal University, Shanghai, China, 2019. [Google Scholar]
- Zhao, C.-Y.; Wang, Y.; Zhou, X.-Y.; Cui, Y.; Liu, Y.-L.; Shi, D.-M.; Yu, H.-M.; Liu, Y.-Y. Changes in Climatic Factors and Extreme Climate Events in Northeast China during 1961–2010. Adv. Clim. Chang. Res. 2013, 4, 92–102. [Google Scholar]
- Cao, Q.; Hao, Z.C.; Fu, X.J.; Hao, J.; Lu, C.Y. Analysis of Spatial-Temporal Changes of Extreme Climatic Elements in China from 1960 to 2017. Yellow River 2020, 42, 11–17. [Google Scholar] [CrossRef]
- Lu, S.; Hu, Z.Y.; Wang, B.P.; Qin, P.; Wang, L. Spatio-temporal Patterns of Extreme Precipitation Events over China in Recent 56 Years. Plateau Meteorol. 2020, 39, 683–693. [Google Scholar] [CrossRef]
- Chen, X.R.; Yang, Y.; He, J.N.; Qi, X.; Wu, Z.F.; Du, H.B. Spatio-temporal Change of Persistent Extreme Precipitation and the Associated Circulation Causes Over China in the Last 60 Years. Resour. Environ. Yangtze Basin 2020, 29, 2068–2081. [Google Scholar] [CrossRef]
- Li, Y.E.; Zhang, W.Y.; Chen, S.N.; Han, F.R. Characteristics and Causes of Extreme Precipitation in Southwestern Hubei During 2008–2017. J. Arid. Meteorol. 2019, 37, 875–884. [Google Scholar] [CrossRef]
- Chu, Q.C. Roles of Moisture Sources and Transport in Precipitation Variabilities during the Flood Season over East China and Related Climate Dynamics. Ph.D. Thesis, Lanzhou University, Lan Zhou, China, 2020. [Google Scholar]
- Chen, X.H.; Zhang, X.Z.; Zhang, X.P.; Long, X.Y. Long-term Variation of Regional Extreme Precipitation in Jiangnan Area and Its Possible Cause. Resour. Environ. Yangtze Basin 2020, 29, 1757–1767. [Google Scholar] [CrossRef]
- Han, D.D. Changes of Vegetation and Its response to Extreme Climate in the Loess Plateau. Master’s Thesis, Chinese Academy of Sciences, Beijing, China, 2020. [Google Scholar]
- Jiang, S.S.; Chen, X.; Smettem, K.; Wang, T.J. Climate and land use influences on changing spatiotemporal patterns of mountain vegetation cover in southwest China. Ecol. Indic. 2021, 121, 456–475. [Google Scholar] [CrossRef]
- Yu, Y.H.; Wang, J.L.; Cheng, F.; Deng, H.; Chen, S. Drought monitoring in Yunnan Province based on a TRMM precipitation product. Nat. Hazards 2020, 104, 2369–2387. [Google Scholar] [CrossRef]
- Xu, Y.B.; Lei, Q.L.; Zhou, J.G.; Zhang, Y.T.; Wu, S.X.; Zhai, L.M.; Wang, H.Y.; Li, Y.; Liu, H.B. Study on the change characteristics of extreme climate indices from 1960 to 2015 in yunnan province, China. Chin. J. Agric. Resour. Reg. Plan. 2020, 41, 15–27. [Google Scholar] [CrossRef]
- Cao, Y.; Wang, J.; Zhang, L.; Qi, N.; Duan, Q.C. Temporal and spatial variation analysis of extreme precipitation at central area of Yunnan Province. Yangtze River 2017, 48, 50–55. [Google Scholar] [CrossRef]
- Duan, X.; Tao, Y. The climate change of yunnan over the last 50 years. J. Trop. Meteorol. 2012, 28, 243–250. [Google Scholar] [CrossRef]
- Zheng, J.Y.; Yin, Y.H.; Li, B.Y. A New Scheme for Climate Regionalization in China. Acta Geogr. Sin. 2010, 65, 3–12. [Google Scholar]
- Liu, Z.H.; Li, L.T.; McVicar, T.R.; Van Niel, T.G.; Yang, Q.K.; Li, R. Introduction of the professional interpolation software for meteorology Data ANUSPLINN2-100. Meteorol. Mon. 2008, 2, 92–100. [Google Scholar]
- dos Santos, C.A.C.; Neale, C.M.U.; Rao, T.V.R.; da Silva, B.B. Trends in indices for extremes in daily temperature and precipitation over Utah, USA. Int. J. Climatol. 2011, 31, 1813–1822. [Google Scholar] [CrossRef]
- Shi, J.; Cui, L.L.; Wen, K.M.; Tian, Z.; Wei, P.P.; Zhang, B.W. Trends in the consecutive days of temperature and precipitation extremes in China during 1961–2015. Environ. Res. 2018, 161, 381–391. [Google Scholar] [CrossRef] [PubMed]
- Ruiz-Alvarez, O.; Singh, V.P.; Enciso-Medina, J.; Ontiveros-Capurata, R.E.; dos Santos, C.A.C. Observed trends in daily temperature extreme indices in Aguascalientes, Mexico. Theor. Appl. Climatol. 2020, 142, 1425–1445. [Google Scholar] [CrossRef]
- Zhao, A.Z.; Zhang, A.B.; Liu, X.F.; Cao, S. Spatiotemporal changes of normalized difference vegetation index (NDVI) and response to climate extremes and ecological restoration in the Loess Plateau, China. Theor. Appl. Climatol. 2018, 132, 555–567. [Google Scholar] [CrossRef]
- Tong, S.Q.; Li, X.Q.; Zhang, J.Q.; Bao, Y.H.; Bao, Y.B.; Na, L.; Si, A.L. Spatial and temporal variability in extreme temperature and precipitation events in Inner Mongolia (China) during 1960–2017. Sci. Total Environ. 2019, 649, 75–89. [Google Scholar] [CrossRef] [PubMed]
- Li, C.L.; Wang, J.; Hu, R.C.; Yin, S.; Bao, Y.H.; Ayal, D.Y. Relationship between vegetation change and extreme climate indices on the Inner Mongolia Plateau, China, from 1982 to 2013. Ecol. Indic. 2018, 89, 101–109. [Google Scholar] [CrossRef]
- May, R.M. Thresholds and breakpoints in ecosystems with a multiplicity of stable states. Nature 1977, 269, 471–477. [Google Scholar] [CrossRef]
- Zhang, D.F.; Gao, X.J. Climate change of the 21st century over China from the ensemble of RegCM4 simulations. Chin. Sci. Bull. Chin. 2020, 65, 2516–2526. [Google Scholar] [CrossRef]
- Chen, W.; Dong, B.W. Projected near-term changes in temperature extremes over China in the mid-twenty-first century and underlying physical processes. Clim. Dyn. 2021, 56, 1879–1894. [Google Scholar] [CrossRef]
- Zhao, N.; Chen, M. A Comprehensive Study of Spatiotemporal Variations in Temperature Extremes across China during 1960-2018. Sustainability 2021, 13, 3807. [Google Scholar] [CrossRef]
- Ossola, A.; Jenerette, G.D.; McGrath, A.; Chow, W.; Hughes, L.; Leishman, M.R. Small vegetated patches greatly reduce urban surface temperature during a summer heatwave in Adelaide, Australia. Landsc. Urban Plan. 2021, 209, 46–75. [Google Scholar] [CrossRef]
- Mohan, S.; Clarke, R.M.; Chadee, X.T. Variations in extreme temperature and precipitation for a Caribbean island: Barbados (1969–2017). Theor. Appl. Climatol. 2020, 140, 1277–1290. [Google Scholar] [CrossRef]
- Yu, H.Y.; Liu, P.; Zhang, Y. The combined effects of ENSO and Arctic Oscillation on wintertime fog days in eastern China. Theor. Appl. Climatol. 2021, 144, 1233–1251. [Google Scholar] [CrossRef]
- Yang, W.C.; Jin, F.M.; Si, Y.J.; Li, Z. Runoff change controlled by combined effects of multiple environmental factors in a headwater catchment with cold and arid climate in northwest China. Sci. Total Environ. 2021, 756, 143955–143985. [Google Scholar] [CrossRef]
- Liu, X.W.; Xu, Z.X.; Peng, D.Z.; Wu, G.C. Influences of the North Atlantic Oscillation on extreme temperature during the cold period in China. Int. J. Climatol. 2019, 39, 43–49. [Google Scholar] [CrossRef] [Green Version]
- Lai, W.L.; Wang, H.R.; Zhang, J. Comprehensive assessment of drought from 1960 to 2013 in China based on different perspectives. Theor. Appl. Climatol. 2018, 134, 585–594. [Google Scholar] [CrossRef]
- Gobiet, A.; Kotlarski, S.; Beniston, M.; Heinrich, G.; Rajczak, J.; Stoffel, M. 21st century climate change in the European Alps—A review. Sci. Total Environ. 2014, 493, 1138–1151. [Google Scholar] [CrossRef]
- Yang, Y.Q.; Jun, Z.; Sui, X.; He, X. Study of the spatial connection between urbanization and the ecosystem-A case study of Central Yunnan (China). PLoS ONE 2020, 15, e0238192. [Google Scholar] [CrossRef]
- Tao, W.K.; Li, X.W.; Khain, A.; Matsui, T.; Lang, S.; Simpson, J. Role of atmospheric aerosol concentration on deep convective precipitation: Cloud-resolving model simulations. J. Geophys. Res. -Atmos. 2007, 112, 8728–8745. [Google Scholar] [CrossRef] [Green Version]
- Cao, Q.; Jiang, B.; Shen, X.; Lin, W.; Chen, J. Microphysics effects of anthropogenic aerosols on urban heavy precipitation over the Pearl River Delta, China. Atmos. Res. 2021, 253, 478–493. [Google Scholar] [CrossRef]
- Subba, T.; Gogoi, M.M.; Pathak, B.; Bhuyan, P.K.; Babu, S.S. Recent trend in the global distribution of aerosol direct radiative forcing from satellite measurements. Atmos. Sci. Lett. 2020, 21, 2873–2895. [Google Scholar] [CrossRef]
- Wang, W.G.; Shao, Q.X.; Yang, T.; Peng, S.Z.; Yu, Z.B.; Taylor, J.; Xing, W.Q.; Zhao, C.P.; Sun, F.C. Changes in daily temperature and precipitation extremes in the Yellow River Basin, China. Stoch. Environ. Res. Risk Assess. 2013, 27, 401–421. [Google Scholar] [CrossRef]
- Allan, R.P.; Soden, B.J. Atmospheric warming and the amplification of precipitation extremes. Science 2008, 321, 1481–1484. [Google Scholar] [CrossRef] [PubMed] [Green Version]
- Knapp, A.K.; Beier, C.; Briske, D.D.; Classen, A.T.; Luo, Y.; Reichstein, M.; Smith, M.D.; Smith, S.D.; Bell, J.E.; Fay, P.A.; et al. Consequences of More Extreme Precipitation Regimes for Terrestrial Ecosystems. Bioscience 2008, 58, 811–821. [Google Scholar] [CrossRef]
- Micu, D.M.; Amihaesei, V.A.; Milian, N.; Cheval, S. Recent changes in temperature and precipitation indices in the Southern Carpathians, Romania (1961–2018). Theor. Appl. Climatol. 2021, 144, 691–710. [Google Scholar] [CrossRef]
- Guo, Q.K.; Cheng, S.Y.; Qin, W.; Ning, D.H.; Shan, Z.J.; Yin, Z. Vertical variation and temporal trends of extreme precipitation indices in a complex topographical watershed in the Hengduan Mountain Region, China. Int. J. Climatol. 2020, 40, 3250–3267. [Google Scholar] [CrossRef]
- Zhang, Q.; Xiao, M.Z.; Li, J.F.; Singh, V.P.; Wang, Z.Z. Topography-based spatial patterns of precipitation extremes in the Poyang Lake basin, China: Changing properties and causes. J. Hydrol. 2014, 512, 229–239. [Google Scholar] [CrossRef]
- Marshall, G.J.; Jylha, K.; Kivinen, S.; Laapas, M.; Dyrrdal, A.V. The role of atmospheric circulation patterns in driving recent changes in indices of extreme seasonal precipitation across Arctic Fennoscandia. Clim. Chang. 2020, 162, 741–759. [Google Scholar] [CrossRef]
- Shi, J.; Cui, L.L.; Wang, J.B.; Du, H.Q.; Wen, K.M. Changes in the temperature and precipitation extremes in China during 1961-2015. Quat. Int. 2019, 527, 64–78. [Google Scholar] [CrossRef]
- Li, C.Y.; Yang, H.; Zhao, J.J. Combinational anomalies of atmospheric circulation system and occurrences of extreme weather/climate events. Trans. Atmos. Sci. 2019, 42, 321–333. [Google Scholar] [CrossRef]
- Yao, Y.; Luo, D.H. An Asymmetric Spatiotemporal Connection between the Euro-Atlantic Blocking within the NAO Life Cycle and European Climates. Adv. Atmos. Sci. 2018, 35, 796–812. [Google Scholar] [CrossRef]
- Wazneh, H.; Gachon, P.; Laprise, R.; de Vernal, A.; Tremblay, B. Atmospheric blocking events in the North Atlantic: Trends and links to climate anomalies and teleconnections. Clim. Dyn. 2020, 21, e975–e987. [Google Scholar] [CrossRef]
- Quiquet, A.; Dumas, C. The GRISLI-LSCE contribution to the Ice Sheet Model Intercomparison Project for phase 6 of the Coupled Model Intercomparison Project (ISMIP6)—Part 1: Projections of the Greenland ice sheet evolution by the end of the 21st century. Cryosphere 2021, 15, 1015–1030. [Google Scholar] [CrossRef]
- Yoon, J.H.; Wang, S.Y.S.; Gillies, R.R.; Kravitz, B.; Hipps, L.; Rasch, P.J. Increasing water cycle extremes in California and in relation to ENSO cycle under global warming. Nat. Commun. 2015, 6, 8657–8663. [Google Scholar] [CrossRef] [PubMed] [Green Version]
- Zheng, Y.J.; Zhang, Q.; Luo, M.; Sun, P.; Singh, V.P. Wintertime precipitation in eastern China and relation to the Madden-Julian oscillation: Spatiotemporal properties, impacts and causes. J. Hydrol. 2020, 582, 124477–124495. [Google Scholar] [CrossRef]
- Zhang, J.; Sheng, Z.; Ma, Y.T.; He, Y.; Zuo, X.J.; He, M.Y. Analysis of the Positive Arctic Oscillation Index Event and Its Influence in the Winter and Spring of 2019/2020. Front. Earth Sci. 2021, 8, 580601–580633. [Google Scholar] [CrossRef]
- Zuo, J.Q.; Ren, H.L.; Li, W.J. Contrasting Impacts of the Arctic Oscillation on Surface Air Temperature Anomalies in Southern China between Early and Middle-to-Late Winter. J. Clim. 2015, 28, 4015–4026. [Google Scholar] [CrossRef]
- Chen, D.; Sun, J.Q.; Gao, Y. Effects of AO on the interdecadal oscillating relationship between the ENSO and East Asian winter monsoon. Int. J. Climatol. 2020, 40, 4374–4383. [Google Scholar] [CrossRef]

| Sequence | Indices | Descriptive Name | Definitions | Unit |
|---|---|---|---|---|
| 1 | TX10p | Cold daytimes | Count of days where TX < 10th percentile | % of days |
| 2 | TN10p | Cold nights | Count of days where TN < 10th percentile | % of days |
| 3 | TX90p | Warm daytimes | Count of days where TX > 90th percentile | % of days |
| 4 | TN90p | Warm nights | Count of days where TN > 90th percentile | % of days |
| 5 | FD0 | Frost days | Annual count when daily minimum temperature < 0 °C | days |
| 6 | ID0 | Frozen days | Annual count when daily maximum temperature < 0 °C | days |
| 7 | SU25 | Summer days | Annual count when daily maximum temperature > 25 °C | days |
| 8 | TR20 | Number of tropical nights | Annual count of days in which Tmin > 20 °C | days |
| 9 | TXx | Max Tmax | The maximum daily maximum temperature per month | °C |
| 10 | TNx | Max Tmin | The maximum daily minimum temperature per month | °C |
| 11 | TXn | Min Tmax | The minimum daily maximum temperature per month | °C |
| 12 | TNn | Min Tmin | The minimum daily minimum temperature per month | °C |
| 13 | WSDI | Duration of warm periods | Annual count of days with at least six consecutive days in which Tmax > 90 percentile | days |
| 14 | CSDI | Duration of cold periods | Annual count of days with at least six consecutive days in which Tmin < 10 percentile | days |
| 15 | GSL | Length of growing season | The daily average temperature first appeared at least 6 consecutive days > 5 °C | days |
| 16 | DTR | Diurnal temperature range | Mean value of the difference between TX and TN | °C |
| 17 | R × 1 day | Maximum one-day precipitation | Maximum daily precipitation per month | mm |
| 18 | R × 5 day | Maximum one-day precipitation | Maximum precipitation for five consecutive days per month | mm |
| 19 | R95p | Very wet days | Annual total precipitation when daily precipitation > 95th percentile | mm |
| 20 | R99p | Extremely wet days | Annual total precipitation when daily precipitation > 99th percentile | mm |
| 21 | SDII | Simple daily intensity index | Annual total precipitation divided by the number of wet days in a year | mm/days |
| 22 | PRCPTOT | Annual total wet- day precipitation | Annual total precipitation in wet days (RR ≥1 mm) | mm |
| 23 | CDD | Consecutive dry days | Maximum number of consecutive days when RR < 1 mm | days |
| 24 | CWD | Consecutive wet days | Maximum number of consecutive days when RR ≥ 1 mm | days |
| 25 | R10 mm | Number of days above 10 mm | Annual count of days when precipitation ≥ 10 mm | days |
| 26 | R20 mm | Number of days above 20 mm | Annual count of days when precipitation ≥ 20 mm | days |
| 27 | R25 mm | Number of days above 25 mm | Annual count of days when precipitation ≥ 25 mm | days |
| Indices | Yunnan | Region I | Region II | Region III | Region IV | Region V |
|---|---|---|---|---|---|---|
| TX10p | −0.20 ** | −0.14 ** | −0.24 ** | −0.21 ** | −0.24 ** | −0.20 ** |
| TN10p | −0.40 ** | −0.40 ** | −0.31 ** | −0.31 * | −0.55 ** | −0.34 * |
| TX90p | 0.48 ** | 0.51 ** | 0.48 ** | 0.33 ** | 0.54 ** | 0.40 ** |
| TN90p | 0.45 ** | 0.44 ** | 0.38 ** | 0.29 ** | 0.51 ** | 0.52 ** |
| FD0 | −0.23 ** | −0.40 ** | −0.29 ** | −0.20 ** | −0.09 ** | −0.05 ** |
| ID0 | −0.01 ** | 0.00 | −0.02 | −0.04 | 0.00 | 0.00 |
| SU25 | 1.07 ** | 1.00 ** | 0.82 ** | 0.68 ** | 1.33 ** | 1.26 ** |
| TR20 | 0.52 ** | 0.14 ** | 0.25 ** | 0.33 ** | 0.88 ** | 1.12 ** |
| TXx | 0.04 ** | 0.04 ** | 0.03 ** | 0.04 ** | 0.03 ** | 0.04 ** |
| TNx | 0.03 ** | 0.02 ** | 0.02 ** | 0.02 ** | 0.03 ** | 0.04 ** |
| TXn | −0.01 | −0.01 ** | 0.02 | 0.02 | 0.03 | 0.02 |
| TNn | 0.04 ** | 0.05 ** | 0.03 ** | 0.03 * | 0.05 ** | 0.04 * |
| WSDI | 0.30 ** | 0.26 ** | 0.21 ** | 0.23 ** | 0.23 ** | 0.22 ** |
| CSDI | −0.17 ** | −0.13 ** | −0.10 ** | −0.12 ** | −0.28 ** | −0.16 ** |
| GSL | 0.04 | 0.01 ** | 0.17 ** | 0.02 | 0.00 | −0.06 |
| DTR | −0.03 | −0.21 ** | −0.01 ** | −0.01 ** | 0.00 | 0.00 |
| R × 1 day | 0.02 | 0.08 ** | 0.01 | 0.02 | −0.06 | 0.02 |
| R × 5 day | −0.22 | −0.15 ** | −0.32 * | 0.10 | −0.40 * | −0.15 |
| R95p | 0.00 | 0.09 ** | −0.66 | 1.41 | −1.18 | 0.42 |
| R99p | 0.04 | 0.16 ** | −0.10 | 0.52 | −0.63 | 0.24 |
| SDII | 0.00 | 0.01 ** | 0.00 | 0.02 * | 0.00 | 0.02 ** |
| CDD | 0.15 | 0.03 ** | 0.50 ** | 0.05 | 0.21 | −0.08 |
| CWD | −0.06 ** | −0.03 ** | −0.03 * | −0.04 ** | −0.11 ** | −0.05 ** |
| PRCPTOT | −2.48 * | −1.78 ** | −2.31 * | 1.08 | −5.12 ** | −1.96 |
| R10 mm | −0.08 | −0.07 ** | −0.08 | 0.04 | −0.13 * | −0.06 |
| R20 mm | −0.03 | −0.01 ** | −0.04 | 0.04 | −0.08 * | −0.01 |
| R25 mm | −0.02 | −0.01 ** | −0.02 | 0.03 | −0.06 * | −0.01 |
| Indices | Longitude | Latitude | Altitude | Indices | Longitude | Latitude | Altitude |
|---|---|---|---|---|---|---|---|
| TX10p | 0.00 | 0.00 | 0.00 | R × 1 day | −0.047 ** | 0.02 | −0.24 ** |
| TN10p | 0.00 | 0.00 | 0.00 | R × 5 day | −0.061 ** | −0.01 | −0.22 ** |
| TX90p | 0.00 | 0.00 | 0.00 | R95p | −0.044 ** | −0.02 | −0.201 ** |
| TN90p | 0.00 | 0.00 | 0.00 | R99p | −0.02 | −0.01 | −0.12 ** |
| FD0 | 0.0017 | 0.64 ** | 0.71 ** | SDII | −0.081 ** | −0.034 * | −0.23 ** |
| ID0 | 0.049 ** | 0.032 * | 0.19 ** | PRCPTOT | −0.077 ** | −0.069 ** | −0.26 ** |
| SU25 | −0.13 ** | −0.021 | −0.78 ** | CDD | 0.00 | −0.037 * | 0.072 ** |
| TR20 | −0.20 ** | 0.103 ** | −0.75 ** | CWD | −0.081 ** | −0.068 ** | −0.11 ** |
| TXx | −0.106 ** | 0.11 ** | −0.79 ** | R10 mm | −0.083 ** | −0.078 ** | −0.23 ** |
| TNx | −0.11 ** | 0.089 ** | −0.87 ** | R20 mm | −0.068 ** | −0.067 ** | −0.24 ** |
| TXn | −0.15 ** | −0.10 ** | −0.502 ** | R25 mm | −0.064 ** | −0.06 ** | −0.25 ** |
| TNn | −0.066 ** | −0.083 ** | −0.76 ** | ||||
| WSDI | 0.0061 | −0.027 | 0.012 | ||||
| CSDI | −0.01 | −0.01 | −0.11 ** | ||||
| GSL | −0.01 | −0.061 ** | −0.52 ** | ||||
| DTR | −0.077 ** | −0.047 ** | 0.16 ** |
| Indices | I | II | III | IV | Indices | I | II | III | IV |
|---|---|---|---|---|---|---|---|---|---|
| TX10p | −0.210 | −0.227 | −0.275 | −0.376 | R × 1 day | −0.466 | −0.102 | 0.338 | 0.010 |
| TN10p | −0.418 | −0.435 | −0.436 | −0.412 | R × 5 day | −0.953 | −1.051 | −1.405 | −1.883 |
| TX90p | 0.469 | 0.503 | 0.519 | 0.481 | R95P | 0.045 | 0.060 | 0.978 | 0.010 |
| TN90p | 0.461 | 0.477 | 0.453 | 0.454 | R99p | 0.910 | 0.012 | −0.018 | −0.414 |
| FD0 | −0.082 | −0.361 | −0.833 | −1.311 | SDII | 0.021 | −0.023 | −0.038 | −0.044 |
| ID0 | −0.023 | −0.081 | −0.139 | −0.276 | PRCPTOT | −9.448 | −9.208 | −8.913 | 12.631 |
| SU25 | 1.341 | 1.356 | 1.070 | 0.122 | CDD | −0.149 | 0.506 | 0.671 | 0.854 |
| TR20 | 0.294 | 0.303 | 0.309 | 0.242 | CWD | −0.109 | −0.098 | −0.093 | −0.128 |
| TXx | 0.048 | 0.053 | 0.065 | 0.086 | R10 mm | −0.314 | −0.285 | −0.296 | −0.373 |
| TNx | 0.032 | 0.032 | 0.032 | 0.034 | R20 mm | −0.117 | −0.180 | −0.191 | −0.317 |
| TXn | 0.058 | 0.057 | 0.065 | 0.073 | R25 mm | −0.102 | −0.153 | −0.146 | −0.261 |
| TNn | 0.054 | 0.050 | 0.047 | 0.050 | |||||
| WSDI | 0.274 | 0.297 | 0.307 | 0.243 | |||||
| CSDI | −0.242 | −0.169 | −0.131 | −0.115 | |||||
| GSL | 0.012 | 0.150 | 0.634 | 0.929 | |||||
| DTR | 0.004 | 0.018 | 0.033 | 0.027 |
| Lag Months | Indices | TX10p | TN10P | TX90p | TN90p | TXx | TNx | TXn | TNn | DTR | R × 1 day | R × 5 day |
| 0 | ENSO | 0.25 ** | 0.07 | −0.17 ** | −0.06 | −0.04 | −0.03 | −0.096 * | −0.04 | −0.06 | 0.01 | 0.01 |
| AO | 0.05 | 0.06 | −0.03 | −0.08 | −0.01 | 0.00 | 0.00 | 0.01 | 0.02 | 0.00 | −0.01 | |
| NAO | 0.14 ** | 0.07 | −0.13 ** | −0.13 ** | −0.20 ** | −0.27 ** | −0.27 ** | −0.26 ** | 0.20 ** | −0.21 ** | −0.19 ** | |
| 1 | ENSO | 0.07 | 0.05 | −0.17 ** | −0.11 * | −0.06 | −0.06 | −0.04 | −0.04 | 0.01 | 0.00 | 0.00 |
| AO | 0.06 | 0.08 | −0.05 | −0.11 * | −0.02 | −0.02 | −0.01 | 0.00 | 0.03 | 0.00 | −0.01 | |
| NAO | 0.12 ** | 0.05 | −0.19 ** | −0.15 ** | −0.30 ** | −0.298 ** | −0.28 ** | −0.26 ** | 0.11 * | −0.17 ** | −0.16 ** | |
| 2 | ENSO | 0.01 | −0.02 | −0.03 | 0.04 | −0.04 | −0.02 | −0.03 | −0.03 | −0.01 | 0.04 | 0.03 |
| AO | 0.07 | 0.10 * | −0.05 | −0.12 ** | −0.03 | −0.03 | −0.02 | −0.02 | 0.03 | −0.01 | −0.02 | |
| NAO | 0.04 | 0.05 | −0.09 * | −0.06 | −0.30 ** | −0.19 ** | −0.22 ** | −0.19 ** | 0.04 | −0.11 * | −0.1 * | |
| 3 | ENSO | 0.02 | −0.04 | −0.07 | 0.03 | −0.05 | −0.02 | −0.04 | −0.02 | −0.04 | 0.01 | 0.00 |
| AO | 0.07 | 0.11 * | −0.06 | −0.12 * | −0.04 | −0.04 | −0.03 | −0.02 | 0.03 | −0.01 | −0.02 | |
| NAO | 0.09 * | 0.05 | −0.10 * | −0.04 | −0.20 ** | −0.08 | −0.12 * | −0.08 | −0.08 | −0.01 | −0.02 | |
| Season | Indices | TX10p | TN10P | TX90p | TN90p | TXx | TNx | TXn | TNn | DTR | R × 1 day | R × 5 day |
| Spring | ENSO | 0.26 | 0.09 | 0.01 | −0.05 | −0.07 | −0.09 | −0.11 | −0.09 | −0.17 | 0.08 | 0.01 |
| AO | −0.26 | 0.07 | 0.06 | −0.03 | 0.10 | −0.09 | 0.29 | 0.05 | 0.41 * | −0.35 * | −0.25 | |
| NAO | 0.19 | 0.20 | −0.22 | −0.28 | −0.24 | −0.26 | −0.13 | −0.19 | −0.08 | 0.04 | 0.02 | |
| Summer | ENSO | 0.16 | 0.15 | −0.28 | −0.37 * | −0.27 | −0.41 * | −0.05 | −0.01 | −0.08 | 0.26 | 0.35 * |
| AO | 0.15 | 0.28 | 0.01 | 0.00 | 0.03 | 0.04 | −0.10 | −0.16 | 0.06 | −0.03 | −0.01 | |
| NAO | 0.24 | 0.40 * | −0.36 * | −0.51 ** | −0.30 * | −0.52 ** | −0.13 | −0.28 | −0.01 | 0.21 | 0.26 | |
| Autumn | ENSO | 0.14 | −0.19 | −0.30 | −0.16 | −0.29 | −0.21 | 0.02 | 0.04 | −0.28 | 0.20 | 0.19 |
| AO | 0.01 | 0.08 | 0.00 | −0.27 | −0.12 | −0.17 | −0.01 | 0.08 | 0.29 | −0.04 | −0.07 | |
| NAO | 0.13 | −0.15 | −0.16 | −0.14 | −0.19 | −0.22 | 0.00 | 0.12 | −0.11 | 0.07 | 0.16 | |
| Winter | ENSO | 0.42 ** | 0.24 | −0.26 | 0.02 | −0.28 | −0.09 | −0.34 * | −0.11 | −0.50 ** | 0.32 * | 0.40 * |
| AO | 0.22 | −0.02 | −0.18 | −0.02 | −0.26 | −0.09 | −0.24 | 0.01 | −0.21 | 0.28 | 0.24 | |
| NAO | 0.33 * | 0.18 | −0.16 | 0.11 | −0.12 | 0.11 | −0.05 ** | −0.19 | −0.40 ** | 0.30 * | 0.40 ** | |
| Indices (Annual) | ENSO | AO | NAO | Indices | ENSO | AO | NAO | |||||
| TX10p | 0.04 | 0.32 | 0.43 ** | R × 1 day | 0.16 | −0.03 | −0.06 | |||||
| TN10p | 0.11 | 0.27 | 0.36 * | R × 5 day | 0.09 | −0.08 | 0.00 | |||||
| TX90p | −0.01 | −0.21 | −0.39 * | R95p | −0.02 | −0.07 | −0.02 | |||||
| TN90p | −0.02 | −0.21 | −0.38 * | R99p | 0.11 | 0.00 | 0.02 | |||||
| FD0 | 0.00 | 0.11 | 0.31 | SDII | −0.02 | −0.21 | −0.16 | |||||
| ID0 | −0.17 | 0.12 | 0.22 | PRCPTOT | −0.03 | 0.04 | 0.18 | |||||
| SU25 | 0.01 | −0.24 | −0.37 * | CDD | −0.43 ** | −0.23 | −0.19 | |||||
| TR20 | 0.00 | −0.24 | −0.36 * | CWD | 0.07 | −0.03 | 0.17 | |||||
| TXx | 0.18 | −0.15 | −0.26 | R10 mm | −0.04 | 0.03 | 0.18 | |||||
| TNx | 0.20 | −0.15 | −0.25 | R20 mm | −0.07 | −0.04 | 0.07 | |||||
| TXn | −0.14 | −0.28 | −0.48** | R25 mm | −0.05 | −0.07 | 0.03 | |||||
| TNn | 0.00 | −0.08 | −0.29 | |||||||||
| WSDI | −0.04 | −0.19 | −0.28 | |||||||||
| CSDI | −0.09 | 0.10 | 0.21 | |||||||||
| GSL | −0.09 | −0.03 | −0.17 | |||||||||
| DTR | 0.13 | −0.20 | −0.22 | |||||||||
Publisher’s Note: MDPI stays neutral with regard to jurisdictional claims in published maps and institutional affiliations. |
© 2021 by the authors. Licensee MDPI, Basel, Switzerland. This article is an open access article distributed under the terms and conditions of the Creative Commons Attribution (CC BY) license (https://creativecommons.org/licenses/by/4.0/).
Share and Cite
Yan, W.; He, Y.; Cai, Y.; Cui, X.; Qu, X. Analysis of Spatiotemporal Variability in Extreme Climate and Potential Driving Factors on the Yunnan Plateau (Southwest China) during 1960–2019. Atmosphere 2021, 12, 1136. https://doi.org/10.3390/atmos12091136
Yan W, He Y, Cai Y, Cui X, Qu X. Analysis of Spatiotemporal Variability in Extreme Climate and Potential Driving Factors on the Yunnan Plateau (Southwest China) during 1960–2019. Atmosphere. 2021; 12(9):1136. https://doi.org/10.3390/atmos12091136
Chicago/Turabian StyleYan, Wenbo, Yunling He, Ya Cai, Xilin Cui, and Xinxing Qu. 2021. "Analysis of Spatiotemporal Variability in Extreme Climate and Potential Driving Factors on the Yunnan Plateau (Southwest China) during 1960–2019" Atmosphere 12, no. 9: 1136. https://doi.org/10.3390/atmos12091136
APA StyleYan, W., He, Y., Cai, Y., Cui, X., & Qu, X. (2021). Analysis of Spatiotemporal Variability in Extreme Climate and Potential Driving Factors on the Yunnan Plateau (Southwest China) during 1960–2019. Atmosphere, 12(9), 1136. https://doi.org/10.3390/atmos12091136


