Article

Methane Emissions from Surface of Mangrove River on Hainan Island, China

1
CAS Key Laboratory of Mountain Ecological Restoration and Bioresource Utilization& Ecological Restoration and Biodiversity Conservation Key Laboratory of Sichuan Province, Chengdu Institute of Biology, Chinese Academy of Sciences, Chengdu 610041, China
2
University of Chinese Academy of Sciences, Beijing 100049, China
3
Research Institute of Tropical Forestry, Chinese Academy of Forestry, Guangzhou 510520, China
*
Author to whom correspondence should be addressed.
Atmosphere 2021, 12(9), 1126; https://doi.org/10.3390/atmos12091126
Submission received: 29 July 2021 / Revised: 25 August 2021 / Accepted: 25 August 2021 / Published: 31 August 2021
(This article belongs to the Section Biometeorology and Bioclimatology)

Abstract

:
The surfaces of rivers are considered important sources of atmospheric methane (CH4), however research on this topic is still constrained, especially in freshwater rivers and with the consideration of spatial heterogeneity. Three regions (upper reaches, midstream and downstream) were selected to examine the CH4 fluxes from a freshwater river surface in a mangrove forest wetland from 2012 to 2013, using floating chambers. Results showed that the CH4 fluxes varied significantly among the three regions, with the lowest fluxes at downstream (0.50 ± 0.20 mg m−2 h−1), and highest at upper reaches (1.19 ± 0.36 mg m−2 h−1). The average emission rate at midstream was 0.95 ± 0.37 mg m−2 h−1. The methane flux also varied with seasons, with higher flux in rain-abundant seasons. On average, the CH4 flux in our research river was 0.88 ± 0.31 mg m−2 h−1, which was less than other tropical rivers. In addition, we found that the CH4 flux was significantly correlated with the water characteristics of temperature and atmospheric pressure. Thereby, this study quantified the methane emission from a freshwater river surface in a tropical mangrove forest, enriching the existing knowledge of river surface CH4 flux.

1. Introduction

Methane (CH4) is an important greenhouse gas, and is the second-most abundant after CO2 [1]. Previous research has shown that rivers could be important sources of atmospheric methane (CH4), but this remains uncertain due to a lack of global studies [2,3]. Global water CH4 emissions into the atmosphere were estimated at about 1.2–2.1 PgC·year−1 [4], of which more than 20% originated from freshwaters [5,6]. Research has also estimated that the CH4 emission from rivers is about 1.5 TgCH4·year−1 [4]. Despite their small area, rivers play an important role in the global methane budget [4].
CH4 is produced in anaerobic environments and the production process can be divided into the following three steps: (1) complex organic matter is transformed into monosaccharides by hydrolytic enzymes (synthesized by hydrolytic fermentation bacteria), and further fermented to synthesize fatty acids, carbon dioxide and hydrogen; (2) fatty acids, carbon dioxide and hydrogen are oxidized to acetic acid, CO2, and H2; (3) acetic acids are oxidated to CH4, or the CO2 is reduced by H2 to produce CH4 by acetoclastic methanogenesis (AM) and hydrogenotrophic methanogenesis (HM), respectively [7,8,9]. According to the pathway of CH4 formation in step (3), CH4 formation always divides into two pathways: (1) fermentation of acetate by AM; (2) acetate oxidation during which CO2 is reduced with H2 by HM. The dominant pathway of CH4 production is mainly determined by the substance supplying the methanogens [10].
In general, tropical regions were shown to have the highest CH4 emissions [11]. High content of organic matter, strong heat and strictly anaerobic environments were favorable for methanogens and were the main causes of high methane emission [12]. Freshwater rivers in these regions also have a large amount of carbon substrates [10] which supply abundant substance for methanogens, leading to a higher CH4 emission. Large amounts of CH4 emission from waters and rivers, especially through the water-gas interface, is an important source of CH4 emissions [12].
Rivers in mangrove wetlands are well adapted to the transition zone between land and sea and the river water body has a natural salinity difference [13,14]. At present, there are many studies on swamps and lakes, and relatively few studies on rivers. Some studies have shown that freshwater rivers, though small in proportion to entire wetlands, contribute more than their share of methane emissions [15,16].
At present the study of river methane emissions occurs mainly in the Amazon in South America, the Congo River basin in West Africa, the Mississippi River basin in North America, Costa Rica in Central America, and in some of Europe’s rivers [3,11,17,18,19,20,21,22]. In China, the research surrounding river CH4 flux is mainly concentrated in the Pearl River watershed, the Yangtze River basin, and in the Yellow River [23,24,25,26].
Rivers are an important source of atmospheric CH4 emission, especially in tropical areas [27]. We speculate that river-flow through the mangrove wetland may have a high CH4 emission rate due to the high organic carbon [13,14] and varied salinity, which could inhibit the activity of methanogens and their reduction in CH4 emission [15,28].
In tropical areas, rivers are characterized by fast substance-exchange such as available carbon, higher rainfall and higher oxygen levels [29]. These characteristics have led to the CH4 emissions in this region being more complex than those in temperate areas. Natural mangrove wetlands are the largest and earliest nature reserves in China. With the characteristics of tropical rivers, the rivers distributed throughout natural mangrove wetlands are also contaminated by human waste, which further increases the organic carbon in the water. Until now, the CH4 flux in such rivers has remained unknown, especially with consideration of spatial–temporal heterogeneity. Thus, the objectives of this study are: (1) to investigate the seasonal and spatial dynamics of CH4 flux from a typical river in mangrove wetland; (2) to examine the influencing factors of CH4 flux.

2. Materials and Methods

2.1. Study Site

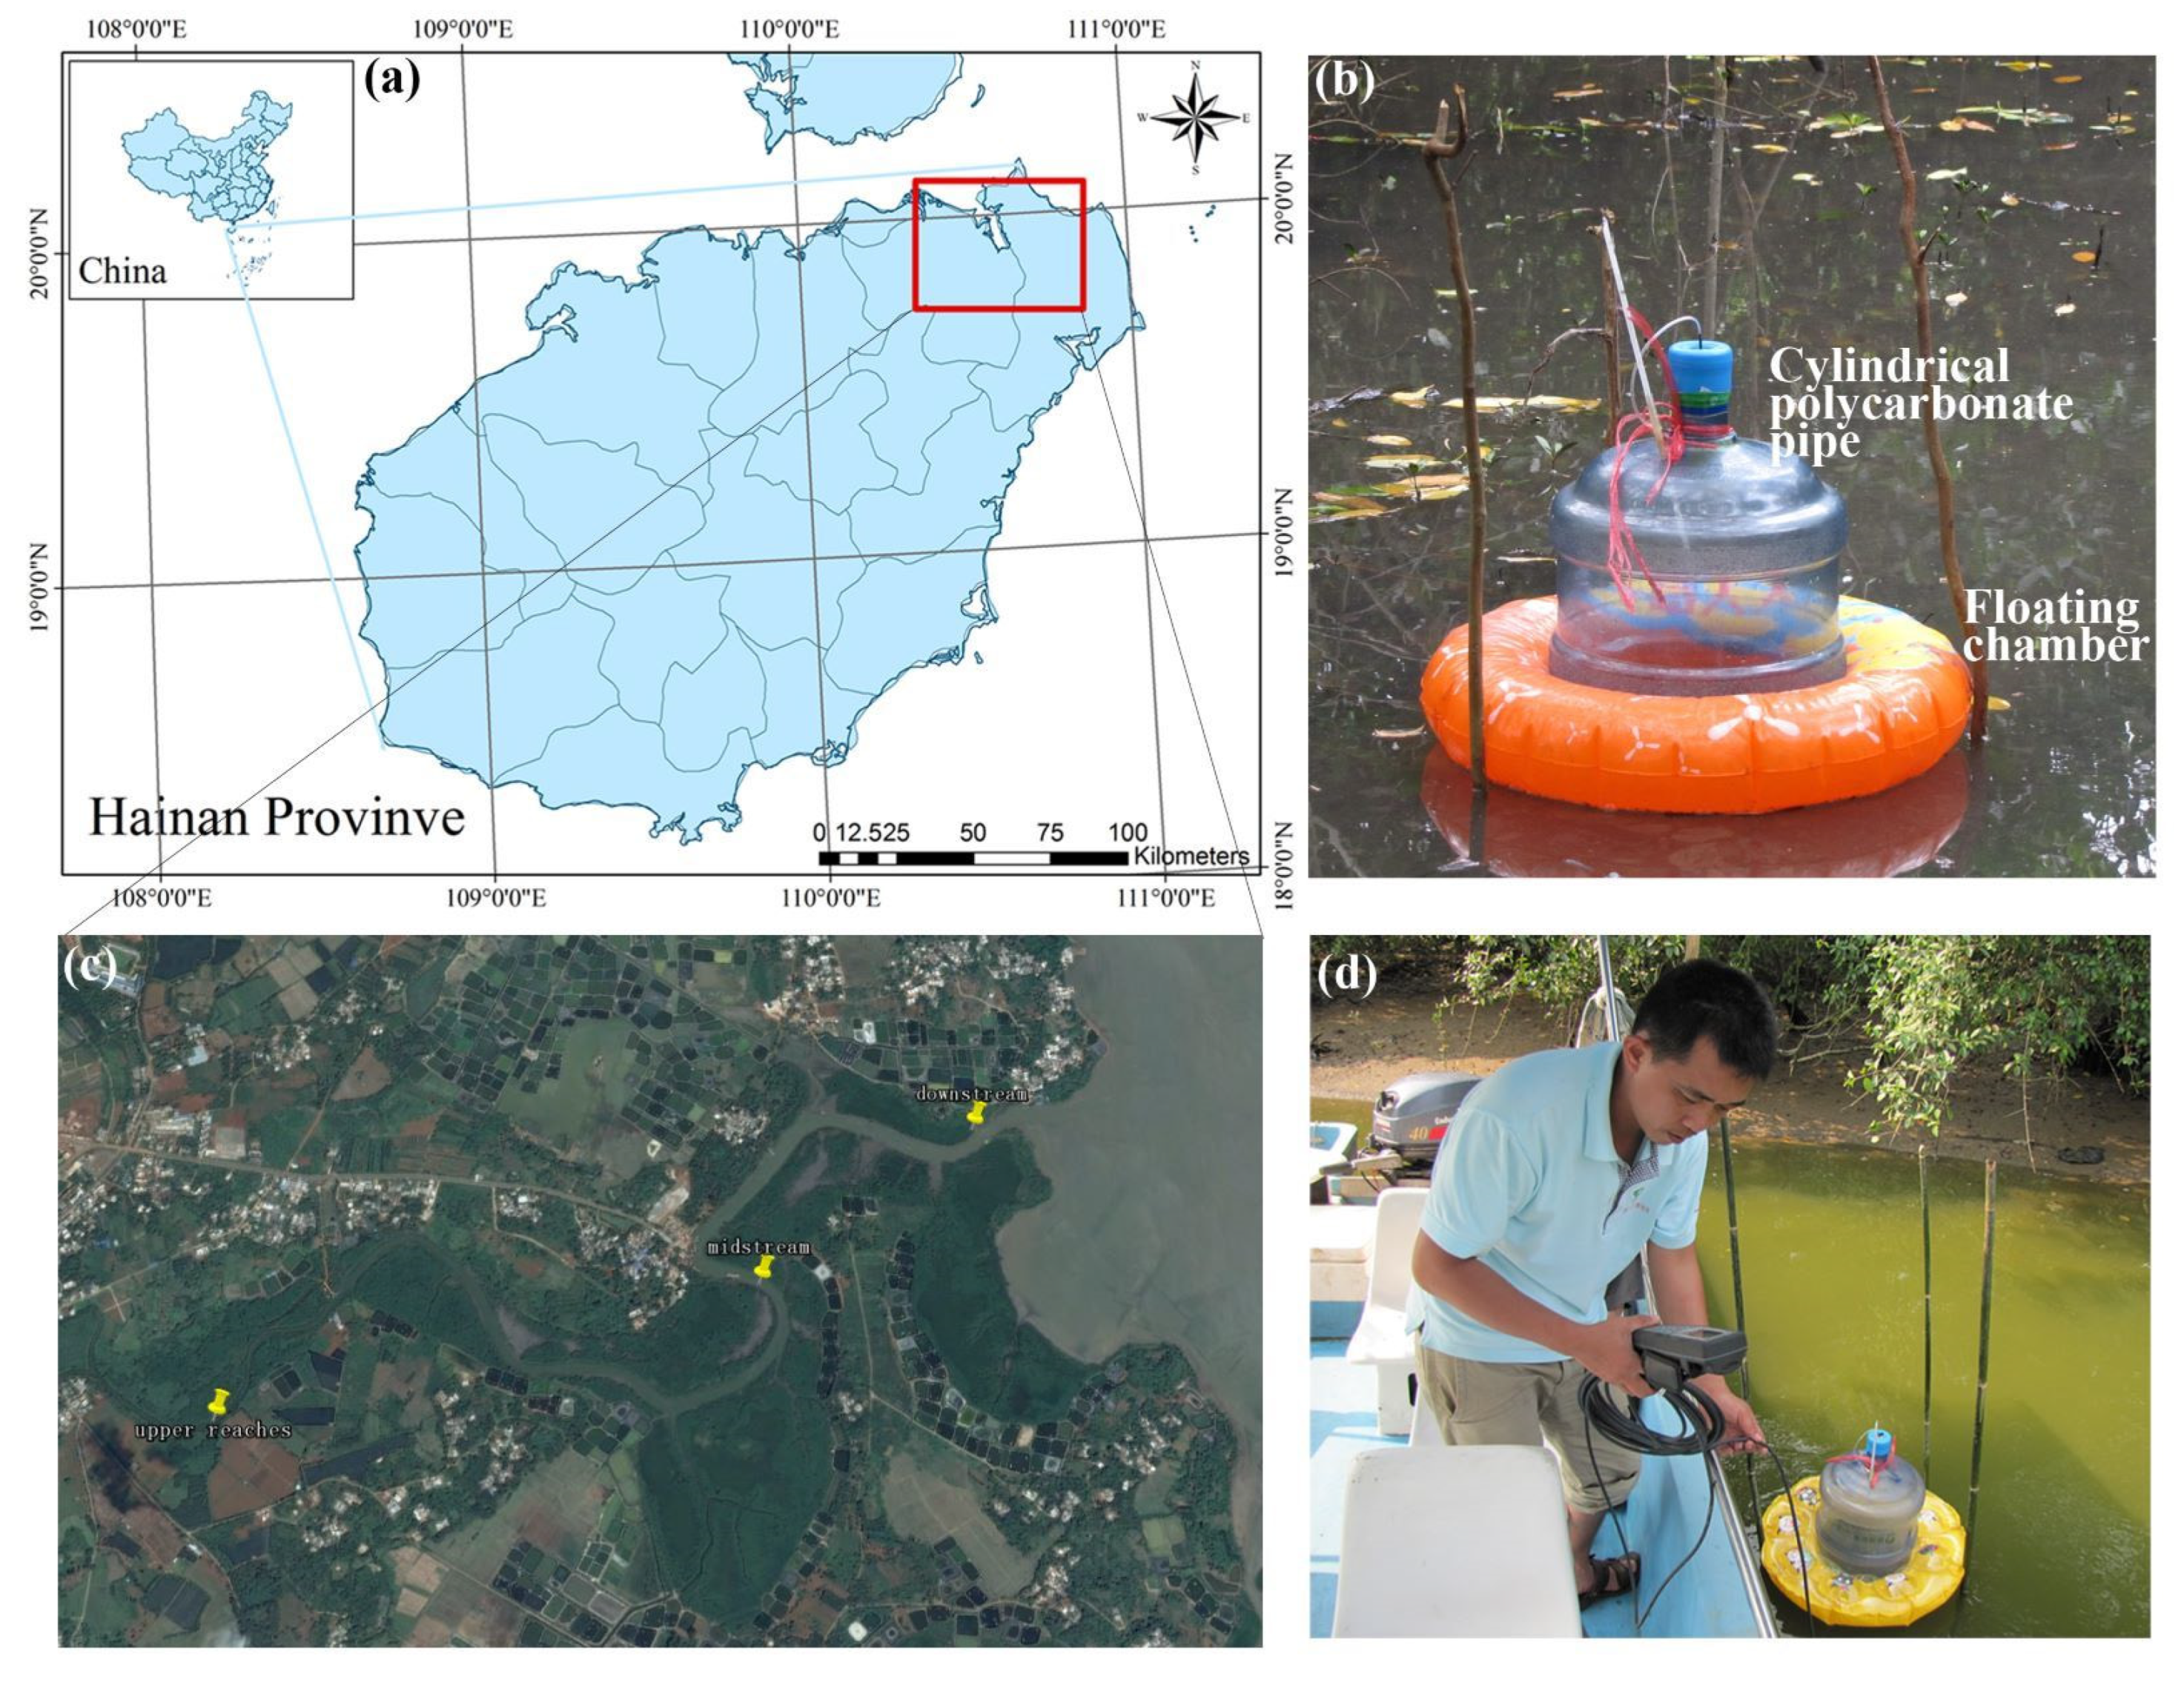
The river we studied was located in Dongzhaigang National Nature Reserve (19°57′–20°01′ N, 110°32′–110°37′ E), in the north east of Hainan province (Figure 1). Dongzhaigang National Nature Reserve is the first-founded (1980) and the largest mangrove forest reserve in China. It accounts for 44.51% of the mangrove forests of Hainan Island and holds the most abundant mangrove species.
The climate of Dongzhaigang National Nature Reserve is typical of tropical monsoon marine regions with an average rainfall of 1700–1933 mm, in which 80% occurs during May to October, and a mean annual temperature of 23.3–23.8 °C [30,31,32,33,34,35,36]. During the sampling period of 2012 to 2013, the average monthly air temperature was 25.78 °C, with the warmest monthly temperature of 29.94 °C in July 2013 and the coldest monthly temperature of 18.67 °C in December 2013. The rainfall in 2012 was 1657.0 mm (the data from January to March is absent), with a maximum rainfall of 351.2 mm in June and minimum rainfall of 18.6 mm in December. The rainfall in 2013 was lower (898.8 mm) than in 2012, with maximum rainfall of 251.4 mm in August and minimum rainfall of 3.4 mm in December (Figure 1).
The dominant plant species consisted of 26 mangrove species, such as Bruquiera gymnorrhiza, Kadelia candel, Bruquiera sexangula, Ceriops tagal, Aegiceras corniculatum, Sonneratia apetala, etc.
3 regions of the Yanfeng River were chosen for our research: (1) upper reaches (UP; 110°33′789″ E, 19°56′909″ N); midstream (MID; 110°34′729″ E, 19°57′076″ N), and downstream (DOWN; 110°35′138″ E, 19°57′326″ N) (Figure 1). The UP region is distal to the estuary, is rarely influenced by tides and its salinity is lowest. The DOWN region is near the estuary, is severely influenced by tides, and its salinity is highest. The MID region is the transition area between UP and DOWN. The hydrological environments of the three regions also differed.

2.2. Gas Sampling

Three plots at each region of the river were established to measure the CH4 flux of the water surface, using vented closed chambers (26 cm in diameter, 46 cm in height) which consisted of two parts. One was made out of a cylindrical polycarbonate (PC) pipe, and the other was made out of a gas filled floating chamber (Figure 2c,d) [37,38]. Three plots were selected with a distance of about 20 m, and the distance to riverbank was 4 m. The CH4 was measured monthly from February 2012 to December 2013. The gas was sampled from 8:30 a.m. to 11:30 p.m., with 10 mL disposable vacuum tubes at 10 min intervals over a 30 min period after floating on the water. The air temperature inside the chamber was measured at 0 and 30 min. The concentration of CH4 in the samples was determined by a gas chromatograph (Agilent 7890A, Agilent Co., Santa Clara, CA, USA) equipped with a flame ionization detector (FID), which operated at 350 °C. The Nickel conversion furnace temperature was maintained at 350 °C. The column temperature was maintained at 250 °C and the carrier gas was pure nitrogen at a flow rate of 20 mL min−1, the combustion gas was air at a flow rate of 500 mL min−1, the combustion supporting gas was pure hydrogen with a flow rate of 50 mL min−1.
The flux (mg CH4 m−2 h−1) of CH4 was calculated as:
J = dc   dt M V 0 P P 0 M V 0 T 0 T H
where dC/dt (mol·h−1) is the rate of concentration change; M (mg mol−1) is the molar mass of CH4; P (Pa) is the atmospheric pressure of the sampling site; T (K) is the absolute temperature at the sampling time; V0 (m3), P0 (Pa), T0 (k) are the molar volume, atmospheric pressure, and absolute temperature, respectively, under the standard condition; H (m) is the chamber height over the water surface.

2.3. Water Sampling and Analysis

Water was collected in 10 mL glass bottles monthly and randomly at our sampling site, and was transported to the lab at 4 °C and analyzed within one week. The characteristics of water temperature, salinity, pH, oxidation–reduction potential (ORP) and conductivity were measured during sampling using a portable digital meter (YSI ProPlus Portable multi-parameter water quality analyzer, USA). The water and air temperature were also measured using a handheld digital thermometer, and air pressure was measured monthly. In the lab, water DOC, NO 3 -N, NH 4 + -N and PO 4 3 -P concentrations were analyzed using a continuous flow analytical system (SKALAR San++, SKALAR Co., Breda, The Netherlands). Before DOC measurement, the sampled water was filtered through a 0.45 μm cellulose acetate membrane filter, and before other index measurements the sampled water was filtered through filter paper to eliminate the impurities.

2.4. Statistical Analysis

The difference in CH4 emissions from different regions of the river was analyzed by one-way analysis of variance (ANOVA). ANOVA was also used to compare the differences in water temperature, salinity, pH, oxidation–reduction potential, conductivity, DOC, NO 3 -N, NH 4 + -N and PO 4 3 -P among the three regions. The relationships between CH4 flux and CH4 concentration in water, air and water temperatures and DOC concentration were detected by regression analysis. All data were analyzed using SPSS 22.0 for Windows (SPSS Inc., Chicago, IL, USA) and all graphs were drawn using Origin Pro 8.1.

3. Results

3.1. Water Characteristics and Environmental Factors

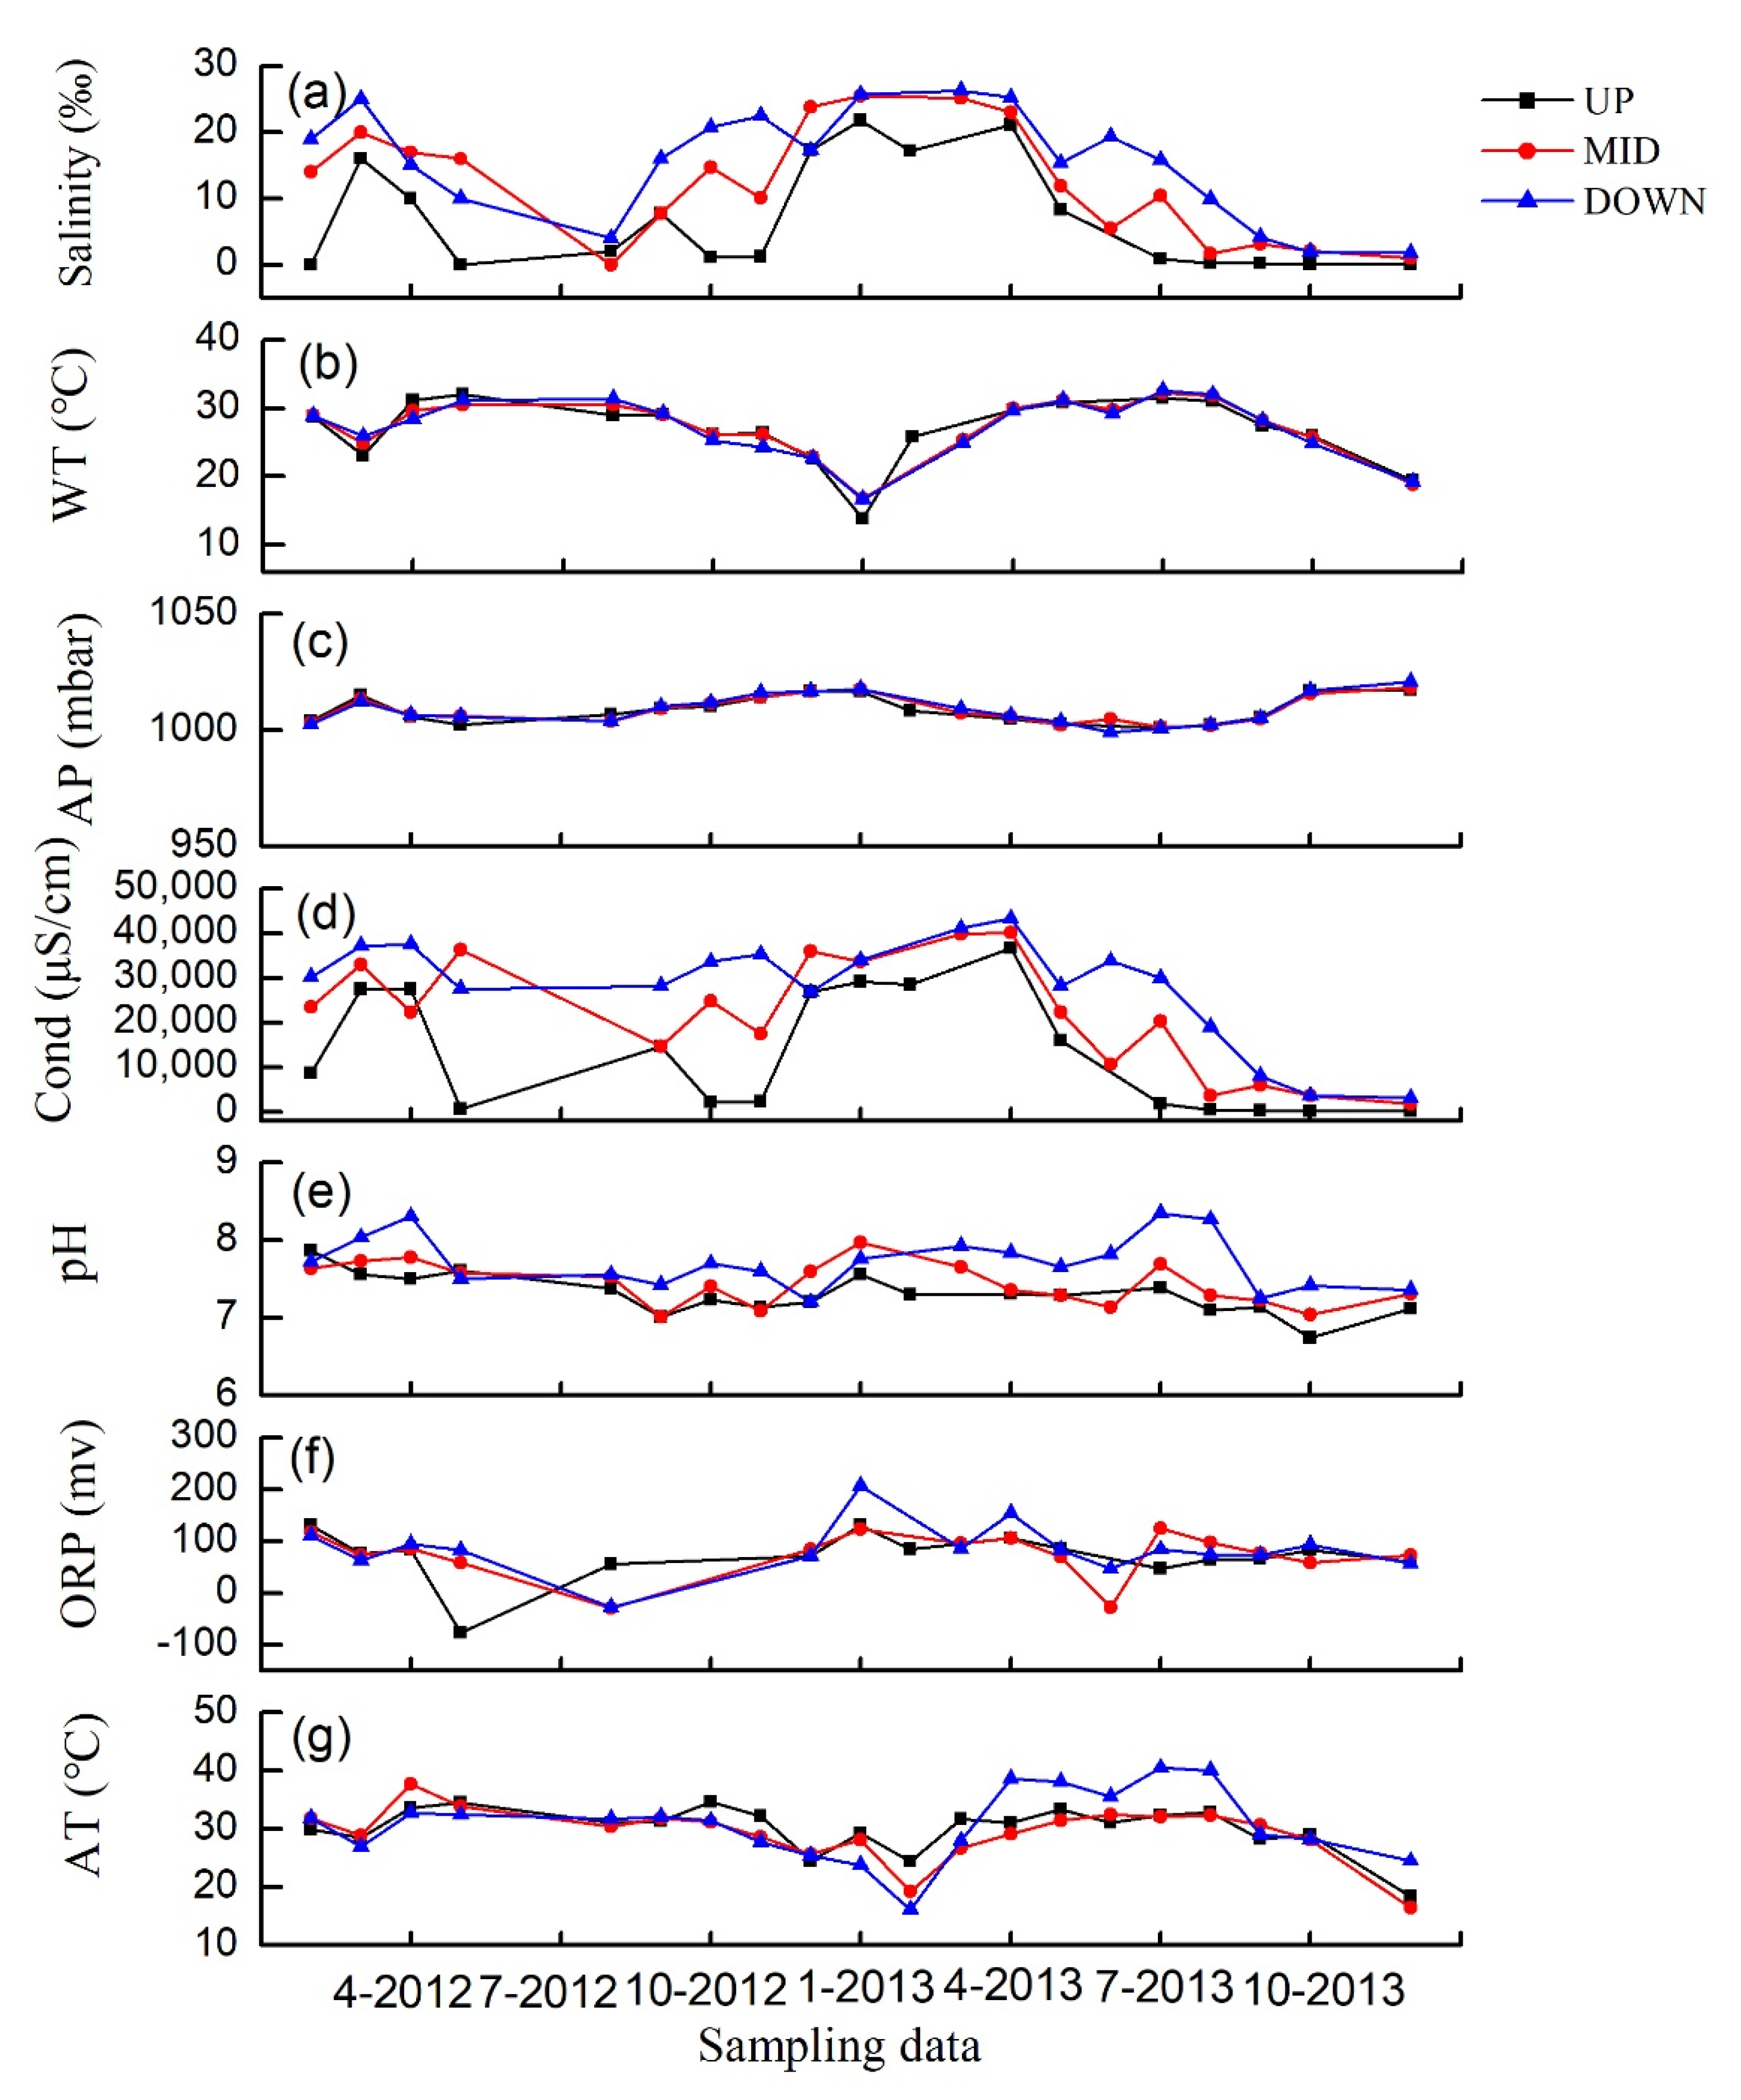
Of the environmental factors, water salinity and conductivity significantly increased from UP to DOWN (p < 0.05 for both). The same was true for pH and PO 4 3 -P (p < 0.05 for both). Other characteristics did not show any significant difference among the three regions (Table 1). In addition, salinity, water temperature, conductivity, ORP, and air temperature also varied seasonally (Figure 3a–g).

3.2. CH4 Fluxes

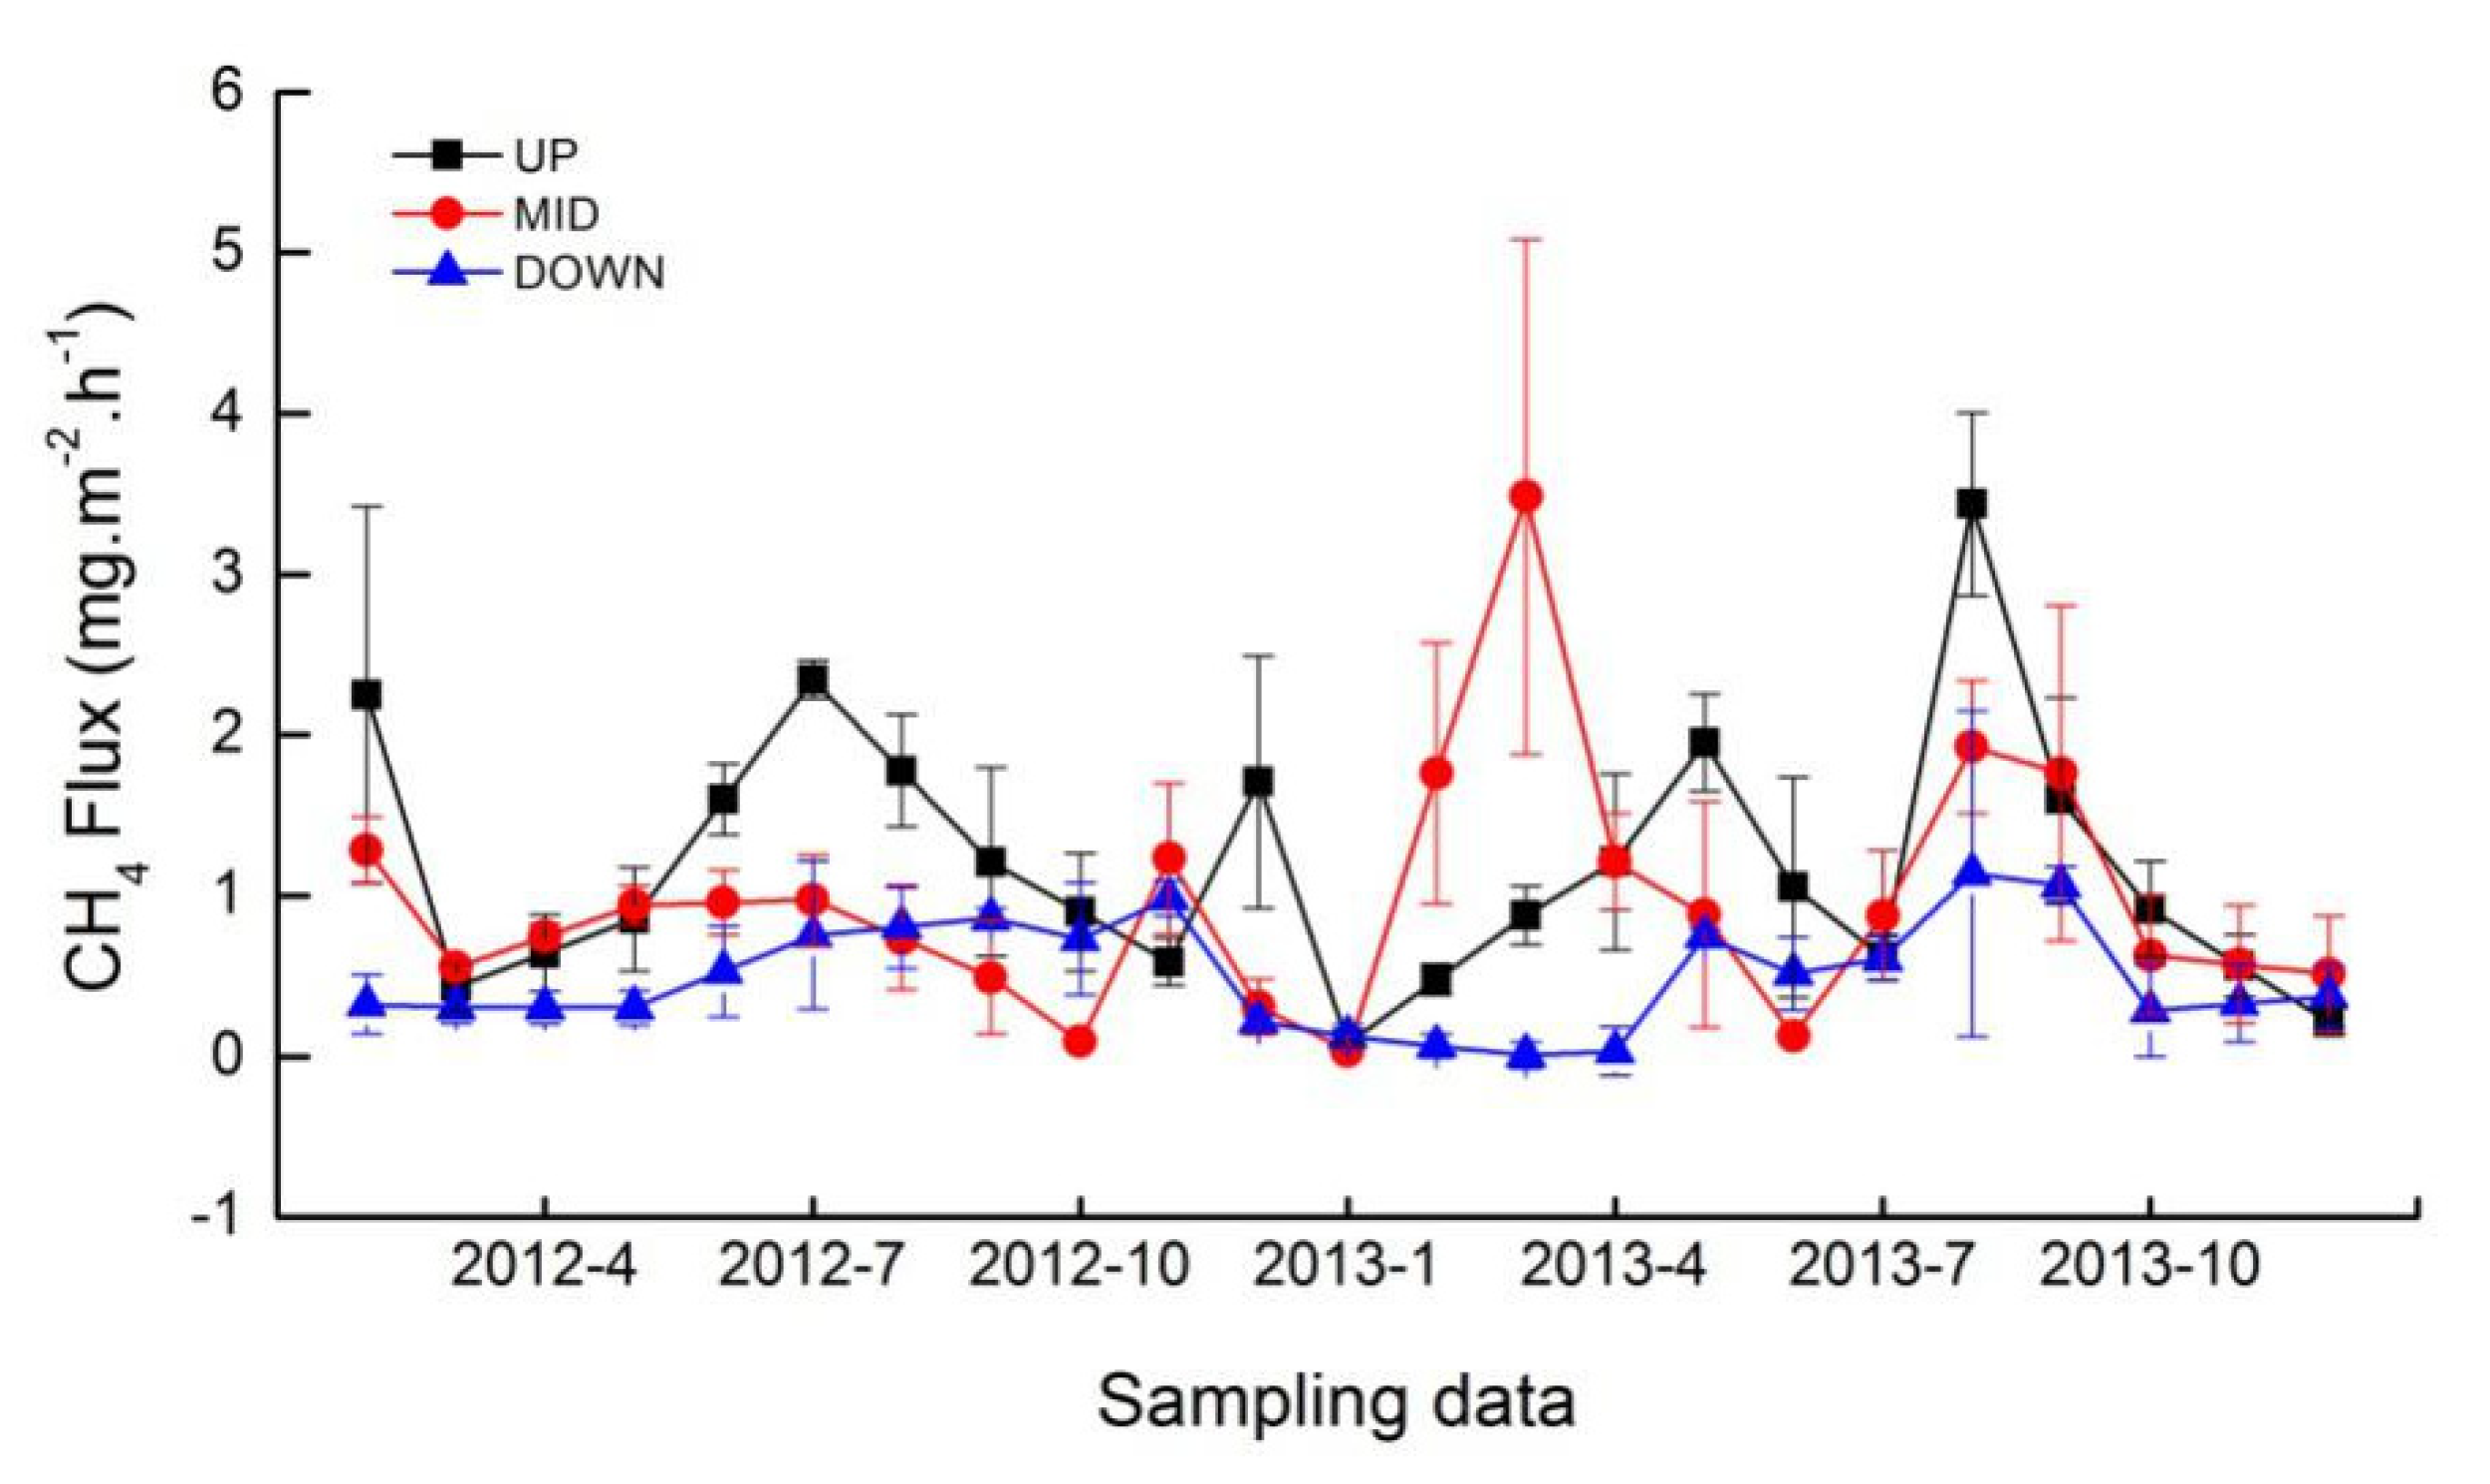
The CH4 fluxes of the three regions varied by month (Figure 3). At the UP region, higher CH4 flux was observed during June to September 2012 and May and August 2013. At the MID region, higher CH4 flux was observed during Feb. to Apr. and June to Aug. 2013. At the DOWN region, higher CH4 flux was observed during the later months of each year. In summary, higher CH4 fluxes were observed in rain-abundant seasons at the UP and MID regions and later in the rainy season at the DOWN region.
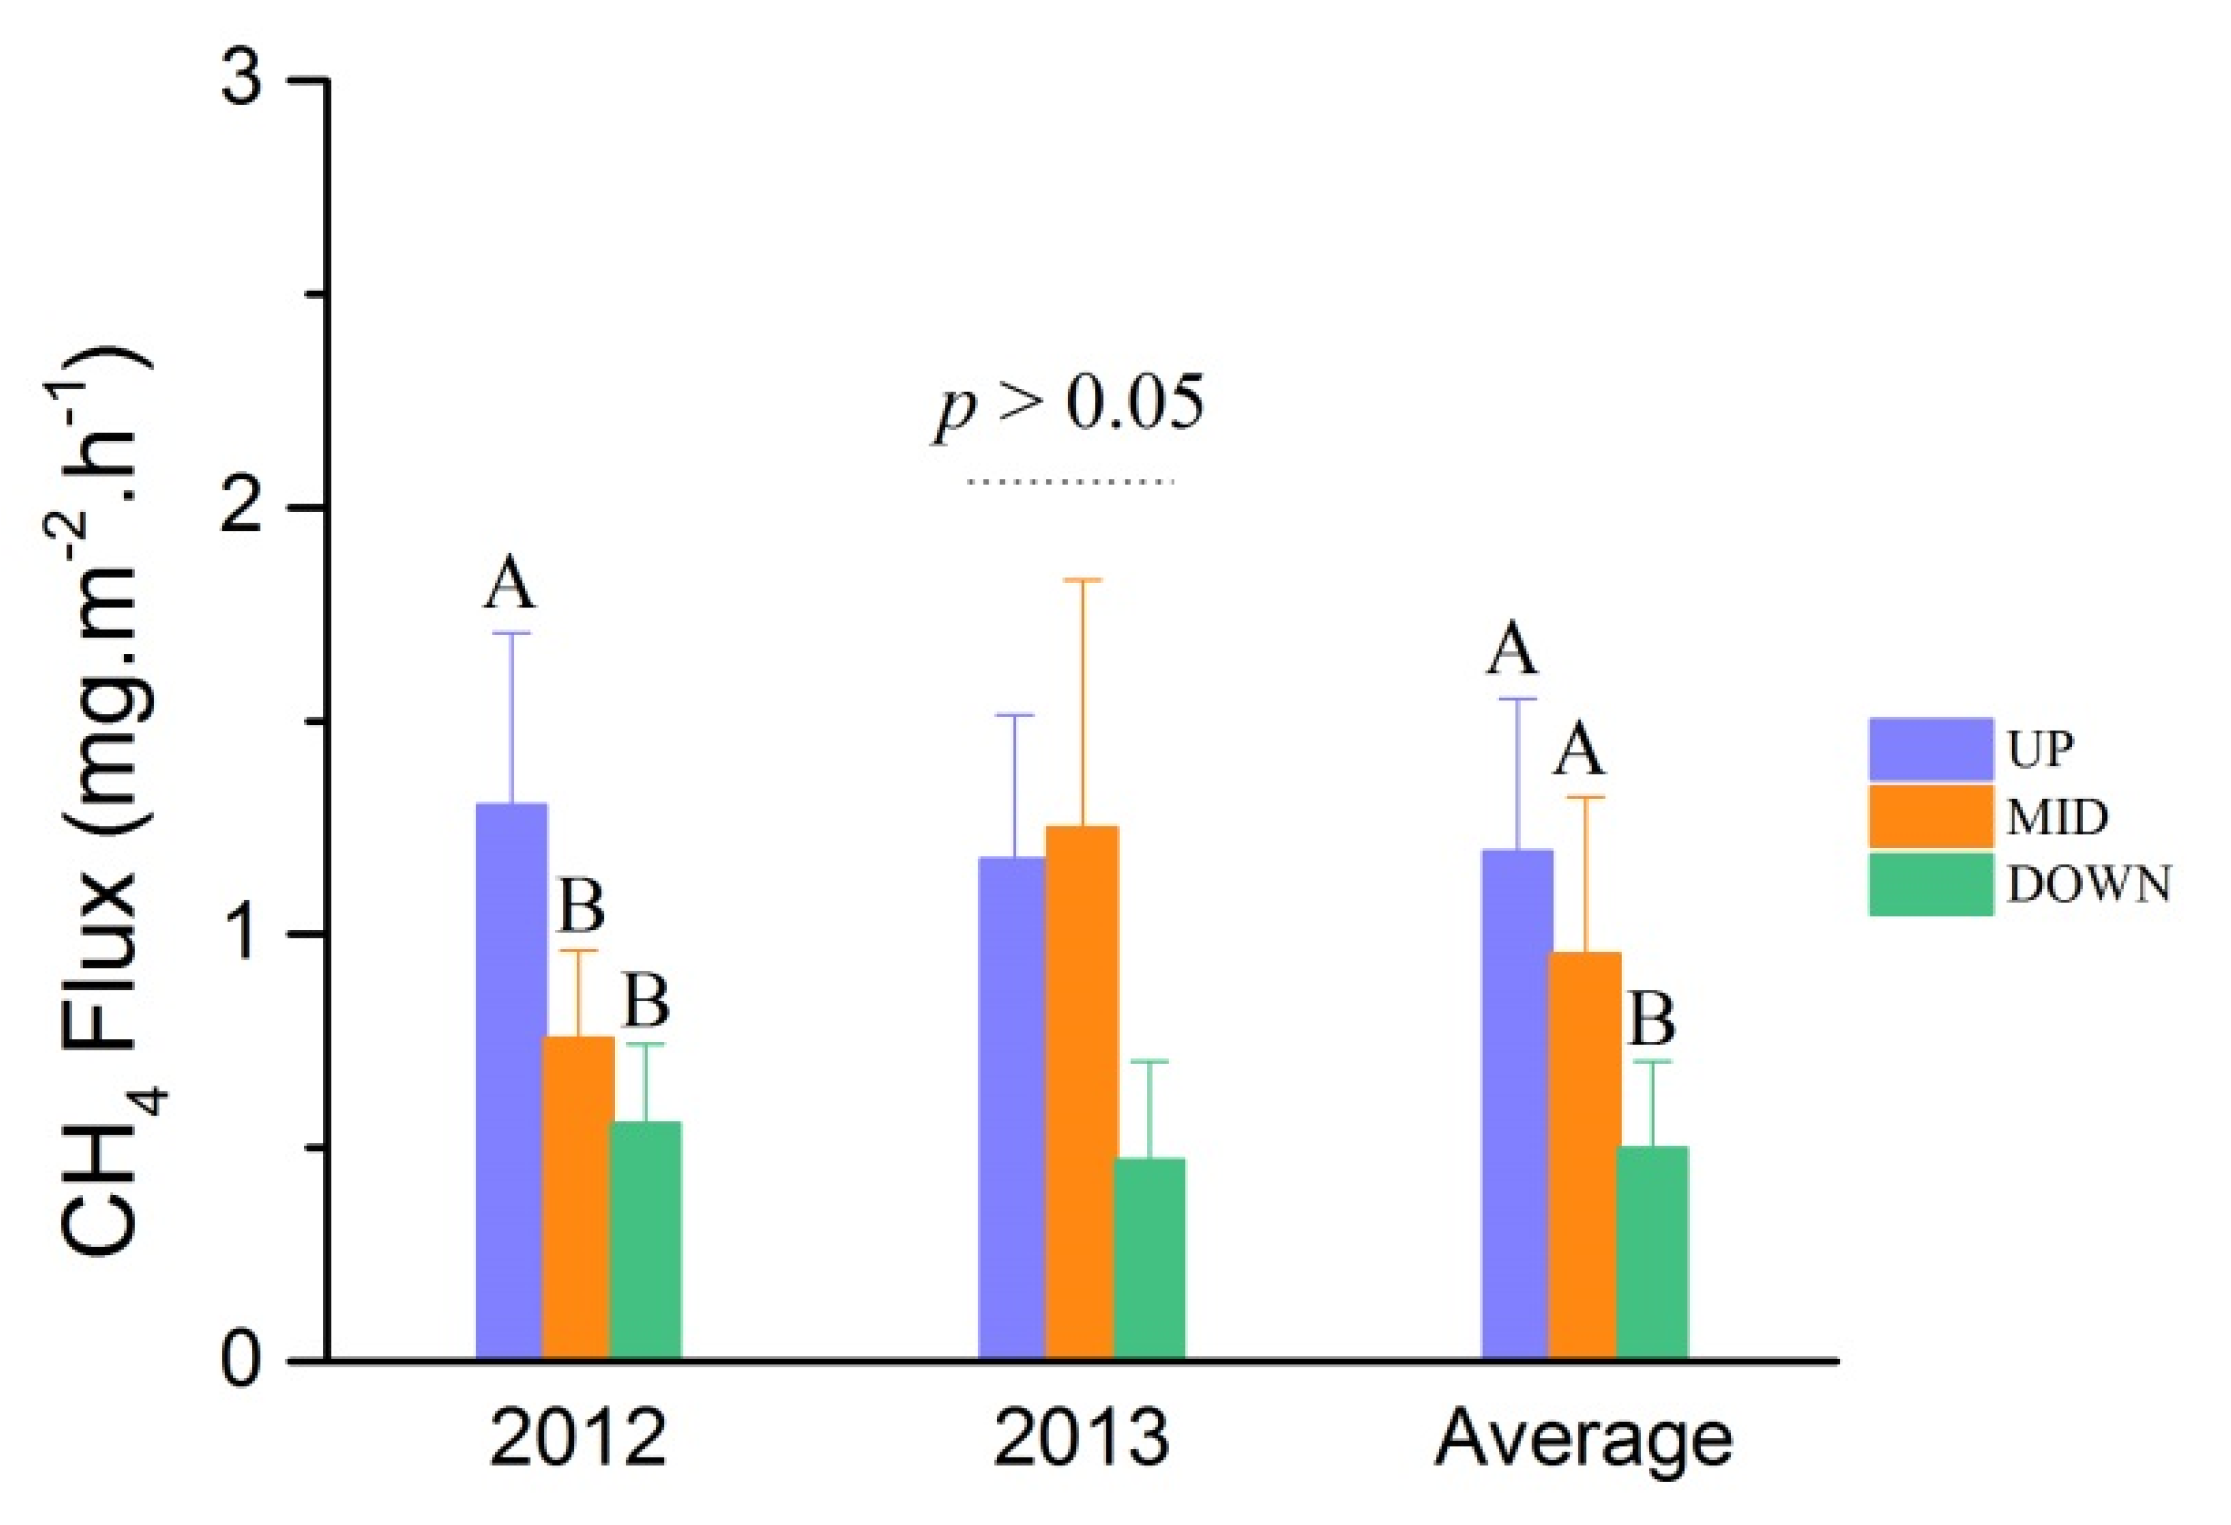
Of the three regions, the UP region had significantly higher CH4 fluxes than the MID and DOWN regions in 2012 (p < 0.01). Additionally, the UP and MID regions had relatively higher CH4 fluxes than DOWN regions in 2013 (p > 0.05). On average, the CH4 fluxes were higher at the UP (1.19 ± 0.36 mg CH4 m−2 h−1) and MID (0.95 ± 0.37 mg CH4 m−2 h−1) regions than at the DOWN region (0.49 ± 0.20 mg CH4 m−2 h−1; p < 0.01; Figure 4 and Figure 5).

3.3. Relationship between Methane Fluxes and Factors

Correlation tests were conducted among CH4 fluxes and water environment factors. The results showed that the significantly correlated variables were different among the three regions. At the UP region, water temperature was significantly positively correlated with CH4 fluxes and atmospheric pressure was significantly negatively correlated with CH4 fluxes. The MID and DOWN regions did show any significant correlations with water variables (Table 2).

4. Discussion

4.1. Comparisons with Other Studies

The CH4 flux in our study ranged from 0.47 to 1.30 mg CH4 m−2 h−1, which was severely lower than in other research [3,39,40,41] (Table 3). The possible reason was that we neglected the pathway of ebullition of CH4 emission, resulting in relatively lower CH4 flux. With deeper research about CH4 flux in waters and lakes, results have found that ebullition is one of the dominant pathways in open water CH4 flux [4]. In general, the CH4 flux in tropical and subtropical open water/water bodies was relatively higher, such as in the open water in India and South America [40,41]. Polluted water CH4 fluxes were also higher than other water bodies due to their relatively high organic carbon, such as one open water-source in India [3]. On the contrary, the CH4 flux in water bodies with lower organic carbon in sediments was lower than natural water bodies [42]. In addition, macrophytes were also one of critical factors enhancing water bodies CH4 flux, as was observed in South America [40]. Macrophytes could supply an abundance of organic matter into waters, which is the original substance during CH4 production, and may therefore lead to higher CH4 flux [43].

4.2. Spatial and Seasonal Variations of CH4 Fluxes

Without four seasons, time frames in our research were divided into rainy season (end of March to the beginning of November)) and dry season (beginning of November to the end of March). Some research has showed that heavy rain enhances CH4 emission in North India [42] with obviously seasonal dynamics. Some research has showed that the CH4 fluxes did not vary with seasons, such as in Amazon River basin [45]. Research in Pantanal also showed that the emission of CH4 was slightly higher during the rainy season than the dry season [40]. The seasonal dynamic of CH4 fluxes in tropical rivers is still controversial. In our research, we found that the CH4 fluxes were higher in the rainy season than in the dry season.
The CH4 fluxes in our research also had significant spatial variability, with the highest flux at the UP region in 2012, and relatively higher flux at the UP and MID regions in 2013. Taken together, a relatively higher emission rate was observed at the UP region. The abnormal or extreme value of the middle reaches is mainly due to the presence of the town and severe human activity.

4.3. Effect of Environmental Factors on CH4 Fluxes

The heterogeneity of CH4 throughout seasons and sites mainly resulted from the variation of water characteristics [17]. Of the water characteristics, salinity is one of the most critical factors. Numerous studies have shown that higher salinity consistently reduces CH4 emission in waters by inhibiting methanogen activities [46]. The inhibiting effect of salinity on CH4 emission could explain why CH4 flux was higher in the rainy season. In the rainy season, an abundance of water reduces water salinity and its inhibiting effect on methanogens, together resulting in a higher CH4 flux [13,38]. The inhibiting effect of salinity on methanogens also could explain the higher CH4 flux in the UP region. The UP region, which is far from the bay and was little-affected by tides, has a relatively low salinity and higher CH4 flux.
Water temperature and air pressure were also critical factors in influencing CH4 flux, as observed in our study. Research has showed that water temperature affects CH4 flux through regulating methanogen activity. Atmospheric pressure is always negatively correlated with CH4 flux, for higher air pressure inhibits the emission of CH4 from water to air. Higher air pressure also reduces the transportation of bubbles to air, reducing CH4 flux. At our research site, extreme weather such as typhoons always causes low pressure and an increase in CH4 flux.

5. Conclusions

This research quantified the CH4 flux of a tropical river in a mangrove wetland. The results showed that CH4 flux varied significantly during rainy and dry seasons, and varied among regions of the river. In our river, the UP region always showed higher CH4 flux than the MIN and DOWN regions due to higher salinity which inhibits the activity of methanogens and reduces CH4 production. Water temperature also affected CH4 flux through regulating methanogen activity. Air pressure physically regulated CH4 flux through control of the transportation of CH4 from water to air. Our research could enrich the available data on river CH4 flux in tropical mangrove wetlands.

Author Contributions

Conceptualization, H.C.; methodology, J.H.; software, J.H.; validation, J.H. and W.G.; formal analysis, J.H.; investigation, J.H. and W.G.; resources, J.H. and W.G.; data curation, J.H.; writing—original draft preparation, J.H.; writing—review and editing, J.H.; visualization, J.H.; supervision, H.C.; project administration, H.C.; funding acquisition, H.C. All authors have read and agreed to the published version of the manuscript.

Funding

This research was funded by National Natural Science Foundation Item, grant number 31570480.

Acknowledgments

We give special thanks to Laboratory of Ecological Forecasting and Global Change, College of Forestry, Northwest A&F University for CH4 measurement. We also give special thanks to Research Institute of Tropical Forestry, Chinese Academy of Forestry for provide background basic data of study area.

Conflicts of Interest

The authors declare no conflict of interest.

References

  1. IPCC. Changes in Atmospheric Constituents and in Radiative Forcing; Cambridge University Press: Cambridge, UK, 2007. [Google Scholar]
  2. Matousu, A.; Rulik, M.; Tuser, M.; Bednarik, A.; Simek, K.; Bussmann, I. Methane dynamics in a large river: A case study of the Elbe River. Aquat. Sci. 2019, 81, 12. [Google Scholar] [CrossRef]
  3. Selvam, B.P.; Natchimuthu, S.; Arunachalam, L.; Bastviken, D. Methane and carbon dioxide emissions from inland waters in India–implications for large scale greenhouse gas balances. Glob. Chang. Biol. 2014, 20, 3397–3407. [Google Scholar] [CrossRef] [Green Version]
  4. Bastviken, D.; Tranvik, L.J.; Downing, J.A.; Crill, P.M.; Enrich-Prast, A. Freshwater Methane Emissions Offset the Continental Carbon Sink. Science 2011, 331, 50. [Google Scholar] [CrossRef] [Green Version]
  5. Aufdenkampe, A.K.; Mayorga, E.; Raymond, P.A.; Melack, J.M.; Doney, S.C.; Alin, S.R.; Aalto, R.E.; Yoo, K. Riverine coupling of biogeochemical cycles between land, oceans, and atmosphere. Front. Ecol. Environ. 2011, 9, 53–60. [Google Scholar] [CrossRef] [Green Version]
  6. Butman, D.; Raymond, P.A. Significant efflux of carbon dioxide from streams and rivers in the United States. Nat. Geosci. 2011, 4, 839–842. [Google Scholar] [CrossRef]
  7. Cao, M.K.; Gregson, K.; Marshall, S. Global methane emission from wetlands and its sensitivity to climate change. Atmos. Environ. 1998, 32, 3293–3299. [Google Scholar] [CrossRef]
  8. Serrano-Silva, N.; Sarria-Guzman, Y.; Dendooven, L.; Luna-Guido, M. Methanogenesis and Methanotrophy in Soil: A Review. Pedosphere 2014, 24, 291–307. [Google Scholar] [CrossRef]
  9. Zhe, L.; Shao, N.; Akinyemi, T.; Whitman, W.B. Methanogenesis. Curr. Biol. 2018, 28, 727–732. [Google Scholar]
  10. Dutta, M.K.; Bianchi, T.S.; Mukhopadhyay, S.K. Mangrove Methane Biogeochemistry in the Indian Sundarbans: A Proposed Budget. Front. Mar. Sci. 2017, 4, 1–15. [Google Scholar] [CrossRef] [Green Version]
  11. Sawakuchi, H.O.; Bastviken, D.; Sawakuchi, A.O.; Krusche, A.V.; Ballester, M.V.R.; Richey, J.E. Methane emissions from Amazonian Rivers and their contribution to the global methane budget. Glob. Chang. Biol. 2014, 20, 2829–2840. [Google Scholar] [CrossRef] [Green Version]
  12. Xiong, Y.; Wang, F.; Guo, X.; Liu, F.; Dong, S. Carbon dioxide and methane fluxes across the sediment-water interface in different grass carp Ctenopharyngodon idella polyculture models. Aquac. Environ. Interact. 2017, 9, 45–56. [Google Scholar] [CrossRef] [Green Version]
  13. Purvaja, R.; Ramesh, R.; Frenzel, P. Plant-mediated methane emission from an Indian mangrove. Glob. Chang. Biol. 2004, 10, 1825–1834. [Google Scholar] [CrossRef]
  14. Rosentreter, J.A.; Maher, D.T.; Ho, D.T.; Call, M.; Barr, J.G.; Eyre, B.D. Spatial and temporal variability of CO2 and CH4 gas transfer velocities and quantification of the CH4 microbubble flux in mangrove dominated estuaries. Limnol. Oceanogr. 2017, 62, 561–578. [Google Scholar] [CrossRef]
  15. Huertas, I.E.; de la Paz, M.; Perez, F.F.; Navarro, G.; Flecha, S. Methane Emissions From the Salt Marshes of Donana Wetlands: Spatio-Temporal Variability and Controlling Factors. Front. Ecol. Evol. 2019, 7, 1–15. [Google Scholar] [CrossRef] [Green Version]
  16. Kreuzwieser, J.; Buchholz, J.; Rennenberg, H. Emission of methane and nitrous oxide by Australian mangrove ecosystems. Plant Biol. 2003, 5, 423–431. [Google Scholar] [CrossRef]
  17. Allen, D.; Dalal, R.C.; Rennenberg, H.; Schmidt, S. Seasonal variation in nitrous oxide and methane emissions from subtropical estuary and coastal mangrove sediments, Australia. Plant Biol. 2011, 13, 126–133. [Google Scholar] [CrossRef]
  18. Sotomayor, D.; Corredor, J.E.; Morell, J.M. Methane flux from mangrove sediments along the southwestern coast of puerto rico. Estuaries 1994, 17, 140–147. [Google Scholar] [CrossRef]
  19. Truong, A.H.; Kim, M.T.; Thu, N.T.; Tung, N.N.; Trung, N.Q. Methane, Nitrous Oxide and Ammonia Emissions from Livestock Farming in the Red River Delta, Vietnam: An Inventory and Projection for 2000-2030. Sustainability 2018, 10, 3826. [Google Scholar] [CrossRef] [Green Version]
  20. Borges, A.V.; Abril, G.; Bouillon, S. Carbon dynamics and CO2 and CH4 outgassing in the Mekong delta. Biogeosciences 2018, 15, 1093–1114. [Google Scholar] [CrossRef] [Green Version]
  21. Natchimuthu, S.; Wallin, M.B.; Klemedtsson, L.; Bastviken, D. Spatio-temporal patterns of stream methane and carbon dioxide emissions in a hemiboreal catchment in Southwest Swedend. Sci. Rep. 2017, 7, 39729. [Google Scholar] [CrossRef]
  22. Upstill-Goddard, R.C.; Salter, M.E.; Mann, P.J.; Barnes, J.; Poulsen, J.; Dinga, B.; Fiske, G.J.; Holmes, R.M. The riverine source of CH4 and N2O from the Republic of Congo, western Congo Basin. Biogeosciences 2017, 14, 2267–2281. [Google Scholar] [CrossRef] [Green Version]
  23. Sun, Z.G.; Jiang, H.H.; Wang, L.L.; Mou, X.J.; Sun, W.L. Seasonal and spatial variations of methane emissions from coastal marshes in the northern Yellow River estuary, China. Plant Soil 2013, 369, 317–333. [Google Scholar] [CrossRef] [Green Version]
  24. Qu, B.; Aho, K.S.; Li, C.; Kang, S.; Sillanpaa, M.; Yan, F.; Raymond, P.A. Greenhouse gases emissions in rivers of the Tibetan Plateau. Sci. Rep. 2017, 7, 16573. [Google Scholar] [CrossRef] [Green Version]
  25. Zhang, L.; Xia, X.; Liu, S.; Zhang, S.; Li, S.; Wang, J.; Wang, G.; Gao, H.; Zhang, Z.; Wang, Q.; et al. Significant methane ebullition from alpine permafrost rivers on the East Qinghai–Tibet Plateau. Nat. Geosci. 2020, 13, 349–354. [Google Scholar] [CrossRef]
  26. Zhang, T.P.; Huang, X.Y.; Yang, Y.; Li, Y.L.; Dahlgren, R.A. Spatial and temporal variability in nitrous oxide and methane emissions in urban riparian zones of the Pearl River Delta. Environ. Sci. Pollut. Res. 2016, 23, 1552–1564. [Google Scholar] [CrossRef] [Green Version]
  27. Campeau, A.; Del Giorgio, P.A. Patterns in CH4 and CO2 concentrations across boreal rivers: Major drivers and implications for fluvial greenhouse emissions under climate change scenarios. Glob. Chang. Biol. 2014, 20, 1075–1088. [Google Scholar] [CrossRef]
  28. Wang, C.; Tong, C.; Chambers, L.G.; Liu, X. Identifying the Salinity Thresholds that Impact Greenhouse Gas Production in Subtropical Tidal Freshwater Marsh Soils. Wetlands 2017, 37, 559–571. [Google Scholar] [CrossRef]
  29. Yang, W.B.; Yuan, C.S.; Huang, B.Q.; Tong, C.; Yang, L. Emission Characteristics of Greenhouse Gases and Their Correlation with Water Quality at an Estuarine Mangrove Ecosystem—The Application of an In-Situ On-site NDIR Monitoring Technique. Wetlands 2018, 38, 723–738. [Google Scholar] [CrossRef]
  30. Ming, L.; Wang, L.J.; Wen-Hui, M.A.; Hong, M.L. A preliminary study of water pollution in Dongzhaigang national nature reserve. J. Hainan Norm. Univ. (Nat. Sci.) 2004, 2004, 282–285. [Google Scholar]
  31. Wang, Y.; Zuo, P.; Huang, Z.Q.; Zou, X.Q. Study of the Change of Mangrove Wetland Ecosystem and Driving Forces in Dongzhaigang. Sichuan Environ. 2006, 3, 44–49. [Google Scholar]
  32. Huang, X.; Wang, X.; Li, X.; Xin, K.; Yan, Z.; Sun, Y.; Bellerby, R. Distribution Pattern and Influencing Factors for Soil Organic Carbon (SOC) in Mangrove Communities at Dongzhaigang, China. J. Coast. Res. 2017, 34, 434–442. [Google Scholar] [CrossRef]
  33. Li, J.; Liao, Q.; Li, M.; Zhang, J.; Fungyee, T.N.; Xu, R. Community Structure and Biodiversity of Soil Ciliates at Dongzhaigang Mangrove Forest in Hainan Island, China. Appl. Environ. Soil Sci. 2010, 2010, 1–8. [Google Scholar] [CrossRef] [Green Version]
  34. Li, W.; Guan, W.; Chen, H.; Liao, B.; Hu, J.; Peng, C.; Rui, J.; Tian, J.; Zhu, D.; He, Y. Archaeal communities in the sediments of different mangrove stands at Dongzhaigang, China. J. Soil Sediments 2016, 16, 1995–2004. [Google Scholar] [CrossRef]
  35. Liao, Q.Y.; Li, J.; Zhang, J.H.; Li, M.; Lu, Y.; Xu, R.L. An ecological analysis of soil sarcodina at Dongzhaigang mangrove in Hainan Island, China. Eur. J. Soil Biol. 2009, 45, 214–219. [Google Scholar] [CrossRef]
  36. Wang, M.; Huang, Z.; Shi, F.; Wang, W. Are vegetated areas of mangroves attractive to juvenile and small fish? The case of Dongzhaigang Bay, Hainan Island, China. Estuar. Coast. Shelf Sci. 2009, 85, 208–216. [Google Scholar] [CrossRef]
  37. Chen, H.; Wu, N.; Yao, S.P.; Gao, Y.H.; Zhu, D.; Wang, Y.F.; Xiong, W.; Yuan, X.Z. High methane emissions from a littoral zone on the Qinghai-Tibetan Plateau. Atmos. Environ. 2009, 43, 4995–5000. [Google Scholar] [CrossRef]
  38. Zhu, D.; Chen, H.; Zhu, Q.A.; Wu, Y.; Wu, N. High Carbon Dioxide Evasion from an Alpine Peatland Lake: The Central Role of Terrestrial Dissolved Organic Carbon Input. Water Air. Soil Poll. 2012, 223, 2563–2569. [Google Scholar] [CrossRef]
  39. Bosse, U.; Frenzel, P. CH4 emissions from a West Siberian mire. Elektra 2001, 52, 99–114. [Google Scholar]
  40. Marani, L.; Alvala, P.C. Methane emissions from lakes and floodplains in Pantanal, Brazil. Atmos Environ. 2007, 41, 1627–1633. [Google Scholar] [CrossRef]
  41. Rajkumar, A.N.; Barnes, J.; Ramesh, R.; Purvaja, R.; Upstill-Goddard, R.C. Methane and nitrous oxide fluxes in the polluted Adyar River and estuary, SE India. Mar. Pollut. Bull. 2008, 56, 2043–2051. [Google Scholar] [CrossRef]
  42. Singh, S.N.; Kulshreshtha, K.; Agnihotri, S. Seasonal dynamics of methane emission from wetlands. Chemosphere–Glob. Chang. Sci. 2000, 2, 39–46. [Google Scholar] [CrossRef]
  43. Devol, A.H.; Richey, J.E.; Clark, W.A.; King, S.L.; Martinelli, L.A. Methane emissions to the troposphere from the Amazon floodplain. J. Geophys. Res. Atmos. 1988, 93, 1583–1592. [Google Scholar] [CrossRef]
  44. Mukhopadhyay, S.K.; Biswas, H.; De, T.K.; Sen, B.K.; Sen, S.; Jana, T.K. Impact of Sundarban mangrove biosphere on the carbon dioxide and methane mixing ratios at the NE Coast of Bay of Bengal, India. Atmos. Environ. 2002, 36, 629–638. [Google Scholar] [CrossRef]
  45. Bartlett, K.B.; Crill, P.M.; Bonassi, J.A.; Richey, J.E.; Harriss, R.C. Methane flux from the Amazon River floodplain: Emissions during rising water. J. Geophys. Res. Atmos. 1990, 95, 16773–16788. [Google Scholar] [CrossRef]
  46. Poffenbarger, H.J.; Needelman, B.A.; Megonigal, J.P. Salinity Influence on Methane Emissions from Tidal Marshes. Wetlands 2011, 31, 831–842. [Google Scholar] [CrossRef]
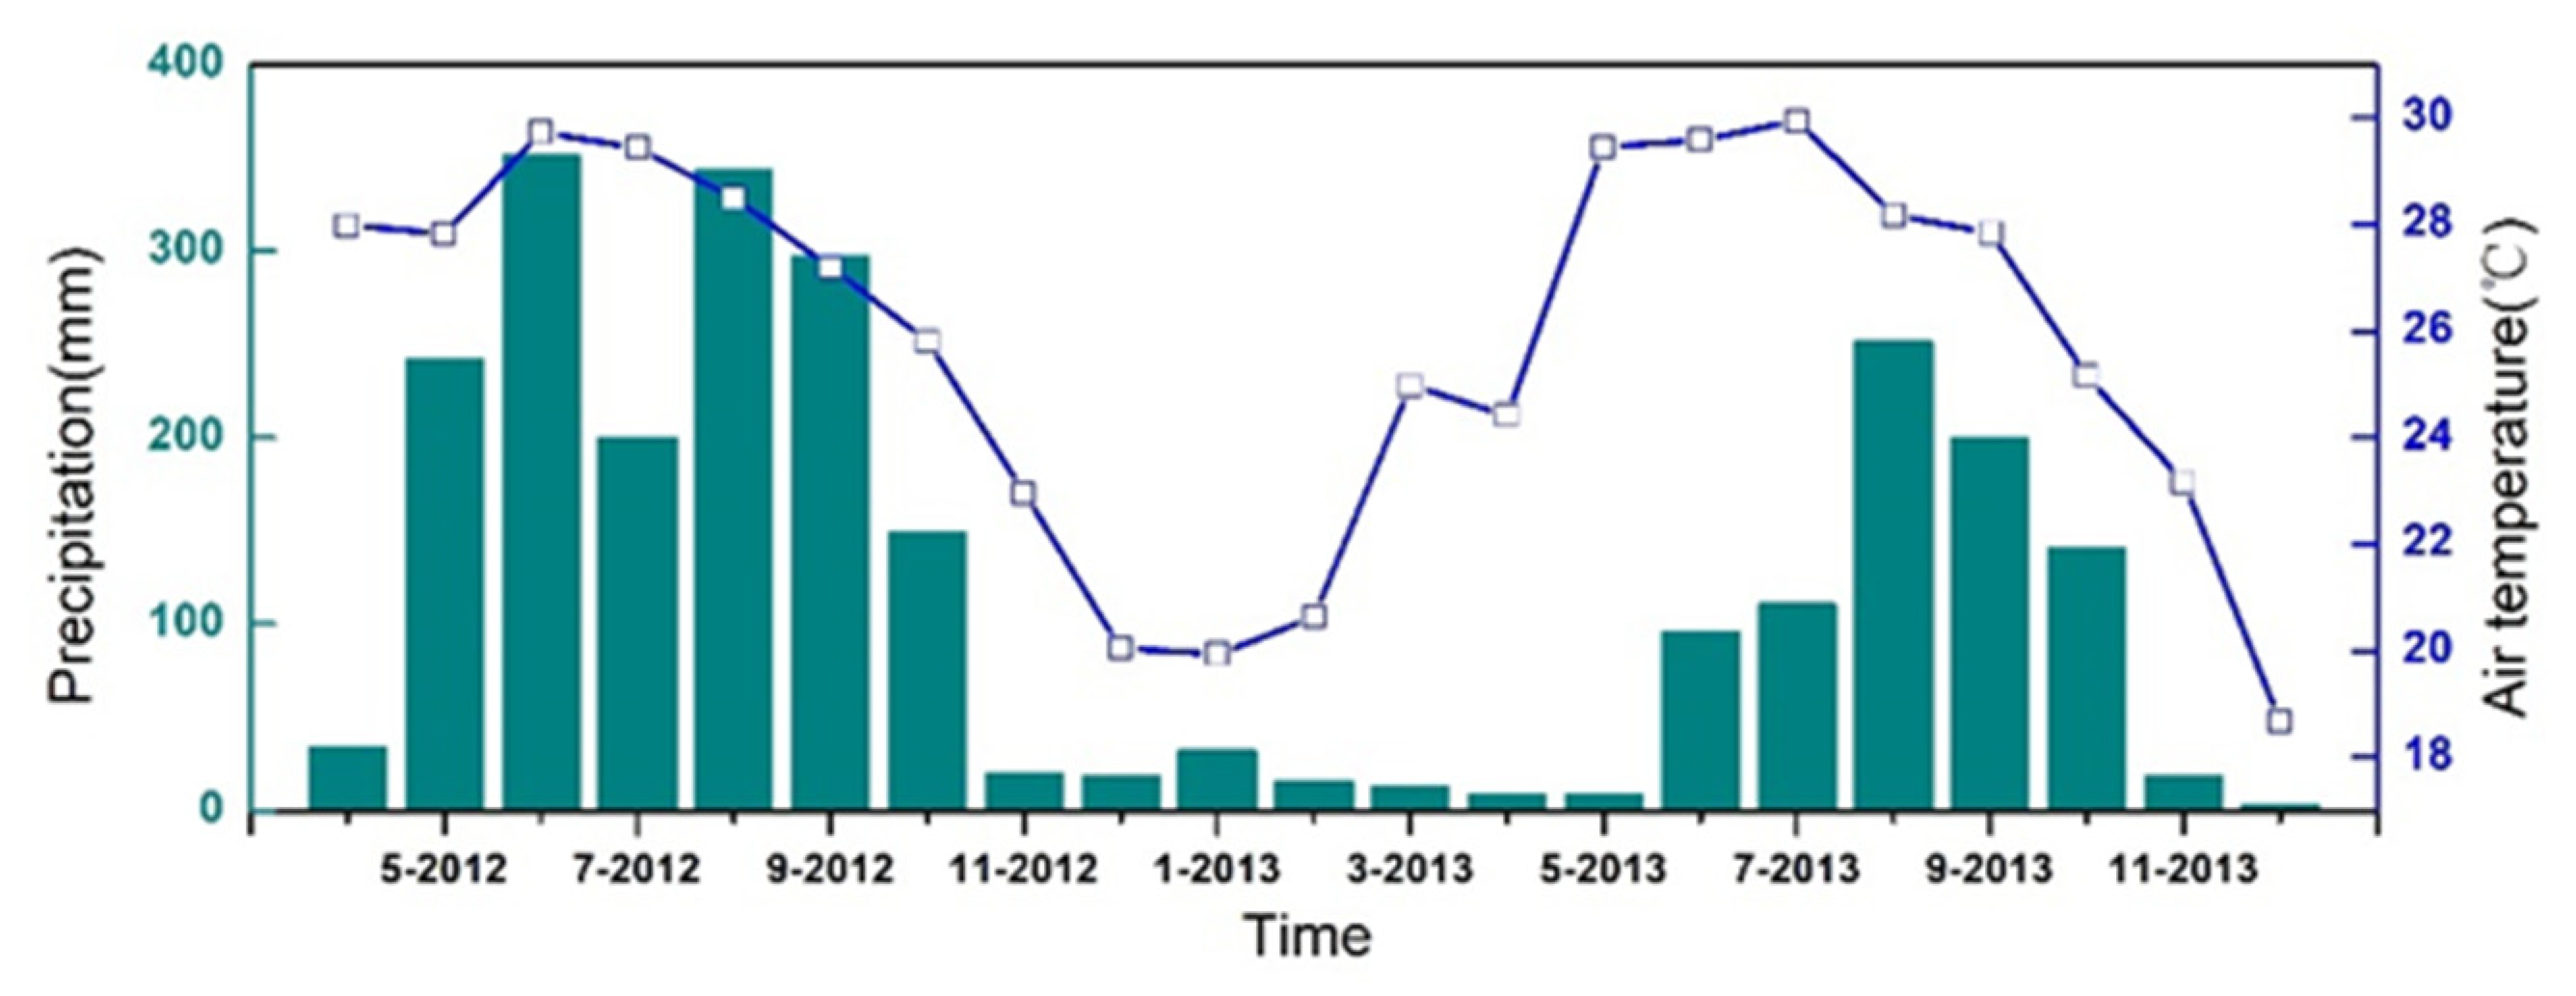
Figure 1. Meteorological data of the study area from April 2012 to December 2013 (data were from a weather station set by the Institute of Tropical Forestry, Chinese Academy of Forestry).
Atmosphere 12 01126 g001
Figure 2. Sampling site—Dongzhaigang National Natural Reserve in Hainan Province (a,b) and CH4 sampling device (c) and process (d) ((c,d) were photographed by Wei Guan).
Atmosphere 12 01126 g002
Figure 3. Variations of water variables during sampling months. (a) Salinity; (b) WT: water temperature; (c) AP: Atmospheric pressure; (d) Cond: Conductivity; (e) pH; (f) ORP: Oxidation-Reduction Potential; (g) AT: air temperature.
Atmosphere 12 01126 g003
Figure 4. Seasonal variations in CH4 flux in the three regions.
Atmosphere 12 01126 g004
Figure 5. The average CH4 fluxes of the three regions (LSD test, uppercase: p < 0.01).
Atmosphere 12 01126 g005
Table 1. Environmental factors and properties of water in Yanfeng river.
Environmental FactorsUpper ReachesMidstreamDownstream
Air Temperature (°C)30.11 ± 3.9529.3 ± 4.7730.75 ± 6.09
Salinity (‰)6.95 ± 6.16 b12.23 ± 8.65 ab15.52 ± 8.20 a
Water Temperature (°C)26.86 ± 4.7427.27 ± 4.2227.13 ± 4.35
Atmospheric pressure (mbar)1008.94 ± 5.871008.72 ± 5.761008.88 ± 6.52
Conductivity (μS/cm)1.31 ± 1.29 b2.16 ± 1.30 ab2.78 ± 1.20 a
pH7.30 ± 0.26 b7.44 ± 0.27 b7.72 ± 0.34 a
ORP (mv)71.39 ± 47.7474.58 ± 45.3684.84 ± 49.26
DOC (mg/L)2.98 ± 2.603.63 ± 2.342.61 ± 2.38
NH 4 + -N (mg/L)0.48 ± 0.440.74 ± 0.730.35 ± 0.32
NO3-N (mg/L)0.27 ± 0.260.24 ± 0.230.23 ± 0.22
PO 4 3 (mg/L)0.15 ± 0.14 b0.23 ± 0.16 b0.57 ± 0.56 a
Values are means ± standard error. Letters indicate significant difference (LSD test, lowercase: p < 0.05).
Table 2. Correlations among CH4 fluxes and environment factors.
Regions SalinityWTAPpHCondORP mVAT
UPr−0.290.490 *−0.505 *−0.06−0.220.060.26
p0.240.040.030.810.400.850.27
n181818181701520
MIDr0.080.25−0.390.010.100.28−0.11
p0.730.300.090.970.680.300.63
n19191919181620
DOWNr−0.380.41−0.29−0.06−0.32−0.500.41
p0.110.080.230.810.200.050.07
n19191919181620
WT: water temperature; AP: Atmospheric pressure; Cond: Conductivity; AT: air temperature (*: p < 0.05).
Table 3. Comparison of CH4 flux of rivers in other regions globally.
Name of RiverCountryTypeCH4 Flux (mg m−2 h−1)Reference
MinimumMaximumMean
Yennisei RiverRussiaMiresNDND1.04[39]
Miranda RiverBrazilOpen water0.06791.15.93[40]
Adyar RiverIndiaOpen water0.001376.10.53–15.3 *[41]
Andhra PradeshIndiaWater bodies0.00634.735.2[3]
SundarbansBangladeshMangrove−0.661.330.67[44]
Yanfeng riverChinaOpen water0.0115.1560.96This study
*: mean fluxes at different locations of the river; ND: no data.
Publisher’s Note: MDPI stays neutral with regard to jurisdictional claims in published maps and institutional affiliations.