Article

Characterization of Exhaust CO, HC and NOx Emissions from Light-Duty Vehicles under Real Driving Conditions

1
School of Ecology and Environment, Zhengzhou University, No. 100 Science Avenue, Zhengzhou 450001, China
2
School of Environment and Energy, South China University of Technology, Guangzhou 510006, China
3
State Environmental Protection Key Laboratory of Vehicle Emission Control and Simulation, Chinese Research Academy of Environmental Sciences, Beijing 100012, China
4
Institute of Environmental Sciences, Zhengzhou University, Zhengzhou 450001, China
*
Author to whom correspondence should be addressed.
Atmosphere 2021, 12(9), 1125; https://doi.org/10.3390/atmos12091125
Submission received: 28 July 2021 / Revised: 28 August 2021 / Accepted: 30 August 2021 / Published: 31 August 2021
(This article belongs to the Special Issue Impacts of Transport Systems on Air Pollution and Human Health)

Abstract

:
On-road exhaust emissions from light-duty vehicles are greatly influenced by driving conditions. In this study, two light-duty passenger cars (LDPCs) and three light-duty diesel trucks (LDDTs) were tested to investigate the on-road emission factors (EFs) with a portable emission measurement system. Emission characteristics of carbon monoxide (CO), hydrocarbons (HC) and nitrogen oxides (NOx) emitted from vehicles at different speeds, accelerations and vehicle specific power (VSP) were analyzed. The results demonstrated that road conditions have significant impacts on regulated gaseous emissions. CO, NOx, and HC emissions from light-duty vehicles on urban roads increased by 1.1–1.5, 1.2–1.4, and 1.9–2.6 times compared with those on suburban and highway roads, respectively. There was a rough positive relationship between transient CO, NOx, and HC emission rates and vehicle speeds, while the EFs decreased significantly with the speed decrease when speed ≤ 20 km/h. The emissions rates of NOx and HC tended to increase and then decrease as the acceleration increased and the peak occurred at 0 m/s2 without considering idling conditions. For HC and CO, the emission rates were low and changed gently with VSP when VSP < 0, while emission rates increased gradually with the VSP increase when VSP > 0. For NOx NOx emission rates were lower and had no obvious change when VSP < 0. However, NOx emissions were positively correlated with VSP, when VSP > 0.

1. Introduction

It is widely known that motor vehicle exhaust emissions have become a major anthropogenic source of urban atmospheric pollution with the explosive growth of vehicle population, especially in the metropolitan cities in China [1,2]. China has been the world’s largest automobile manufacturer and seller for twelve consecutive years since 2009 [3]. By the end of 2020, the number of automobiles in China has reached 281 million, which is basically equivalent to the United States [4]. The statistical data released by the Chinese Ministry of Ecological Environment (MEE) showed that the total motor vehicle exhaust emissions of carbon monoxide (CO), hydrocarbon (HC) and nitrogen oxide (NOx) were 7.716 million tonnes, 1.892 million tonnes and 6.356 million tonnes, respectively [5].
To identify the characteristics of vehicular emissions, various test methods were adopted in previous studies. For example, traffic tunnel measurement [2,6], remote sensing technology [7,8], the dynamometer test [9,10] and roadside sampling [11]. However, due to the different test principles, results obtained with these methods may not accurately reflect the exhaust emission characterization under real driving conditions, which means test vehicles being driven on the public roads in real traffic [12]. The average concentration of NOx in an urban tunnel was tested by Jin et al., but the test concentration was the mixed concentration of the vehicles in the tunnel and to yield the contaminant concentration of the individual vehicle [2]. Remote sensing technology, as an economical method for vehicle rapid monitoring, is commonly used to identify high-emission vehicles, which is not suitable for experimental testing of light-duty vehicles [11,13]. The driving mode emission is usually higher than that of the dynamometer test if the influence of vehicle operating conditions is ignored [14]. The standard driving cycles, New European Driving Cycle (NEDC) and World-wide harmonized Light-duty driving Test Cycle (WLTC), has been criticized for its lack of representativeness of real-world driving [15]. The difference in fuel consumption between the actual driving cycle and NEDC can reach 12% to 30%, and the difference in NOx can reach 32.2% to 628.3% [15,16]. Thus, the portable emission measurement system (PEMS) is more suitable for detecting the exhaust emission in real environment. Currently, more and more PEMS experiments are being conducted to investigate the emission characteristics of both gasoline and diesel vehicles under actual driving conditions, especially after the implementation of Euro 6 and China 6 standards [17,18,19].
Vehicle exhaust emissions are a complex and dynamic process. Numerous previous studies have shown that many factors, such as vehicle age and mileage [20], engine technology [21], ambient temperature [22] and inspection and maintenance (I/M) could have a great influence on vehicle exhaust emissions [23]. Heavy duty operation, high mileage and the lack of proper maintenance lead to higher vehicle emissions, resulting in deterioration of the engine and catalyst, and ultimately increased emissions from vehicles in use [24]. To control vehicle exhausts pollution and improve urban air quality, the national government has implemented many control measures, including promoting clean transportation fuel, improving exhaust gas post-treatment technology and formulating strict emission standards. China has systematically adopted European vehicle emission standards since 2000 [25]. However, due to the rapid increase of vehicles and mileage, gas pollutants in the urban atmosphere are still at a higher level.
When vehicles stop frequently, it will increase fuel consumption and pollutant emissions. Shukla et al. found that the instantaneous emission rates of all test pollutants, including CO, CO2 and HC under dynamic urban traffic conditions in Delhi increased obviously when the vehicle accelerated sharply [26]. This phenomenon was mainly contributed to the fact that a rich mixture of processes was required for acceleration, which could aggravate the incomplete combustion and accelerate the generation of exhaust emissions [27]. Chen et al. conducted a study on nine heavy-duty diesel vehicles and reported that low speed, frequent acceleration and deceleration are the main factors that aggravate vehicle emissions and lead to high carbon monoxide and HC emissions [28]. Past research by Rapone and Andre found that most accelerations and NOx emissions occur under conditions of urban congestion. Under these conditions, NOx emissions were 3 times that of rural driving categories at steady speed, which may be interrupted by short periods of urban operation when driving through urban areas [12,29,30]. The vehicle specific power (VSP) methodology is a road load model, which is often used to evaluate vehicle emissions and identify high emission vehicles. The VSP includes parameters such as vehicle speed, engine load and vehicle weight. Based on the road load modal analysis of vehicle dynamics (speed, acceleration, rolling and aerodynamic resistance) and road terrain, it groups experimental data points with similar dynamic conditions to allow comparison of fuel and emission rate [31]. Zhai et al. developed the average emission rate and emission estimation of diesel transit buses VSP model by establishing VSP model [32]. A study conducted by Rhys-Tyler and Bell in London used urban remote sensing survey data as an input to fill the VSP modal bins and use them to reconstruct the NEDC and provide pollutant emission estimates [33]. However, most of previous studies using the PEMS mainly concentrated on the heavy-duty diesel vehicles based on VSP [34,35,36]. Increasingly, researchers have begun to explore the relationship between emission rates and VSP based on light-duty vehicles with the lightness and miniaturization of PEMS equipment and the emphasis on actual on-road emissions from light-duty vehicles. For example, Wang et al. tested seven urban freight trucks with PEMS and fount that gaseous pollutants and PM emissions increased with the increase of VSP [37]. Perugu et al. used the revamped VSP-based MOVES model to establish the emission model of Indian light-duty vehicles in India, and found that the emission rates of CO, HC and NOx in India were 9.54, 8.37 and 9.45 times of the default US emission rates, respectively [38].
Therefore, two light-duty passenger cars (LDPCs) and three light-duty diesel trucks (LDDTs) complying with different emission standards were selected mainly based on the current vehicle fleet distribution in China, also taking into account that results should be useful for Chinese model development and for future emission inventory calculations. The instantaneous exhaust gaseous emissions were sampled and analyzed with the portable emission measurement system under real driving conditions. The main objectives of this study mainly include: (1) Evaluating the on-road emission factors (EFs) of exhaust CO, HC and NOx emissions from different vehicles; (2) Investigating the influence of driving speeds and accelerations on exhaust CO, HC and NOx emissions based on the three LDDTs; (3) Analyzing the relationship between emission rates of exhaust CO, HC and NOx and VSP of test vehicles under real driving conditions. The findings in this work may provide researchers with first-hand data to develop and optimize light-duty vehicle emission models suitable for Chinese realities and provide policy makers with useful information to control the on-road vehicle emission.

2. Materials and Methods

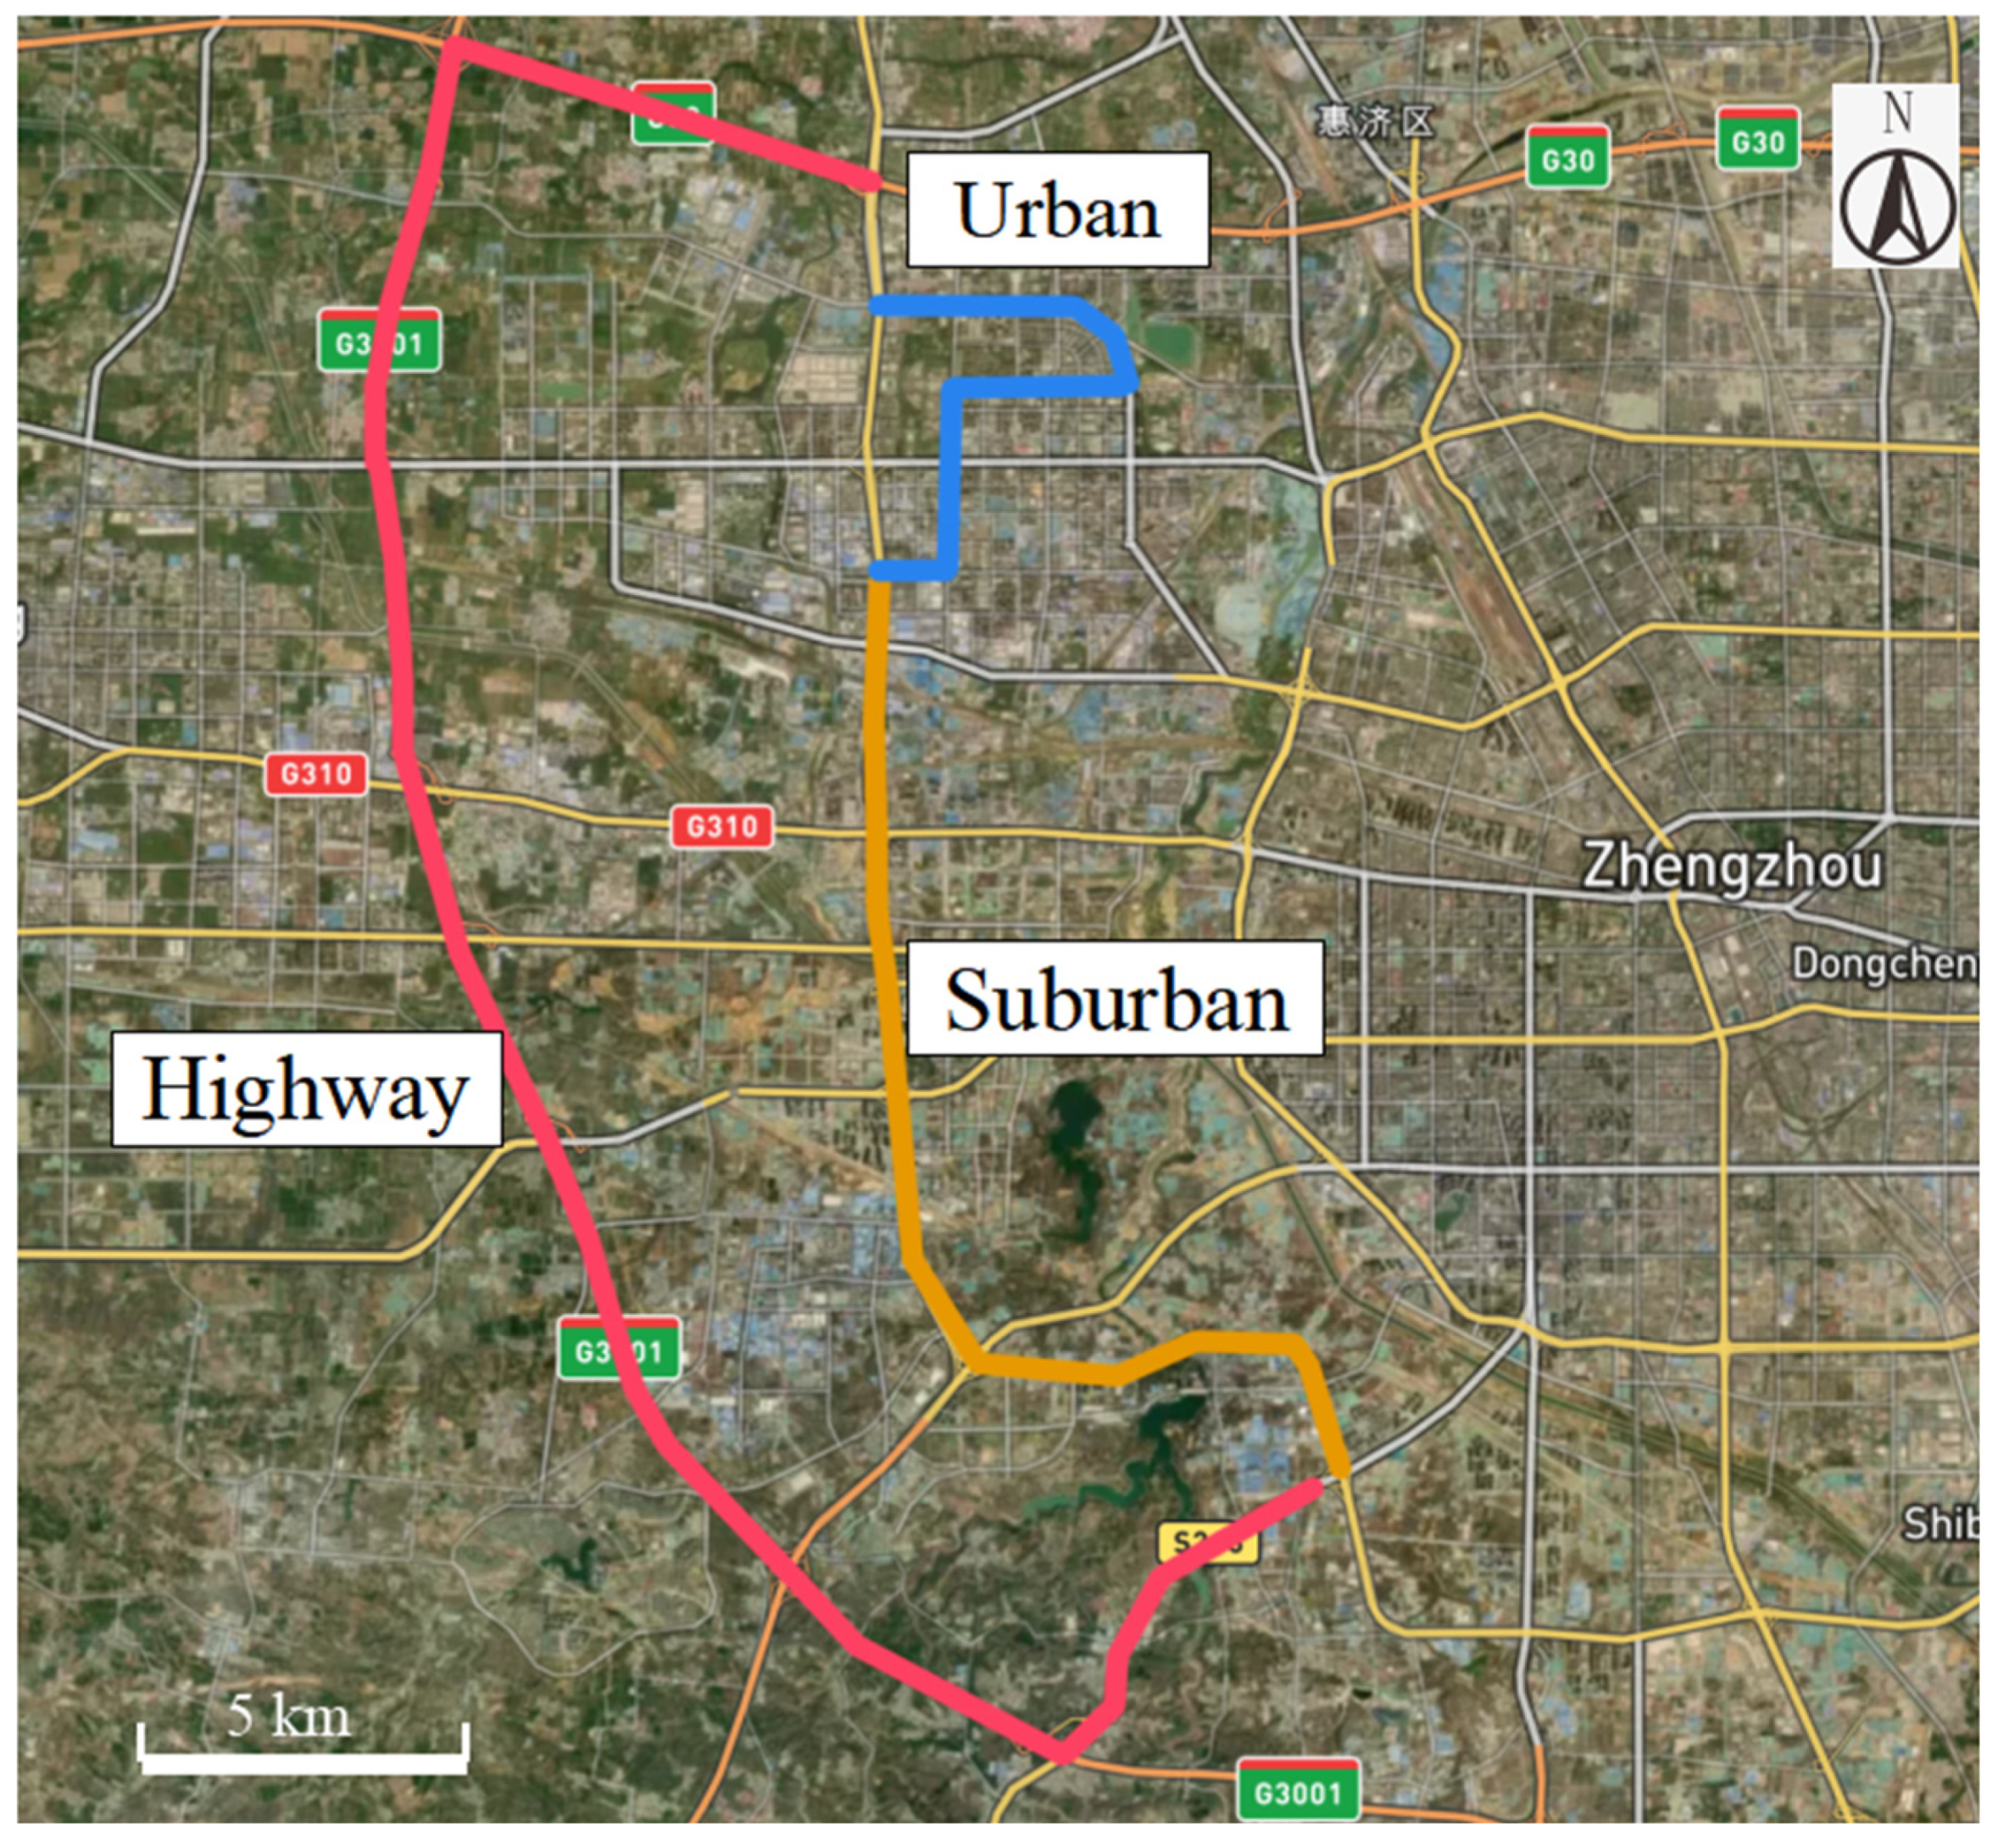
2.1. Test Vehicles and Routes

To ensure the representativeness, all the vehicles selected in this study were popular models or had a large population in China. Two types of vehicles extensively used in China were tested, including two light-duty passenger cars (LDPCs) and three light-duty diesel trucks (LDDTs). The specifications of these test vehicles are listed in Table 1. All of them are in good working conditions and driven by their owners throughout the test to better reflect the actual emissions in use and to eliminate the impacts from changes in driving habits. The fuel used in this study was directly purchased from local gas stations and met the corresponding with the Chinese standards of Gasoline for motor vehicles (China VIA) (GB 19730-2016), and Automobile diesel fuels (China VI) (GB19147-2016).
A test route was designed for the PEMS experiment according to the regulations of Real Driving Emission Test (Type II test) in Limits and measurement methods for emissions from light-duty vehicles (CHINA 6). As shown in Figure 1, the total length was approximately 62.4 km, including urban roads, suburban roads and highway roads. The maximum speeds driving on the urban, suburban and highway roads were 40~60 km/h, 70~80 km/h and 110~120 km/h, respectively. The average driving distance of urban, suburban and highway roads is 12.4 km, 17.6 km and 32.4 km, respectively, and the detail data for each trip of these test vehicles could be found in Table S1 in the Supplementary Materials. The average measured time over urban, suburban and expressway were 39.3 min, 28.5 min and 25.4 min, respectively.

2.2. Measurement System

On-road exhaust gaseous emissions from the tested vehicles were measured using the SEMTECH ECOSTAR PLUS (Sensors Inc., Saline, MI, USA) system. The SEMTECH ECOSTAR PLUS system is compliant for the gases regulated under UN-ECE R49 and Commission Regulation (EU) No. 582/2011 as well as under US EPA CFR40 part 1065. It consists of multiple gas analyzers, exhaust flowmeter, power supply system, the Micro Proportional Dilution System (MPS), PM sample modules and some connection lines. NOx is measured with non-dispersive ultraviolet (NDUV) method, and CO and CO2 are analyzed with non-dispersive infrared (NDIR) method. HC is detected by a hydrogen flame ion detector (FID). The vehicle exhaust flow rates were measured using an exhaust flow meter based on Pitot tube technology. In addition, a weather probe (WP) monitored accurate ambient humidity, temperature and barometric pressure. The error limits of RH and TEM of the WP were ±5% and ±2 K, respectively. A global position system (GPS) was used to record instantaneous latitude, longitude and speed of the vehicles during the test; the spatial resolution and speed was 10 m and ±1 km/h, respectively. All the data were collected at a resolution of 1 s and delivered to a laptop connected to the gas analyzers in real time. The characterization of PM was not discussed in this text because particulate matters were only sampled with filters without the instantaneous particulate emissions. All the PEMS tests were performed in March to April, 2018. To reduce the interference of uncontrolled traffic flow during the test, the driving route, time of the day and week, and duration of each experiment was consistent as far as possible. Specifically, if the first test for a vehicle was conducted on a day of the first week; then the repeated test of the vehicle was also conducted on the day of the second week. In addition, all the five test vehicles were measured on weekdays from approximately 16:00–18:00 in the afternoon including evening peak conditions. In addition, the average data of two repeated experiments of each test vehicle were used in the study.

2.3. Data Processing

The PEMS can quantify CO2, CO, NOx and HC in ppbv and g/s at a frequency of 1 Hz, and vehicle instantaneous speed (m/s) was recorded simultaneously by GPS. It should be noted that some negative values of transient emissions might be found if lower than the limits of the system, which would be treated as 0. Thus, the instantaneous emission factor (EF) based on distance was calculated according to the following equation (Equation (1)):
E F i = 1000 · E R i v i
where EFi is the instantaneous EF at time i, g/km; ERi is the instantaneous pollutant emissions (g/s); vi are the instantaneous speed (m/s) at point i. Both ERi and vi were given by the PEMS system directly. As the speed of equals to zero, EF trends to be infinite. Thus, idling data is not considered when calculating EFi with Equation (1).
The EFs of urban, suburban and highway roads are the cumulative sum of the emission factors per second within the corresponding distance. Repeat the test twice for each vehicle and take the average as the EFs.
The acceleration ai for every time i in m/s2 was calculated using the speed vi in m/s over a two second average from the previous and the subsequent speed value (Equation (2)):
a i = 1 2 · ( v i + 1     v i 1 )
after calculating the acceleration, arrange all data at an interval of 0.02 m/s2 to obtain the quantitative relationship between emission rate, emission factor and acceleration.
The VSP is identified as the instantaneous power demand per unit mass of the vehicle [39]. It is a proxy variable that reflects the engine power to overcome the rolling resistance and aerodynamic drag, and to increase the kinetic and potential energies of the vehicle [40]. In this study, we use VSP as an indictor of driving styles and investigate their effect on exhaust gaseous emissions. The VSP for time i was calculated with Equation (3):
VSP =   v i · ( 1.1 · a i + 9.18 · θ + w ) + ε · v i 3
where VSP is the vehicle specific power at time i, kW/tonne; vi is instantaneous speed at point i recorded by GPS, m/s; ai is instantaneous acceleration at point i and was calculated by Equation (2), m/s2; θ is road grade and is dimensionless; w is rolling resistance term coefficient (0.132); ε is drag term coefficient (0.00278).
The road grade was calculated with the segment method proposed by Boroujeni and Frey [23]. The entire trip was divided into many small segments with a constant length. The road grade of a certain segment was calculated with the altitude and segment length using a linear regression method. In this study, a segment length of 50 m was chosen considering the accuracy of the calculated road grade in each segment. Detailed descriptions of this method can be found in Boroujeni, Frey and Gallus et al. [23,41].
The instantaneous emission rate corresponding to the same VSP value usually has a large dispersion; it is not conducive to the analysis of statistical law to directly use the instantaneous value of VSP to study the vehicle emission law. In order to study the relationship between VSP and vehicle emissions more accurately, Frey et al. proposed that VSP should be divided into different intervals (Bin) according to a certain interval, and the average instantaneous emission rate of motor vehicles in the Bin should be taken as the corresponding emission value of the Bin [42]. By using the formula of VSP and instantaneous rate data obtained from on-road tests, the VSP of two kinds of vehicles is calculated. On this basis, the VSP was divided into intervals of 2 kW/t, and the section division was carried out according to Equation (4). The division results are shown in Table 2.
VSP   Bin = n , : VSP ( n 1 , n + 1 ] ; n 2   N

3. Results and Discussion

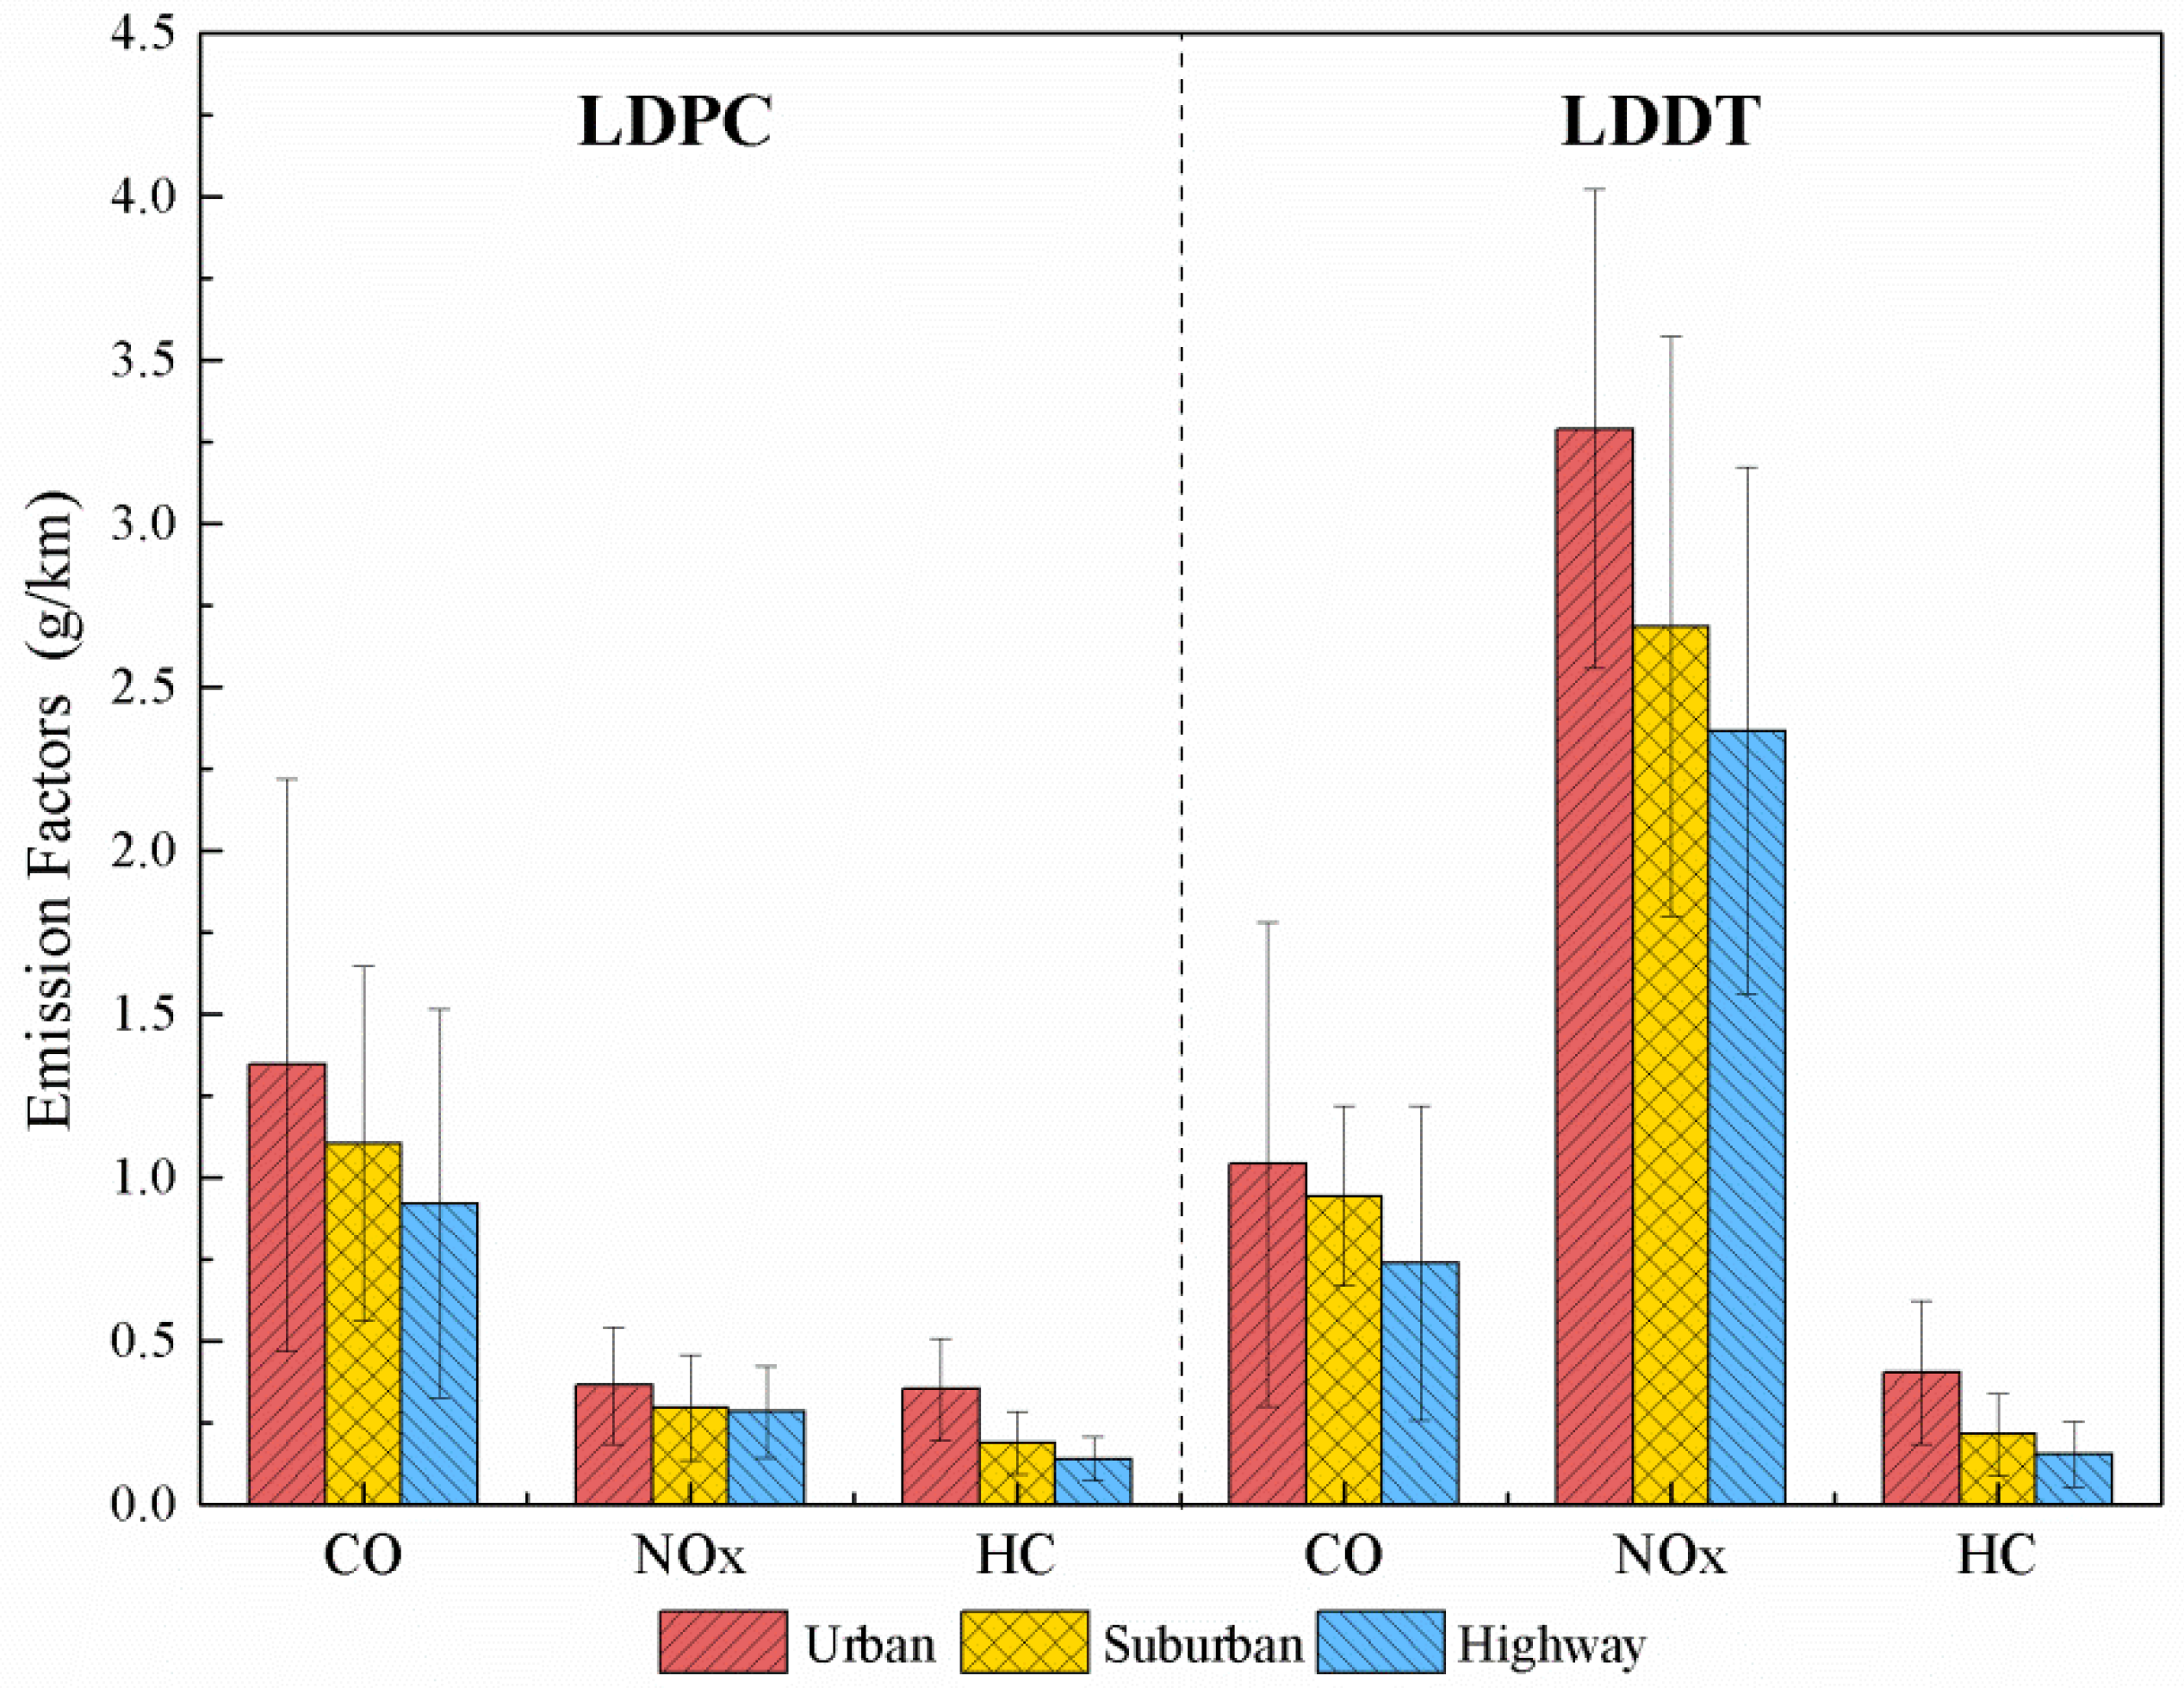
3.1. Emission Factors of Regulated Gaseous Pollutants

The average CO, NOx, HC EFs of LDPCs and LDDTs under different road conditions are shown in Figure 2. The specific data could be found in Table S2 in Supplementary Materials. Figure 2 represents the average of four driving tests of two test vehicles, and those of LDDT were the average result of three test vehicles with a total of six driving tests. In general, there was a trend that the average emission factors of CO, NOx and HC under urban road conditions were slightly higher than the ones for suburban and highways. Specifically, CO emissions of LDPCs on suburban and highway decreased by 18.0% and 31.5%, respectively, compared with urban roads; NOx emissions was also reduced by 18.4% and 22.1%; and the reduction of HC was even greater, reaching 46.6% and 60.2%, respectively. For LDDTs, CO emissions under urban road conditions were 1.04 ± 0.74 g/km, and those under suburban road conditions and highway road conditions were 0.94 ± 0.27 g/km and 0.74 ± 0.48 g/km respectively. The NOx EFs under suburban and highway road conditions were 3.29 ± 0.73 g/km and 2.69 ± 0.89 g/km, which were reduced by 18.2% and 28.3% compared with urban road conditions. Consistent with LDPCs, the change in HC emissions was also more obvious. The HC EFs were 0.40 ± 0.22 g/km under urban road conditions, which was 1.9 times and 2.6 times those under suburban and highway road conditions, respectively.
As Shown in Figure 2, exhaust gaseous pollutants largely depend on the driving conditions of these test vehicles. There were significant differences in speed and acceleration on different road conditions. For example, the average speeds for LDDT3 on urban, suburban and highway roads were 19.21 km/h, 37.86 km/h and 76.46 km/h, respectively. Many previous studies have confirmed that the vehicle speed and acceleration had great impacts on the operating of the engine and the performance of after-treatment device, which were closely related with exhaust emissions [43,44,45]. For instance, on the highway road, the maximum speed was 99.11 km/h, and the operation was stable in most cases, then fuel injected into the cylinder could be fully burned and generate less incomplete combustion substances. The average EFs of CO, NOx and HC on the highway roads were only 0.38 g/km, 1.42 g/km and 0.037 g/km, respectively. However, there were 26 traffic lights on the urban roads in this study which caused frequent acceleration, deceleration, and stops. The low-speed driving caused insufficient fuel combustion and generated more CO, NOx, and HC emissions [1,15,46]. In addition, the efficiency of the after-treatment device also has an important influence on vehicle emissions [17,46,47,48]. On the urban road, the vehicle speed was low and starts and stops frequently, and the fuel combustion is not sufficient, which leads to low exhaust temperature and can’t reach the starting temperature of TWC equipped for the LDPC tested in this study. Therefore, the catalytic conversion efficiency of TWC to three pollutants is low. When the vehicle runs on the highway roads, the vehicle runs smoothly, the exhaust temperature of the engine is high, the TWC device works normally, and the pollutant emission is greatly reduced. Compared with CO and HC, the EFs of NOx were less affected by road conditions, and always remains at a low level, which indicates that the NOx reduction performance of the TWC could be maintained in most engine operation areas, which is consistent with Park et al. [47].

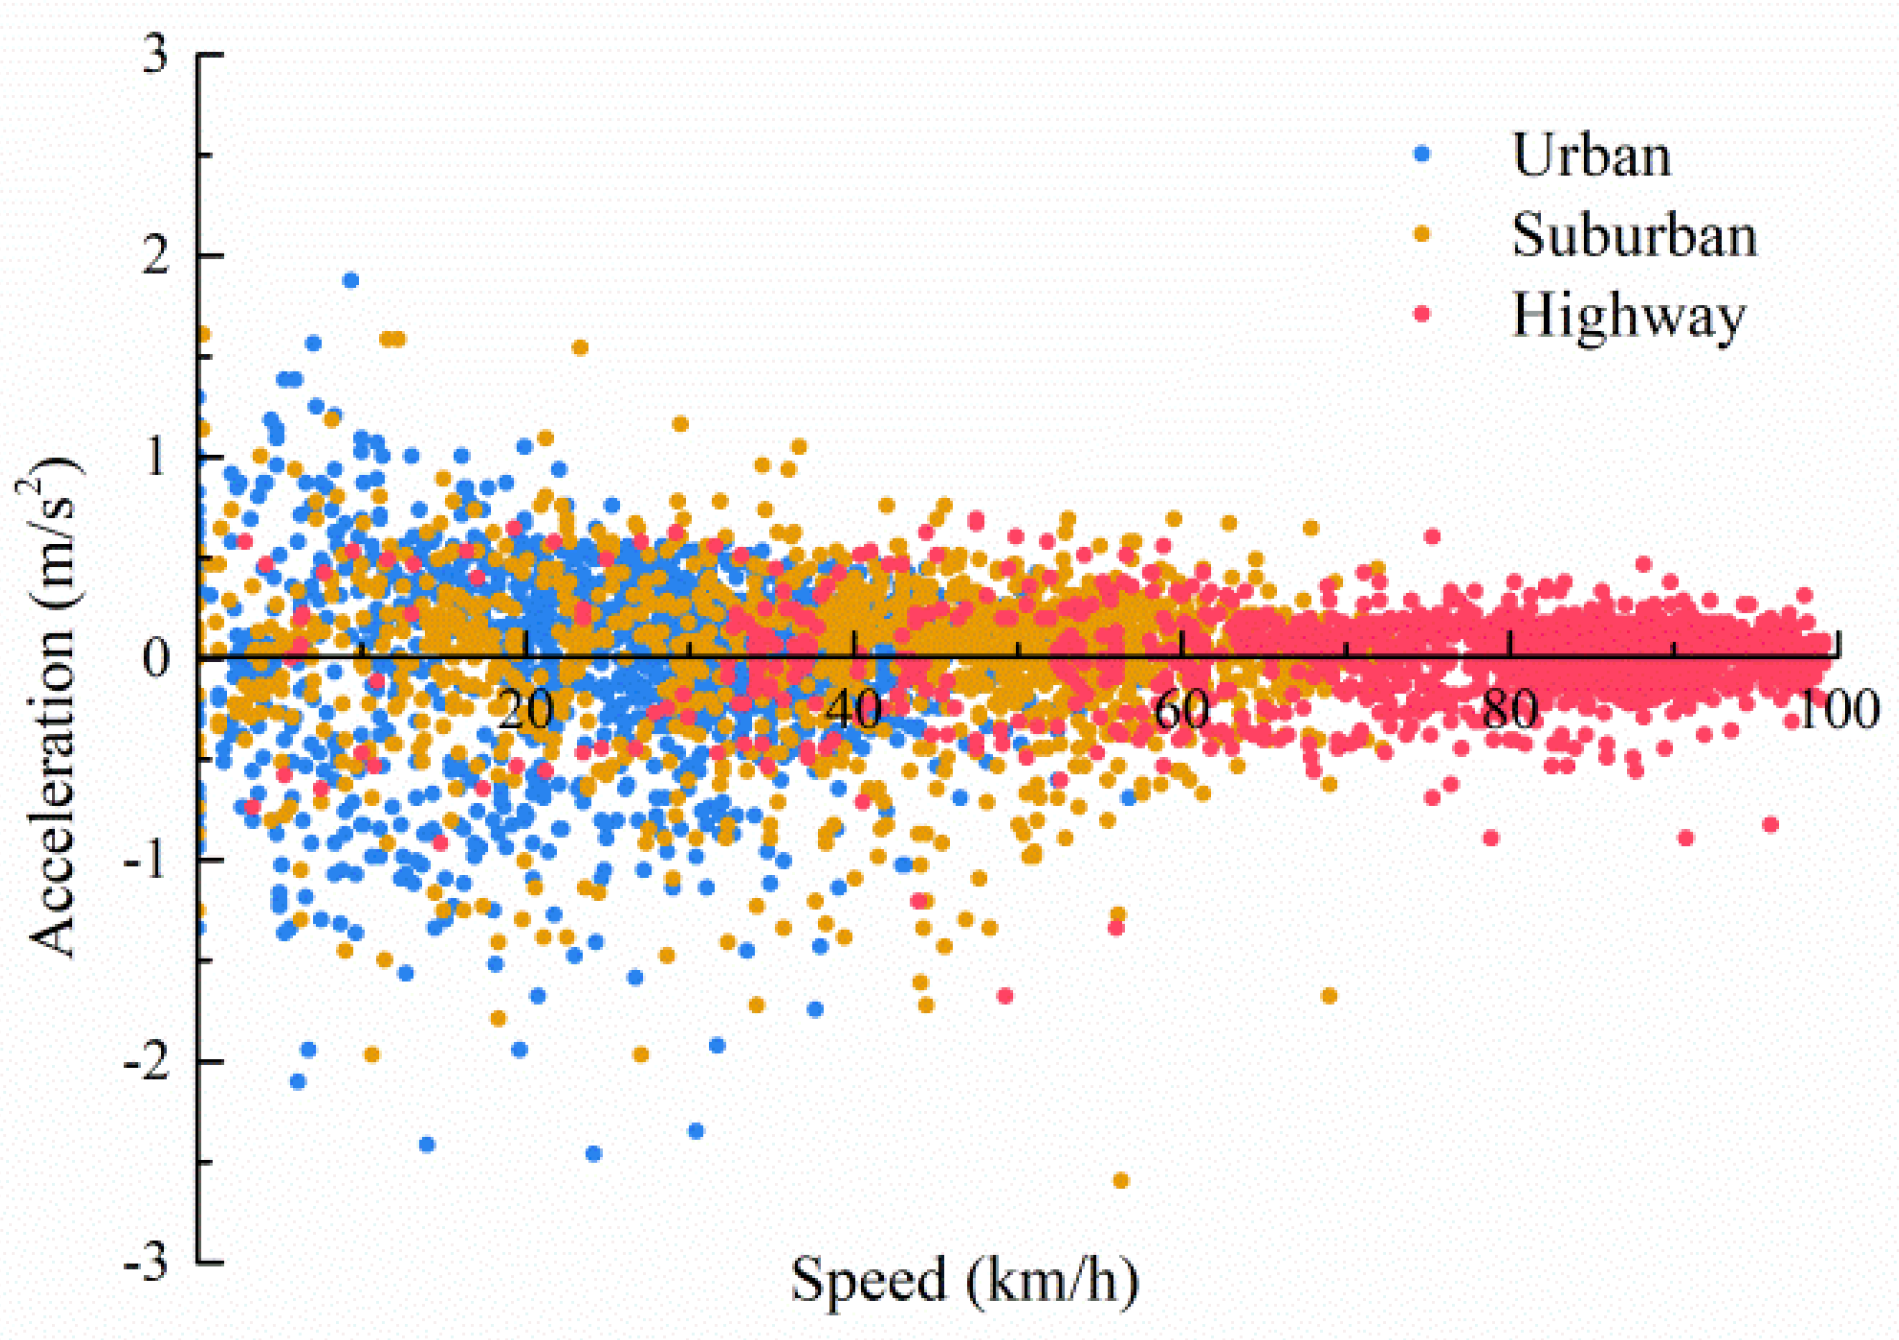
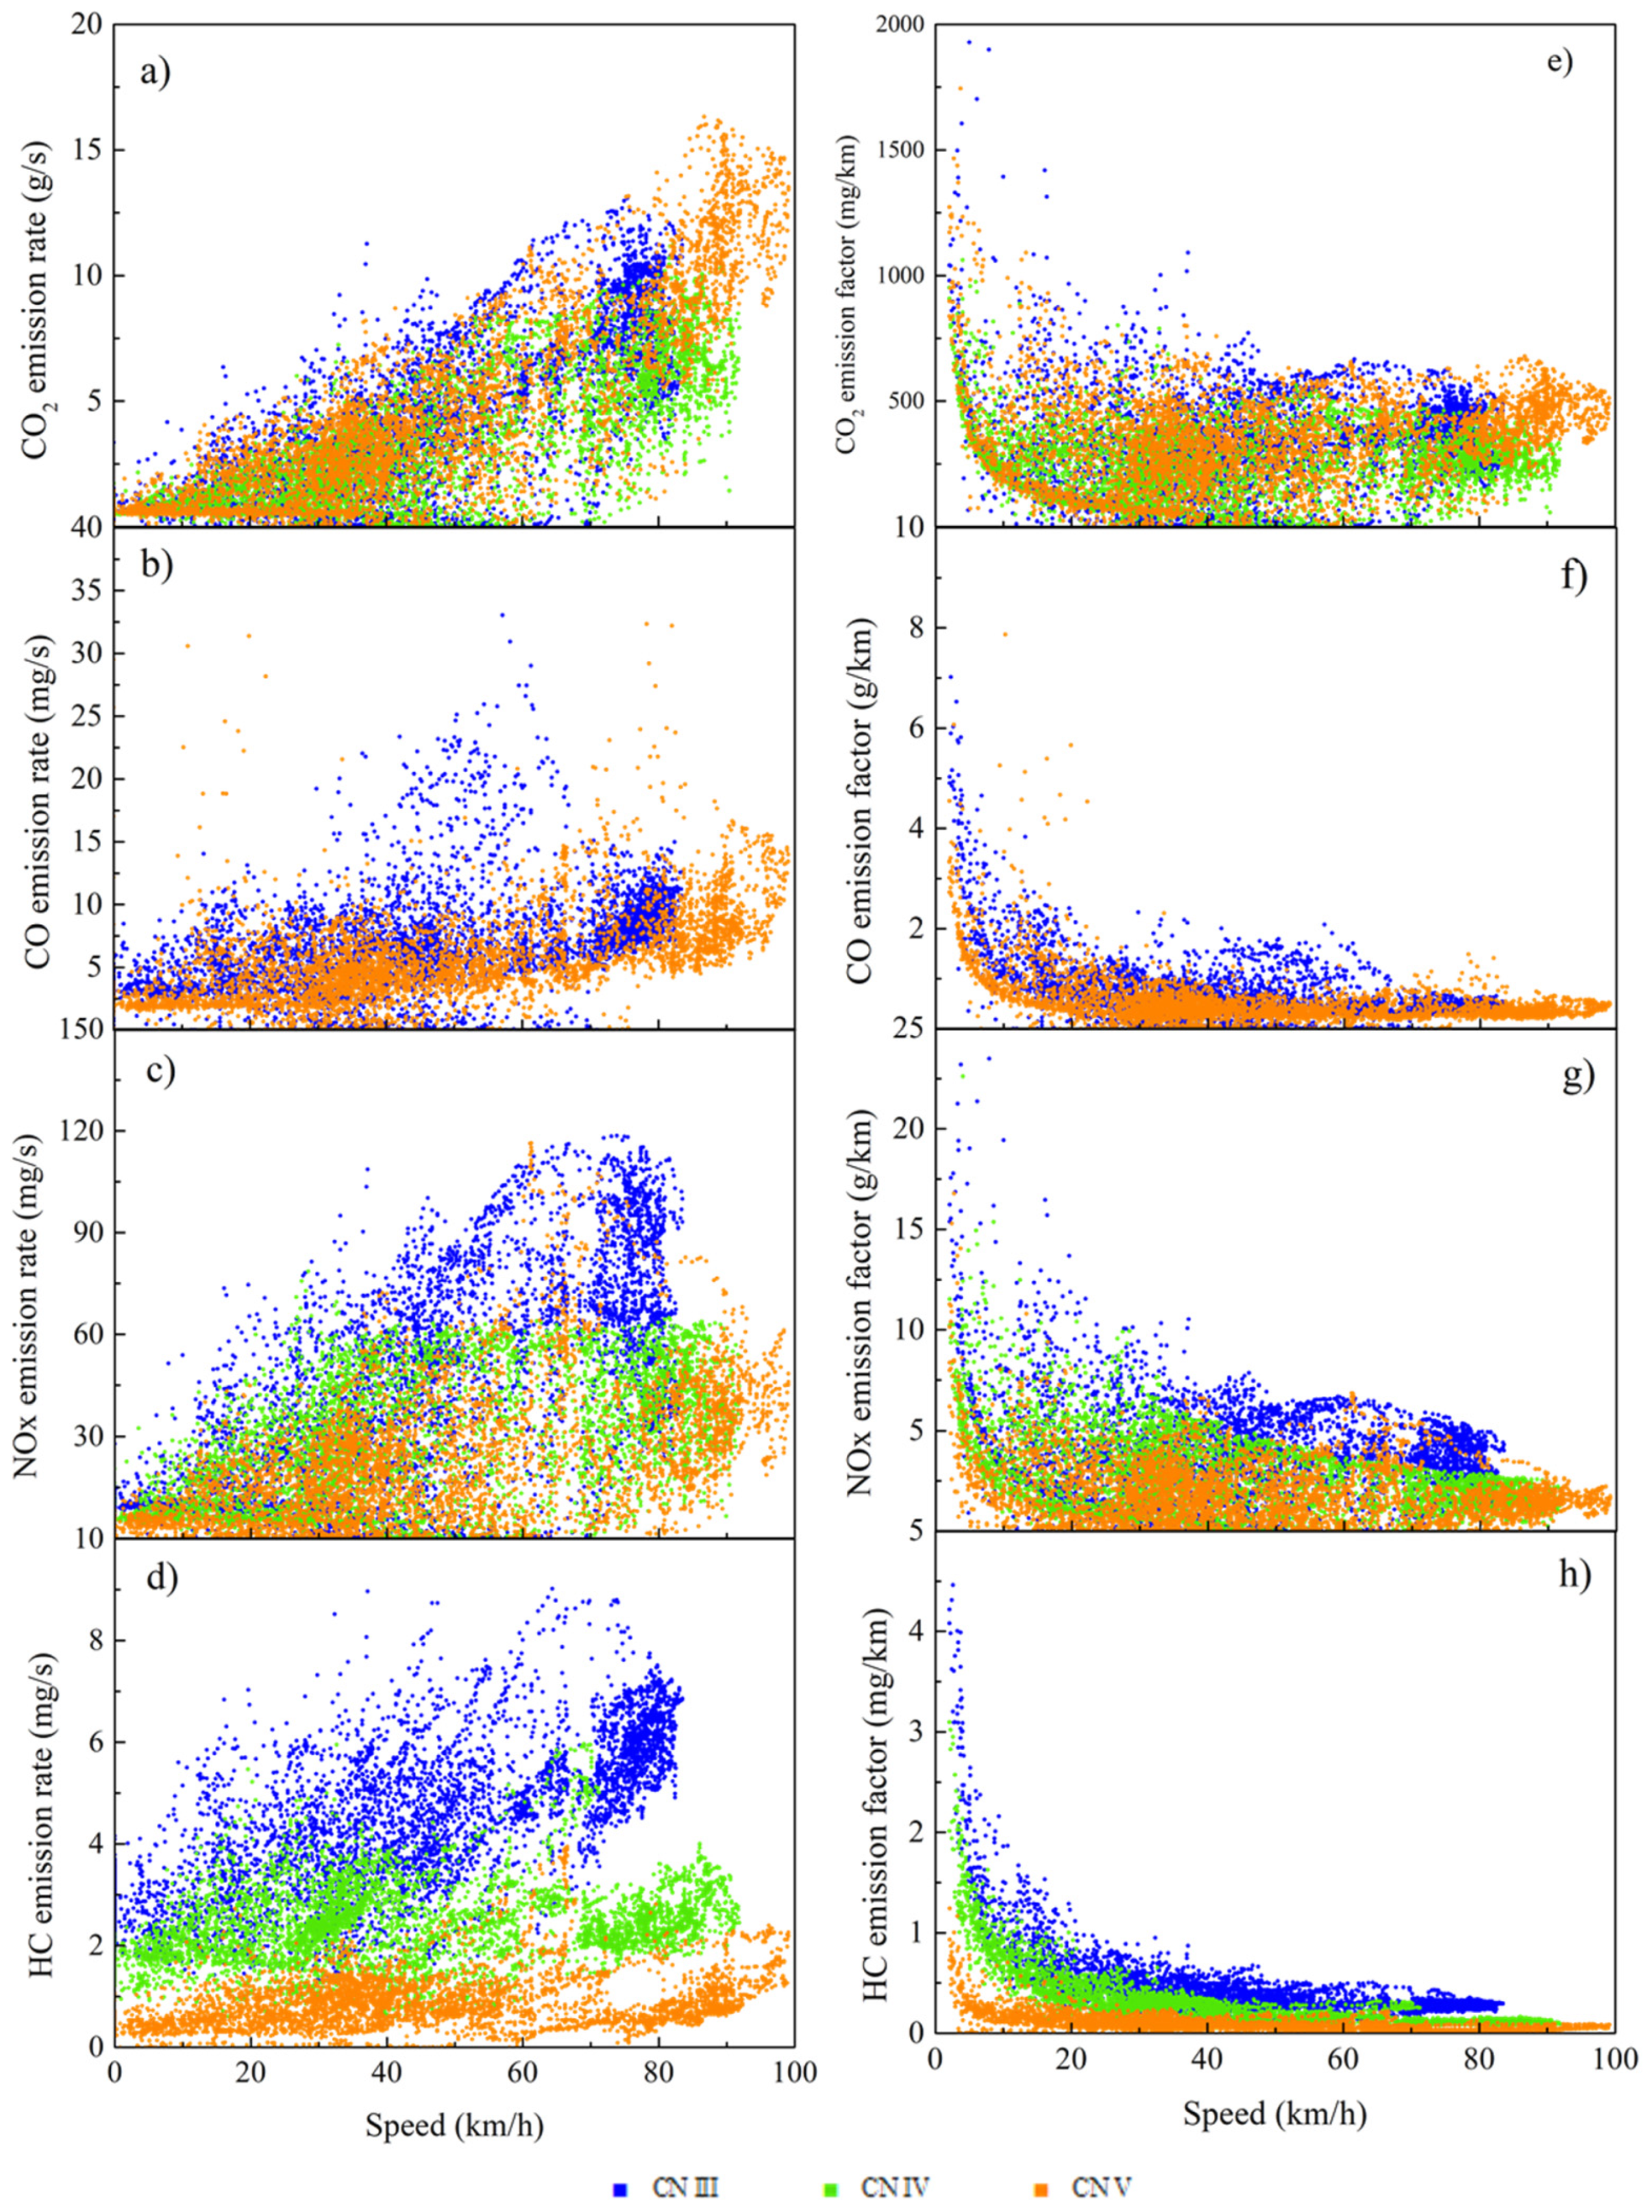
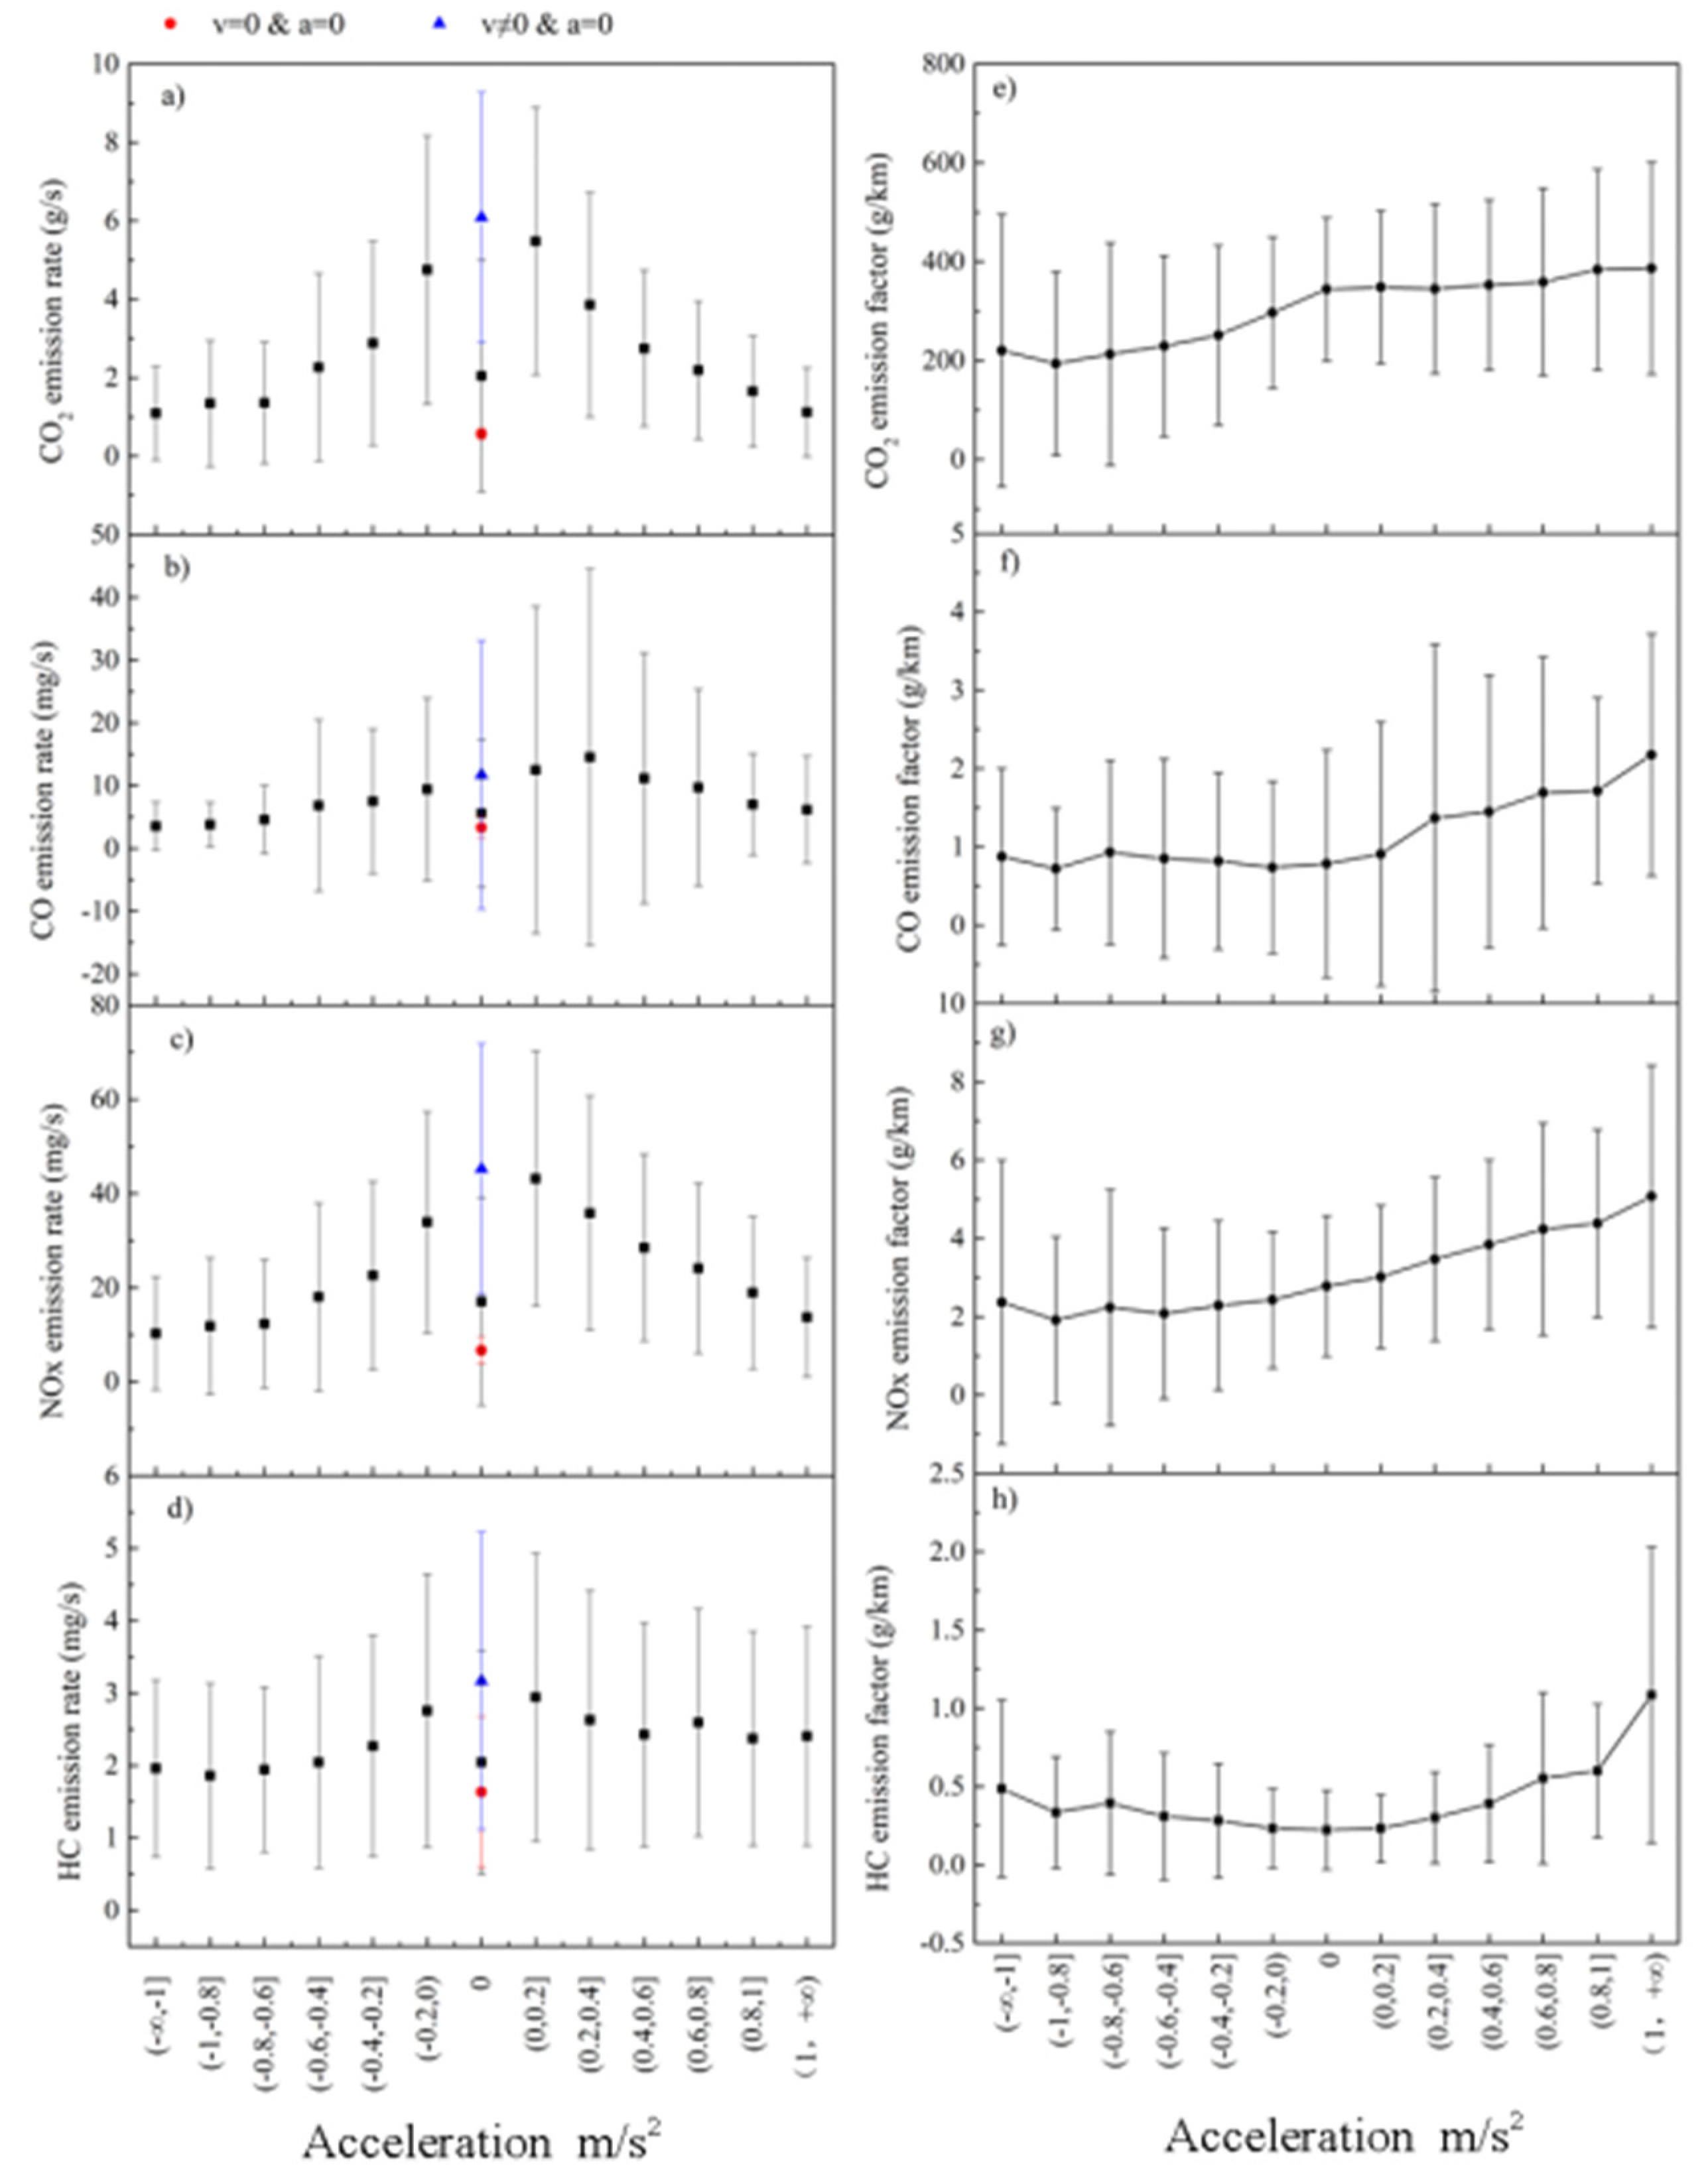
3.2. Effect of Speed and Acceleration on Emissions

The acceleration vs. speed plot driving on three road conditions during a normal test trip of LDDT3 (China V) was shown in Figure 3. Clearly, urban driving presented the lowest speed, mainly concentrated in 0–40 km/h, whereas the speed of suburban driving and highway driving were concentrated in 40–60 km/h and 70–100 km/h, respectively. In addition, Figure 3 also showed that accelerations during urban driving and suburban driving conditions were significantly higher than those of highway driving conditions. The average-, median- and maximum-speeds on three road conditions were listed in Table S3 in Supplementary Materials.
Instantaneous emission rates and factors of CO, HC, and NOx at various speeds for LDDTs that meet the China III, China IV, and China V emission standards are presented in Figure 4. Due to the instrument failure during the collection process, the instantaneous CO emission rates of China IV were missing, and there were no corresponding EFs. The results reflected that the emission rates of CO, HC, and NOx increased gradually with the increase of the speed, while the EFs decreased. In theory, EFs not only depend on emission rates, but also depend on the speed. At a given emission rate, the EFs would gradually decrease as the emission rate increase. For instance, CO EFs decreased by 53.5% and 39.6%, and HC EFs decreased by 59.2% and 66.7% as the vehicle speed increased from 40 to 100 km/h for China Ⅲ and China Ⅴ diesel vehicles, respectively. However, at a given speed, there would be a positive correlation between EFs and emission rates, which was consistent with that shown in Figure 4. In most cases, CO, NOx and HC emission rates at low speed were smaller than those at high speed. In contrast, the relationship between speed and factors of CO, NOx, and HC emissions was rough negatively correlated when the speed was smaller than approximately 20 km/h. Firstly, according to the data of NOx at the speed of less than 20 km/h and the acceleration is not 0, the data of low speed and deceleration account for 44.7–49.2%, and the data of low speed and acceleration account for 50.8–55.3%. Under the condition of low-speed driving, the acceleration and deceleration behavior will worsen the fuel combustion and aggravate the incomplete combustion, resulting in a NOx emission factor higher than the combustion under the condition of constant speed [27]. Secondly, as the speed increased, the combustion became more complete and the improved combustion conditions had also reduced the concentration of CO and HC. Additionally, car engine load increased with speed, the a high load would make the cylinder reach a high temperature. Furthermore, part of the HC was converted into other carbonaceous oxides at high temperature, which would play an important role in promoting the oxidation of HC. It could also promote the oxidation from CO to CO2 [14,49].
There was a positive correlation between NOx emission rate and vehicle speed, and as the speed increased the EF decreased under the different standards, which was shown in Figure 4. The reasons for this phenomenon mainly includes two aspects. Firstly, the formation of NOx is mainly due to the existence of sufficient oxygen and appropriate temperature in the cylinder [50]. At the low speed, the oxygen in the cylinder was higher, thus NOx was more likely produced. Secondly, the increase of speed is beneficial to improve the uniformity of fresh air and fuel in the cylinder. The temperature in the cylinder increases with the increase of combustion level. In return, high temperatures accelerate the evaporation of the fuel, resulting in a more uniform mixture of air and fuel. Therefore, the emission of NOx decreases with the increase of vehicle speed [27,51].
Figure 5 shows the emission rates and EFs of CO, HC, NOx from LDDTs with different accelerations. According to the acceleration interval division data, the CO, HC and NOx data of LDDTs are processed to obtain the CO, HC and NOx emission rates and EFs in different acceleration intervals. The acceleration distribution is mainly within the range of −1.0 to 1.0 m/s2. When the acceleration a = 0 and the speed v ≠ 0, the emission rates of the test pollutants was almost to the maximum, especially HC and NOx could reach 4 mg/s and 5 mg/s, respectively. When the acceleration a ≠ 0, in other words, at the accelerated and decelerated driving conditions, the emission rates of test pollutants were generally lower than those at a = 0. Specifically, the emission rates gradually increased as the values of acceleration increased when a > 0; and the trend was just opposite when a < 0. As shown in the right column of Figure 5, there was a slight upward trend in the EFs of CO, HC and NOx when a > 0. There was no significant trend in the EFs, except NOx when a < 0. There are several reasons for this phenomenon. Few pollutants were generated without the combustion with the fuel injection cut off during the sharp deceleration (a < 0), which might only emit from the residuals in deposits and voids in the engine. On the other hand, more fuel would be injected into the cylinder to generate more power at the acceleration conditions (a > 0), which would aggravate exhaust emissions. The experimental results in this work were consistent with those reported by several previous studies on vehicle measurement of CO, HC, and NOx [1,28,42,46]. Rapid acceleration generally results in higher emissions, sometimes even a single rapid acceleration could also lead to higher emissions [42]. Some previous studies reported that the proportion of idling time during driving in the city was the highest (approximately 30.3%), indicating that acceleration and deceleration in the low-speed phase were more frequent, which would increase the NOx emissions [1,46]. Therefore, it is of great significance to control vehicular emissions under vehicle acceleration conditions to improve urban air quality.

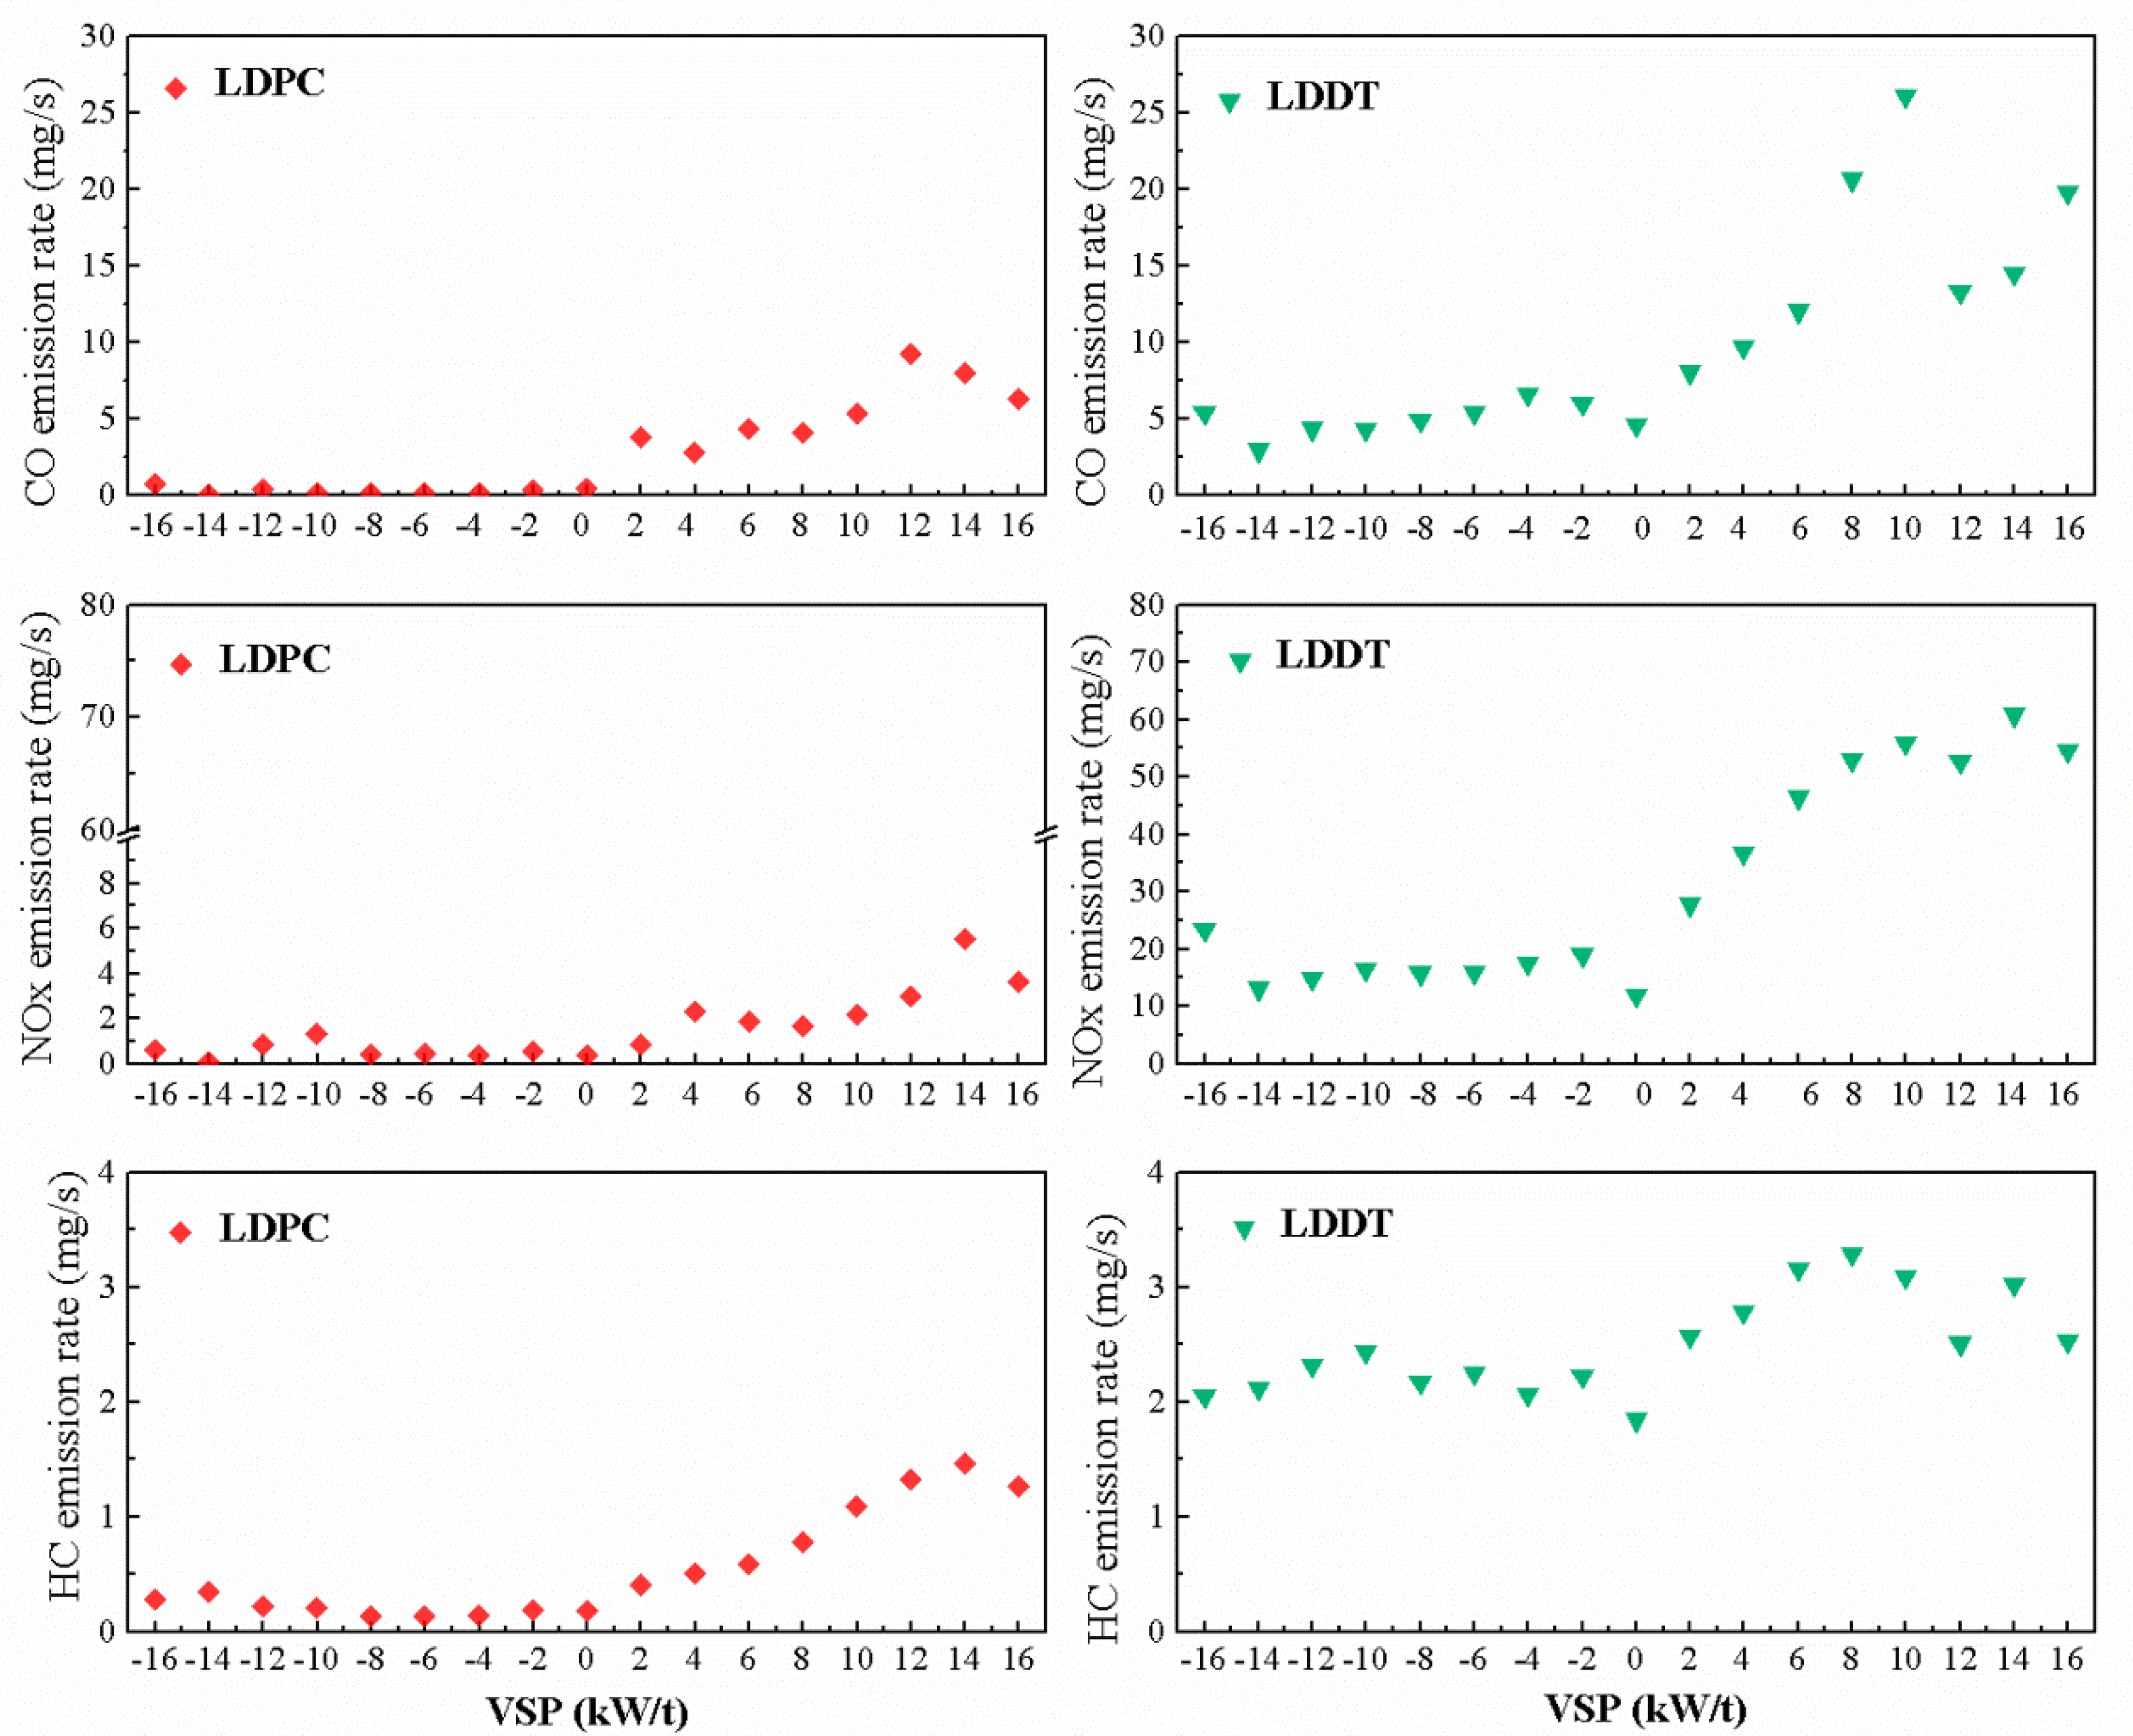
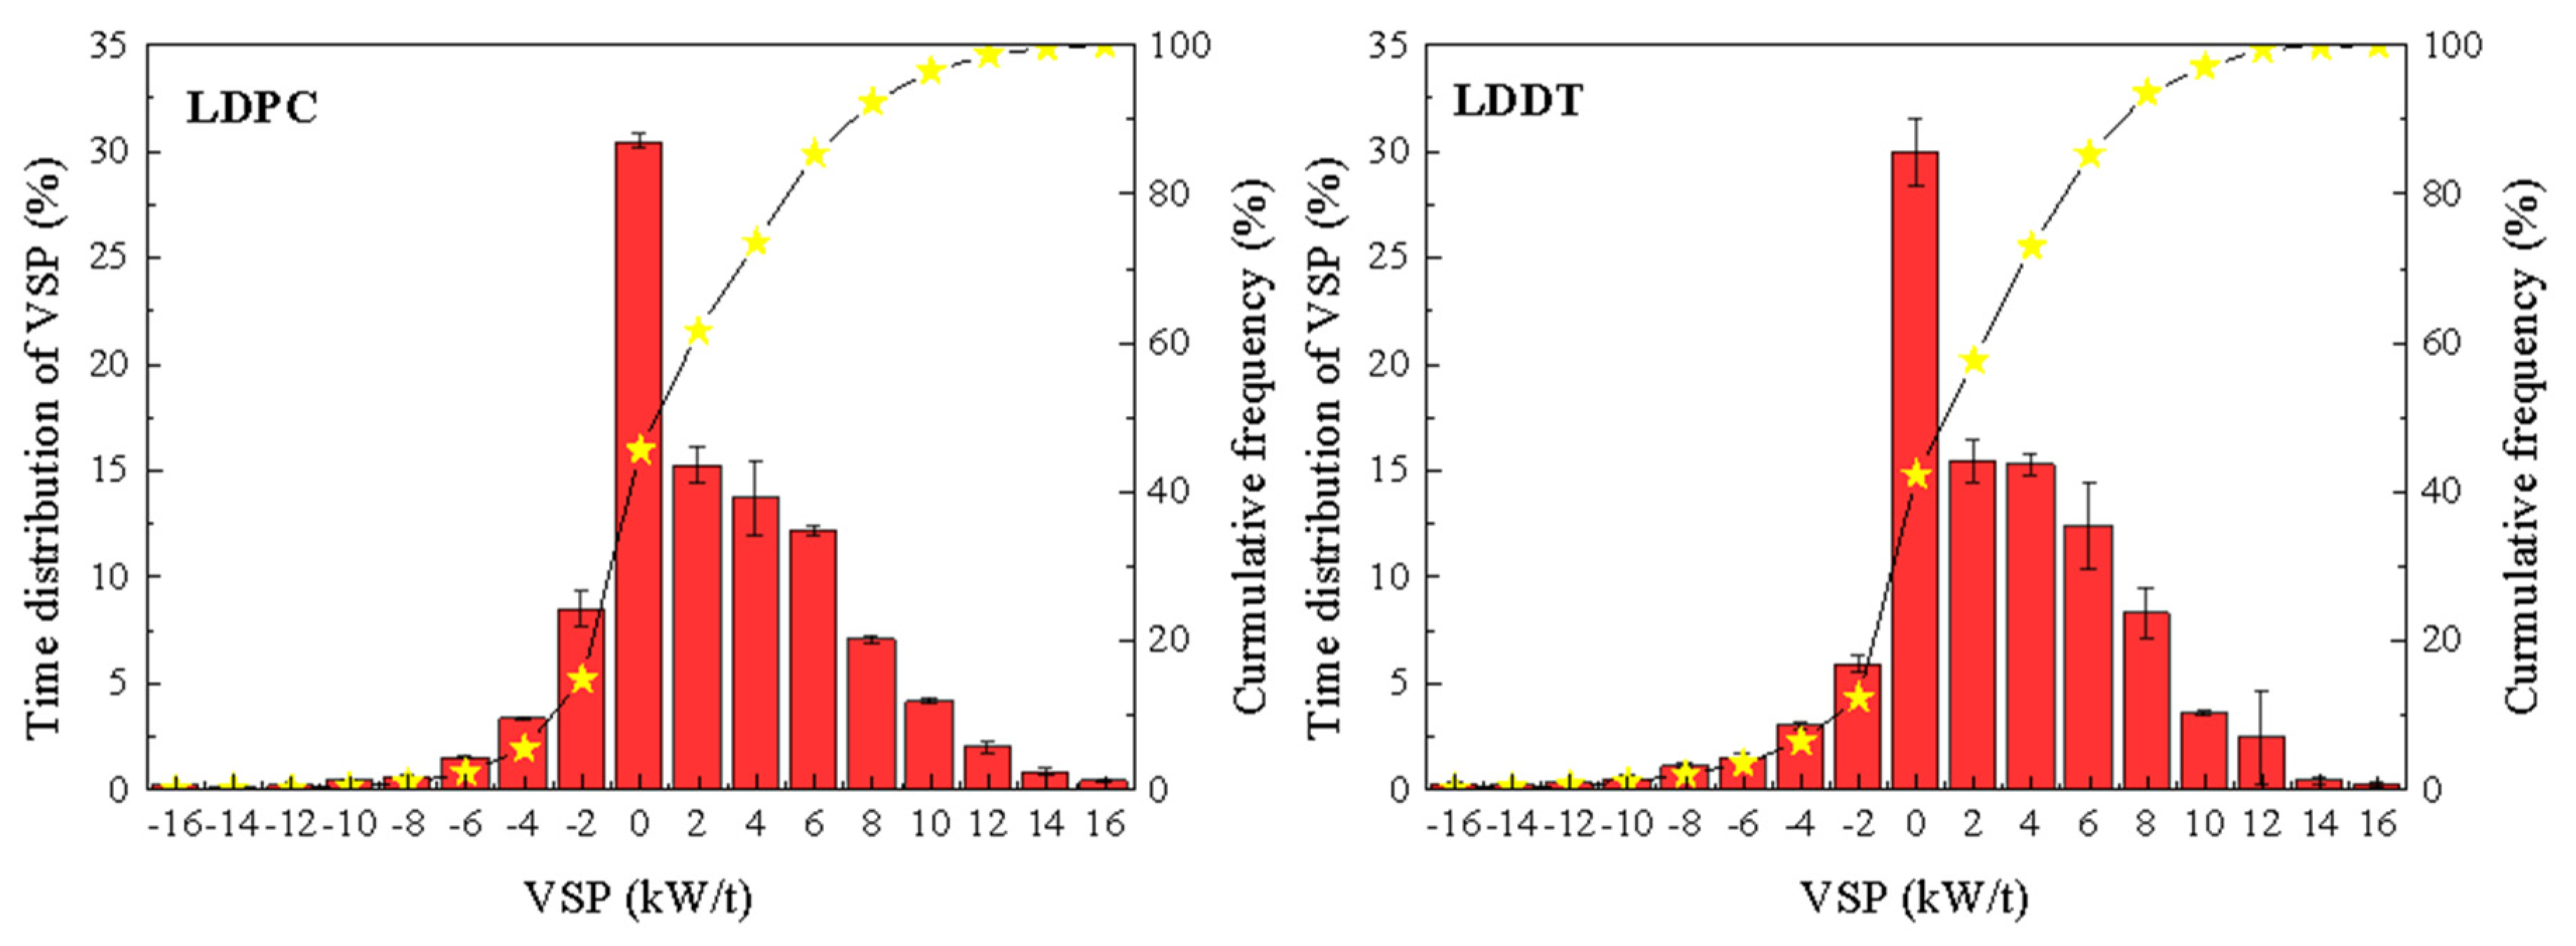
3.3. Emission Characteristics of Pollutants Based on VSP

Figure 6 shows the VSP interval distribution characteristics of LDPC and LDDT. It can be seen from the Figure 6 that the VSP of each model is mainly distributed between −15–15 kw/t, accounting for 98.7–99.6% of the test time. The VSP of LDPC is only 14.4% in the negative range, 30.4% in Bin0 distribution, and 55.2% in the positive range. The VSP of LDPC is mainly distributed in (−3, −1], (−1, 1], (1, 3], (3, 5], (5, 7] and (7, 9] range, which indicates that LDPC drives in a relatively stable state most of the time, and the proportion of rapid acceleration and deceleration is relatively low. The VSP distribution of LDDT and LDPC is similar. The proportion of VSP in the negative range is only 12.3%, in Bin0 distribution is 30.0%, and in the positive range is 57.7%, which indicated that the VSP distribution of LDDTs and LDPCs were consistent under the same driving conditions.
The relationship between the emission rates of regulated gaseous pollutants and VSP is shown in Figure 7 and the specific data of Figure 7 is presented in Table S4 in the Supplementary Materials. Emission rates of LDPC and LDDT in Figure 7 were the average of the measured LDPCs and LDDTs (LDDT1 and LDDT 3), respectively. It should be noted that CO data of LDDT2 were not used in Figure 7 due to the data loss during testing. The CO emission rate of different vehicles changes with VSP basically the same, but there are also certain differences. For LDPC, when VSP < 0, the CO emission rates was relatively small, basically below 0.1 mg/s, and there was no obvious trend. For LDPC, when VSP > 0, the CO emission rate increased with the increase of VSP, reaches the peak at Bin12, and then decreased. When the VSP value is negative, the CO emission rates of LDDT basically does not exceed 7 mg/s, and the lowest CO emission is at Bin-14 for LDDT, when the VSP value was positive, the CO emission rates increased rapidly with the increase of VSP, and it reaches its maximum value at Bin10. This phenomenon was mainly contributed to that a negative value of VSP corresponds to deceleration conditions, fuel injection is reduced, so CO emissions are lower than those of VSP > 0, and when VSP is positive, a high VSP meant a rich mixture, resulting in incomplete fuel combustion, so CO emissions rise [44]. For LDPC, in Bin12, the average acceleration was 0.52 m/s2 and the average speed is 48.76 km/h. In Bin14 and Bin16, the average acceleration is 0.39 m/s2 and 0.38 m/s2 and the velocity is 44.56 km/h and 42.13 km/h, respectively. According to the calculation formula, the VSP value of Bin12 was the largest, while the VSP value of bin14 and bin16 decreased. When VSP > 12, the proportion of high-speed vehicles was lower, then the emission rates did not exceed those of Bin12. For LDDT, the corresponding vehicle operation conditions of Bin10 were that the acceleration a > 0, and 80% of the vehicle speed v > 60 km/h, and more than half of the vehicle speed v > 90 km/h, which indicated that vehicles Bin10 are driving at medium- or high-speed phases. Therefore, The Bin10 interval corresponded to the highest LDDT-CO emission rate. In Bin12, Bin14, and Bin16, the proportion of high-speed (v > 90 km/h) vehicles was 19.5%, 22.3% and 40.5%, so the CO emission rates increase from Bin12 to Bin16, but the emission rates did not exceed those of Bin12.
As shown in Figure 7, there were no significant changes of NOx emissions when VSP < 0, and the NOx emission rate increased first and then tended to decrease as the speed increases when VSP > 0. The slight difference of NOx emission rates between Bins4 and 6 did not change the general tendency. When VSP was in the intervals of [−16, 0] and (0, 16], the NOx emission rates of LDPC were 0.07–1.32 mg/s and 0.86 −5.53 mg/s, respectively. And those for LDDT were 11.98–23.32 mg/s and 27.79–60.85 mg/s, respectively. Obviously, NOx emission rates at VSP < 0 were much lower than those at VSP > 0. When VSP was negative, NOx emission was lower, and there was no increasing or decreasing trend with the increase of VSP. When VSP is positive, NOx emission is positively correlated with VSP. In addition, for LDPC, the emission rate at Bin-14 was the lowest, only 0.07 mg/s. The average acceleration and speed of Bin-14 interval were −1.33 m/s2 and 25 km/h, respectively, which indicates that the vehicles driving in this interval were under the abrupt deceleration conditions. For LDDT, the emission rate at Bin0 was the lowest, corresponding to the vehicle idling or low-speed stable driving conditions.
As shown in Figure 7, there was no significant change of the HC emission rates and changes gently with VSP when VSP < 0. However, the vehicle HC emission rates increased gradually with the VSP increased from 0 to 14 kW/t. For LDPC, the minimum emission rates of HC reach to 0.14 mg/s in Bin-4~-8, and the maximum emission rate (1.46 mg/s) was found in Bin14. This was mainly contributed to that the average speed and acceleration in Bin-4~-8 were 22.30 km/h and −0.63 m/s2, respectively, and the minimum acceleration was −1.83 m/s2. Therefore, the vehicles were in low speeds and deceleration states, and the emission rates were very small. The average speed and acceleration at Bin14 were 44.56 km/h and 0.39 m/s2, respectively. The vehicles performed uniform acceleration driving, resulting in the high emission rates. The emission rates of Bin16 were lower than Bin14 because the average vehicle speed of Bin16 was 39.45 km/h and the average acceleration was 1.11 m/s2. The impact of speed on the emission rate was higher than that of acceleration in the interval of Bin14 and Bin16. For LDDTs, the minimum and maximum emission rates are 1.85 mg/s (at Bin0) and 3.29 mg/s (at Bin8), respectively. At Bin0, the speeds v = 0 km/h of the three vehicles was as high as 65%, and the speed v ≤ 20 km/h was as high as 77.9%. The data of speed v ≤ 20 km/h and deceleration accounted for 26.4%. Therefore, it was idle for LDDTs at Bin0 for most of the time, and the emission rates were very low. At Bin8, more than 75% of the vehicles had speeds higher than 60 km/h, and the vehicles were driving at the medium- and high-speed driving conditions, so the vehicles operated in good conditions and had high emission rates.

4. Conclusions

This study measured the exhaust CO, HC, and NOx emissions from five typical light-duty vehicles which had adopted a portable emissions measurement system under real driving conditions, and analyzed the relationships between emission characteristics of regulated gaseous pollutants and operating conditions mainly containing speed, acceleration, and VSP. We found that road conditions had an important impact on regulated gaseous emissions, especially for HC emissions from both LDPCs and LDDTs. CO, NOx, and HC emissions from five test vehicles on the urban roads were found to increase by approximately 1.1–1.5 times, 1.2–1.4 times, and 1.9–2.6 times, respectively, compared with those on suburban and highway roads.
Data analysis of numerous transient emissions showed that a rough positive correlation was found between speed and CO, NOx, and HC emission rates. In most cases, CO, NOx, and HC emission rates at a low speed were smaller than those at a high speed. In contrast, the relationship between speed and factors of CO, NOx, and HC emissions was rough negatively correlated when the speed was smaller than approximately 20 km/h. There were no significant changes in the EFs when the speed was greater than 20 km/h.
The accelerations were divided into 12 bins with a 0.2 m/s2 interval in this study. Under normal cruise conditions, the emission rates of NOx and HC reach the peak at 0 m/s2, and the peak of CO occurred at acceleration a little higher than 0 m/s2. There were no significant changes in EFs of CO, NOx, and HC when the acceleration was smaller than 0 m/s2, and an upward trend of the EFs was found with increasing speed when the acceleration was positive.
The VSP was divided into 17 bins with a 2 kW/t interval in this study. VSP of these test vehicles was mainly distributed between −15–15 kW/t, accounting for 98.7–99.6% of the test time. When VSP < 0, CO, NOx, and HC emissions were lower, and changes in VSP had less impact on pollutant emissions. For both LDPCs and LDDTs, the lowest emission rates of exhaust pollutant were generally occurred in the Bin0 interval, except NOx emissions. When VSP > 0, CO, NOx, and HC emission rates increased obviously, the gaseous emission rates decreased when the VSP was too high.

Supplementary Materials

The following are available online at www.mdpi.com/article/10.3390/atmos12091125/s1, Table S1. Mileage records of all PEMS experiments in this study; Table S2. Average emission factors of LDPCs and LDDTs under different road conditions; Table S3. Average, median and maximum speeds of LDDT3 driving under three road conditions; Table S4. Emission rates of CO, NOx and HC at different VSP bins.

Author Contributions

Conceptualization, R.Z. (Rencheng Zhu), X.B. and H.M.; methodology, R.Z. (Rencheng Zhu), M.W. and Y.L., software, H.M., L.W.; formal analysis, M.W., H.M. and B.W.; investigation, Y.W. and L.W.; resources, R.Z. (Rencheng Zhu); data curation, Y.W. and B.W.; writing, H.M. and R.Z. (Rencheng Zhu); visualization, H.M. and M.W.; supervision, R.Z. (Ruiqin Zhang) and X.B.; project administration, R.Z. (Rencheng Zhu); funding acquisition, R.Z. (Rencheng Zhu) All authors have read and agreed to the published version of the manuscript.

Funding

This work was funded by the National Natural Science Foundation of China (grant number 51808507), the National Key R&D Program of China (grant number 2017YFC0212400), the National Engineering Laboratory for Mobile Source Emission Control Technology (grant number NELMS2018A16), and the Key Specialized Research and Development Program in Henan Province (grant number 212102310524). The contents of this paper are solely the responsibility of the authors and do not necessarily represent the official views of the sponsors.

Institutional Review Board Statement

Not applicable.

Informed Consent Statement

Not applicable.

Data Availability Statement

The data that support the findings of this study are in this paper.

Acknowledgments

The authors would like to acknowledge Shunyi Li of Zhengzhou University, Xiaoyan Liu and Cong Shen of the Chinese Research Academy of Environmental Sciences, and Xiaomao Zhang for their contributions in conducting the emission tests.

Conflicts of Interest

For both financial and non-financial interests, the authors declare no competing interest.

References

  1. Prakash, S.; Bodisco, T. An investigation into the effect of road gradient and driving style on NOx emissions from a diesel vehicle driven on urban roads. Transp. Res. Part D Transp. Environ. 2019, 72, 220–231. [Google Scholar] [CrossRef]
  2. Jin, B.; Zhu, R.; Mei, H.; Wang, M.; Zu, L.; Yu, S.; Zhang, R.; Li, S.; Bao, X. Volatile organic compounds from a mixed fleet with numerous E10-fuelled vehicles in a tunnel study in China: Emission characteristics, ozone formation and secondary organic aerosol formation. Environ. Res. 2021, 200, 111463. [Google Scholar] [CrossRef]
  3. Zhang, S.H.; Peng, D.; Li, Y.; Zu, L.; Fu, M.L.; Yin, H.; Ding, Y. Study on the real-world emissions of rural vehicles on different road types. Environ. Pollut. 2021, 273, 116453. [Google Scholar] [CrossRef] [PubMed]
  4. Hao, L.; Yin, H.; Wang, J.; Wang, X.; Ge, Y. Potential of big data approach for remote sensing of vehicle exhaust emissions. Sci. Rep. 2021, 11, 1. [Google Scholar] [CrossRef]
  5. Ministry of Ecology and Environment of the People’s Republic of China (MEEPRC). China Mobile Source Environmental Management Annual Report; Ministry of Ecology and Environment of the People’s Republic of China (MEEPRC): Beijing, China, 2020. (In Chinese)
  6. Zhang, Q.; Wu, L.; Fang, X.; Liu, M.; Zhang, J.; Shao, M.; Lu, S.; Mao, H. Emission factors of volatile organic compounds (VOCs) based on the detailed vehicle classification in a tunnel study. Sci. Total Environ. 2018, 624, 878–886. [Google Scholar] [CrossRef]
  7. Smit, R.; Bainbridge, S.; Kennedy, D.; Kingston, P. A decade of measuring on-road vehicle emissions with remote sensing in Australia. Atmos. Environ. 2021, 252, 118317. [Google Scholar] [CrossRef]
  8. Hao, L.; Yin, H.; Wang, J.; Wang, X.; Ge, Y. Remote sensing of NO emission from light-duty diesel vehicle. Atmos. Environ. 2020, 242, 117799. [Google Scholar] [CrossRef]
  9. Agarwal, A.K.; Mustafi, N.N. Real-world automotive emissions: Monitoring methodologies, and control measures. Renew. Sustain. Energy Rev. 2021, 137, 110624. [Google Scholar] [CrossRef]
  10. Khan, T.; Frey, C.H. Comparison of real-world and certification emission rates for light duty gasoline vehicles. Sci. Total Environ. 2018, 622–623, 790–800. [Google Scholar] [CrossRef]
  11. Alves, C.A.; Oliveira, C.; Martins, N.; Mirante, F.; Caseiro, A.; Pio, C.; Matos, M.; Silva, H.F.; Oliverira, C.; Camoes, F. Road tunnel, roadside, and urban background measurements of aliphatic compounds in size-segregated particulate matter. Atmos. Res. 2016, 168, 139–148. [Google Scholar] [CrossRef]
  12. Real-Driving Emissions Test Procedure for Exhaust Gas Pollutions of CARS and Light Commercial Vehicles in Europe. Available online: https://theicct.org/sites/default/files/publications/EU-RDE_policy-update_18012017_vF.pdf (accessed on 26 August 2021).
  13. Huang, Y.; Organ, B.; Zhou, J.L.; Surawski, N.C.; Hong, G.; Chan, E.F.; Yam, Y.S. Emission measurement of diesel vehicles in Hong Kong through on-road remote sensing: Performance review and identification of high-emitters. Environ. Pollut. 2018, 237, 133–142. [Google Scholar] [CrossRef]
  14. Wang, G.; Cheng, S.; Lang, J.; Li, S.; Tian, L. On-board measurements of gaseous pollutant emission characteristics under real driving conditions from light-duty diesel vehicles in Chinese cities. J. Environ. Sci. 2016, 46, 28–37. [Google Scholar] [CrossRef] [PubMed]
  15. Varella, R.A.; Faria, M.V.; Villafuerte, P.M.; Baptista, P.C.; Sousa, L.; Duarte, G.O. Assessing the influence of boundary conditions, driving behavior and data analysis methods on real driving CO2 and NOx emissions. Sci. Total Environ. 2019, 658, 879–894. [Google Scholar] [CrossRef]
  16. Duarte, G.O.; Gonçalves, G.A.; Farias, T.L. Analysis of fuel consumption and pollutant emissions of regulated and alternative driving cycles based on real-world measurements. Transp. Res. Part D Transp. Environ. 2016, 44, 43–54. [Google Scholar] [CrossRef]
  17. Wang, M.L.; Li, S.Y.; Zhu, R.C.; Zu, L.; Wang, Y.J.; Bao, X.F. On-road tailpipe emission characteristics and ozone formation potentials of VOCs from gasoline, diesel and liquefied petroleum gas fueled vehicles. Atmos. Environ. 2020, 223, 117294. [Google Scholar] [CrossRef]
  18. García, R.; Soriano, J.A.; Fernández, P. Impact of regulated pollutant emissions of Euro 6d-Temp light-duty diesel vehicles under real driving conditions. J. Clean. Prod. 2021, 268, 124927. [Google Scholar] [CrossRef]
  19. Chaa, J.; Leeb, J.; Chon, M.S. Evaluation of real driving emissions for Euro 6 light-duty diesel vehicles equipped with LNT and SCR on domestic sales in Korea. Atmos. Environ. 2019, 196, 133–142. [Google Scholar] [CrossRef]
  20. Washburn, S.; Seet, J.; Mannering, F. Statistical modeling of vehicle emissions from inspection/maintenance testing data: An exploratory analysis. Transp. Res. Part D Transp. Environ. 2001, 6, 21–36. [Google Scholar] [CrossRef]
  21. Zhao, Y.; Lamber, A.T.; Saleh, R.; Saliba, G.; Robinson, A.L. Secondary organic aerosol production from gasoline vehicle exhaust: Effects of engine technology, cold start, and emission certification standard. Environ. Sci. Technol. 2018, 52, 1253–1261. [Google Scholar] [CrossRef] [PubMed]
  22. Zhu, R.C.; Hu, J.N.; He, L.Q.; Zu, L.; Bao, X.F.; Lai, Y.T.; Su, S. Effects of ambient temperature on regulated gaseous and particulate emissions from gasoline-, E10- and M15-fueled vehicles. Front. Environ. Sci. Eng. 2021, 15, 14. [Google Scholar] [CrossRef]
  23. Boroujeni, B.Y.; Frey, H.C. Road grade quantification based on global positioning system data obtained from real-world vehicle fuel use and emissions measurements. Atmos. Environ. 2014, 85, 179–186. [Google Scholar] [CrossRef]
  24. Zhang, Q.; Fan, J.; Yang, W.; Chen, B.; Zhang, L.; Liu, J.; Wang, J.; Zhou, C.; Chen, X. The effects of deterioration and technological levels on pollutant emission factors for gasoline light-duty trucks. J. Air Waste Manag. Assoc. 2017, 67, 814–823. [Google Scholar] [CrossRef] [Green Version]
  25. Huo, H.; Zheng, B.; Wang, M.; Zhang, Q.; He, K. Vehicular air pollutant emissions in China: Evaluation of past control policies and future perspectives. Mitig. Adapt. Strat Gl. 2015, 20, 719–733. [Google Scholar] [CrossRef]
  26. Shukla, A.; Alum, M. Assessment of real world on-road vehicle emissions under dynamic urban traffic conditions in Delhi. Int. J. Urban Sci. 2010, 14, 207–220. [Google Scholar] [CrossRef]
  27. Zhu, R.C.; Hu, J.N.; Bao, X.F.; He, L.Q.; Lai, Y.T.; Zu, L.; Li, Y.F.; Su, S. Investigation of tailpipe and evaporative emissions from China IV and Tier 2 passenger vehicles with different gasolines. Transp. Res. Part D 2017, 50, 305–315. [Google Scholar] [CrossRef]
  28. Chen, C.; Huang, C.; Jing, Q.; Wang, H.; Pan, H.; Li, L.; Zhao, J.; Dai, Y.; Huang, H.; Schipper, L.; et al. On-road emission characteristics of heavy-duty diesel vehicles in Shanghai. Atmos. Environ. 2007, 41, 5334–5344. [Google Scholar] [CrossRef]
  29. Andre, M.; Rapone, M. Analysis and modelling of the pollutant emissions from European cars regarding the driving characteristics and test cycles. Atmos. Environ. 2009, 43, 986–995. [Google Scholar] [CrossRef]
  30. Official Journal of the European Union. Available online: https://eur-lex.europa.eu/legal-content/EN/TXT/PDF/?uri=CELEX:32018R1832&from=FR (accessed on 26 June 2021).
  31. Jiménez-Palacios, J. Understanding and Quantifying Motor Vehicle Emissions with Vehicle Specific Power and TILDAS Remote Sensing. Ph.D. Thesis, Massachusetts Institute of Technology, Department of Mechanical Engineering, Cambridge, MA, USA, 1999. [Google Scholar]
  32. Zhai, H.B.; Frey, H.C.; Rouphail, H.M. A vehicle-specific power approach to speed- and facility-specific emissions estimates for diesel transient buses. Environ. Sci. Technol. 2008, 42, 7985–7991. [Google Scholar] [CrossRef]
  33. Rhys-Tyler, G.A.; Bell, M.C. Toward reconciling instantaneous roadside measurements of light duty vehicle exhaust emissions with type approval driving cycles. Environ. Sci. Technol. 2012, 46, 10238–10532. [Google Scholar] [CrossRef] [Green Version]
  34. Wang, J.G.; Gui, H.Q.; Yang, Z.W.; Yu, T.Z.; Zhang, X.W.; Liu, J.G. Real-world gaseous emission characteristics of natural gas heavy-duty sanitation trucks. J. Environ. Sci. 2020, 115, 319–329. [Google Scholar] [CrossRef]
  35. Wan, X.; Song, G.H.; Zhai, Z.Q.; Wu, Y.Z.; Yin, H.; Yu, L. Effects of vehicle load on emissions of heavy-duty diesel trucks: A study based on real-world data. Int. J. Environ. Res. Public Health 2021, 18, 3877. [Google Scholar]
  36. Zhang, S.H.; Yu, L.; Song, G.H. Emissions characteristics for heavy-duty diesel trucks under different loads based on vehicle-specific power. Transp. Res. Rec. 2017, 2027, 77–85. [Google Scholar] [CrossRef]
  37. Wang, H.H.; Ge, Y.S.; Tan, J.W.; Wu, L.G.; Wu, P.C.; Hao, L.J.; Peng, Z.H.; Zhang, C.Z.; Wang, X.; Han, Y.X.; et al. The Real-world emissions from urban freight trucks in Beijing. Aerosol. Air Qual. Res. 2018, 18, 1448–1456. [Google Scholar] [CrossRef]
  38. Perugu, H. Emission modelling of light-duty vehicles in India using the revamped VSP-based MOVES model: The case study of Hyderabad. Transp. Res. Part D. 2019, 68, 150–163. [Google Scholar] [CrossRef]
  39. Duarte, G.O.; Goncalves, G.A.; Baptista, P.C.; Farias, T.L. Establishing bonds between vehicle certification data and real-world vehicle fuel consumption—A Vehicle Specific Power approach. Energy Convers. Manag. 2015, 92, 251–265. [Google Scholar] [CrossRef]
  40. He, L.Q.; Hu, J.N.; Yang, L.H.Z.; Li, Z.H.; Zheng, X.; Xie, S.X.; Zu, L.; Chen, J.H.; Li, Y.; Wu, Y. Real-world gaseous emissions of high-mileage taxi fleets in China. Sci. Total Environ. 2019, 659, 267–274. [Google Scholar] [CrossRef]
  41. Gallus, J.; Kirchner, U.; Vogt, R.; Benter, T. Impact of driving style and road grade on gaseous exhaust emissions of passenger vehicles measured by a Portable Emission Measurement System (PEMS). Transp. Res. Part D Transp. Environ. 2017, 52, 215–226. [Google Scholar] [CrossRef]
  42. Frey, H.; Unal, A.; Chen, J.; Li, S.; Xuan, C. Methodology for Developing Modal Emission Rates for EPA’s Multi-Scale Motor Vehicle & Equipment Emission System; EPA420-R02-027; U.S. Environmental Protection Agency: Washington, DC, USA, 2002. [Google Scholar]
  43. Choudhary, A.; Gokhale, S. Urban real-world driving traffic emissions during interruption and congestion. Transp. Res. Part D Transp. Environ. 2016, 43, 59–70. [Google Scholar] [CrossRef]
  44. Huang, C.; Lou, D.M.; Hu, Z.Y.; Feng, Q.; Chen, Y.R.; Chen, C.H.; Tan, P.Q.; Yao, D. A PEMS study of the emissions of gaseous pollutants and ultrafine particles from gasoline- and diesel-fueled vehicles. Atmos. Environ. 2013, 77, 703–710. [Google Scholar] [CrossRef]
  45. Mahesh, S.; Ramadurai, G.; Nagendra, S.M.S. Real-world emissions of gaseous pollutants from diesel passenger cars using portable emission measurement systems. Sustain. Cities Soc. 2018, 41, 104–113. [Google Scholar] [CrossRef]
  46. Lee, Y.; Lee, S.; Lee, S.; Choi, H.; Min, K. Characteristics of NOx emission of light-duty diesel vehicle with LNT and SCR system by season and RDE phase. Sci. Total Environ. 2021, 782, 146750. [Google Scholar] [CrossRef]
  47. Park, J.; Shin, M.; Lee, J.; Lee, J. Estimating the effectiveness of vehicle emission regulations for reducing NOx from light-duty vehicles in Korea using on-road measurements. Sci. Total Environ. 2021, 767, 144250. [Google Scholar] [CrossRef] [PubMed]
  48. Carslaw, D.C.; Priestman, M.; Williams, M.L.; Stewart, G.B.; Beevers, S.D. Performance of optimised SCR retrofit buses under urban driving and controlled conditions. Atmos. Environ. 2015, 105, 70–77. [Google Scholar] [CrossRef]
  49. Wang, X.; Yin, H.; Ge, Y.S.; Yu, L.X.; Xu, Z.X.; Yu, C.L.; Shi, X.J.; Liu, H.K. On-vehicle emission measurement of a light-duty diesel van at various speeds at high altitude. Atmos. Environ. 2013, 81, 263–269. [Google Scholar] [CrossRef]
  50. Tu, R.; Xu, J.S.; Wang, X.; Zhai, Z.Q.; Hatzopoulou, M. Effects of ambient temperature and cold starts on excess NOx emissions in a gasoline direct injection vehicle. Sci. Total Environ. 2021, 760, 143402. [Google Scholar] [CrossRef] [PubMed]
  51. Jin, B.Q.; Wang, M.L.; Zhu, R.C.; Jia, M.; Wang, Y.J.; Li, S.Y.; Bao, X.F. Evaluation of additives used in gasoline vehicles in China: Fuel economy, regulated gaseous pollutants and volatile organic compounds based on both chassis dynamometer and on-road tests. Clean Technol. Environ. Policy 2021. [Google Scholar] [CrossRef]
Figure 1. The route used for the real-driving emission tests. (Blue line: the urban road; Yellow line: the suburban road; Red line: the highway road).
Atmosphere 12 01125 g001
Figure 2. Average EFs of CO, NOx, HC under different road conditions (Error bars represent 1 standard error).
Atmosphere 12 01125 g002
Figure 3. The speed-acceleration distribution during the test of LDDT3 (China Ⅴ).
Atmosphere 12 01125 g003
Figure 4. Data of LDDTs complying with China III, China IV, and China V emission standards. Instantaneous EFs (ad) and emission factors (eh) of CO, HC and NO at various speeds.
Atmosphere 12 01125 g004
Figure 5. The average emission rates (ad) and EFs (eh) of CO, HC and NOx from LDDTs in different acceleration intervals.
Atmosphere 12 01125 g005
Figure 6. VSP distribution of typical vehicles (The abscissa in the figure is VSP Bin, and the ordinate is the time proportion and cumulative frequency of VSP interval).
Atmosphere 12 01125 g006
Figure 7. The relationship between the average emission rates of CO, NOx and HC and VSP.
Atmosphere 12 01125 g007
Table 1. Specifications of test vehicles.
LabelFuelCurb Weight
(kg)
Modal
Year
Engine
Capacity (mL)
Odometer
(km)
Emission
Standards
After-TreatmentVehicle
Brand
LDPC1Gasoline17752016160059,784China ⅤTWC aLavida
LDPC2Gasoline17502018160013,427China ⅤTWCOctavia
LDDT1Diesel44952013366094,080China Ⅲ——Allroad
LDDT2Diesel44852016254528,918China ⅣDPF bOuling
LDDT3Diesel 2017298225,560China ⅤSCR c + DOC d Dayun
a: TWC is three-way catalytic converter; b: DPF is diesel particulate filter; c: SCR is selective catalytic reduction; d: DOC is diesel oxidation catalyst.
Table 2. Bins of VSP for light-duty vehicles.
VSP Bin
Number
VSP
(kW/t)
VSP Bin
Number
VSP
(kW/t)
−16VSP < −1521 < VSP ≤ 3
−14−15 < VSP ≤ −1343 < VSP ≤ 5
−12−13 < VSP ≤ −1165 < VSP ≤ 7
−10−11 < VSP ≤ −987 < VSP ≤ 9
−8−9 < VSP ≤ −7109 < VSP ≤ 11
−6−7 < VSP ≤ −51211 < VSP ≤ 13
−4−5 < VSP ≤ −31413 < VSP ≤ 15
−2−3 < VSP ≤ −11615 < VSP
0−1 < VSP ≤ 1
Publisher’s Note: MDPI stays neutral with regard to jurisdictional claims in published maps and institutional affiliations.

