Article

Effect of Temperature on Sowing Dates of Wheat under Arid and Semi-Arid Climatic Regions and Impact Quantification of Climate Change through Mechanistic Modeling with Evidence from Field

1
Department of Agronomy, University of Agriculture, Faisalabad 38000, Pakistan
2
Adaptive Research Farm, Karor 31100, Pakistan
3
Institute of Crop Science and Resource Conservation (INRES), Crop Science, University of Bonn, 53115 Bonn, Germany
4
Department of Agronomy, MNS-University of Agriculture, Multan 60000, Pakistan
5
Directorate of Agronomy, Ayub Agricultural Research Institute (AARI), Faisalabad 38000, Pakistan
6
Asian Disaster Preparedness Centre (ADPC), Islamabad 44000, Pakistan
7
U.S.-Pakistan Centre for Advanced Studies in Agriculture and Food Security, University of Agriculture, Faisalabad 38000, Pakistan
*
Author to whom correspondence should be addressed.
Atmosphere 2021, 12(7), 927; https://doi.org/10.3390/atmos12070927
Submission received: 16 May 2021 / Revised: 1 July 2021 / Accepted: 17 July 2021 / Published: 19 July 2021
(This article belongs to the Special Issue Climate Change and Its Impact on Crops)

Abstract

:
Rising temperature from climate change is the most threatening factor worldwide for crop production. Sustainable wheat production is a challenge due to climate change and variability, which is ultimately a serious threat to food security in Pakistan. A series of field experiments were conducted during seasons 2013–2014 and 2014–2015 in the semi-arid (Faisalabad) and arid (Layyah) regions of Punjab-Pakistan. Three spring wheat genotypes were evaluated under eleven sowing dates from 16 October to 16 March, with an interval of 14–16 days in the two regions. Data for the model calibration and evaluation were collected from field experiments following the standard procedures and protocols. The grain yield under future climate scenarios was simulated by using a well-calibrated CERES-wheat model included in DSSAT v4.7. Future (2051–2100) and baseline (1980–2015) climatic data were simulated using 29 global circulation models (GCMs) under representative concentration pathway (RCP) 8.5. These GCMs were distributed among five quadrants of climatic conditions (Hot/Wet, Hot/Dry, Cool/Dry, Cool/Wet, and Middle) by a stretched distribution approach based on temperature and rainfall change. A maximum of ten GCMs predicted the chances of Middle climatic conditions during the second half of the century (2051–2100). The average temperature during the wheat season in a semi-arid region and arid region would increase by 3.52 °C and 3.84 °C, respectively, under Middle climatic conditions using the RCP 8.5 scenario during the second half-century. The simulated grain yield was reduced by 23.5% in the semi-arid region and 35.45% in the arid region under Middle climatic conditions (scenario). Mean seasonal temperature (MST) of sowing dates ranged from 16 to 27.3 °C, while the mean temperature from the heading to maturity (MTHM) stage was varying between 12.9 to 30.4 °C. Coefficients of determination (R2) between wheat morphology parameters and temperature were highly significant, with a range of 0.84–0.96. Impacts of temperature on wheat sown on 15 March were found to be as severe as to exterminate the crop before heading. The spikes and spikelets were not formed under a mean seasonal temperature higher than 25.5 °C. In a nutshell, elevated temperature (3–4 °C) till the end-century can reduce grain yield by about 30% in semi-arid and arid regions of Pakistan. These findings are crucial for growers and especially for policymakers to decide on sustainable wheat production for food security in the region.

1. Introduction

Wheat is a staple food in Pakistan and contributes to food security locally and globally. Pakistan ranks 6th in wheat production and 8th in the harvested wheat area but 59th in terms of yield per unit area worldwide [1]. Wheat production largely depends upon weather conditions, especially adequate rainfall and temperature during the crop growing season. The production of wheat was higher in 2013–2014 compared with 2012–2013 due to sufficient rainfall and favorable temperature in Punjab-Pakistan [2]. Quantification of climate change impacts on wheat is an important step to develop adaptations and boost wheat grain yield at the field and national level.
The elevated temperature has threatened crop production around the globe during the last few decades. Wheat yield is predicted to fall by 6% worldwide with a rise of 1 °C [3]. Climate models predicted a mean increase in temperature by 1–3.7 °C, with a higher likelihood of increased frequency of heatwaves during the mid- to late-21st century [4]. Grain yield of wheat would decline 6–9% with 1 °C elevation in temperature of semi-arid and arid regions of Pakistan [5]. Ahmad et al. [6] reported that a 2 °C rise in temperature would reduce grain yield by 15.2% of irrigated wheat during mid-century 2040–2069 under representative concentrations pathway (RCP) 8.5 in Punjab-Pakistan. Elevated temperature negatively affects wheat growth and development, such as small grains, at 25–35 °C due to shorter grain filling duration and low photosynthesis rate at more than 30 °C [7]. Damaged vegetative structure negatively affects the reproductive structure and grain yield [6]. Additionally, warm temperature (>30 °C) significantly inhibits plant photosynthesis under water stress conditions (shortage of rainfall) [7]. Therefore, understanding the warm temperature effects on wheat growth and development is crucial in establishing a sustainable production system that can offset climate change effects.
There are different methods to analyze the high-temperature impacts, such as growth chambers, radiant tunnels, temperature free-air controlled enhancement, but field experiments and crop simulation modeling are the most useful methods [8]. Crop models are efficient tools for quantifying the climate change impacts on crops [3,9]. Crop growth models are being used to demonstrate the effect of crop management practices such as sowing dates and genetics of plants and even the interaction of these two entities with environmental conditions [10,11,12,13,14,15,16]. In many studies, crop models were utilized to assess the climate change impacts on crop production with changing temperature, elevated carbon dioxide, and rainfall patterns [9,10,13,14,15]. The Decision Support System for Agro-technology Transfer (DSSAT) is a complete system analysis approach for evaluating crop management, including sowing dates, irrigation, nutrients, and many more [17,18,19,20,21].
It has the potential to simulate crop development, growth, and yield by the interaction of soil, plant genetics, and atmospheric variables such as temperatures, precipitations, and solar radiation [10]. The CSM-CERES-wheat in DSSAT has been widely used for crop management decision-making for sustainable wheat production [18,19,20,21]. A comprehensive study of quantifying temperature rise and its impact on wheat in the region is limited, especially in Pakistan. This research is a combined effort of experiment and model simulation in the semi-arid and arid region of Pakistan to measure the high-temperature impacts on wheat morphology and grain yield through field experimentation and simulation modeling, respectively.

2. Materials and Methods

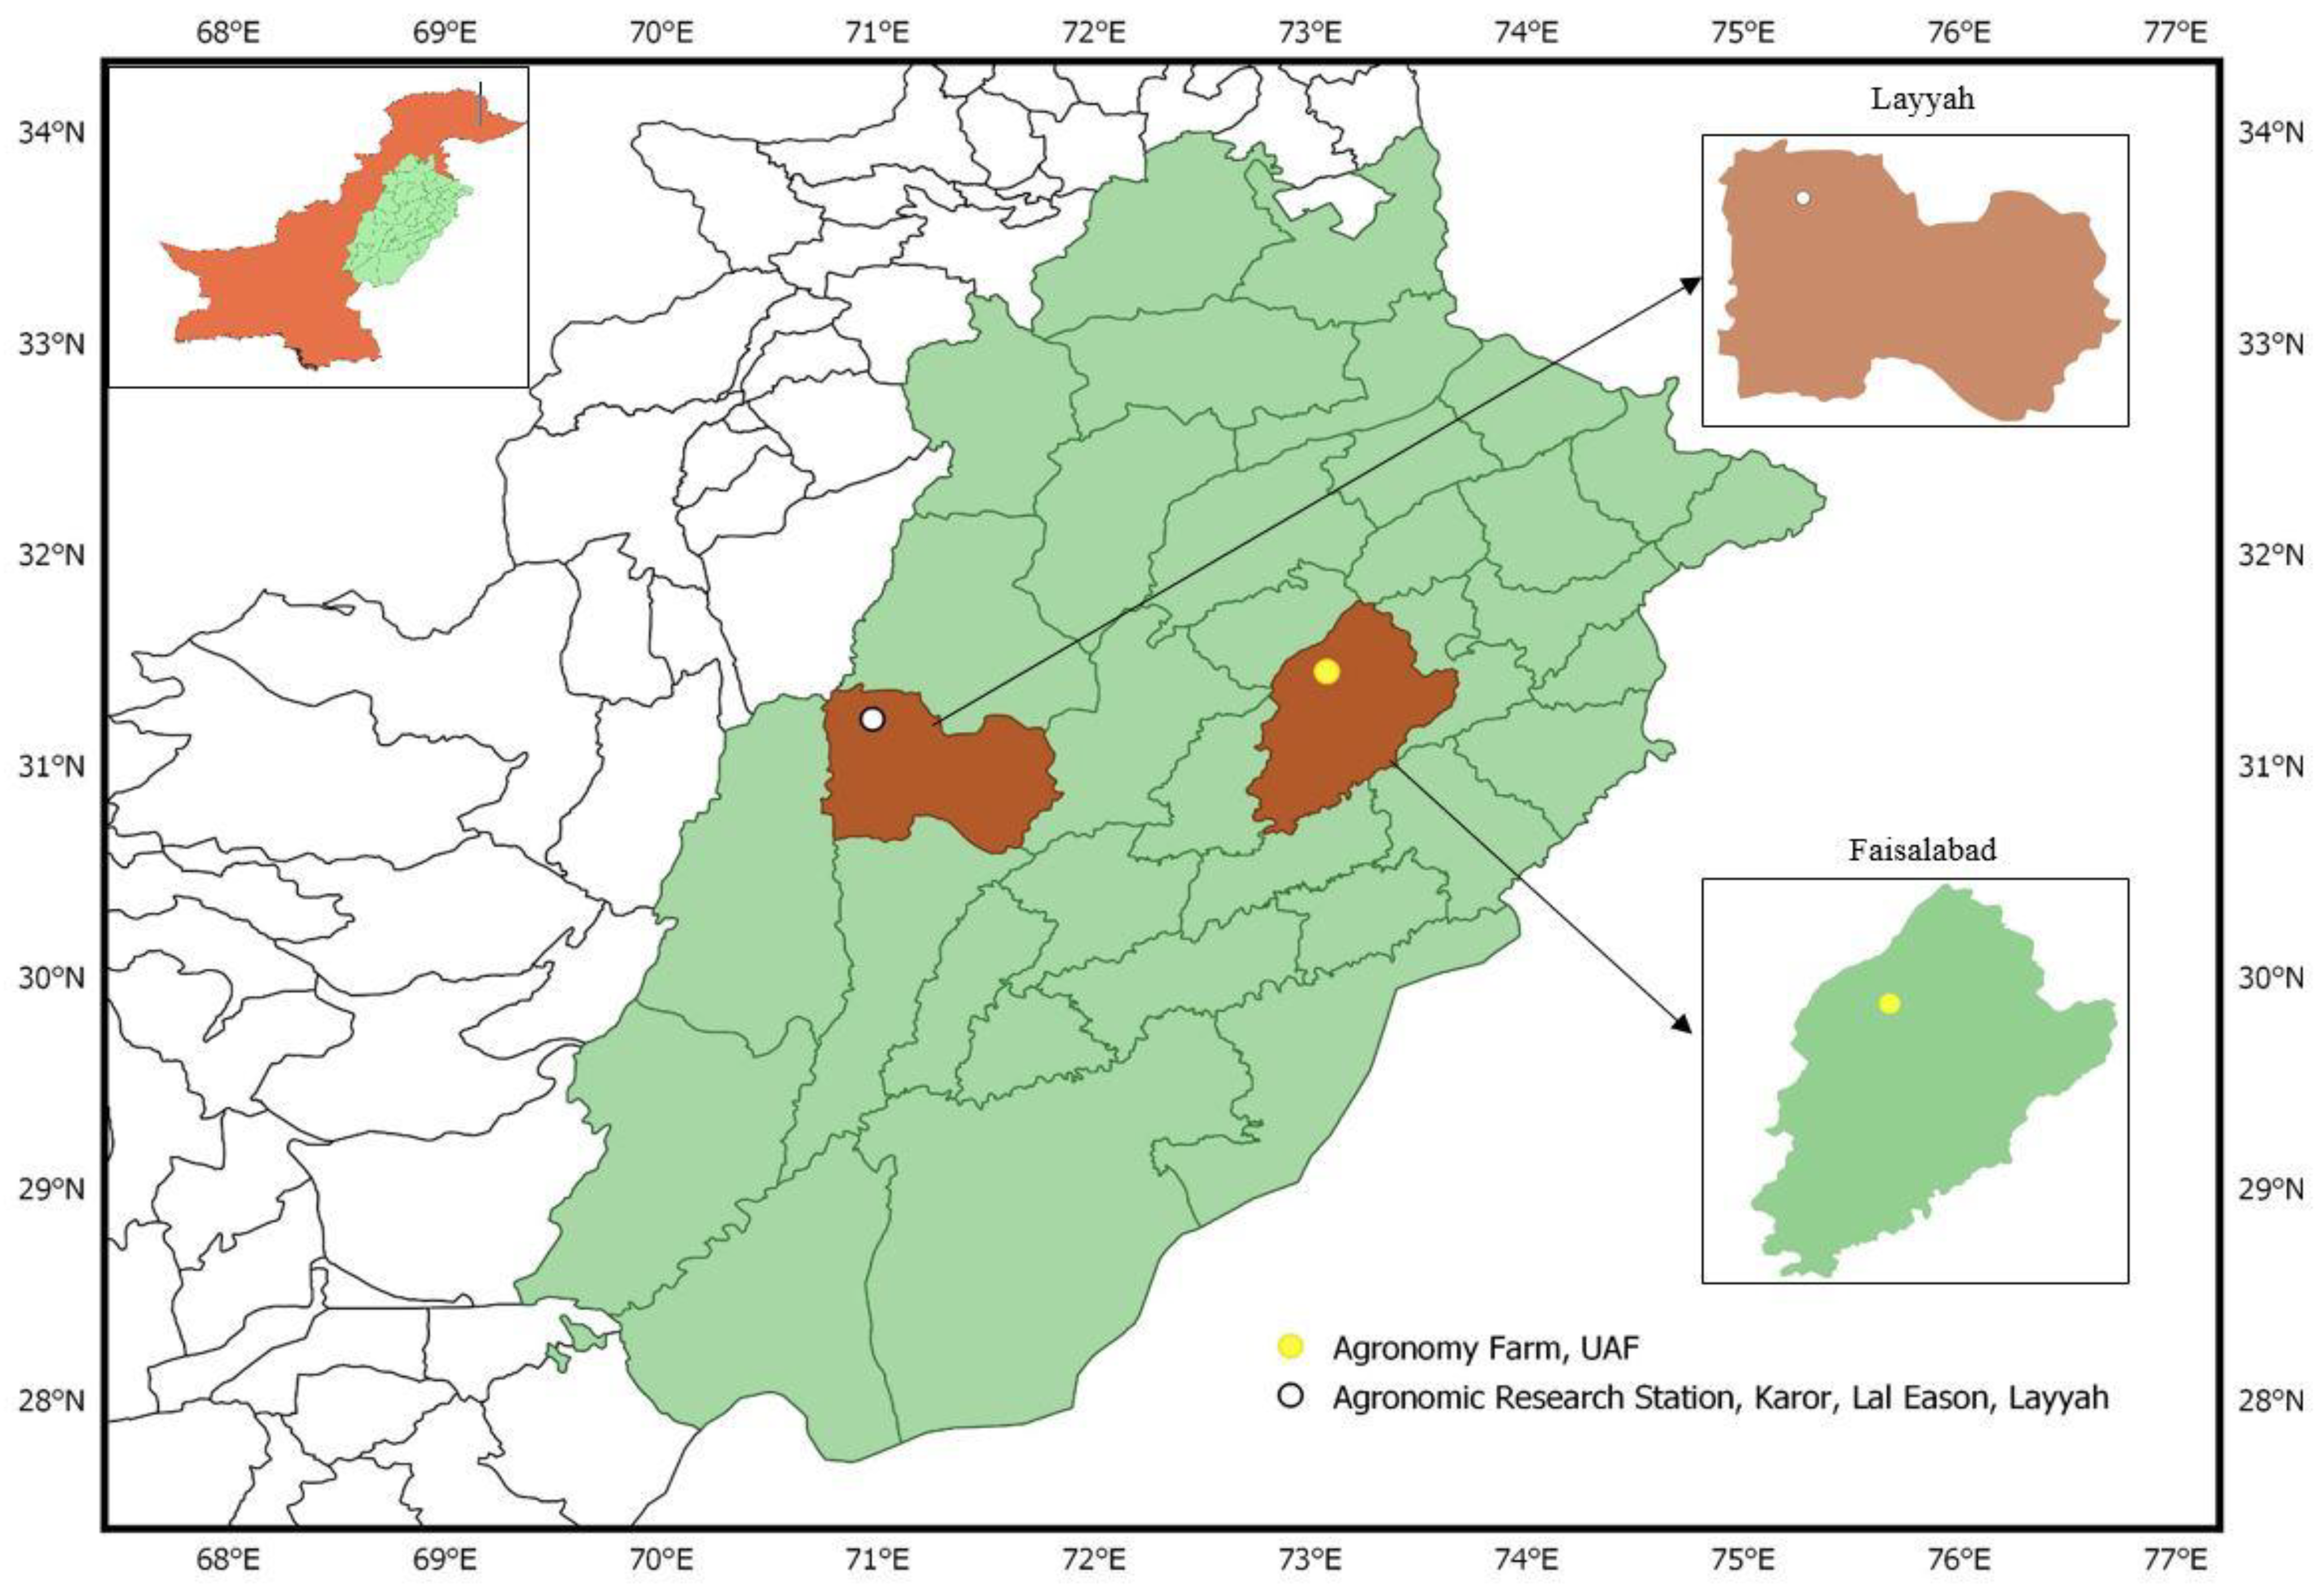
2.1. Experimental Sites and Environmental Conditions

Field trials were conducted during 2013–2014 and 2014–2015 wheat growing seasons in two contrasting environmental regions, one belonging to a semi-arid climatic region (31.4303° N, 73.0672° E) and the other belonging to an arid climatic region (31.1338° N and 70.5761° E) (Figure 1). Mixed cropping is dominant in both study regions. However, the wheat crop is dominant during the winter seasons, while there is winter fodder also grown in both regions for domestic purposes. The study regions, being a semi-arid and arid climate, experienced noticeable changes in air temperature of day and night and even significant fluctuations during wheat crop growing seasons, especially during February to April. Rainfall during this season is also highly variable and did not coincide with the production technology of wheat crops; rainfall either happened during sowing time or during harvest timing, which severely affects cultural practices. Daily weather data during field experimentation and the historical weather data were collected from the Pakistan Meteorological Department (PMD). Weather variables included daily minimum (Tmin), maximum (Tmax) air temperature and precipitation, solar radiation, humidity, and wind speed. Physiochemical soil properties of both study regions are presented in Table 1.

2.2. Experimental and Crop Management Details

The experiment was laid out in a randomized complete block design (RCBD) with a split-plot arrangement having four replications. The experiment consisted of eleven sowing dates from 15 October to 16 March with an interval of 14–16 days in the main-plot, with spring wheat cultivars (Galaxy-2013, Punjab-2011, and Lasani-2008) in sub-plots. The net plot size was 2 × 8 m. The wheat crop was sown on the different sowing dates with the help of a single row hand drill, keeping the R x R distance of 22 cm, using a seed rate of 100 kg ha−1. Nitrogen, phosphorus, and potassium were applied in all plots at the rate of 120, 85, and 60 kg ha−1, respectively, in the form of urea, diammonium phosphate, and sulphate of potash, respectively. There was no application of another chemical. All cultural practices such as weeding and intercultural practices were kept uniform for all the experimental treatments. The crop was irrigated with canal water on the physical appearance of crop and with soil to keep non-stress water conditions. At maturity, ten selected plants were taken from each plot of each replication to measure the plant height, spike length, and spikelets per spike. Collected data were analyzed statistically by employing Fisher’s analysis of variance technique, and differences among treatment means were compared by using Tukey’s multiple range test at a 5% probability level.

2.3. Temperature Calculations

The temperature was calculated to quantify the impacts on wheat morphology. The mean seasonal temperature (MST) of each sowing date was calculated from the average of the maximum and minimum temperature during crop sowing to maturity, and the mean air temperature from heading to maturity was calculated between the heading stage to maturity stage using the following equation.
Mean   Temperature   ( stage   to   stage )   =   [ ( Tmax / Days ) + ( Tmin / Days ) ] / 2
∑ Days = total number of days for the duration between two stages
∑ Temp = total maximum/minimum temperature during two stages

2.4. Climate and Crop Modeling

Historical climatic data (1980–2015) of two environments, Faisalabad and Layyah, were simulated by general circulation models (GCMs) to compare with future simulated data for the duration of 2051–2100. Observed data at Faisalabad were available for the calibration and evaluation of simulated data of GCMs. Historical data for the arid study site (Layyah) were not available, which was produced by following AgMIP (Agricultural Model Inter-comparison and Improvement Project) procedures [22,23].
Future climatic data were simulated using 29 GCMs available around the globe using AgMIP procedures and protocols through R Script [23,24,25]. These future weather data were distributed by a stretched distribution approach among five quadrants of climatic conditions (Hot/Dry, Hot/Wet, Cool/Dry, Cool/Wet, and Middle), as shown in Figure 2. There was variation in the number of GCMs for each quadrant of climatic conditions during the distribution of 29 GCMs based on a change in temperature and rainfall as compared with the baseline. Among different GCMs from each quadrant, the GCM closest to the median value (the A dot in each quadrant shows the median value) of the quadrant was selected for simulation of future weather data to be used as the input data set in the crop model. A well-calibrated and evaluated CERES-wheat model under DSSAT v4.7 was used to simulate the grain yield data with baseline climate data and future climate data [8].
Calibration was the first process of simulation to adjust the parameters of models to the local conditions. It was also necessary to find the genetic coefficients of the three wheat cultivars grown in the region. Soil parameters of CERES-wheat were also adjusted to parameterize the model. The genetic coefficient of cultivars (Lasani-2008, Punjab-2011, and Galaxy-2013) was obtained by calibrating the CERES-wheat with optimum planting date of 15 November 2013. General characteristics of wheat cultivars are mentioned in Table 2. Overall calibration performance of CERES-wheat was reliable for all parameters (days to anthesis, days to maturity, grain yield, biomass, and leaf area index). First, days to anthesis for cultivar Lasani-2008 were close to observations with a percent difference (PD) of −3.85%, whereas, days to anthesis of cultivars Punjab-2011 and Galaxy-2013 were matched to observations. Days to maturity of cultivars Lasani-2008, Punjab-2011, and Galaxy-2013 were simulated with the PDs of −2.05%, 1.41%, and 2.10% respectively. While in the case of grain yield, maximum PD was calculated at 3.58%, and the minimum difference was observed in Galaxy-2013 (−1.28), while the model underestimated the grain yield of Punjab-2011 −2.42%). Biomass was also well predicted with PDs −3.75%, −1.31%, and −2.89% of cultivars Lasani-2008, Punjab-2011, and Galaxy-2013, respectively, with the observed data. Maximum LAI was underestimated by CERES-wheat for Lasani-2008 (−5.88) but overestimated for Punjab-2011 (2%) and Galaxy-2013 (3.92%). Generally, the model performed reasonably well during calibration and evaluation for all studied parameters.

3. Results

3.1. Current Weather Conditions during the Experimental PERIOD

With regard to the climate of the study area, Faisalabad (semi-arid) and Layyah (arid climate) have dry, hot, and humid summers and dry, cold winters. The temperature remains lower from October to February while being higher from March to September. The minimum temperature for November 2014 was higher (19.3 °C) as compared with November 2013 (12.1 °C); likewise, the maximum temperature was also higher during November 2014 as compared with November 2013 at Faisalabad. December 2013 was 2–3 °C hotter in terms of minimum temperature, while the maximum temperature was the same at the start of December. Minimum temperatures were 3.4 °C and 5.9 °C during January 2014 and January 2015, respectively. During the last fifteen days of February, the minimum temperature of 2015 was 4 °C higher than in 2014, but in terms of maximum temperature, the difference was only about 10 °C. The mean monthly temperature of March was 17.5 °C. The minimum temperature ranged from 17 to 19 °C, while the maximum temperature ranged from 26 to 29 °C, with a cold to hot trend from the start to the end of April during both years. At the end of January 2015, there was a first rainfall of 12 mm. There was 60 mm rainfall during March 2014 and 19.30 mm during March 2015. There was 29.35 mm rainfall during March 2015. The month of April got more rainfall in 2014 (33 mm) as compared with 2015 (28.5 mm) at Faisalabad (Semi-arid).
In the arid region (Layyah), the maximum average air temperature ranged from 24 to 26.5 °C for November 2013, and the minimum temperature ranged from 10.2 to 11.9 °C during 2014. The difference in mean temperature was about 4 °C between the first and second half of December. The minimum average temperature of two years during January was 4.5 °C, while the maximum temperature was 18 °C. February was hotter than January during the last two weeks. The minimum temperature was higher during the last fifteen days of February 2014 (5.3 °C) as compared with 2015 values (9.4 °C), and the maximum temperature ranged between 20 and 23 °C. In March, April, and May during both years, an increasing trend of temperature was observed with mean maximum temperatures of 28 °C, 33 °C, and 35.5 °C, respectively. Rainfall in both seasons was nominal from October to January. In February, both years got rainfall of 24 mm and 12 mm during 2014 and 2015, respectively. The first half of March 2015 received 59 mm rainfall, while 10.5 mm rainfall was recorded during 2014. Rainfall was doubled during 2015 (26 mm) as compared with 2014 during the last two weeks of March; likewise, the rainfall during the first fifteen days of April was 40 mm and 76 mm during 2014 and 2015, respectively.

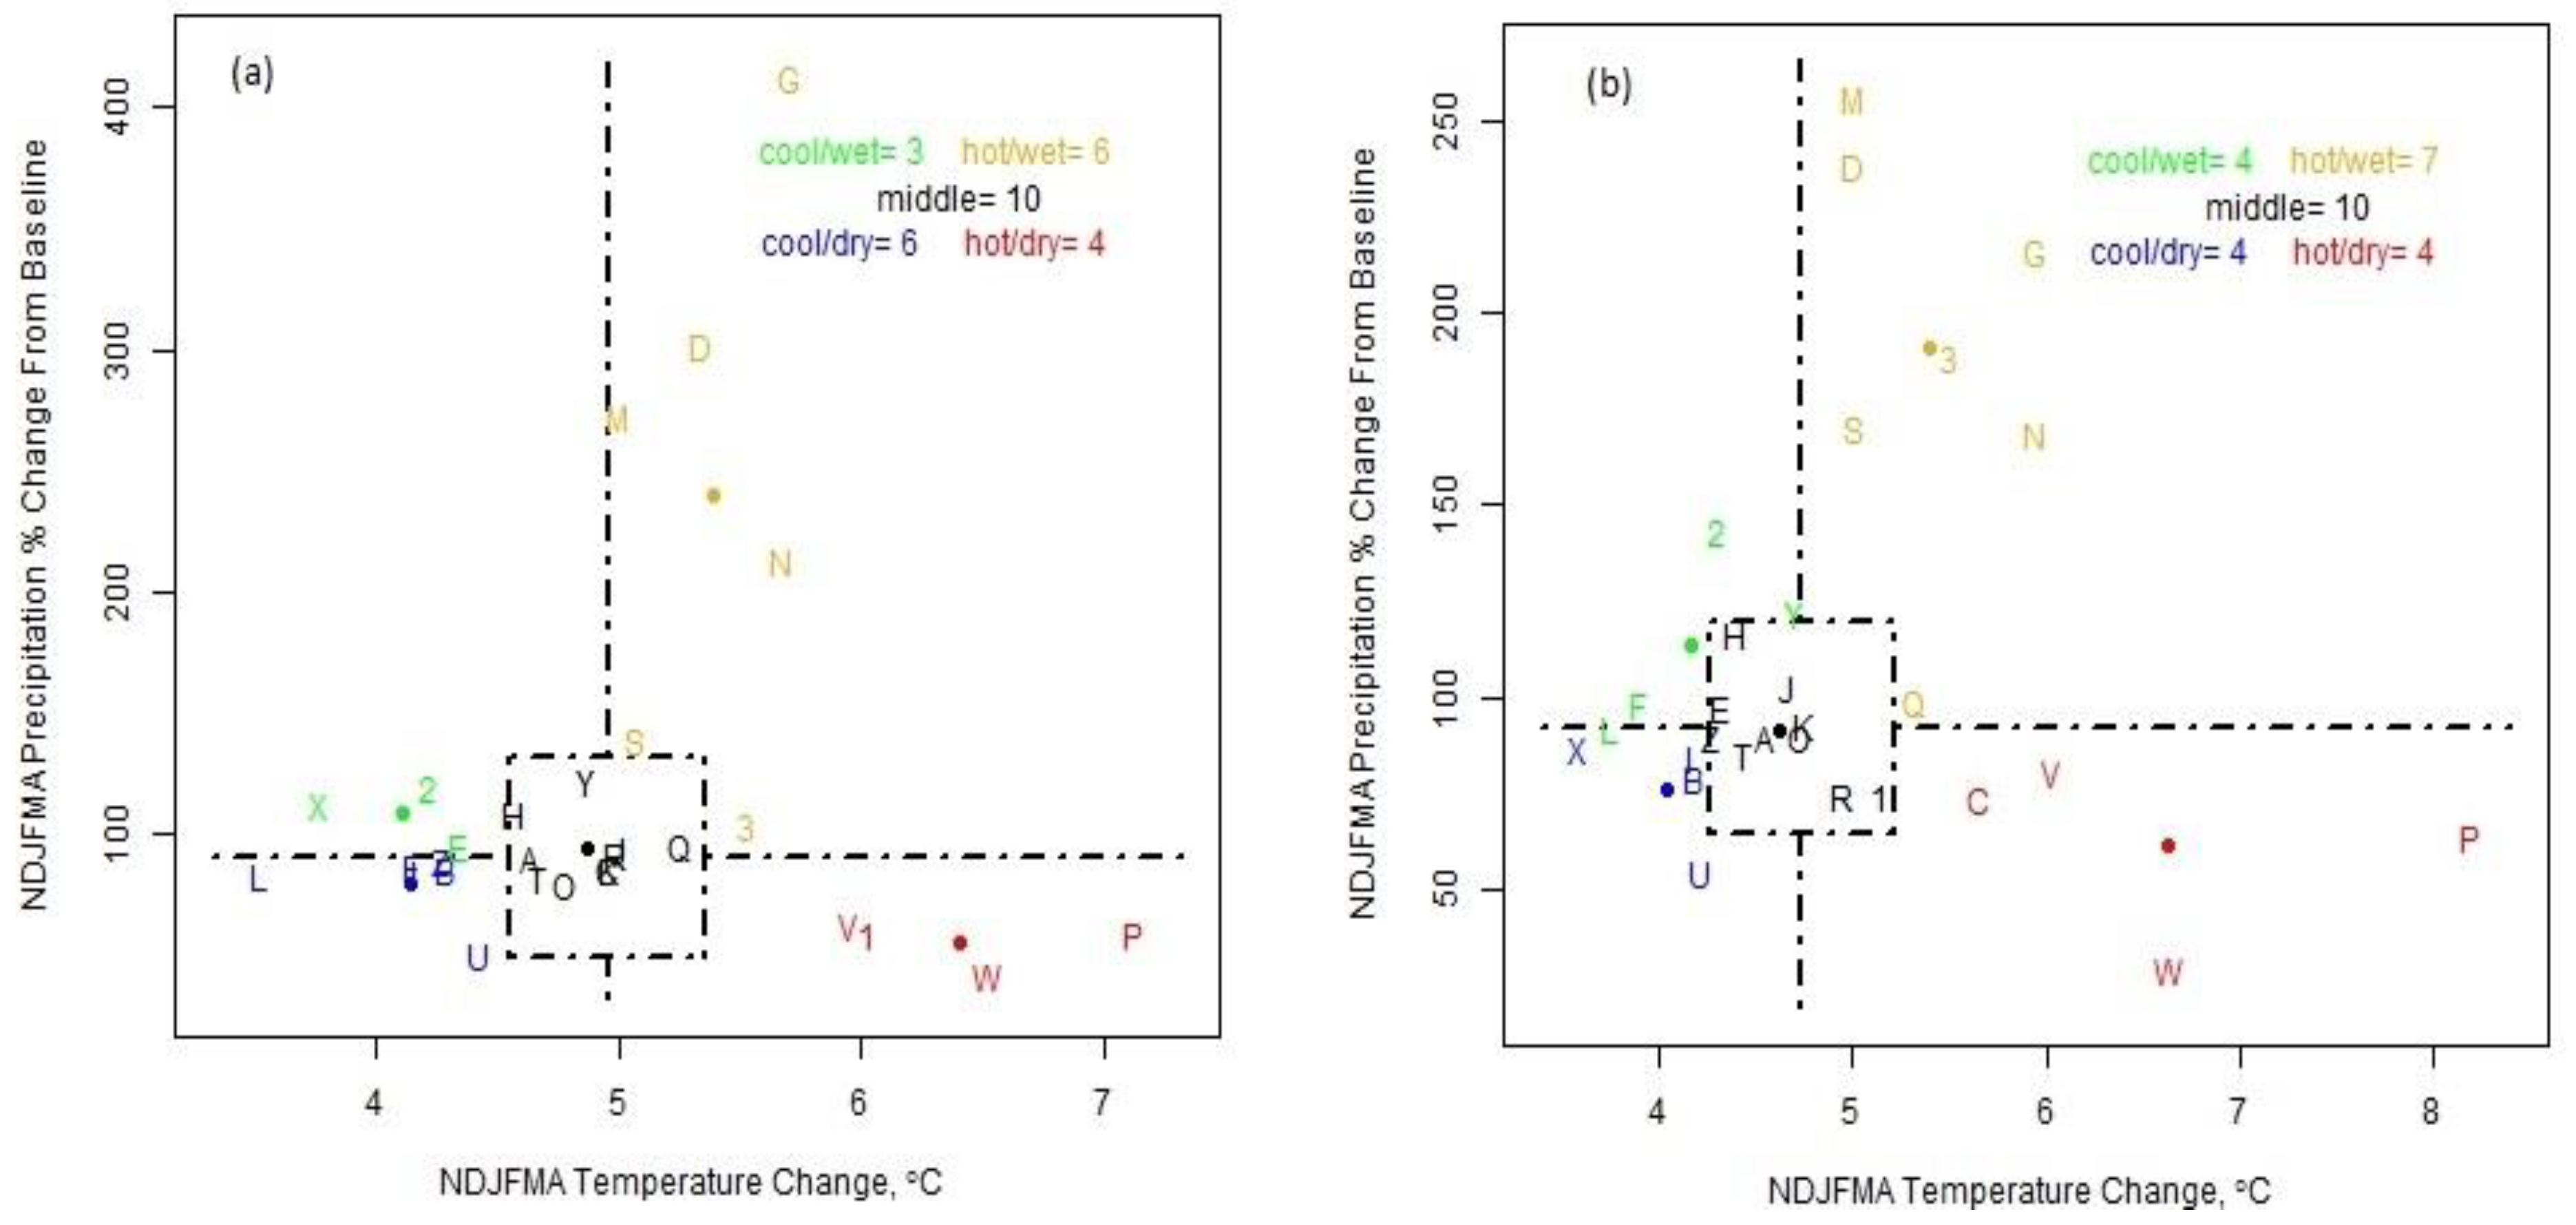
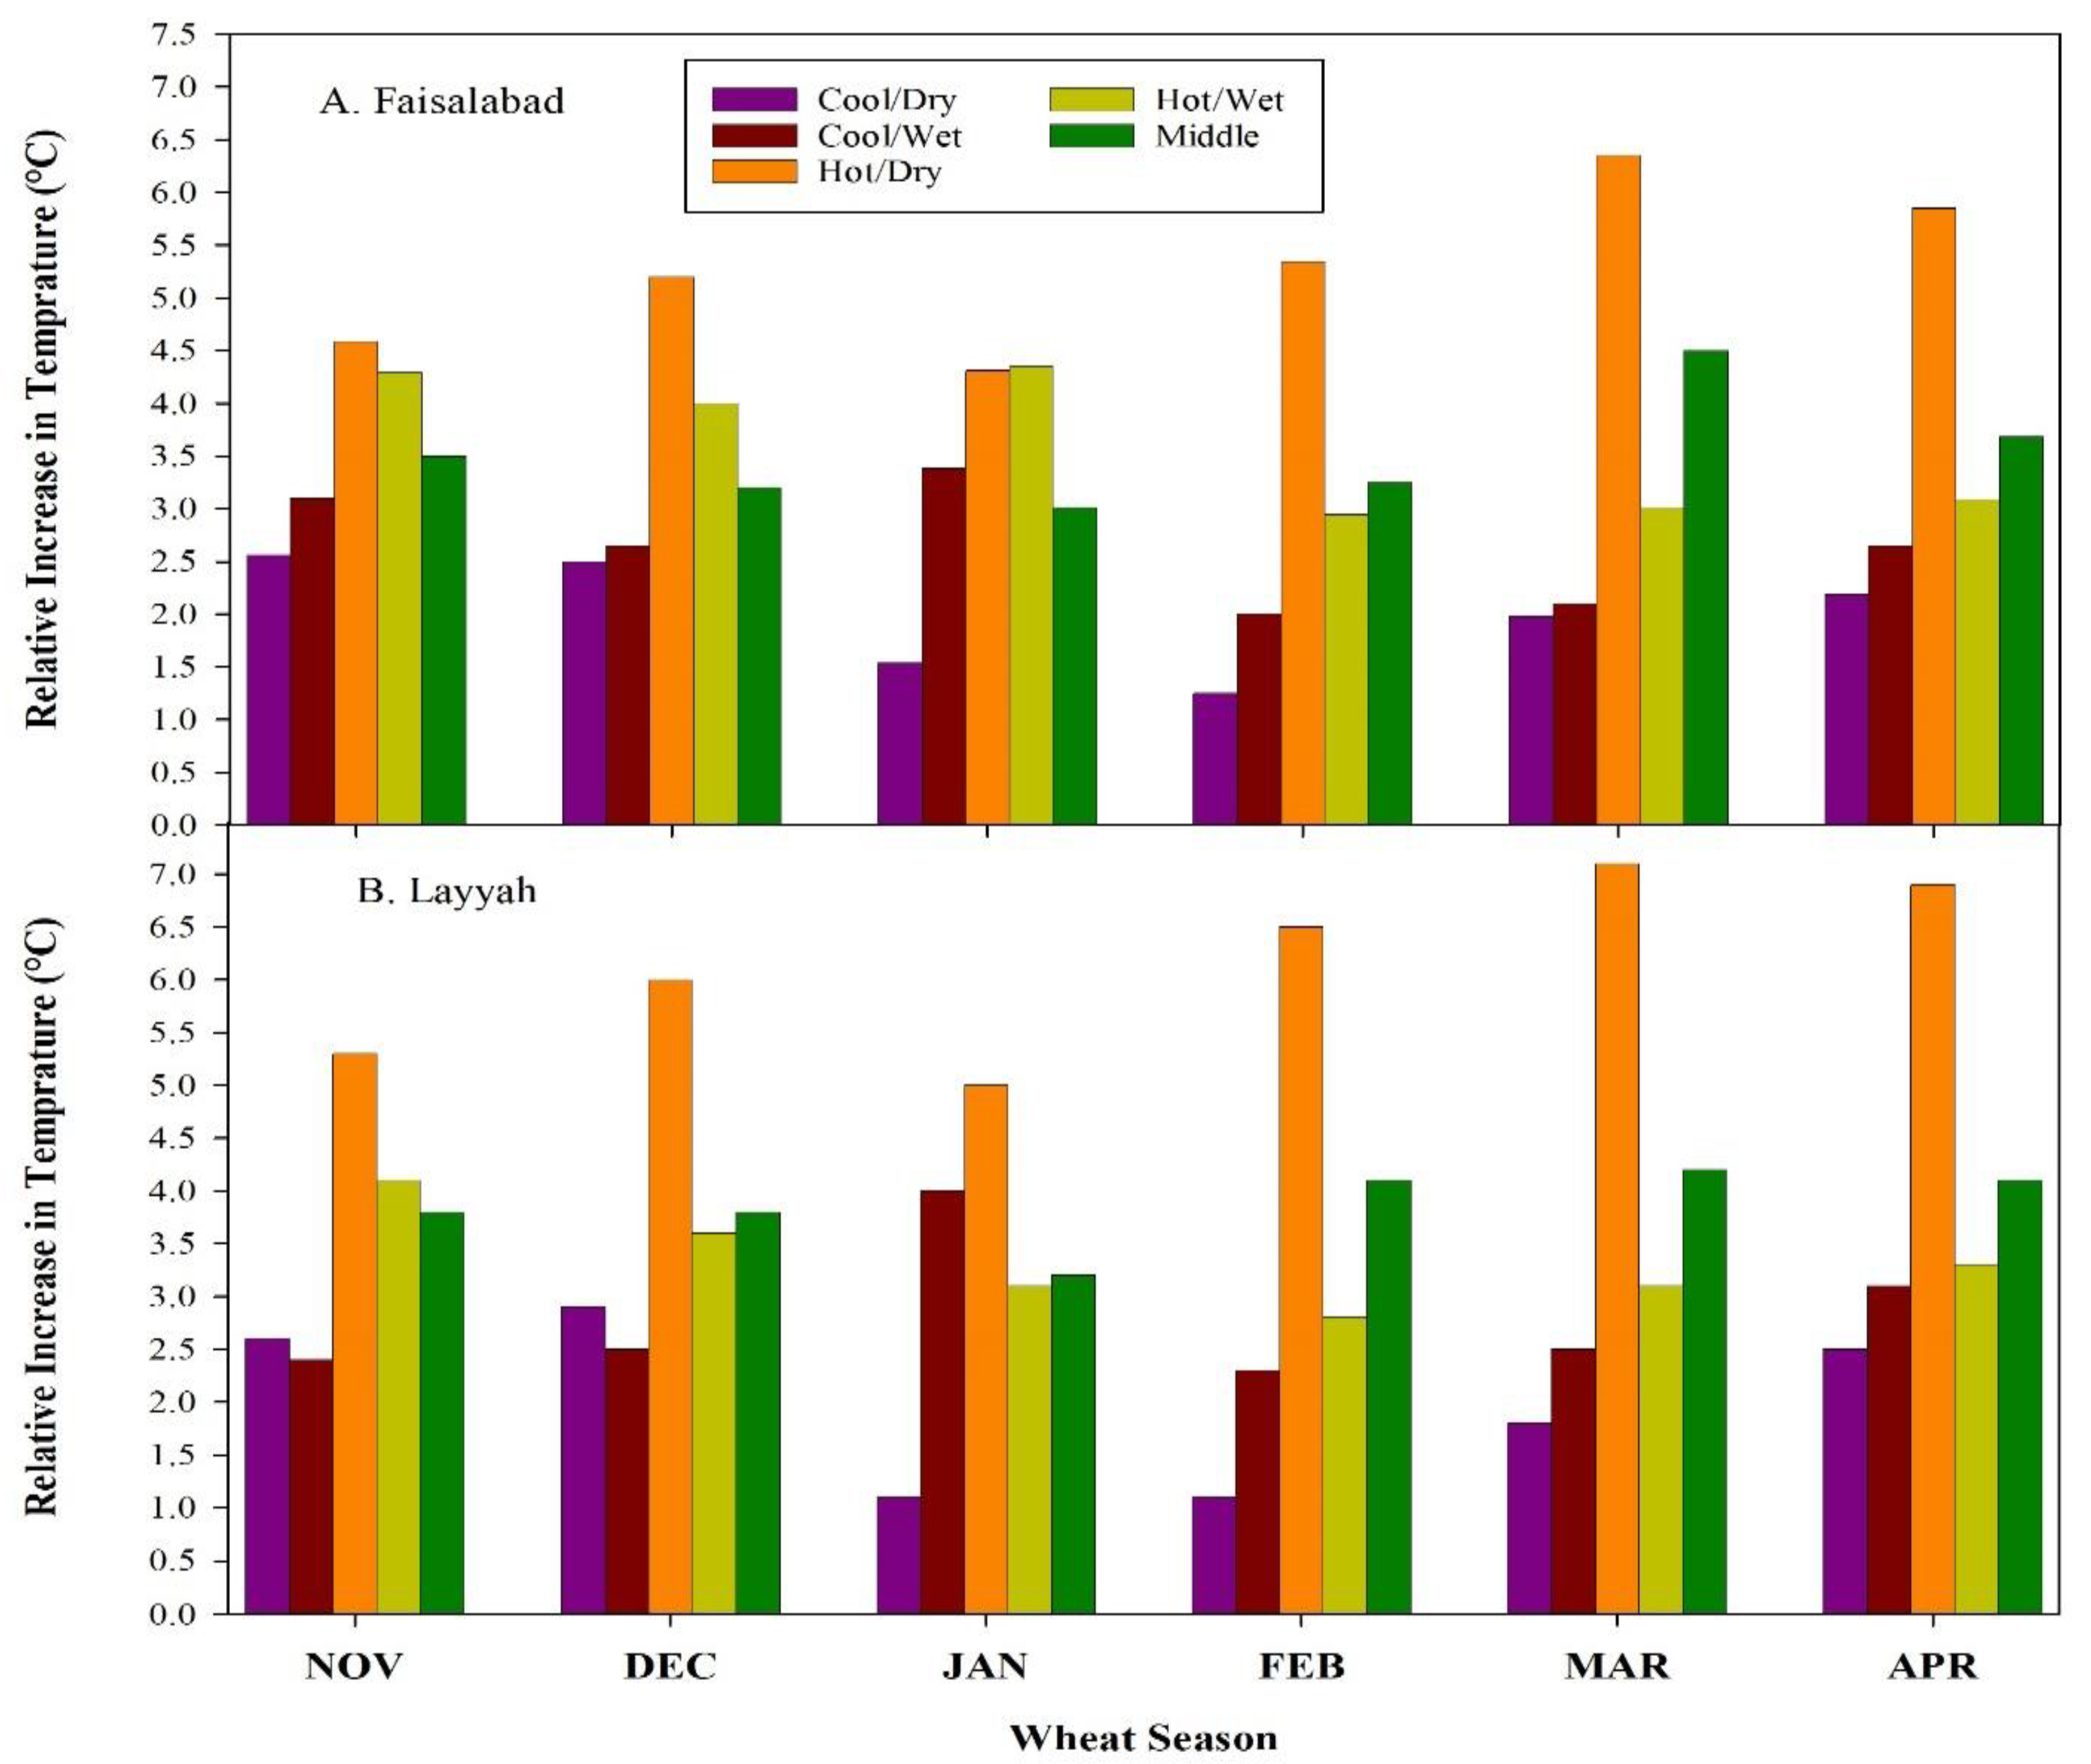
3.2. Future Climatic Conditions

Capital letters in different quadrants (Figure 2) represent the 29 GCMs based on changes in precipitation and temperature from baseline. Hot/Wet, Cool/Wet, Cool/Dry, Hot/Dry, and Middle climatic scenarios were predicted by the six, three, six, four, and ten GCMs respectively for Layyah. A maximum of ten GCMs predicted that Middle climatic conditions would prevail in the future while the minimum of the three models agreed on chances of Cool/Wet climatic conditions. For Faisalabad, ten GCMs predicted the chances of Middle climatic conditions followed by Hot/Wet (7 GCMs), while Cool/Wet, Cool/Dry, and Hot/Dry conditions were predicted by four GCMs. Figure 3A shows a relative increase in the average temperature of the future (2051–2100) from baseline (1980–2015) for Faisalabad under representative concentration pathway (RCP) 8.5. There would be a minimum rise in the average temperature in January (1.54 °C) under Cool/Dry climatic conditions, while the maximum increase in March could be (6.35 °C) under Hot/Dry climatic conditions. The Middle climatic conditions, which are the most probable to happen, would have maximum and minimum temperatures during January (1.54 °C) and March (6.35 °C), respectively. The seasonal rise of temperature under Middle climatic conditions could be 3.52 °C during 2051–2100. The average rise under all climatic conditions would be 3.4 °C in Faisalabad (semi-arid).
At Layyah (Figure 3B), there may be a minimum increase in the average temperature of February (1 °C) under the Cool/Dry scenario, while the maximum rise in March (7 °C) could be under the Hot/Dry climatic scenario during 2051–2100. January (3.25 °C) and March (4.2 °C) would have the minimum and maximum temperature, respectively, if the possible Middle climatic conditions prevail in the future. April could be colder than March under Hot/Wet, Hot/Dry, and Middle climatic conditions. The wheat season of Layyah could be 3.62 °C according to an average of all plausible climatic conditions. Overall, Layyah (arid region) could be hotter than Faisalabad (semi-arid) in the future.

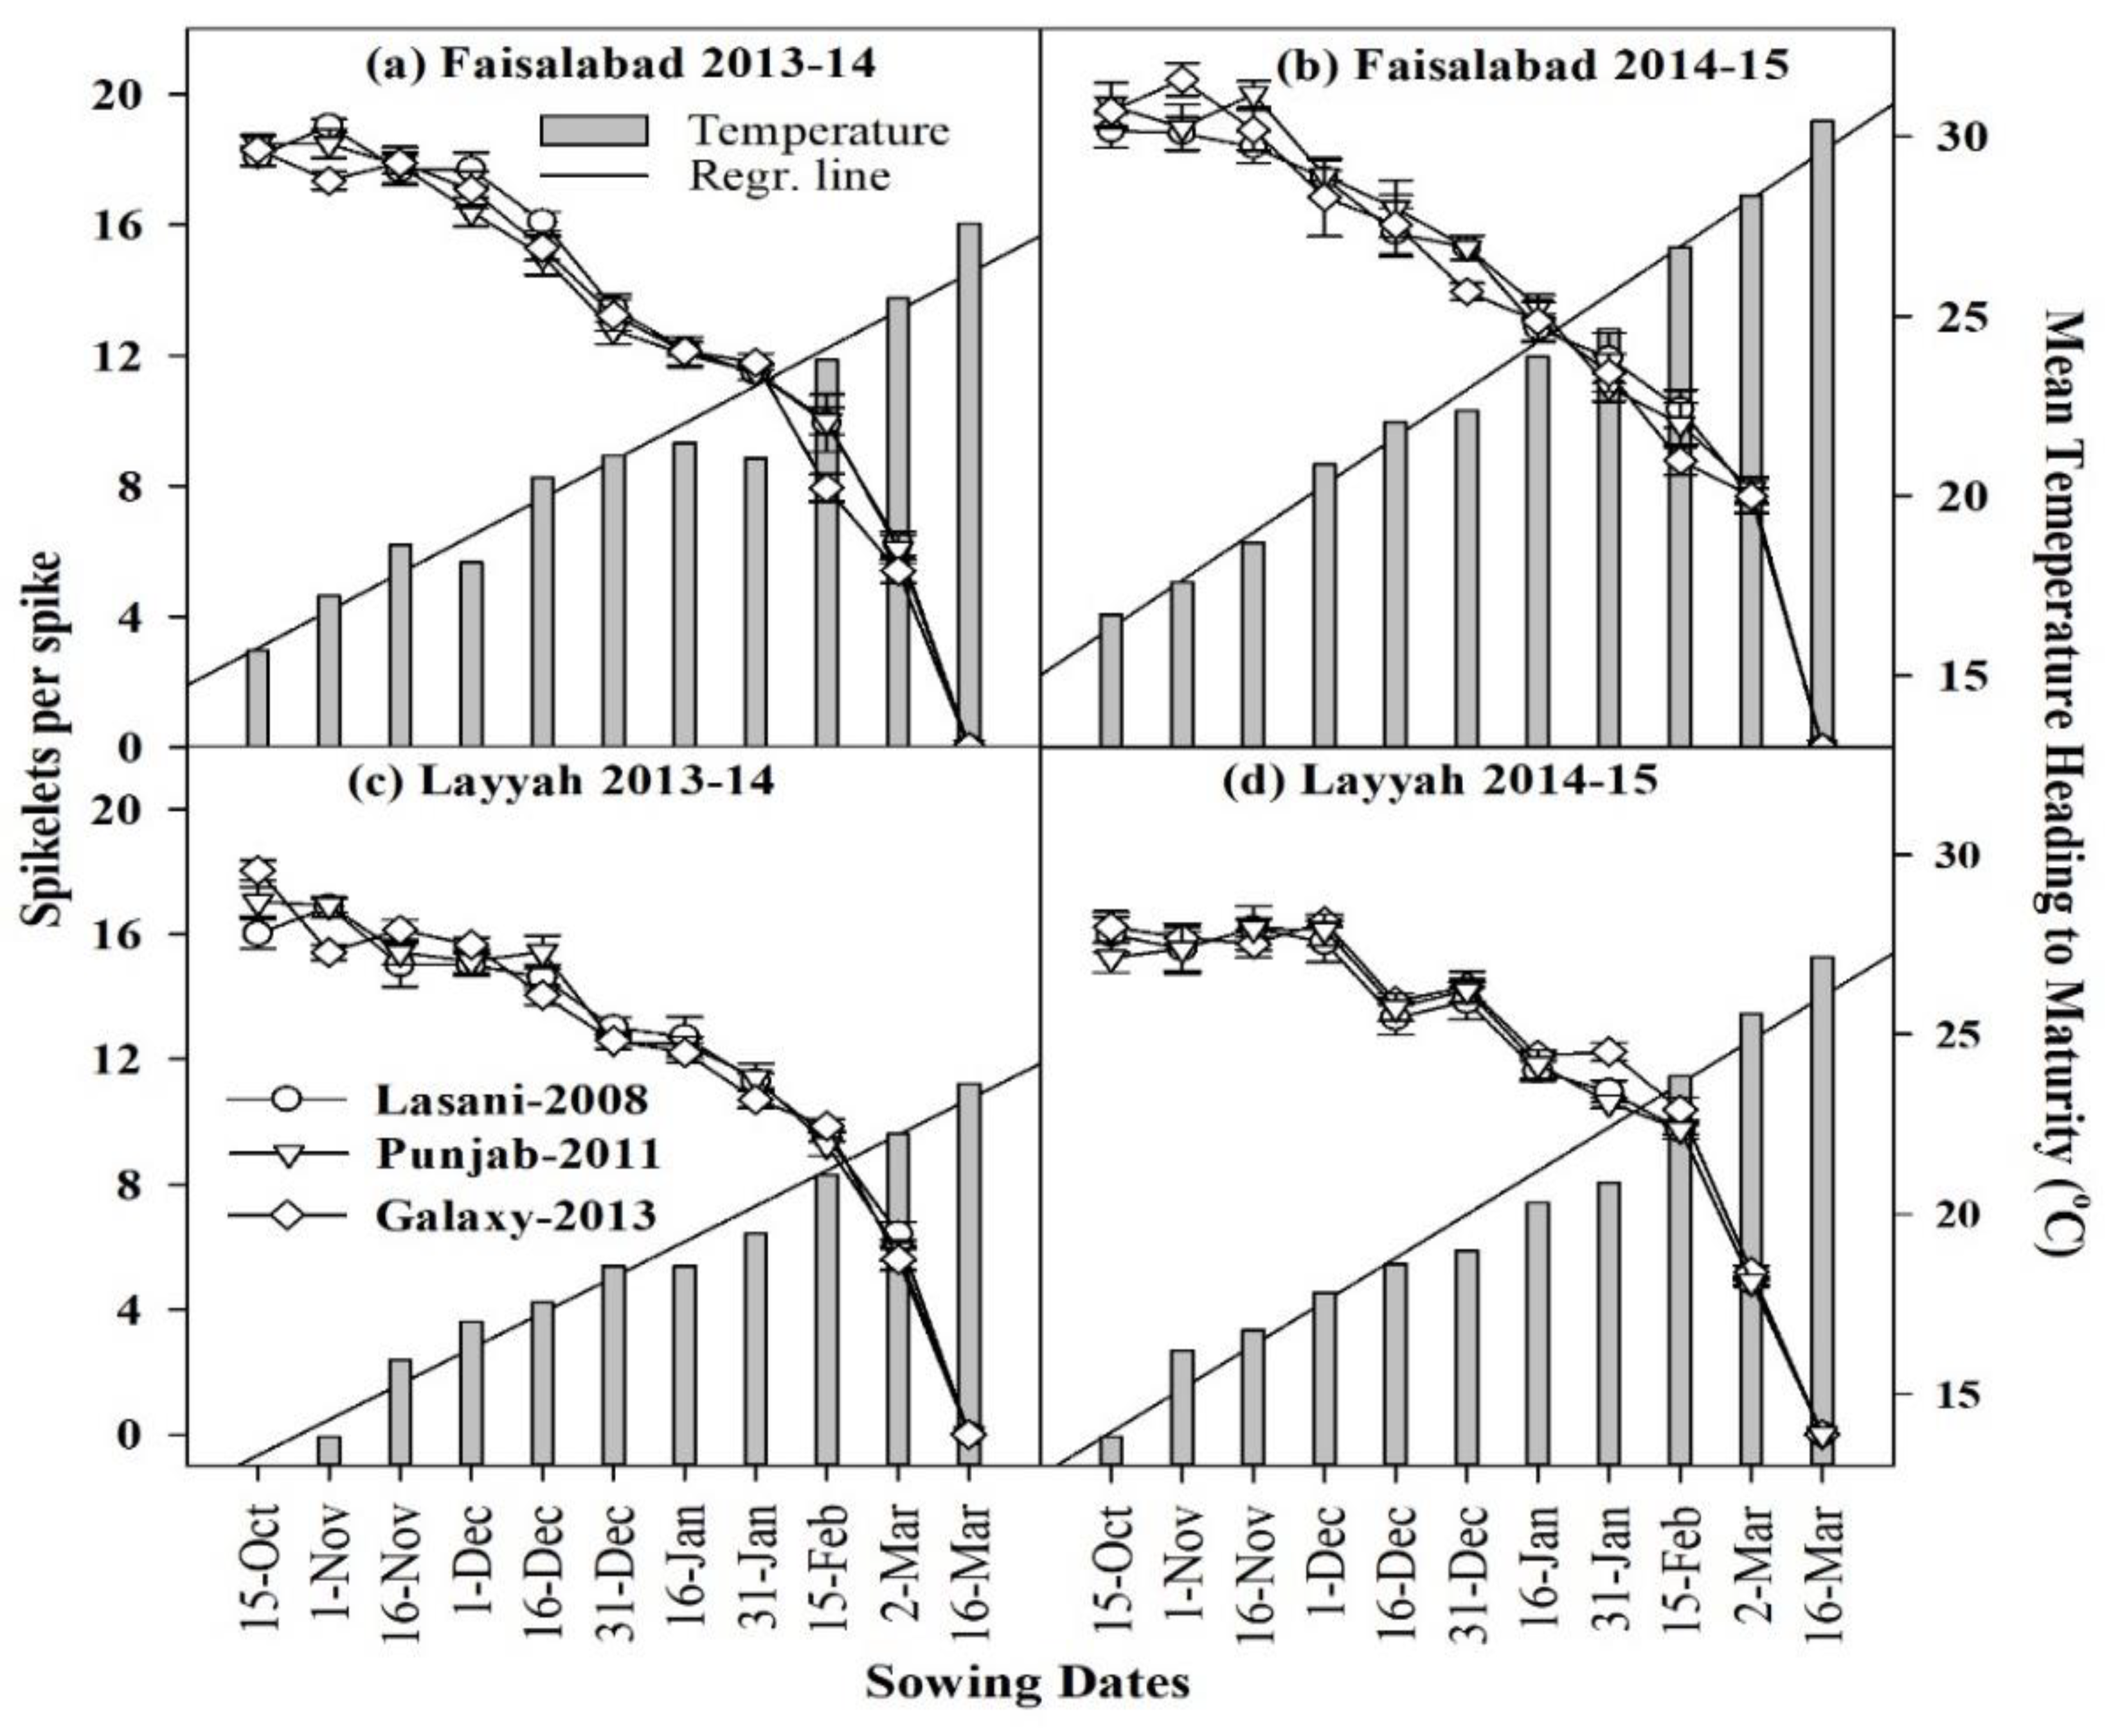
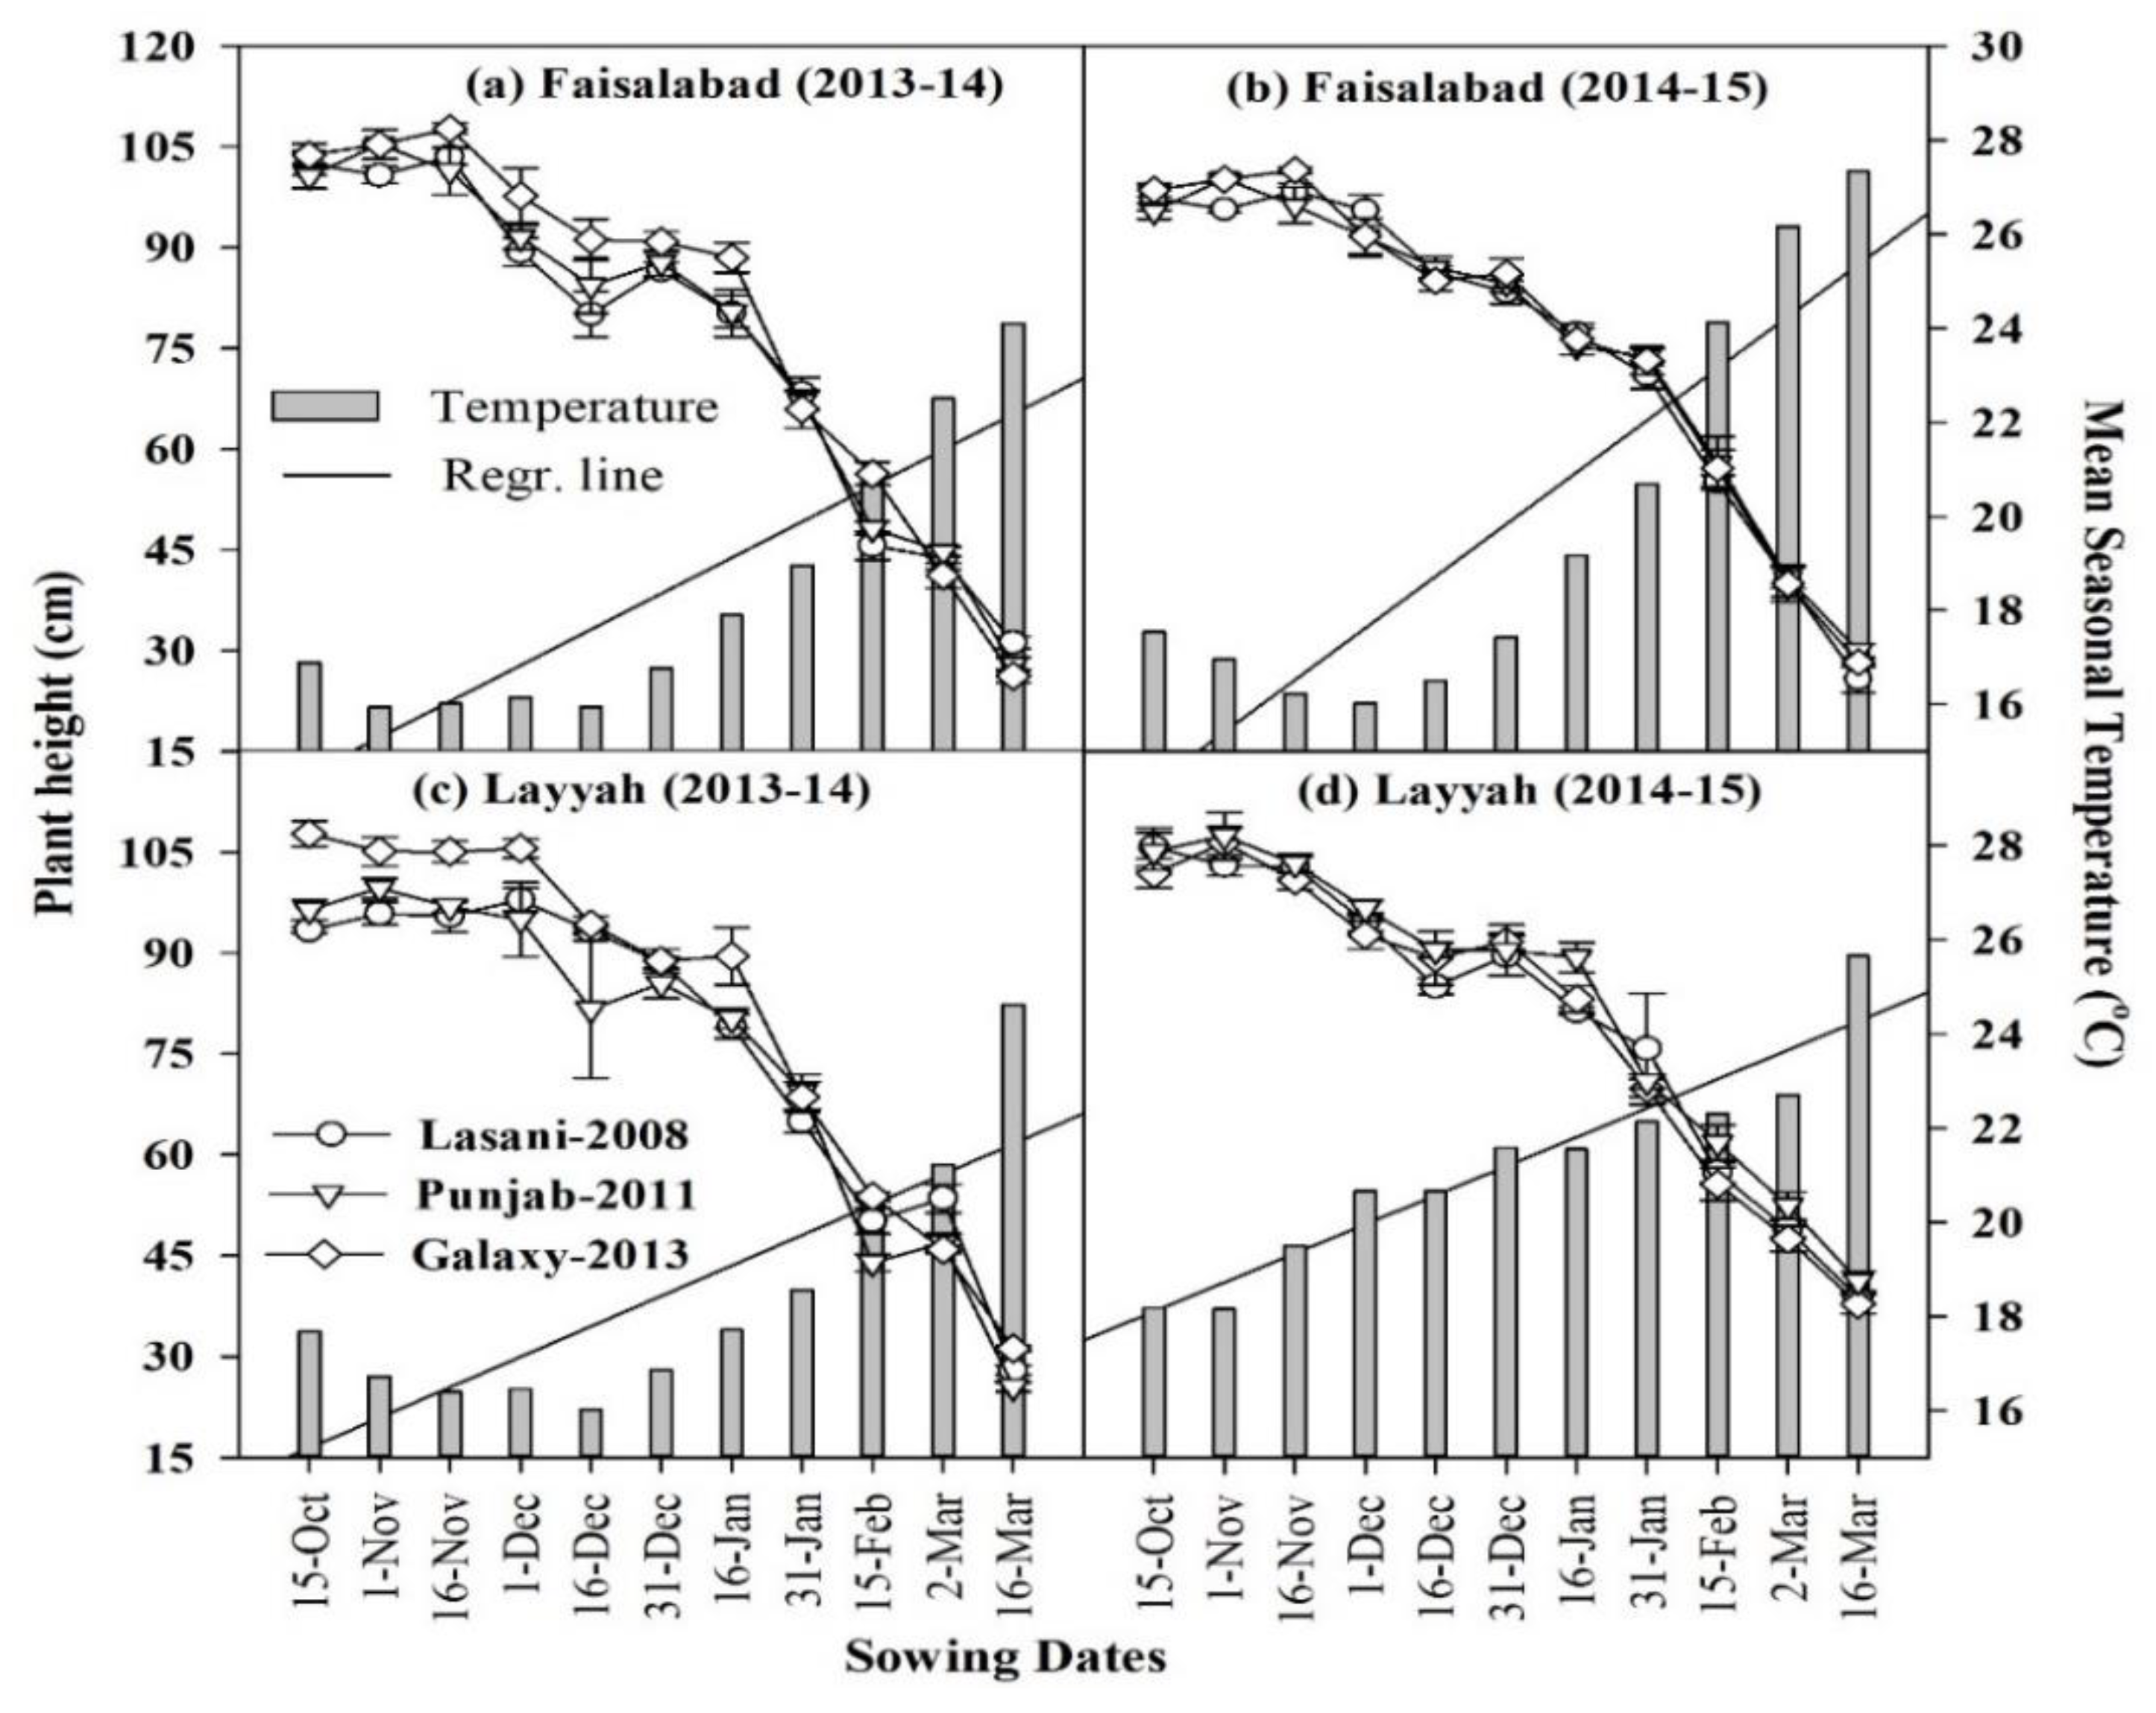
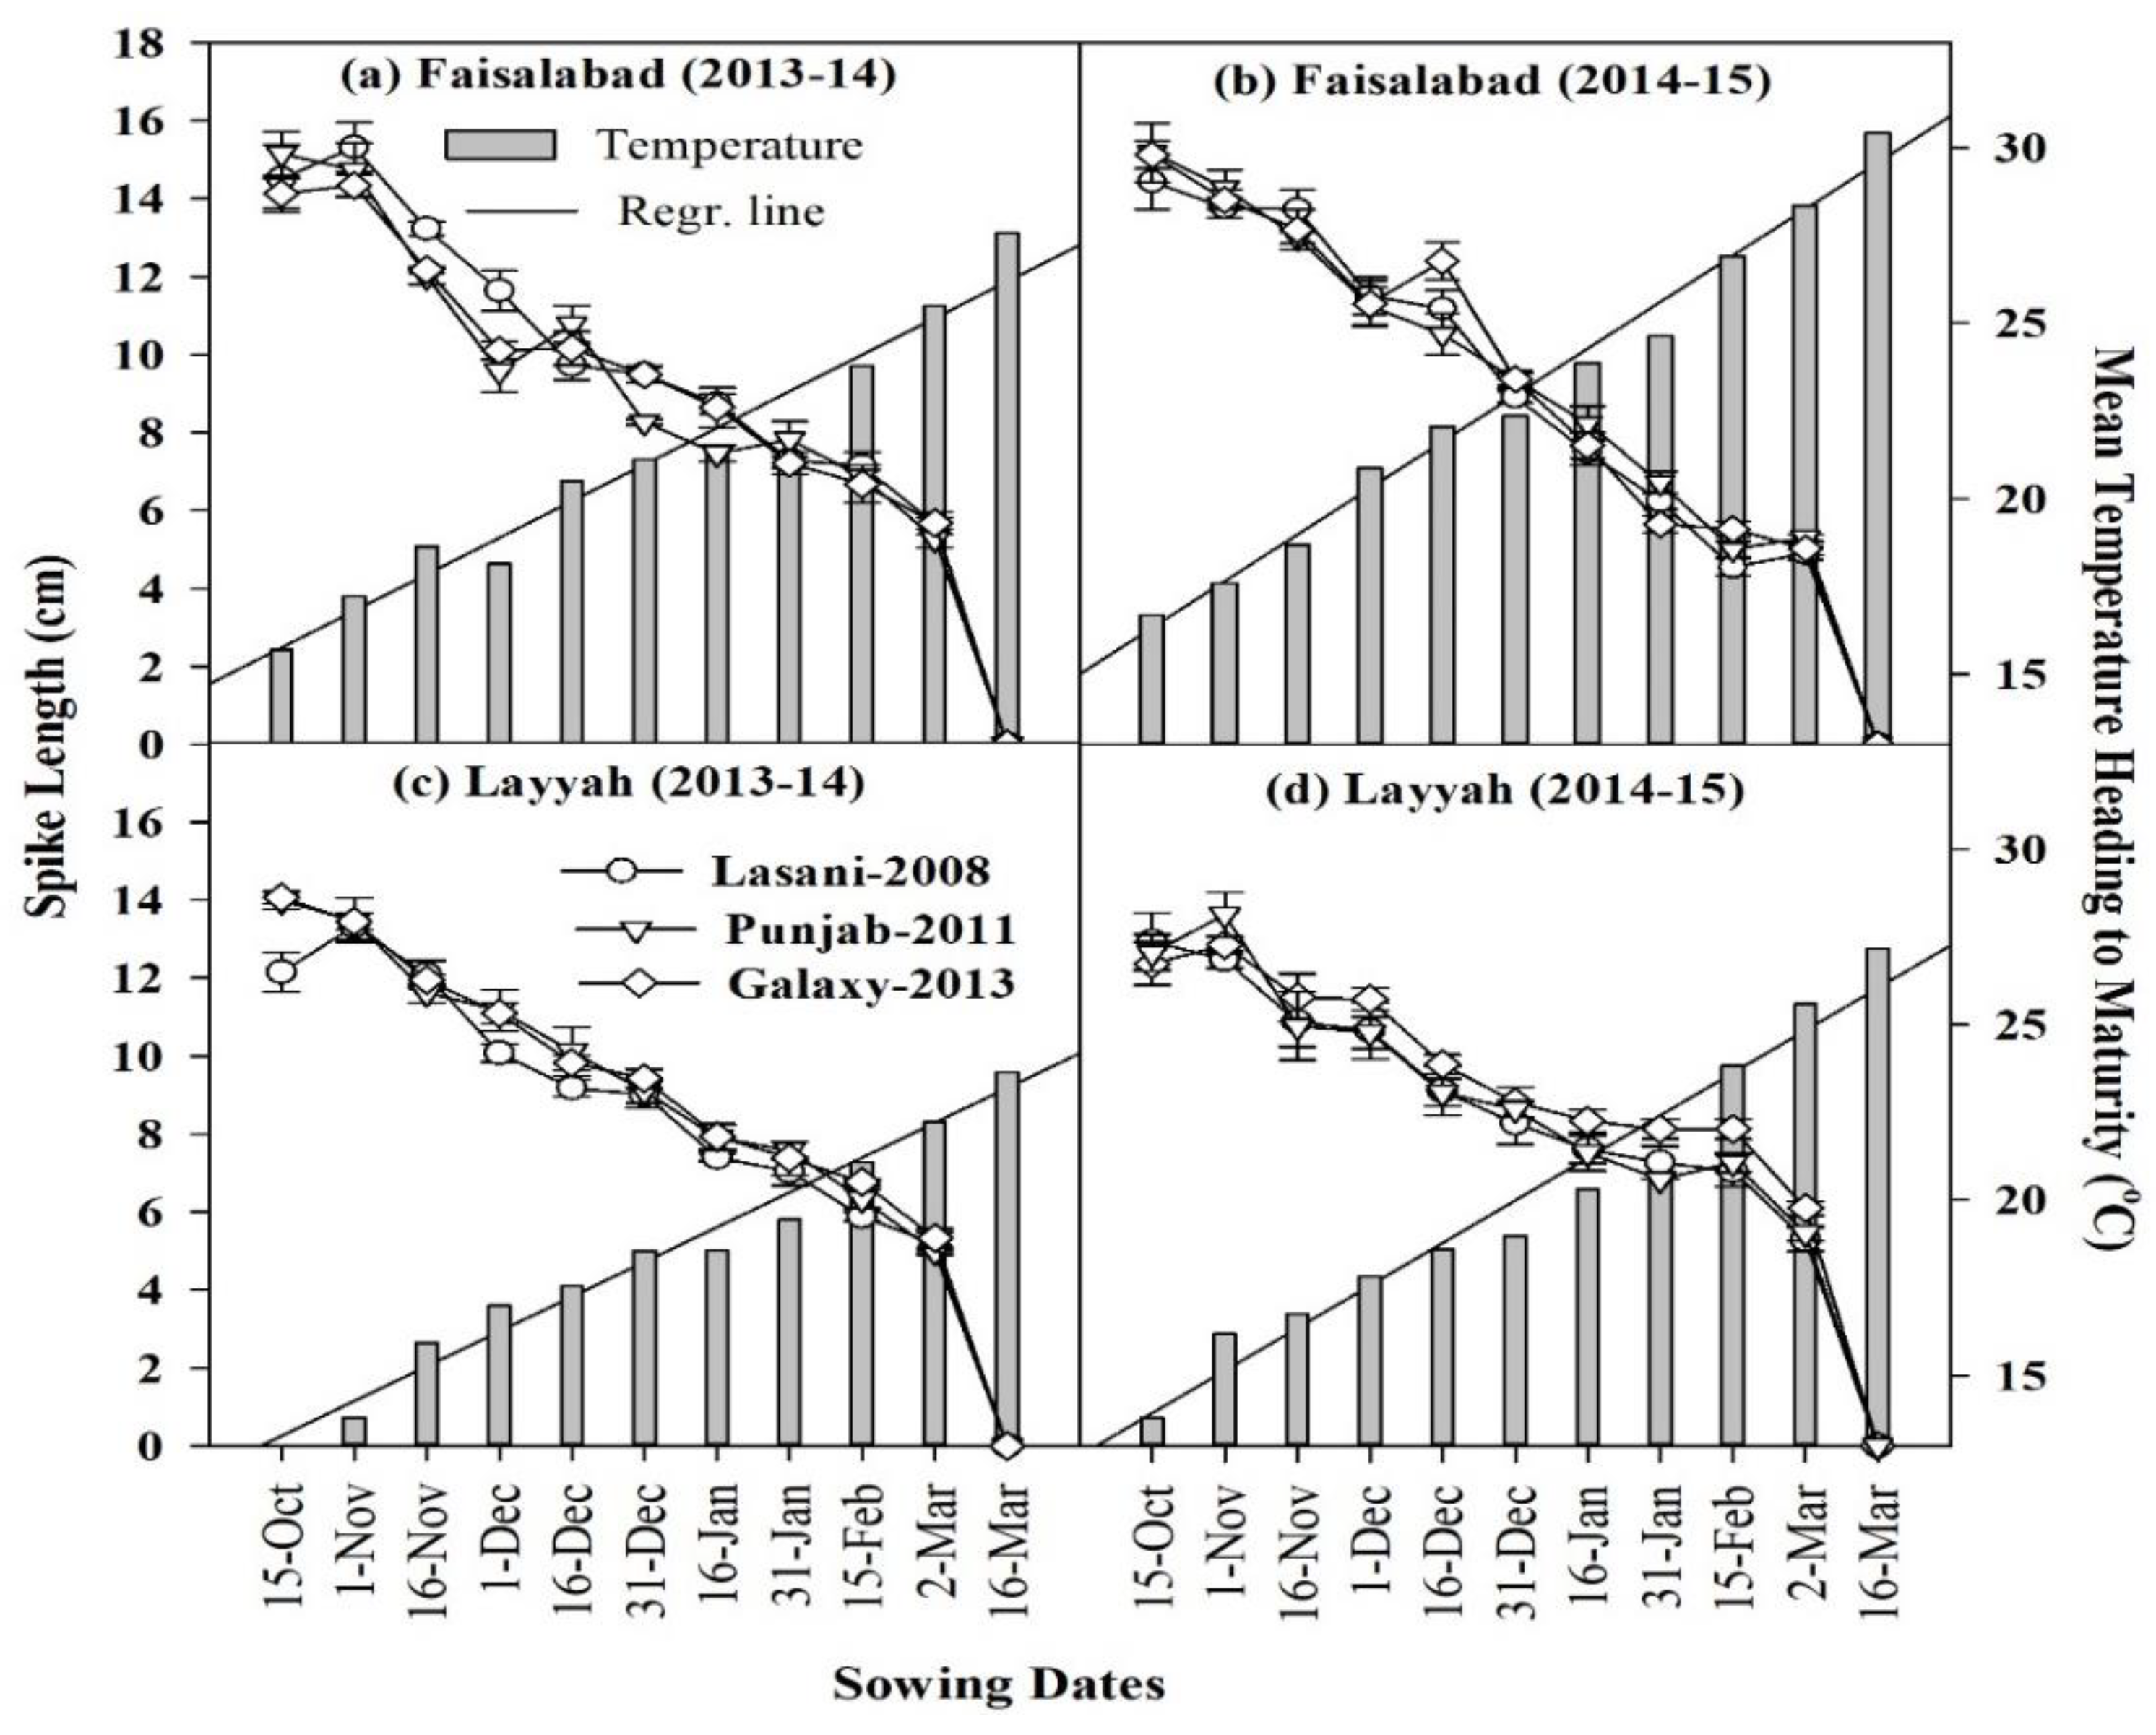
3.3. High Temperature and Wheat Morphology

Increasing temperature severely affects wheat morphology. Plant height (Figure 4) was significantly different from changes in environments, cultivars, and sowing dates but non-significant between locations (Table 3). Among different wheat sowing dates, wheat sown on 16 November was the tallest (102.8 cm) under MST (17.5 °C) and shortest sown on 15 March (28.06 cm) with MST 27.18 °C. Among different cultivars, Galaxy-2013 was the tallest (78.92 cm), followed by Punjab-2011 (75.33 cm) and Lasani-2008 (74.43 cm). The interactive effects of Environment (E) × Plant date (PD), Location (L) × Planting date (PD), E × L × PD, PD × Genotypes (G), and E × L on plant height were significant. However, plant height interaction for E × PD, E × G, L ×G, E × L × G, and E × PD × G were non-significant.
The results depict that the maximum spike length (8.85 cm) was observed during 2013–2014, while the minimum from the environment occurred in 2014–2015 (8.52 cm), as given in Figure 5. Sowing dates also affected spike length significantly. The spike of 1 November sowing and 1 March were the lengthiest (13.54 cm) and shortest (5.48 cm) under MTHM 16.23 °C and 25.41 °C, respectively. No spike was produced from 15 March sowing with MTHM 27.2 °C. Table 4 shows the relationship strength between temperature and spike length. The interactive effect of E × L, E × PD, E × G, L × G, E × L × G, and E × PD × G on grains per spike depicted significant differences.
The maximum spikelets per spike were recorded during the environment 2013–2014 (12.26), while the minimum was observed during 2014–2015 (11.77) (Figure 6 and Table 3). The results for sowing dates depicted maximum spikelets per spike for 15 October sowing (16.75) and minimum (5.46) for 1 March sowing. Slope and R2 were the slopes of fitted lines, and coefficients of determination between wheat spikelets per spike and temperature are given in Table 4. The interactive effect of E × L, E × PD, L × PD, E × L × PD, E × G, and E × PD × G on spikelets per spike depicted significant differences (Table 3). However, on spikelets per spike L × G, E × L × G, PD × G, L × PD × G, and E × L × PD × G interactions were not statistically significant.

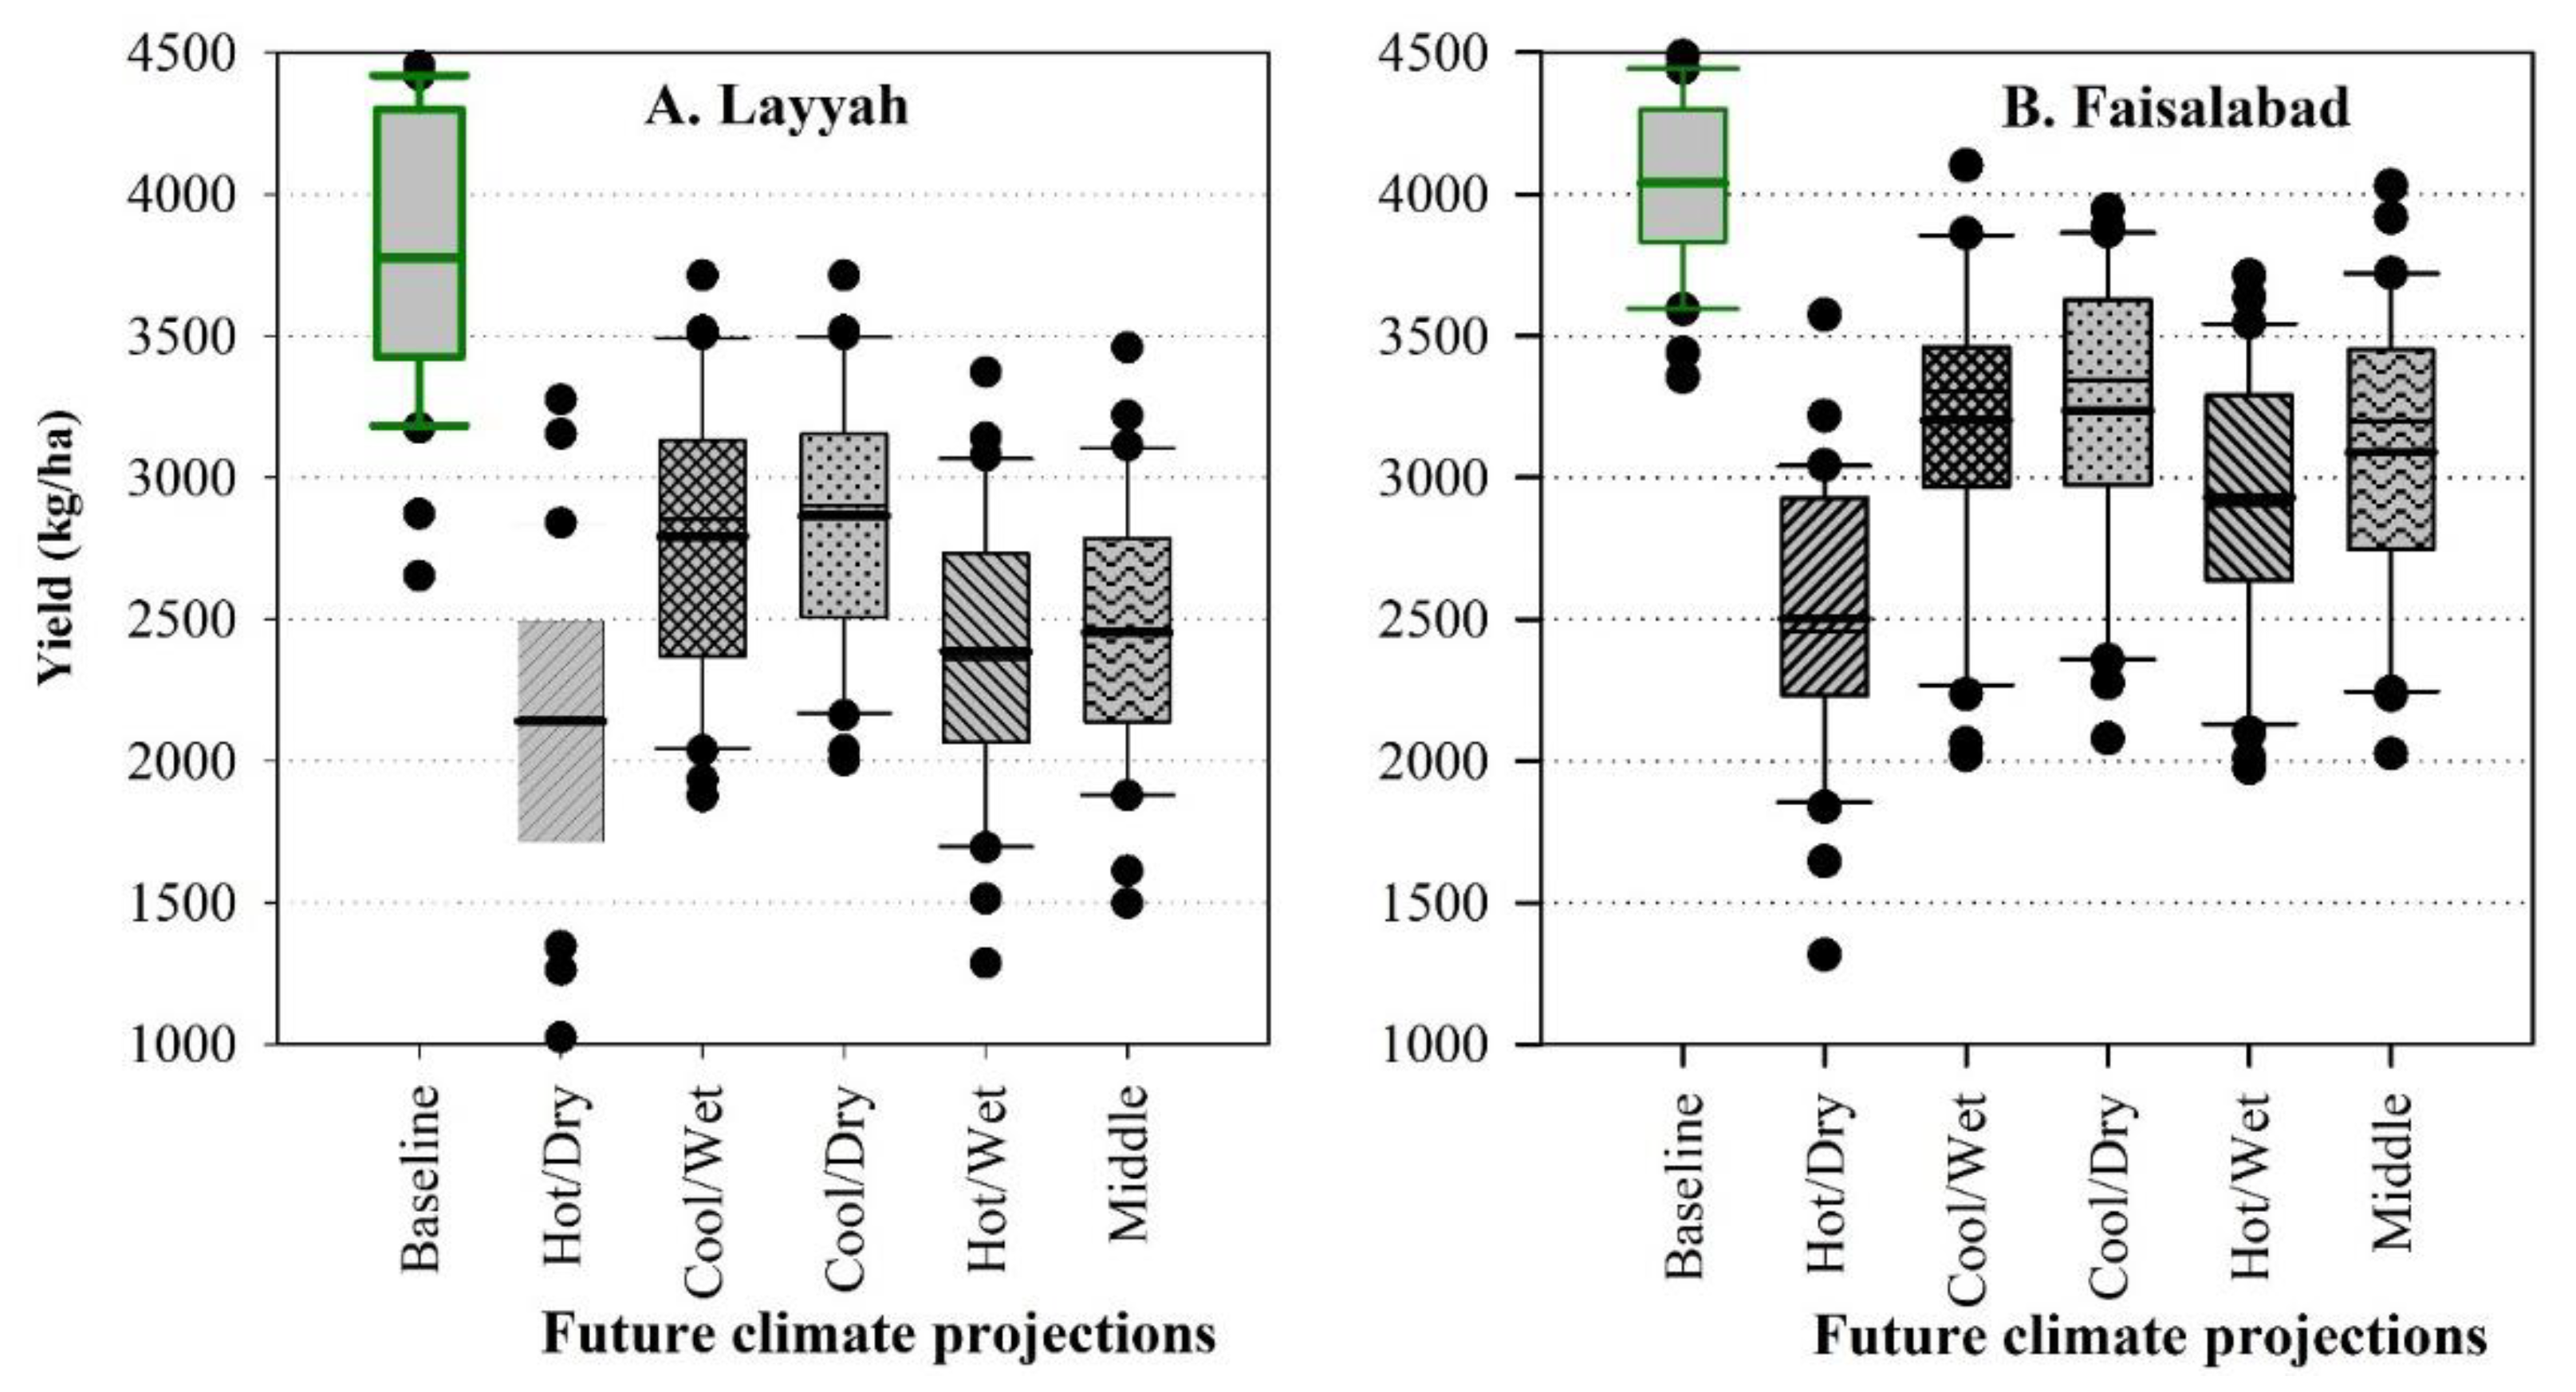
3.4. Simulated Grain Yield for Future Climate

The grain yield reduction was different under different climatic conditions as compared with the baseline climatic conditions of Faisalabad (average 4035 kg ha−1), as shown in Figure 7B. There was a reduction of grain yield in all climatic conditions except some years of Cool/Dry and Cool/Wet climatic conditions, as shown in the thirty-year data distribution in box-whisker. Maximum grain yield reduction was under Hot/Dry climatic conditions, with an average of 2502 kg ha−1 due to the hottest and driest conditions, while the minimum reduction was under Cool/Dry climatic conditions with 3235 kg ha−1. The average grain yield of wheat was 2988 kg ha−1, 3088 kg ha−1, and 3203 kg ha−1 under Hot/Wet, Middle, and Cool/Wet climatic conditions, respectively.
At Layyah (Figure 7A), climatic conditions were severe, which increased the chances of severe yield reduction due to the arid region and climate. The simulated grain yield of the Layyah baseline (3805 kg ha−1) was lower than the simulated grain yield of Faisalabad under baseline climatic conditions (4035 kg ha−1). The reduction of grain yield was the highest under Hot/Dry climatic conditions, with an average value of 2177 kg ha−1, and the lowest under Cool/Dry climatic conditions, with a simulated average grain yield of 2864 kg ha−1. The different climatic condition was the cause of yield reduction at Layyah except for some years of Cool/Wet and Cool/Dry climatic conditions. The average simulated grain yield was 2386 kg ha−1, 2452 kg ha−1, and 2792 kg ha−1 under Hot/Wet, Cool/Wet, and Middle climatic conditions.

4. Discussion

4.1. Future Climate Projections

Prediction of representative climate scenarios of any site is the first important step of climate change impact estimation. The stretched distribution of 29 GCMs among five quadrants—Hot/Wet, Hot/Dry, Cool/Wet, Cool/Dry, and Middle—based on the change in temperature and rainfall shows the chances of occurrence of each climatic condition. This approach gives us a comprehensive overview of all plausible climatic conditions and their chances of occurrence [6,23]. The selection of representative GCMs from each quadrant increases the reliability of simulations for future climatic data and saves the resources for computation [22,24,25]. The maximum number of GCMs in the quadrant of Middle climatic conditions shows the highest chances (35.5%) of prevailing in the future at both Faisalabad and Layyah. The lower number of models in the quadrant shows lower occurring chances of climatic conditions such as in the Cool/Wet quadrant [22,23,24,25,26]. In general, chances of Cool/Wet conditions in the future are meager, while the GCM distributions also predicted the lower chances (10.3% at Layyah and 13.7% at Faisalabad) of such climatic conditions. A different number of models in different quadrants also showed that there is uncertainty in simulations of GCMs [24,25].
The output of the most representative GCMs from each climatic condition was used to calculate the changing climate temperature during the second half of the century. Among five climatic conditions, Hot/Dry was the hottest and driest condition, which showed that these conditions could have drastic effects on the wheat crop as compared with Cool/Dry, Cool/Wet, Middle, and Hot/Wet climatic conditions at Faisalabad and Layyah. The predicted hotter climatic conditions of Layyah than Faisalabad was illustrated from baseline data. The primary trend of the season could remain the same as a baseline, e.g., the hotness can increase from November to April. Iqbal et al. [27] reported that temperature could rise by 3 °C and 6 °C during mid-century and end-century under RCP 8.5, respectively. Islam et al. [28] showed concerns about the imminent warming of the winter season as compared with past climatic data. Similarly, Ahmad et al. [6] reported a 2 °C rise in temperature during mid-century scenarios for the wheat crop growth season. The final relative change in temperature showed a maximum rise during March at Faisalabad (6.35 °C) and Layyah (7.05 °C). Iqbal et al. [27] found March the most warming month of the year. Overall, this rise in temperature in the future can be a grave threat to wheat production if the current climate warming trend continues.

4.2. Elevated Temperature and Wheat Morphology

Wheat morphology is affected by changing environment, management, and genotypes. Variation in environment and management, especially sowing date, change the temperature and photoperiod. Wheat genotypes have a different response to temperature and photoperiod. Adaptation of wheat to different environments on variable sowing dates occurs due to low-level sensitivity to photoperiod [29]. Temperature is an important factor affecting wheat morphology and ultimately affecting wheat yield. Therefore, in this study, we focused on quantifying the impacts of temperature on morphology. The elevated temperature reduced the plant height, which is mainly associated with reduced and shorter crop growth duration [30,31]. During high temperature, plant growth is accelerated, but the duration is shortened, which mainly cause small plant structure. Liu et al. [32] also found that warming increased the plant height, which might be caused by the lesser difference of day and night temperature. In our study, warming was the same in day and night temperature, which is associated with reduced plant height. Meanwhile, timely sown crop under warmer climates is taller due to the lower number of tillers, as reported in [31]. Increasing temperature with delay in sowing causes a reduction of spike length as well as of plant height. Baloch et al. [33] reported that spike length is significantly affected by sowing time. Sowing wheat on 16 October and 30 October produced spikes of 11.04 cm and 10.91 cm, respectively, owing to longer crop duration and low temperature. Shorter spikes (9.4 cm) were recorded in December or later sown crop [34,35,36,37], being short duration crops. The significant differences in spike length between the two environments were due to temperature (Table 4). During 2013–2014, climatic variables such as temperature, precipitation, and solar radiation remained optimum as compared with 2014–2015. A significant variation for spikelets per spike between the two environments was due to variability in solar radiation and air temperature. The optimum conditions during 2013–2014 caused good spikelets per spike. A variable trend for spikelets per spike was recorded for semi-arid and arid study regions. A decrease in spikelets per spike for the last dates was due to high temperature and heat stress as well as to shrinking crop duration encountered by the crop during the life cycle. As the number of spikelets determined during two particular phenological phases (terminal spikelet and grain filling), both phases are temperature sensitive, as high temperature particularly at floret formation causes sterility and hence reduces grain yield.

4.3. Future Climate and Wheat Grain Yield

Quantification of the future climate of semi-arid and arid environments showed an alarming situation of climate impact on wheat yield. The average temperature is not suitable for the grain formation stage of wheat, as data show that March temperature can be 6.3 °C and 7 °C hotter than baseline climate at Faisalabad (semi-arid) and Layyah (arid), respectively, under Hot/Dry climatic conditions (harsh climatic scenario). Grain formation of wheat occurs during March at both study regions, under either semi-arid or arid climatic conditions. Usually, mid-March high temperature currently has a negative impact on grain size and ultimately on grain yield, as it has also been depicted in previous studies under rainfed climatic conditions [38,39,40,41,42]. In the future, March could have worse effects than the current conditions on the final grain yield of wheat. Overall, at Faisalabad during the second half of the century, grain size reduction can be 38%, 27.37%, 23.45%, 20.86%, and 19.82% under Hot/dry, Hot/Wet, Middle, Cool/Wet, and Cool/Dry climatic conditions, respectively. Ahmad et al. [6] and Sultana et al. [5] reported a 12.5% grain yield reduction with a 2 °C increase in temperature and a 6–9% yield reduction with a 1 °C rise in temperature, respectively. The maximum reduction would be in Hot/Dry climatic conditions due to the highest temperature (harsh climatic scenario). Because wheat is irrigated in the semi-arid and arid environments, it is not significantly affected by dryness or wetness of season; consequently, the percentage grain yield reduction under Cool/Dry and Cool/Wet conditions is almost equal. Yield reduction was even 1% higher under Cool/Dry climatic conditions. Climatic warming has been reported in different studies ranging from 10% to 50% by Hussain et al. [15] depending on time, location, and wheat cultivars. The reduction of grain yield at Layyah (42.76%) under Hot/Dry climatic conditions could be worse than Faisalabad (38%) due to its high temperature in the future. Hot/Wet, Middle, Cool/Wet, and Cool/Dry conditions would cause a yield reduction of 37.92%, 35.54%, 26.6%, and 24.72%, respectively. These reductions are higher in the arid climate than in the semi-arid climate due to warmer climatic conditions in the arid region [43,44,45,46,47].

5. Conclusions

Middle climatic conditions would prevail in the future with 3.52 °C and 3.84 °C rises in temperature at Faisalabad (semi-arid) and Layyah (arid) under RCP 8.5 during the second half of the century. The grain yield of wheat would reduce by 23.5% at Faisalabad (semi-arid) and 35.45% at Layyah (arid climate) due to rising temperature till the end of the century. Although there are different responses to each GCM due to their behavior and class, there is still a predicted yield reduction. The mean seasonal temperature and mean temperature from heading to maturity ranged from 16 to 27.3 °C and from 12.9 to 30.4 °C, respectively, for eleven different sowing dates. The spikes were not formed at both locations and during both seasons when the crop was sown after 1 March due to abnormal climatic conditions, especially the temperature for the critical growth phases. Sowing dates proved to be very useful for the quantification of temperature and its impact on wheat crops. These findings would be helpful for the wheat-growers to adjust the sowing time accordingly when there is a climate shift and when climate variability is a threat to sustainable wheat production. Further, these predictions would be helpful for decision-making by the policymakers to ensure food security in the studied region. Furthermore, future studies are required, especially to develop new wheat genotypes that have phenotypic plasticity to adjust according to temperature shift and climate variability under future climate conditions.

Author Contributions

Conceptualization, J.H. and T.K.; methodology, J.H. and T.K.; software, J.H. and M.H.u.R.; validation, J.H., A.U. and I.A.; formal analysis, J.H.; investigation, T.K.; resources, T.K.; data curation, J.H. and M.H.u.R.; writing—original draft preparation, J.H.; writing—review and editing, M.H.u.R., A.K.S. and T.G.; visualization, A.A. and A.K.S.; supervision, T.K.; project administration, A.A.; funding acquisition, T.K. and A.A. All authors have read and agreed to the published version of the manuscript.

Funding

This research received no external funding. APC are paid by Crop Science, Institute of Crop Science and Resource Conservation (INRES), University of Bonn, Germany.

Institutional Review Board Statement

Not applicable.

Informed Consent Statement

Not applicable.

Data Availability Statement

Data will be available on special request from first and corresponding authors.

Acknowledgments

We are thankful to the field staff for assisting in field experiments.

Conflicts of Interest

The authors declare no conflict of interest.

References

  1. FAO. FAOSTAT; Food and Agriculture Organization of the United Nations: Rome, Italy, 2017; Available online: http://www.fao.org/faostat/en/ (accessed on 1 June 2017).
  2. Government of Pakistan. Economy Survey of Pakistan. In Ministry of Food Agriculture and Livestock Federal Bureau of Statistics Pakistan; Government of Pakistan: Islamabad, Pakistan, 2014; pp. 21–22. [Google Scholar]
  3. Asseng, S.; Zhu, Y.; Wang, E.; Zhang, W. Crop Modeling for Climate Change Impact and Adaptation, 2nd ed.; Academic Press: Cambridge, UK, 2015; ISBN 9780124171046. [Google Scholar]
  4. IPCC. Climate Change 2013: The Physical Science Basis. Contribution of Working Group I to the Fifth Assessment Report of the Intergovernmental Panel on Climate Change; Stocker, T.F., Qin, D., Plattner, G.-K., Tignor, M., Allen, S.K., Boschung, J., Nauels, A., Xia, Y., Bex, V., Midgley, P.M., Eds.; Cambridge University Press: Cambridge, UK; New York, NY, USA, 2013; p. 1535. [Google Scholar] [CrossRef] [Green Version]
  5. Sultana, H.; Ali, N.; Iqbal, M.M.; Khan, A.M. Vulnerability and adaptability of wheat production in different climatic zones of Pakistan under climate change scenarios. Clim. Chang. 2009, 94, 123–142. [Google Scholar] [CrossRef]
  6. Ahmad, A.; Ashfaq, M.; Rasul, G.; Wajid, S.A.; Khaliq, T.; Rasul, F.; Saeed, U.; Rahman, M.H.U.; Hussain, J.; Baig, I.A.; et al. Impact of Climate Change on the Rice–Wheat Cropping System of Pakistan. In Handbook of Climate Change and Agroecosystems; The Agricultural Model Intercomparison and Improvement Project Integrated Crop and Economic Assessments, Part 2; Imperial College Press: London, UK; pp. 219–258.
  7. Farooq, M.; Bramley, H.; Palta, J.; Siddique, K. Heat Stress in Wheat during Reproductive and Grain-Filling Phases. Crit. Rev. Plant Sci. 2011, 30, 491–507. [Google Scholar] [CrossRef]
  8. Hussain, J.; Khaliq, T.; Ahmad, A.; Akhtar, J. Performance of four crop model for simulations of wheat phenology, leaf growth, biomass and yield across planting dates. PLoS ONE 2018, 13, e0197546. [Google Scholar] [CrossRef] [PubMed]
  9. Asseng, S.; Foster, I.; Turner, N. The impact of temperature variability on wheat yields. Glob. Chang. Biol. 2011, 17, 997–1012. [Google Scholar] [CrossRef]
  10. Hatfield, J.L.; Boote, K.J.; Kimball, B.A.; Ziska, L.H.; Izaurralde, R.C.; Ort, D.; Thomson, A.M.; Wolfe, D. Climate Impacts on Agriculture: Implications for Crop Production. Agron. J. 2011, 103, 351–370. [Google Scholar] [CrossRef] [Green Version]
  11. Jones, J.W.; Hoogenboom, G.; Porter, C.H.; Boote, K.J.; Batchelor, W.D.; Hunt, L.A.; Wilkens, P.W.; Singh, U.; Gijsman, A.J.; Ritchie, J.T. The DSSAT cropping system model. Eur. J. Agron. 2003, 18, 235–265. [Google Scholar] [CrossRef]
  12. Asseng, S.; Ewert, F.; Martre, P.; Rotter, R.P.; Lobell, D.B.; Cammarano, D.; Kimball, B.A.; Ottman, M.J.; Wall, G.W.; White, J.W.; et al. Rising temperatures reduce global wheat production. Nat. Clim. Chang. 2015, 5, 143–147. [Google Scholar] [CrossRef]
  13. Ahmed, I.; Rahman, M.H.U.; Ahmed, S.; Hussain, J.; Ullah, A.; Judge, J. Assessing the impact of climate variability on maize using simulation modeling under semi-arid environment of Punjab, Pakistan. Environ. Sci. Pollut. Res. 2018, 25, 28413–28430. [Google Scholar] [CrossRef] [PubMed]
  14. Ullah, A.; Ahmad, A.; Khaliq, T.; Saeed, U.; Rahman, M.H.U.; Hussain, J.; Ullah, S.; Hoogenboom, G. Assessing climate change impacts on pearl millet under arid and semi-arid environments using CSM-CERES-Millet model. Environ. Sci. Pollut. Res. 2019, 26, 6745–6757. [Google Scholar] [CrossRef] [PubMed]
  15. Hussain, J.; Khaliq, T.; Asseng, S.; Saeed, U.; Ahmad, A.; Ahmad, B.; Fahad, M.; Awais, M.; Ullah, A.; Hoogenboom, G. Climate change impacts and adaptations for wheat employing multiple climate and crop modelsin Pakistan. Clim. Chang. 2020, 163, 253–266. [Google Scholar] [CrossRef]
  16. Rahman, M.H.U.; Ahmad, A.; Wajid, A.; Hussain, M.; Rasul, F.; Ishaque, W.; Islam, A.; Shelia, V.; Awais, M.; Ullah, A.; et al. Application of CSM-CROPGRO-Cotton model for cultivars and optimum planting dates: Evaluation in changing semi-arid climate. Field Crop. Res. 2019, 238, 139–152. [Google Scholar] [CrossRef]
  17. Hoogenboom, G. Contribution of agrometeorology to the simulation of crop production and its applications. Agric. For. Meteorol. 2000, 103, 137–157. [Google Scholar] [CrossRef]
  18. Hoogenboom, G.; Jones, J.W.; Wilkens, P.W.; Porter, C.H.; Boote, K.J.; Hunt, L.A.; Singh, U.; Lizaso, J.I.; White, J.W.; Uryasev, O.; et al. Decision Support System for Agrotechnology Transfer (DSSAT) Version 4.6. DSSAT Foundation. Prosser 2015, 15–19. [Google Scholar]
  19. Hoogenboom, G.; Porter, C.H.; Boote, K.J.; Shelia, V.; Wilkens, P.W.; Singh, U.; White, J.W.; Asseng, S.; Lizaso, J.I.; Moreno, L.P.; et al. The DSSAT crop modeling ecosystem. In Advances in Measuring Soil Health; Boote, K.J., Ed.; Burleigh Dodds Science Publishing: Cambridge, UK, 2019; pp. 173–216. [Google Scholar]
  20. Andarzian, B.; Hoogenboom, G.; Bannayan, M.; Shirali, M.; Andarzian, B. Determining optimum sowing date of wheat using CSM-CERES-Wheat model. J. Saudi Soc. Agric. Sci. 2015, 14, 189–199. [Google Scholar] [CrossRef] [Green Version]
  21. Attia, A.; Rajan, N.; Xue, Q.; Nair, S.; Ibrahim, A.; Hays, D. Application of DSSAT-CERES-Wheat model to simulate winter wheat response to irrigation management in the Texas High Plains. Agric. Water Manag. 2016, 165, 50–60. [Google Scholar] [CrossRef]
  22. Ruane, A.C.; Goldberg, R.; Chryssanthacopoulos, J. Climate forcing datasets for agricultural modeling: Merged products for gap-filling and historical climate series estimation. Agric. For. Meteorol. 2015, 200, 233–248. [Google Scholar] [CrossRef] [Green Version]
  23. Ruane, A.C.; McDermid, S.P. Selection of a representative subset of global climate models that captures the profile of regional changes for integrated climate impacts assessment. Earth Perspect. 2017, 4, 1. [Google Scholar] [CrossRef] [Green Version]
  24. Rahman, M.H.U.; Ahmad, I.; Wang, X.; Wajid, A.; Nasim, W.; Hussain, M.; Ahmad, B.; Ali, Z.; Ishaque, W.; Awais, M.; et al. Multi-model projections of future climate and climate change impacts uncertainty assessment for cotton production in Pakistan. Agric. For. Meteorol. 2018, 253-254, 94–113. [Google Scholar] [CrossRef]
  25. Ahmed, I.; Ullah, A.; Rahman, M.H.U.; Ahmad, B.; Wajid, S.A.; Ahmad, A.; Ahmed, S. Climate Change Impacts and Adaptation Strategies for Agronomic Crops. In Climate Change and Agriculture; IntechOpen: London, UK, 2019; pp. 1–15. [Google Scholar]
  26. Tebaldi, C.; Smith, R.L.; Nychka, D.; Mearns, L.O. Quantifying Uncertainty in Projections of Regional Climate Change: A Bayesian Approach to the Analysis of Multimodel Ensembles. J. Clim. 2005, 18, 1524–1540. [Google Scholar] [CrossRef] [Green Version]
  27. Iqbal, M.A.; Shen, Y.; Stričević, R.; Pei, H.; Sun, H.; Amiri, E.; Penas, A.; Del Rio, S. Evaluation of the FAO AquaCrop model for winter wheat on the North China Plain under deficit irrigation from field experiment to regional yield simulation. Agric. Water Manag. 2014, 135, 61–72. [Google Scholar] [CrossRef]
  28. Islam, S.U.; Rehman, N.; Sheikh, M.M. Future change in the frequency of warm and cold spells over Pakistan simulated by the PRECIS regional climate model. Clim. Chang. 2009, 94, 35–45. [Google Scholar] [CrossRef]
  29. Acevedo, E.; Silva, P.; Silva, H. Wheat growth and physiology. In Bread Wheat Improvement and Production; Curtis, B.C., Rajaram, S., Gomez Macpherson, H., Eds.; Food and Agriculture Organization of the United Nations: Rome, Italy, 2002. [Google Scholar]
  30. Siebert, S.; Ewert, F.; Rezaei, E.E.; Kage, H.; Graß, R. Impact of heat stress on crop yield—on the importance of considering canopy temperature. Environ. Res. Lett. 2014, 9, 044012. [Google Scholar] [CrossRef] [Green Version]
  31. Rezaei, E.E.; Webber, H.; Gaiser, T.; Naab, J.; Ewert, F. Heat stress in cereals: Mechanisms and modelling. Eur. J. Agron. 2015, 64, 98–113. [Google Scholar] [CrossRef]
  32. Liu, L.; Cang, J.; Yu, J.; Wang, X.; Huang, R.; Wang, J.; Lu, B. Effects of Exogenous Abscisic Acid on Carbohydrate Metabolism and the Expression Levels of Correlative Key Enzymes in Winter Wheat under Low Temperature. Biosci. Biotechnol. Biochem. 2013, 77, 516–525. [Google Scholar] [CrossRef] [PubMed]
  33. Baloch, M.S.; Nadim, M.A.; Zubair, M.; Awan, I.U.; Khan, E.A.; Ali, S. Evaluation of wheat under normal and late sowing conditions. Pak. J. Bot. 2012, 44, 1727–1732. [Google Scholar]
  34. Sattar, A.; Cheema, M.A.; Farooq, M.; Wahid, M.A.; Wahid, A.; Babar, B.H. Evaluating the performance of wheat cultivars under late sown conditions. Int. J. Agric. Biol. 2010, 12, 561–565. [Google Scholar]
  35. Sial, M.A.; Arain, M.A.; Khanzada, S.; Naqvi, M.H.; Dahot, M.U.; Nizamani, N.A. Yield and quality parameters of wheat genotypes as affected by sowing dates and high temperature stress. Pak. J. Bot. 2005, 37, 575–584. [Google Scholar]
  36. Ahmed, M.; Aslam, M.A.; Fayyaz-ul-Hassan; Hayat, R.; Ahmad, S. Biochemical, physiological and agronomic response of wheat to changing climate of rainfed Pakistan. Pak. J. Bot. 2019, 51, 535–551. [Google Scholar] [CrossRef]
  37. Ahmed, A.; Fayyaz-ul-Hassan; Ahmad, S. Climate variability impact on rice production: Adaptation and mitigation strategies. In Quantification of Climate Variability, Adaptation and Mitigation for Agricultural Sustainability; Ahmad, M., Stockle, C., Eds.; Springer: Cham, Switzerland, 2017; pp. 91–111. [Google Scholar]
  38. Ahmad, S.; Abbas, G.; Ahmed, M.; Fatima, Z.; Anjum, M.A.; Rasul, G.; Khan, M.A.; Hoogenboom, G. Climate warming and management impact on the change of rice-wheat phenology in Punjab, Pakistan. Field Crops Res. 2019, 230, 46–61. [Google Scholar] [CrossRef]
  39. Ahmad, S.; Hussain, S.; Fatima, Z.; Abbas, G.; Khan, M.R.; Younis, H.; Naz, S.; Sohail, M.; Ajmal, M.; Abbas, N.; et al. Application of DSSAT model for sowing date management of C4 summer cereals for fodder and grain crops under irrigated arid environment. Pak. J. Life Soc. Sci. 2016, 14, 104–114. [Google Scholar]
  40. Khan, M.A.; Tahir, A.; Khurshid, N.; Husnain, M.I.U.; Ahmed, M.; Boughanmi, H. Economic Effects of Climate Change-Induced Loss of Agricultural Production by 2050: A Case Study of Pakistan. Sustainability 2020, 12, 1216. [Google Scholar] [CrossRef] [Green Version]
  41. Ahmed, M.; Stöckle, C.O.; Nelson, R.; Higgins, S.; Ahmad, S.; Raza, M.A. Novel multimodel ensemble approach to evaluate the sole effect of elevated CO2 on winter wheat productivity. Sci. Rep. 2019, 9, 1–15. [Google Scholar] [CrossRef] [Green Version]
  42. Khan, Z.; Rahman, M.; Haider, G.; Amir, R.; Ikram, R.; Ahmad, S.; Schofield, H.; Riaz, B.; Iqbal, R.; Fahad, S.; et al. Chemical and Biological Enhancement Effects of Biochar on Wheat Growth and Yield under Arid Field Conditions. Sustainability 2021, 13, 5890. [Google Scholar] [CrossRef]
  43. Ghafoor, I.; Habib-Ur-Rahman, M.; Ali, M.; Afzal, M.; Ahmed, W.; Gaiser, T.; Ghaffar, A. Slow-release nitrogen fertilizers enhance growth, yield, NUE in wheat crop and reduce nitrogen losses under an arid environment. Environ. Sci. Pollut. Res. 2021, 1–16. [Google Scholar] [CrossRef]
  44. Saddique, Q.; Khan, M.; Rahman, M.H.U.; Jiatun, X.; Waseem, M.; Gaiser, T.; Waqas, M.M.; Ahmad, I.; Chong, L.; Cai, H. Effects of Elevated Air Temperature and CO2 on Maize Production and Water Use Efficiency under Future Climate Change Scenarios in Shaanxi Province, China. Atmosphere 2020, 11, 843. [Google Scholar] [CrossRef]
  45. Saddique, Q.; Zou, Y.; Ajaz, A.; Ji, J.; Xu, J.; Azmat, M.; Rahman, M.H.U.; He, J.; Cai, H. Analyzing the Performance and Application of CERES-Wheat and APSIM in the Guanzhong Plain, China. Trans. ASABE 2020, 63, 1879–1893. [Google Scholar] [CrossRef]
  46. Ahmed, M.; Hassan, F.-U. Response of Spring Wheat (Triticum aestivum L.) Quality Traits and Yield to Sowing Date. PLoS ONE 2015, 10, e0126097. [Google Scholar] [CrossRef]
  47. Ahmed, M.; Hassan, F.U.; Aslam, M.; Aslam, M.A. Physiological attributes based resilience of wheat to climate change. Int. J. Agric. Biol. 2012, 14, 3. [Google Scholar]
Figure 1. Map of study districts in arid (Layyah) and semi-arid (Faisalabad) climatic conditions.
Atmosphere 12 00927 g001
Figure 2. Temperature (°C) and precipitation (%) change of future (2051–2100) from baseline climate (1980–2015) for distribution of 29 GCMs among five projected climatic conditions—Cool/Wet, Hot/Wet, Cool/Dry, Hot/Dry and Middle—during November, December, January, February, March, and April (NDJFMA) during the wheat season under RCP8.5 at Faisalabad (a) and Layyah (b), semi-arid and arid climatic conditions, respectively, in Pakistan.
Atmosphere 12 00927 g002
Figure 3. The relative increase in average temperature compared with the baseline period under Cool/Dry, Cool/Wet, Hot/Dry, Hot/Wet, and Middle climatic conditions of RCP 8.5 during the wheat season (November to April) of the second half of the century (2051–2100) at Faisalabad (A) and Layyah (B).
Atmosphere 12 00927 g003
Figure 4. Plant height (cm) of three wheat cultivars at harvesting of different sowing dates of location Faisalabad (a,b) and Layyah (c,d) during wheat growing seasons (2013–2014 and 2014–2015). (Regression lines show a relationship between plant heights of different cultivars harvested at different sowing dates with their respective mean seasonal temperature.).
Atmosphere 12 00927 g004
Figure 5. Spike length (cm) of three wheat cultivars at harvesting of different sowing dates of location Faisalabad (a,b) and Layyah (c,d) during 2013–2014 and 2014–2015. (Regression lines show a relationship between spike length (cm) of different cultivars harvested at different sowing dates with their respective mean temperature heading to maturity.).
Atmosphere 12 00927 g005
Figure 6. Spikelets per spike of three wheat cultivars at different sowing dates of location Faisalabad (a,b) and Layyah (c,d) during 2013–2014 and 2014–2015. [Regression lines show a relationship between spikelets per spike of different cultivars harvested at different sowing dates with their respective mean temperature heading to maturity].
Atmosphere 12 00927 g006
Figure 7. Simulated effects of climate change scenarios (Hot/Dry, Cool/Wet, Cool/Dry, Hot/Wet, and Middle) as compared with baseline (1980–2010) on wheat grain yield (kg ha−1) at arid (A. Layyah) and semi-arid region (B. Faisalabad) during end-century scenarios (2051–2100) under RCP 8.5.
Atmosphere 12 00927 g007
Table 1. Soil physical and chemical properties of study sites.
(a)
Physical properties of soil
LocationsFaisalabadLayyah
Soil type/Soil seriesSandy clay loam/fine loam, shallow/Lyallpur series brown on color along with the % of sand (62%), silt (16%), and clay (24%).Sandy clay loam/fine loam, shallow/Khumbi series brown on color along with the % of sand (44.70%), silt (37%), and clay (19%).
(b)
Chemical properties of soil
Organic matter1.28%0.85%
TTS (Total soluble salt)12.29%10.29%
pH7.548.1
Nitrogen (N)0.64%0.34%
Phosphorus (P2O5)6.93 ppm4.93 ppm
Potassium (K)19.4 ppm12.4 ppm
Table 2. Characteristics of three spring wheat cultivars used in the study.
CultivarsYield Potential (kg ha−1)1000-Grain Weight (g)
Galaxy-2013790445.63
Punjab-2011691644.7
Lasani-2008612541.73
Table 3. Analysis of variance (ANOVA) of wheat morphology parameters.
Source of VarianceDFPlant Height (cm)Spike Length (cm)Spikelets per Spike
Year (Y)1552.6 **13.8 **32.2 **
Location (L)12.8 NS6.4 **17.6 **
Y × L12.9 NS6.4 **17.8 **
Planting Dates (A)10322,521 **718.1 **1341.1 **
Y × A1075.9 **5.8 **10.6 **
L × A1042.7 *0.8 NS2.5 **
Y × L × A1042.6 *0.8 NS2.5 **
Cultivars (B)21811.3 **3.4 **3.2 **
Y × B242.7 NS4.1 **2.8 *
L × B236.1 NS2.9 *0.7 NS
Y × L × B235.9 NS2.9 *0.6 NS
A × B2063.6 **0.7NS0.9 NS
Y × A × B2042.2 NS1.3 **1.2 **
L × A × B2017.0 NS0.3 NS0.4 NS
Y × L × A × B2017.0 NS0.3 NS0.4 NS
Note: Y = year, L = location, PD = planting date, G = cultivar (genotype), E = environment (arid and semi-arid). * and ** are significant at 0.05 and 0.01 probability levels, using Tukey’s multiple range test.
Table 4. The linear regression coefficient of mean seasonal temperature with plant height and mean temperature heading to maturity, with spike length and spikelets per spike.
LocationsYearsPlant Height (cm)Spike Length (cm)Spikelets per Spike
SlopeR2SlopeR2SlopeR2
Faisalabad
(semi-arid)
2013–2014−8.780.93 **−1.060.91 **−1.480.94 **
2014–2015−5.400.94 **−0.950.96 **−1.210.92 **
Layyah
(arid climate)
2013–2014−8.990.90 **−1.070.92 **−1.320.84 **
2014–2015−11.20.84 **−0.770.86 **−0.700.86 **
Slope and R2 are the slopes of fitted lines and coefficients of determination between wheat morphology parameters and temperature. ** Indicates significance at p < 0.05.
Publisher’s Note: MDPI stays neutral with regard to jurisdictional claims in published maps and institutional affiliations.

