Article

Particle Number Emissions of Gasoline, Compressed Natural Gas (CNG) and Liquefied Petroleum Gas (LPG) Fueled Vehicles at Different Ambient Temperatures

European Commission—Joint Research Centre (JRC), 21027 Ispra, Italy
*
Author to whom correspondence should be addressed.
Atmosphere 2021, 12(7), 893; https://doi.org/10.3390/atmos12070893
Submission received: 8 June 2021 / Revised: 2 July 2021 / Accepted: 8 July 2021 / Published: 9 July 2021
(This article belongs to the Special Issue Air Quality Impacts of Vehicle Emissions)

Abstract

:
Compressed natural gas (CNG) and liquefied petroleum gas (LPG) are included in the group of promoted transport fuel alternatives for traditional fossil fuels in Europe. Both CNG and LPG fueled vehicles are believed to have low particle number and mass emissions. Here, we studied the solid particle number (SPN) emissions >4 nm, >10 nm and >23 nm of bi-fuel vehicles applying CNG, LPG and gasoline fuels in laboratory at 23 °C and sub-zero (−7 °C) ambient temperature conditions. The SPN23 emissions in CNG or LPG operation modality at 23 °C were below the regulated SPN23 limit of diesel and gasoline direct injection vehicles 6 × 10 11 1/km. Nevertheless, the limit was exceeded at sub-zero temperatures, when sub-23 nm particles were included, or when gasoline was used as a fuel. The key message of this study is that gas-fueled vehicles produced particles mainly <23 nm and the current methodology might not be appropriate. However, only in a few cases absolute SPN >10 nm emission levels exceeded 6 × 10 11 1/km when >23 nm levels were below 6 × 10 11 1/km. Setting a limit of 1 × 10 11 1/km for >10 nm particles would also limit most of the >4 nm SPN levels below 6 × 10 11 1/km.

1. Introduction

Compressed natural gas (CNG) and liquefied petroleum gas (LPG) are included in the group of promoted transport fuel alternatives for traditional fossil fuels in Europe [1]. In Europe, in 2020, 4% (~12.5 M vehicles) of the passenger cars used LPG and 0.4% (~1.25 M vehicles) CNG as fuel [2]. Both LPG and CNG are fossil fuels. LPG is typically a product or a by-product of petroleum refining or natural gas processing and CNG is obtained increasingly from shale gas reserves [3,4]. The main components of LPG are propane, propylene, butane and ethane, while CNG comprises mostly methane and smaller proportions of heavier hydrocarbons and some sulfur compounds, in regionally and seasonally varying proportions [5,6]. For both fuels, CNG and LPG, high octane number, low carbon number and enhanced mixing characteristics when compared to gasoline suggests relatively low exhaust emissions in combustion engine use. In addition, the technical feasibility of the fuels for the current fleet, their availability and the possibility of diversification of the energy sources of the transport are considered as their advantages [3,4,7,8].
The CNG and LPG fueled vehicles are connected to low particle emissions when particulate matter (PM) mass or solid particle number (SPN) in a >23 nm size range (SPN23) is considered [9,10,11,12,13,14,15]. In fact, as most of the CNG and LPG fueled vehicles in European market apply port fuel injection or multiport fuel injection (PFI) [16], their particle emissions are not regulated in Europe. In the European Union’s regulation, PM mass and SPN23 limits are set only for vehicles applying direct fuel injection (DI) and, thus, in practice, are set for compression ignited diesel vehicles and spark ignited direct injection gasoline (GDI) vehicles [17]. Along with the regulation and the related advances in emission control, SPN for DI vehicles have decreased and gasoline PFI vehicles may nowadays appear as a high SPN23 emitters [18] In addition, notable particle number emissions in <23 nm size range (sub-23 nm) are detected for PFI vehicles [13,18,19,20,21]. The CNG fueled vehicles’ SPN in size range from 10 nm to 23 nm and even below 10 nm is shown exceed the emissions of the gasoline and diesel fueled vehicles [13,22,23,24,25].
The characteristics of the <23 nm particles in vehicle exhaust are still unknown. CNG fueled ship engine exhaust particle population is suggested to include three different solid particle modes: soot mode at 30 nm to 70 nm size range, lubricant originating particle mode at size range from 10 nm to 30 nm and fuel originating particle mode in <10 nm size range [23]. In addition, for a gasoline and diesel vehicles, detected ~10 nm particle population is connected to lubricant additives and a slightly smaller, coexisting particle mode to fuel characteristics [26,27,28]. The <23 nm particle composition in vehicle exhaust is, in general, proposed to include aliphatic or polycyclic aromatic hydrocarbons, metals originating from lubricant oil additives or in-cylinder wear or fragmented soot particles [23,26,27,28,29,30,31,32,33]. The small particle size and the composition of the vehicle exhaust particles are often connected to potential adverse health effects in inhalation exposure [34,35,36,37,38,39,40,41].
In order to evaluate light-duty passenger vehicle SPN emissions comprehensively, there is a clear need of knowledge about <23 nm SPN for PFI vehicles, in particular, PFIs applying alternative fuels at low ambient temperatures. Recently, a new method for measuring solid particle number in a size range from about 10 nm (SPN10) was approved to amend the Global Technical Regulation No. 15 [42,43]. For CNG fueled vehicles, the attention is in <10 nm size range SPN and obviously the character of LPG fueled vehicle SPN emissions in the same size range is of great interest. In fact, literature is missing mostly the effect of sub-zero temperature conditions on sub-23 nm SPN emissions in PFI vehicles in case of CNG and LPG fuels and, also SPN23 data is scarce [44].
As mentioned above, the low exhaust emissions of CNG and LPG fueled vehicles are often used to promote the fuels in transportation use. In practical terms, however, the light-duty CNG and LPG fueled vehicles sold in European market apply mostly gasoline as a second or reserve fuel and the emissions of the vehicles in gasoline operation modality may have a notable impact on the emission levels of the vehicles [10,11,12,13,14,15,16,45]. Thus, when it comes to estimation of bi-fuel vehicle particle emissions, also gasoline operation should be considered as gasoline SPN emissions are usually higher than the emissions in gaseous fuel operation.
Here, exhaust emissions of three different light-duty vehicles were studied in laboratory conditions. Two of the vehicles used either gasoline or compressed natural gas as a fuel and one of the vehicles either gasoline or liquefied petroleum gas. The vehicles were tested in 23 °C and in sub-zero temperature test cell conditions. The solid particle measurements were conducted here with a method approved to Global Technical Regulation No. 15 to cover particle sizes >10 nm and additionally, counters were used to measure in the <10 nm size range. In general, the aim of the study is to provide source characteristics of the current vehicles applying CNG, LPG and gasoline in various temperature conditions for use in environmental air quality studies and in policy development. Special emphasis is given to the fraction of particles not detected with the new SPN10 measurement method, i.e., SPN emissions in <10 nm size range.

2. Materials and Methods

2.1. Vehicles

Tested vehicles (Table 1) included two light-duty bi-fuel vehicles (VCNG1, VLPG) and a light-duty mono-fuel gas vehicles (VCNG2). The bi-fuel vehicles were equipped with port fuel injection (PFI) systems for CNG or LPG and Gasoline (E10). The mono-fuel gas vehicle applied PFI for primary (CNG) fuel but the reserve fuel (E5) injection type was not disclosed in the official papers. Market fuels were used in the tests with 10% (E10) or 5% (E5) ethanol content. In the text LPG and CNG are often referred as gaseous fuels as CNG and LPG refer to the status of the fuel in the tank, but they both enter the cylinder in gaseous state [46]. All of the vehicles had three way catalysts (TWC) as a tailpipe emissions control systems, none of them had gasoline particulate filter. For the sake of completeness, the results with gasoline fuel for VCNG2 will also be presented, but it should be emphasized that this vehicle is allowed to operate in this modality only when the CNG tank is empty.

2.2. Equipment and Method

The vehicle testing was conducted in two different Vehicle Emission LAboratories (VELA1, VELA2, JRC, Ispra, Italy) by driving tests cycles on a chassis dynamometer (VELA1: RPL 1220/AVL Zöllner GmbH, Bensheim, Germany; VELA2: ECDM-48L 4 × 4, MAHA, Haldenwang, Germany). The measurements of vehicles were conducted by sampling from the full dilution tunnel with Constant Volume Sampling (CVS) (VELA1: CVS i60 LD, AVL, Gratz, Austria; VELA2: CVS 7400, Horiba Ltd., Kyoto, Japan).
The emission measurements were conducted with Worldwide Light duty vehicle Test Procedure (WLTP) and respective Cycle (WLTC) [17] in stabilized temperature conditions (23 °C ± 3 °C) or sub-zero conditions (−5 °C ± 2 °C). These tests are called hereafter as “cold start WLTC” or “sub-zero WLTC”, respectively. In addition, WLTCs were conducted with high lubricant oil temperature >70 °C in the start of the cycle but in 23 °C temperature test cell, called as “hot start WLTC”. In cold start WLTC and in sub-zero WLTC, the vehicles were soaked in test cell and the oil temperature at the start of the cycle was in the range of the test cell temperature (±3 °C). The dynamometer parameters (road load values F2) were not adjusted (10%) at the sub-zero condition tests and consequently the road load was under-estimated in sub-zero conditions [17]. Thus, sub-zero tests did not follow the recently approved WLTP type 6 test [47] and should be considered only in comparison to ambient temperature tests. In total VCNG1 data comprised of 19 test cycles, VCNG2 data 12 and VLPG 20 test cycles.
Solid particle number (SPN) emissions were measured with a commercial particle measurement system (AVL APC xApp 10, AVL, Graz, Austria). In the SPN-system, a volatile particle remover (VPR) is equipped with a catalyzed evaporation tube and it fulfils the upcoming regulation including particle size range >10 nm. The catalytic stripper is obligatory for sub-23 nm measurements to reduce the possibility of volatile artifacts [43,48]. In addition, in the upcoming regulation, >23 nm SPN measurement is allowed to be conducted with a catalytic stripper. The SPN system was modified so that three different particle number counters (PNC) sampled from optimized, internal sampling position. The size ranges for the three PNCs were >23 nm (PNC23; AVL CPC, AVL, Graz, Austria), >10 nm (PNC10; AVL CPC, AVL, Graz, Austria) and >4 nm (PNC4; CPC 3752, TSI Inc, Shoreview, MN, USA). The SPN emissions calculated from the data of PNC23, PNC10 and PNC4 are named hereafter as SPN23, SPN10 and SPN4, respectively. The PNC10 used here fulfilled the future regulation where detection efficiency of 65% at 10 nm and >90% at 15 nm is required.
The solid particle number emissions, when sampling from CVS, were calculated:
SPN x = P C R F   N ¯ x V t o t / D
where N ¯ x (1/m3) is the average of recorded particle number concentration with PNC4, PNC10 or PNC23, PCRF (Particle Concentration Reduction Factor) of 30 nm, 50 nm and 100 nm, D (km) is distance and V t o t (m3) total volume flow in the CVS during the same period. The variability for the SPN results is given in this study as a standard deviation of the emissions determined in the measurement repeats.
In addition to SPN, the excess of particles in particle size range from 10 nm to 23 nm (sub23-10) over PNC23 and from 4 nm to 10 nm (sub10-4) over PNC10 is reported. These particle fractions are calculated with the following equations:
sub 23 10 = SPN 10 / SPN 23 1
sub 10 4 = SPN 4 / SPN 10 1
For all the results presented here, the losses in the SPN-system are corrected following the current regulation, where PCRF is a product of average loss correction of 30 nm, 50 nm and 100 nm particle diameter losses in the Volatile Particle Remover (VPR). The upcoming SPN10 method adapts the same average PCRF calculation method. For the used SPN-system, the average PCRF underestimate the losses 38% at 15 nm and 64% at 10 nm particle diameters [43]. In general, the results are presented in this paper without additional loss-correction, other than average PCRF, for sub-23 nm emissions and when the corrected SPN is considered, it is mentioned in the text. SPN4 and SPN10 are corrected following literature with equations:
SPN 4 c = SPN 23 + k 10 SPN 4 SPN 23
SPN 10 c = SPN 23 + k 15 SPN 10 SPN 23
where subscript “c” refers to corrected emission [12]. The correction coefficients were k10 = 2.8 and k15 = 1.6. Correction coefficients were determined at 10 nm (k10) and 15 nm (k15) particle diameters as they represent the losses at the geometric mean diameters in the size ranges from 4 nm to 23 nm and from 10 nm to 23 nm, respectively. The maximum uncertainty due to different equipment and laboratories is 32% (SPN23) to 40% (SPN10), with typical uncertainties of 14% (SPN23) and 16% (SPN10) [49]. Since we used the same SPN systems at both laboratories, we expect our uncertainty around 15%.

2.3. SPN Limits

The SPN is regulated only in particle size range above 23 nm and only for the vehicles applying direct fuel injection [17]. Here, the SPN emissions, independent of the PNC size range, vehicle type or fuel are compared to the current SPN-limit of 6 × 10 11 1/km to put the results into context.

3. Results

3.1. Gaseous Fuel Operation

Figure 1 summarizes the SPN emissions from the three vehicles using CNG or LPG. The exact values are given in Supplementary Material, Table S1. In 23 °C temperature tests, all vehicles’ SPN23-emissions were below the DI vehicle SPN-limit of 6 × 10 11 1/km in gaseous fuel operation mode (Figure 1a, left columns). In fact, for VCNG2 and VLPG, all SPN emissions (SPN4, SPN10 and SPN23) were below the limit in the 23 °C testing conditions when additional loss correction was not applied. Even when the loss corrected emissions are considered, VLPG SPN4 and SPN10 remained under the limit, while loss corrected VCNG2 SPN4 was closing levels of 10 12 1/km. VCNG1 SPN4 and SPN10, on the other hand, exceeded 10 12 1/km in 23 °C both with and without loss correction.
The SPN emissions were higher in sub-zero conditions than at 23 °C tests (Figure 1a, right columns). In sub-zero conditions, all SPN size ranges exceeded 6 × 10 11 1/km for VLPG and 10 12 1/km for VCNG1 even when no loss correction was applied. VCNG2 uncorrected SPNs remained below 6 × 10 11 1/km also in sub-zero conditions, but loss corrected SPN4 was closing the level of 10 12 1/km, similar to the 23 °C tests. VLPG SPN emissions were in sub-zero tests 400% to 580% higher than in 23 °C cold start tests (Figure 1a, see percentages above sub-zero bars). VCNG1 sub-zero condition SPN4 and SPN10 emissions exceeded 23 °C cold start emissions around 100%, while for SPN23, the excess was as high as over 900%. VCNG2 SPN4 sub-zero SPN4 exceeded 23 °C cold start levels around 30% and SPN10 and SPN23 around 100%.
The VLPG sub23-10 in gaseous operation was around 100% in hot start tests and decreased to around 30% in sub-zero test and the sub10-4 was at 10% or lower for all tests when uncorrected data is considered (Figure 1b, see data labels). Even when loss corrected data are considered, sub10-4 remained between 45% and 70% and sub23-10 between 45% and 160%. Thus, the VLPG sub-10 nm SPN emissions were negligible when loss correction was not applied and the sub23-10 rather low.
For VCNG1, the sub10-4 was 60% in hot start and decreased down to 20% in sub-zero test, while sub23-10 was in the hot start >1100%, cold start >500% and in sub-zero condition 33%. When loss corrected SPN4 and SPN10 are considered, maximum sub10-4 increase to around 180% and sub23-10 to 1800% for VCNG1 gaseous fuel operation mode.
VCNG2 sub10-4 was between 110% and 270% for the all the tests and sub23-10 between 240% and 470%. The loss correction increased sub10-4 to a range from 280% to 580% and sub23-10 to a range from 380% to 750%. Thus, with or without loss correction, VCNG2 SPN emissions were clearly more concentrated in <10 nm size range than the SPN of the other vehicles.
Summarizing, when the emissions with the current SPN23 method and the upcoming method (SPN10) are compared for the CNG vehicles, there is a difference of a factor of 3, exceeding 10 in hot start WLTC. The levels below 10 nm are 20% to 270% when no loss correction is applied, with the higher percentages corresponding to the lower absolute SPN23 levels. For VLPG, SPN10 were less than double than SPN23 and SPN4 negligible.

3.2. Liquid Fuel Operation

Figure 2 summarizes the SPN emissions from the three vehicles using gasoline as fuel. The exact values are given in Supplementary Material, Table S2.
VLPG vehicle in gasoline operation emitted around 10 12 1/km, with no big differences between cold and hot start tests, while in sub-zero test the emissions were around two times higher (Figure 2a). VCNG1 had emissions around 10 13 1/km. Regarding the mono fuel gas vehicle, VCNG2, SPN10 and SPN23 emissions in 23 °C tests remained around or below 5 × 10 11 1/km in gasoline operation, but all of the size fractions exceeded 6 × 10 11 1/km in sub-zero tests.
VLPG levels in gasoline operation mode were about 150% to 200% higher in sub-zero than in 23 °C conditions while for VCNG1 the differences were around 60% to 70%. VCNG2 gasoline operation SPN levels changed between room temperature and sub-zero cold start tests 55% for SPN4, 200% for SPN10 but as much as over 1100% for SPN23.
Regarding the distribution of particles in different size ranges, similar to gaseous operation, the VLPG sub23-10 in liquid fuel operation was around 80% in hot start tests and decreased to around 40% in sub-zero test while the sub10-4 was at 10% or lower for all tests when uncorrected data are considered (Figure 2b). Even when loss corrected data were considered for VLPG, sub10-4 remained also in gasoline operation in 50% to 60% range and sub23-10 in 60% and 140% range. Thus, VLPG sub23-10 were rather low and sub10-4 practically absent, similarly to the gaseous fuel.
For VCNG1, both sub10-4 and sub23-10 were below 20% in all gasoline operation tests, thus showing a clear decrease when compared to those determined for gaseous operation mode. VCNG2 sub10-4 and sub23-10 characteristics in gasoline operation were similar or slightly lower than those in gaseous operation room temperature tests. In liquid operation, VCNG2 sub10-4 was between 110% and 150% and sub23-10 between 360% and 520%. Only in sub-zero tests, gasoline operation sub10-4 and sub23-10 for VCNG2 decreased notably in comparison to gaseous mode reaching 26% for sub10-4 and ~55% for sub23-10.

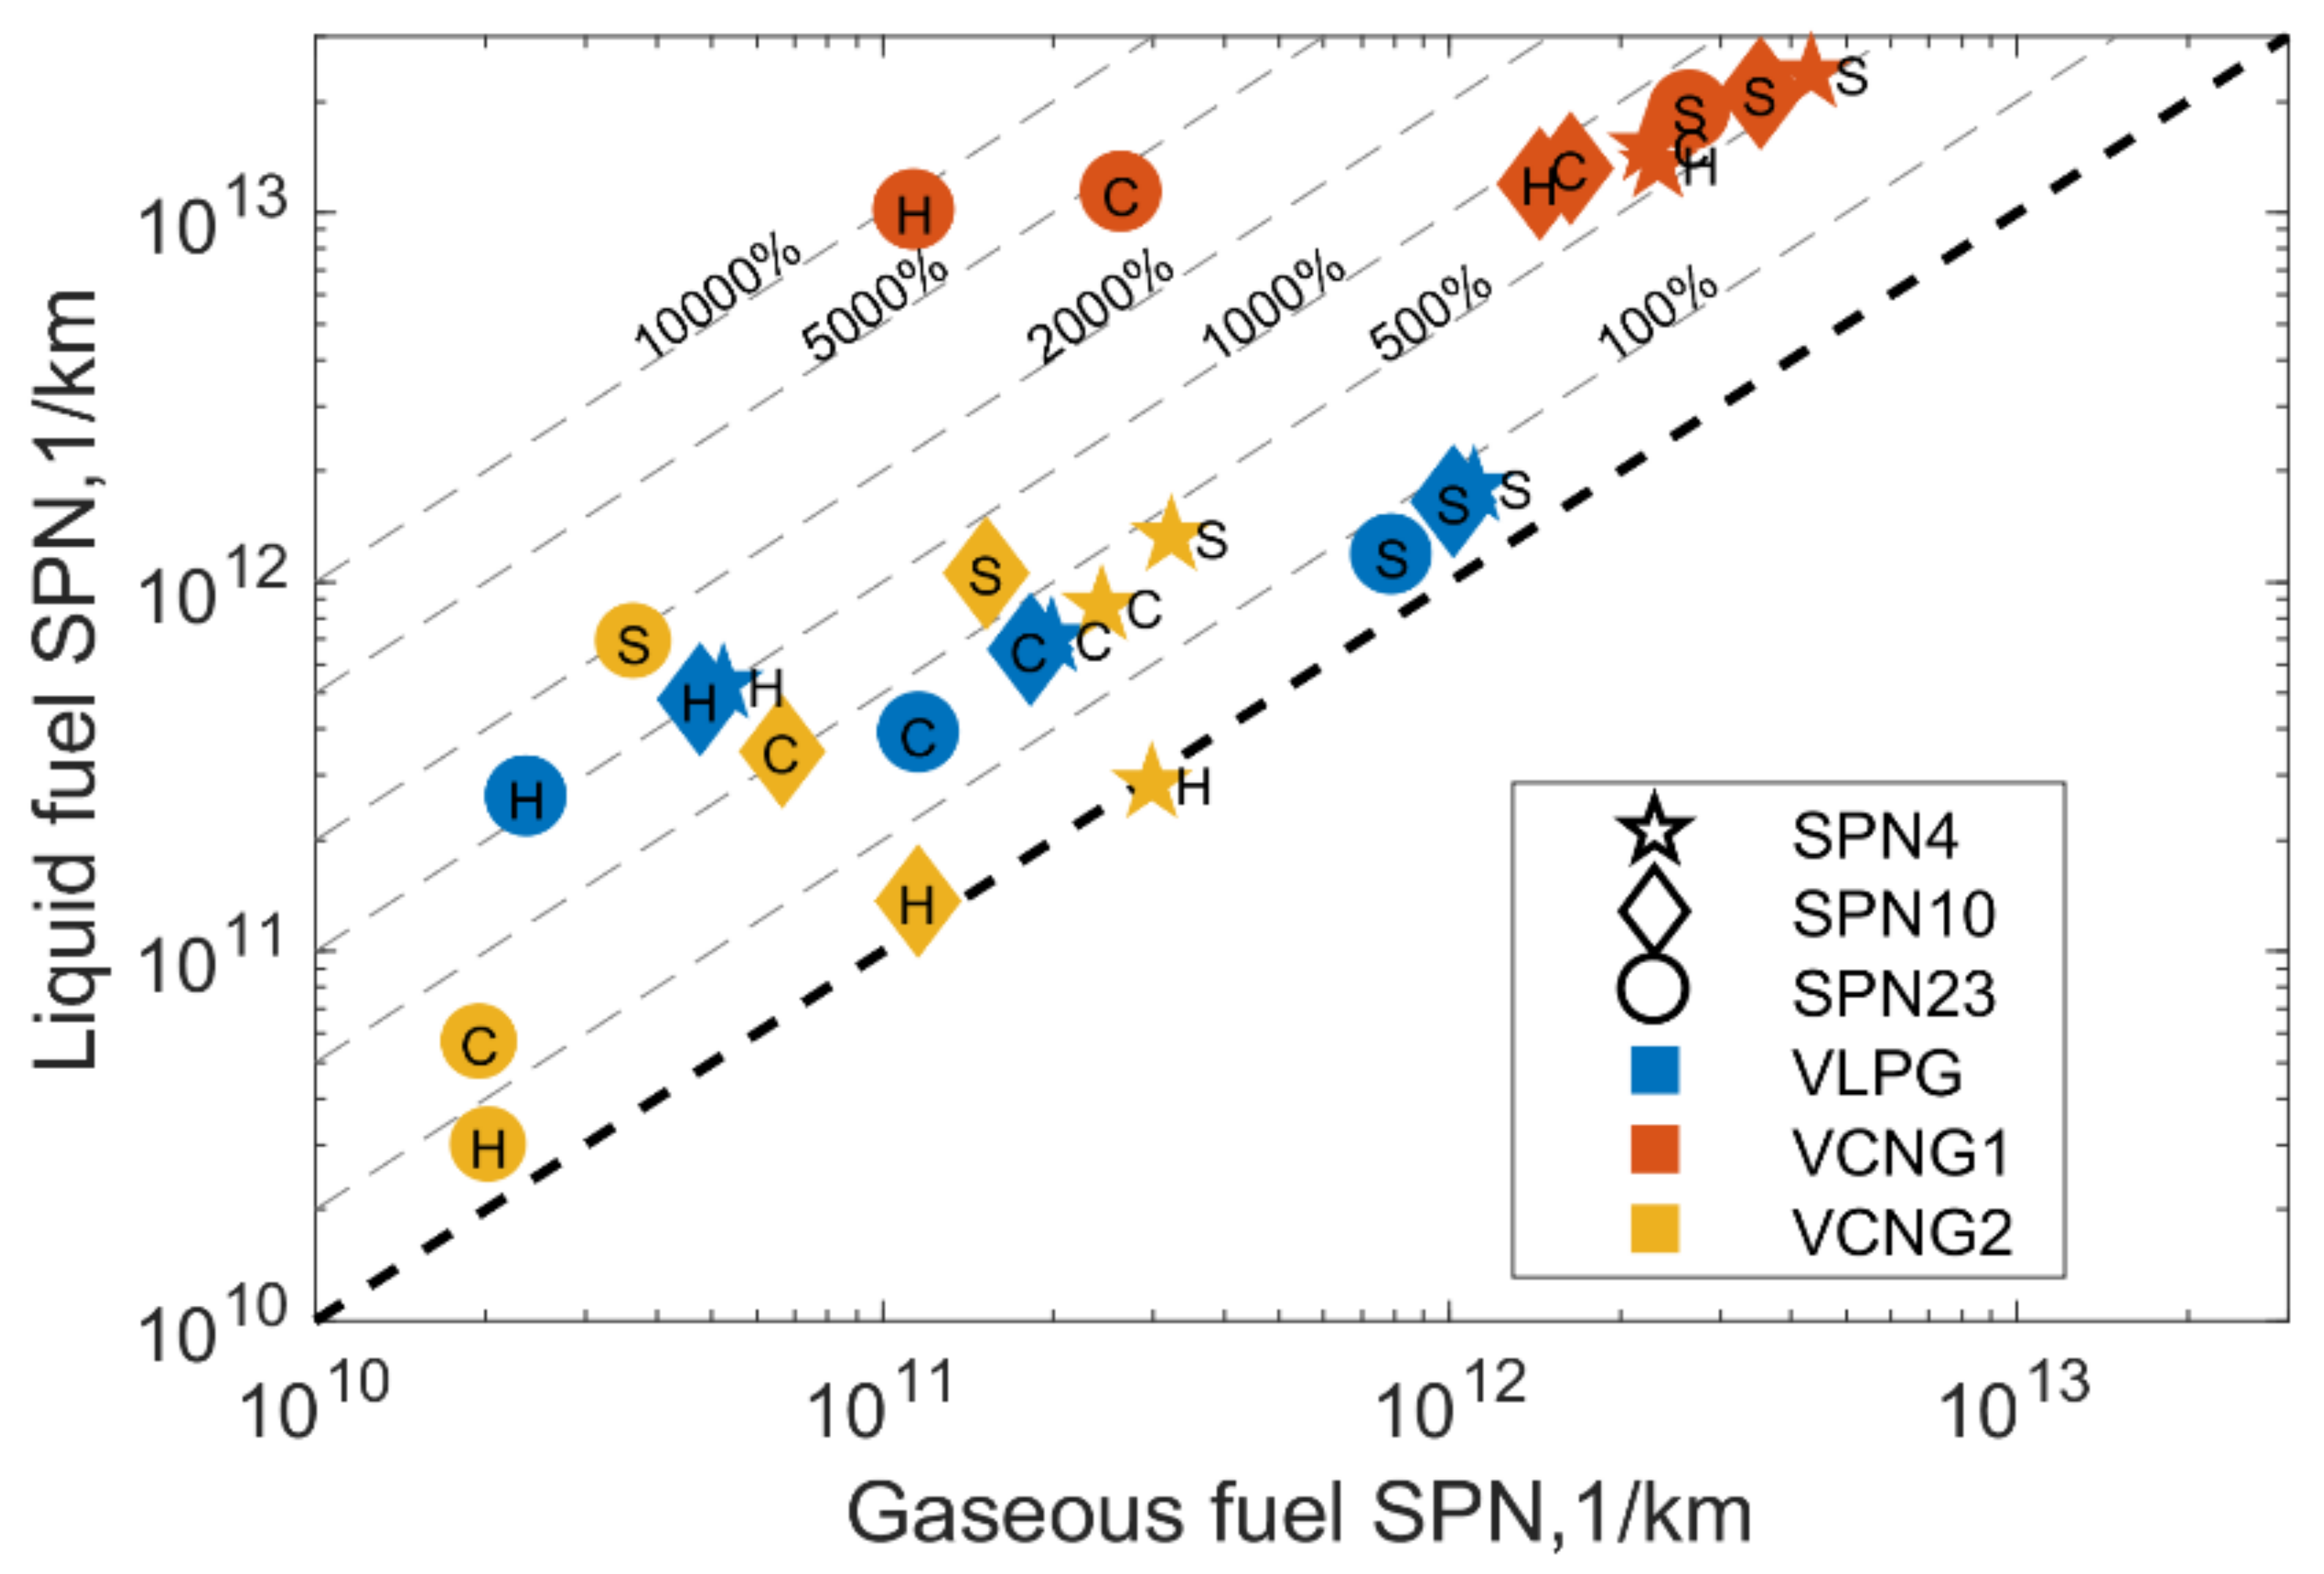
3.3. Comparison of Emissions in Gaseous and Liquid Fuel Operations

Figure 3 compares the SPN emissions in liquid and gaseous operation.
In general, SPN emissions in the gasoline operation were higher than the emissions in gaseous fuel operation, except VCNG2 SPN4 in hot start WLTC. For VCNG2, fuel change induced the highest change on sub-zero test where gasoline operation SPN23 was 1800% higher than the gaseous mode emission. The excess of liquid fuel operation SPN10 was around 600% and SPN4 around 300% in the same test. At 23 °C, VCNG2 SPN excess in gasoline operation over the CNG operation was smaller.
For VCNG1, SPN23 emissions in gasoline operation were over 8000% higher in hot start cycle, over 4000% in room temperature cold start and around 600% higher in sub-zero test than in corresponding tests in gaseous operation mode. The SPN10 emissions were 500% to 700% higher in the tests with gasoline than with CNG, while for SPN4, the excess was around 450% to 580%.
For VLPG, all SPN increased around 900% to 1000% in hot start cycles, around 250% in room temperature cold start cycles and around 40% to 60% in sub-zero tests.

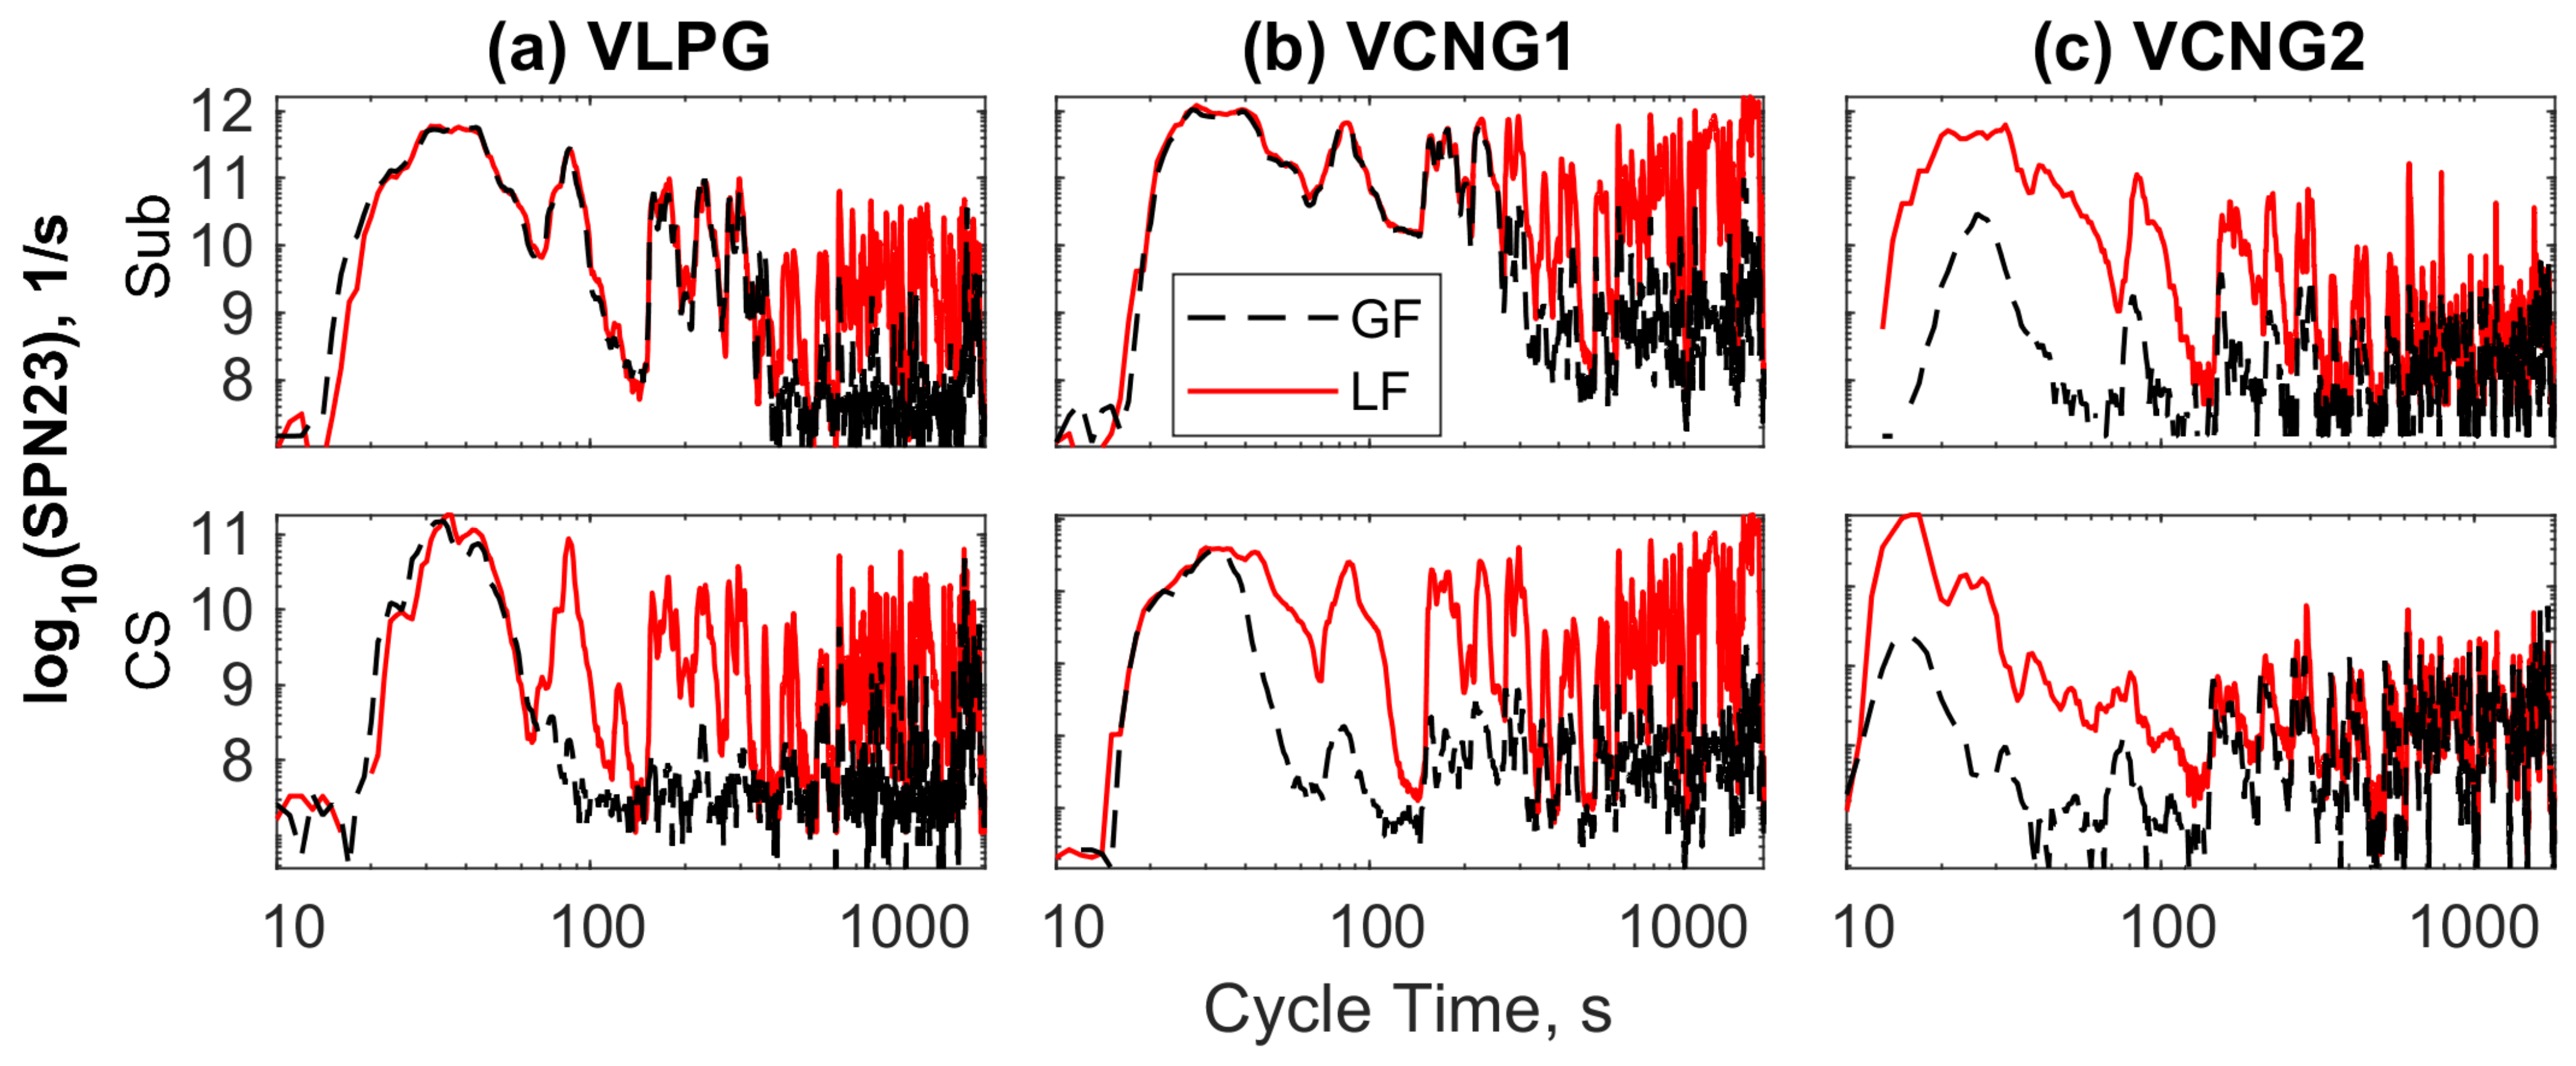
3.4. Fuel Switch Over

The vehicles applying both gaseous and liquid fuel use liquid fuel often in engine start up. The mono fuel vehicles, such as VCNG2, applying primarily gaseous fuel and gasoline only as a secondary fuel are allowed in the regulation to apply the secondary fuel only in start-up of the engine [50] while for bi-fuel vehicles there are no restrictions. Here, fuel switch over time was estimated by the deviation of the real time traces of SPN23 for the two different fuels. The results were confirmed with the CO2 signals. The presumption was that both CO2 and SPN23 are higher for gasoline operation than for CNG or LPG operation.
Figure 4 shows an example of SPN23 time series for VLPG (Figure 4a, upper panel), VCNG1 (Figure 4b, upper panel) and VCNG2 (Figure 4c, upper panel) measured with gasoline (liquid) fuel (LF) and gaseous fuel (GF) over sub-zero test cycles (from 10 s due to the time delay to reach the dilution tunnel). The respective examples for the 23 °C tests are given in the lower panels. For VLPG and VCNG1, it is clear that the traces of SPN23 overlap until the switch over time. For VLPG, clear departure of the traces between the different fuels was detected at around 65 s for the 23 °C cold start test and 365 s for the sub-zero tests. For VCNG1, 23 °C cold start WLTP-cycles, the estimated switch over time was around 35–40 s, but for the sub-zero condition test, is already as high as 275–280 s. For VCNG2 in the gaseous modality, SPN23 is somewhat lower than gasoline over the whole cycle. For VCNG2, a clear switch over was not detected, but the CNG operation traces for CO2 and SPN23 were below gasoline operation over the whole cycles.
The contribution of the start-up emissions with liquid fuel in gaseous mode operation was estimated using the previously mentioned times. The start-up emissions of VCNG1 were about 70% and 90% of whole cycle SPN23 for cold start and sub-zero tests, respectively. In gasoline operation, for the same start-up period (35 s and 276 s for sub-zero) the respective percentages were 2% and 15%. For SPN4 and SPN10 (no figure shown), the proportions were lower, yet in sub-zero test in gaseous fuel modality, close to 70% of SPN4 and SPN10 was emitted during start-up period, while in selected liquid fuel modality, around 15% of total SPN4 and SPN10 was emitted during the same period. For VLPG, around 60% of SPN (all size fractions) was emitted during the first 65 s in 23 °C cold start test and around 95% during the start-up period of 366 s in the sub-zero test in gaseous fuel mode. For VLPG, gasoline operation modality, in the 23 °C temperature cold start, 19% to 24% of SPN was emitted during the first 65 s and in sub-zero around 60% to 70% during the first 366 s.
For VCNG1, the sub23-10 was 22% during the start-up period (35 s) of the cold start test (both operation modes). In liquid operation, this percentage remained the same at the rest of the cycle, but at gaseous operation sub23-10 increased to 1200% after the switch over. Simultaneously, average SPN23 levels were more than 10 times higher in gasoline operation than in gaseous fuel operation after the switch over. At the sub-zero test, sub23-10 percentage during the start-up period (280 s) was 13% and increased to 37% in gaseous operation. The fuel switch over did not have notable effect on sub23-10 for VLPG.

4. Discussion

Two bi-fuel, one CNG-gasoline (VCNG1) and one LPG-gasoline (VLPG) vehicle and one mono-fuel gas vehicle, CNG-gasoline, (VCGN2) were studied at 23 °C and in sub-zero (−7 °C) temperatures. It must be mentioned again that the SPN23 limit of 6 × 10 11 1/km for direct injection engines does not apply to the tested vehicles in regulatory measurements but it is considered here to provide context for the results.
The vehicles appeared as low SPN emitters only when SPN23 in 23 °C testing conditions in gaseous fuel operation modality was considered. In agreement with our results, in the literature, 23 °C test SPN23 emissions of CNG and LPG fuelled PFI vehicles over various test cycles are repeatedly shown to be below the direct injection vehicle SPN-limit of 6 × 10 11 1/km [10,11,12,13,45,51].
Studies with recent emission standard (Euro 6) CNG fuelled vehicles, reported SPN10 mostly below the limit and only occasionally at the limit, while SPN2.5 was above 6 × 10 11 1/km [12,13,15], similar to results presented here. To our knowledge, there are no previous studies presenting <23 nm SPN results for LPG. Here, LPG fuelled vehicle <23 nm SPN remained in most of the tests below 6 × 10 11 1/km, except for the sub-zero tests, where the emissions were around 1 × 10 12 1/km.

4.1. Operation with Gasoline Fuel

The gasoline operation mode induced increase in SPN emissions when compared to gaseous fuel operation modality in most of the tests. The SPN increase between gasoline and gaseous fuel was most distinct for CNG bi-fuel vehicle for which around 8000% increase was detected in hot start WLTC. For the other cold start tests and the mono-fuel CNG and LPG vehicles, the increase was lower, yet often notable and varying in the range from 0% to 2000%. For bi-fuel vehicles, the difference was the highest in hot start tests and lowest in sub-zero tests, while for the mono fuel gas vehicle, the trend was opposite, i.e., the difference between gasoline and gaseous fuel SPN was increasing with decreasing test temperature. In the literature, mono fuel gas vehicle (CNG) SPN23 levels of are shown to increase 400% to 3500% in 23 °C tests when changing to gasoline from CNG and the SPN23 levels remained below 6 × 10 11 1/km similar to our results [13]. For SPN10, gasoline operation emission levels differed −40% to 3300% CNG operation levels in 23 °C tests while SPN10 were around 6 × 10 11 1/km [13,15]. For SPN2.5, the change between the fuel types is shown to be lower, around 0% to 400% higher with gasoline than with CNG in 23 °C tests when SPN2.5 was around ~ 10 11 10 12 1/km [13]. The literature is lacking information about the differences of SPN between the different fuels for PFI bi-fuel vehicles applying CNG-gasoline or LPG-gasoline fuel combinations. Nevertheless, gasoline PFI vehicles are shown to have notable SPN emissions, both above and below 23 nm [18], thus supporting our results and highlighting the need of SPN control for the vehicle type.

4.2. Sub-Zero Temperature

All tested vehicles’ SPN emissions in all size fractions were higher in sub-zero cold start than in 23 °C cold start tests. For bi-fuel vehicles in gaseous fuel operation, the sub-zero condition SPN23 exceeded 23 °C cold start levels for the vehicles by 500% to 900% and reached the levels around or above 10 12 1/km. At the same time, the sub10-4 and sub23-10 fractions decreased below 20% and 30%, respectively. In addition, mono fuel gas vehicle SPN in CNG operation increased in sub-zero condition when compared to 23 °C levels. The CNG combustion characteristics and the particle formation tendency is shown to be dependent on the engine (coolant) temperature although no indication of soot formation is detected [52]. Despite being different to bi-fuel vehicles, mono fuel gas vehicle emissions remained below 6 × 10 11 1/km in sub-zero gaseous fuel operation and the sub23-10 and sub10-4 fractions at the level of 23 °C tests. In sub-zero tests, loss corrected SPN4 for the mono fuel gas vehicle (CNG operation) reached the levels above 6 × 10 11 1/km. The literature is lacking regarding the effect of sub-zero temperature conditions on sub-23 nm SPN emissions in PFI vehicles in the case of CNG and LPG fuels and also SPN23 data are scarce [44].
The difference between 23 °C and sub-zero cold start tests was lower for bi-fuel vehicles in gasoline operation than in gaseous fuel operation, but for the mono fuel vehicle, the difference was higher, reaching over 1000% for SPN23. The literature is lacking regarding sub-zero test SPN < 23 for vehicles applying both gaseous and liquid fuel, but typical gasoline vehicle SPN23 emissions, both PFI and GDI, are shown to increase with decreasing temperature conditions in the literature [18,53,54,55,56,57,58]. This increase is often associated with fuel enrichment at the start-up of the engine and the enhanced soot formation [59,60].
The increase of bi-fuel vehicles’ SPN in gaseous fuel operation sub-zero conditions may be explained by the detected long warm-up period, ~300 s, in the beginning of the test where gasoline is used as a fuel. For the bi-fuels vehicles, over 90% of the SPN23 of the whole sub-zero cycle was emitted during the warm-up period with gasoline fuel. Higher particle emissions with gasoline fuel compared to CNG or LPG operation has also been shown in the literature [3,13,46,51,61,62,63,64,65]. This feature explains also why the difference between gasoline and gaseous fuel operation decreases with decreasing temperature: gasoline fuel related SPN dominate the overall emission in both operation modalities. The extended warm up with gasoline, diminishes the low exhaust emissions of CNG and LPG operation of bi-fuel vehicles.
The bi-fuel CNG vehicle appeared as a high emitter in 10–23 nm size range (SPN10-SPN23) and in >23 nm size range, in sub-zero conditions and in gasoline operation. Yet, as the vehicle emissions were stable and as the PFI technology SPN is not regulated, the results are presented here to show an example of a current light duty fleet high emitter. The cause for the high emissions of VCNG1 is not known. Yet, SPN of CNG fuelled ship engine in range from 10 nm to 30 nm to lubricant originated particles and the SPN above 60 nm to soot formed in fuel rich conditions [23,60]. Thus, the high emissions may be related to both lubricant as well as on sooting combustion.

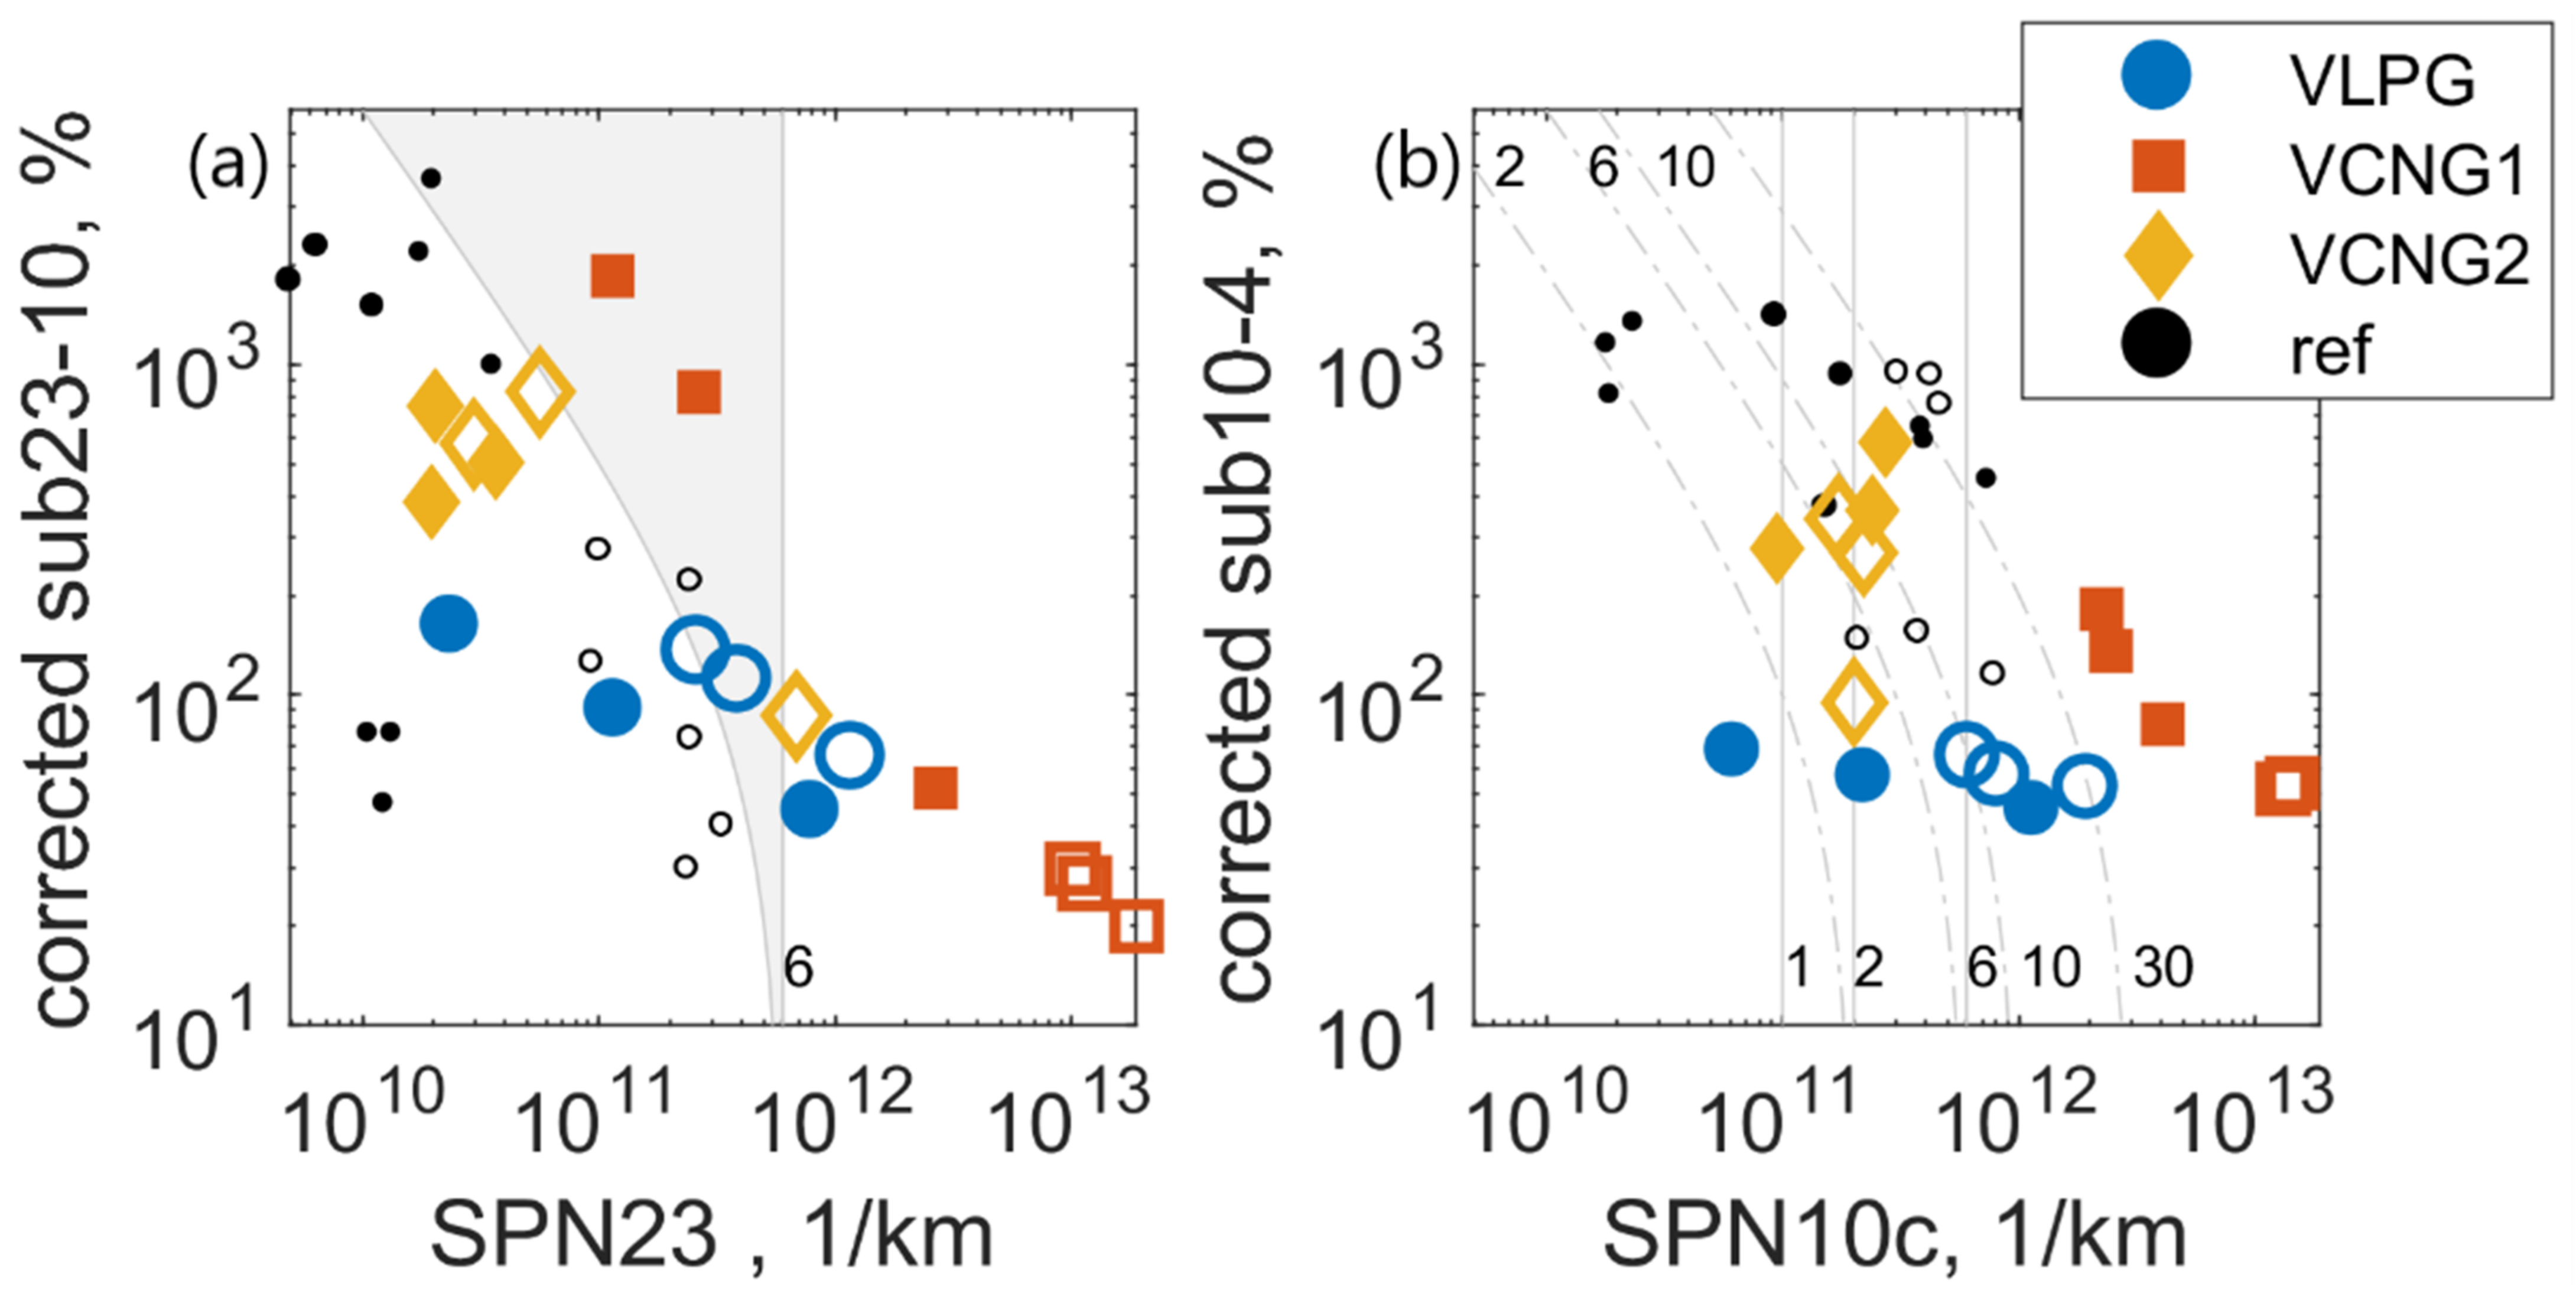
4.3. Sub-23 nm Particle Emissions

The measurements revealed a high fraction of particles below 23 nm and even 10 nm rendering important to assess the current SPN23 methodology. Figure 5a shows the sub23-10 for uncorrected SPN10 as a function SPN23. Thus, the graph compares the current regulation SPN23 and the future SPN10 methodologies. In general, there is a decreasing trend for the sub23-10 along with increasing SPN23 reaching around 10% at 10 13 1/km, but the gradient depends on the vehicle and fuel.
The curved boundary of the shaded area shows the limit where SPN10 exceeds 6 × 10 11 1/km, while vertical boundary is at SPN23 = 6 × 10 11 1/km. Within this grey area a result would fulfil the limit with the SPN23 method, but not with the SPN10 method.
VCNG1 gaseous (CNG) operation 23 °C tests and VLPG gasoline operation cold start 23 °C test SPN10 exceed the DI SPN-limit, while SPN23 is below the limit. From 18 tests, three tests fell in this area, indicating that the current methodology would miss ~16% of a relatively high emitting vehicle. VCNG2 SPN10, although having rather high sub23-10 fraction up to 520%, falls clearly below the DI SPN limit in all cases, thus also suggesting low emission levels with the upcoming SPN10 method. Similar SPN10-SPN23 relation can be seen for a couple of measurements taken from the literature [13]; however, there, the sub23-10 data is loss corrected. Nevertheless, as in our uncorrected data, the high sub23-10 fraction at the SPN23 levels around 10 10 1/km is connected mostly to moderate SPN10 (< 6 × 10 11 1/km) emissions.
Figure 5b shows sub10-4 fractions for loss corrected SPN4c as a function of SPN10. Sub10-4 represents the size fraction not covered with the future 10 nm SPN-method. The grey vertical lines show the SPN10 levels and dash-dotted curved lines the SPN4c levels specified by the data labels (2, 6, 10 and 30 which refer to emission level multiples of 10 11 1/km). Note that data acquired from the literature (ref) [13] refer to loss corrected sub10-2.5 instead of sub10-4. Sub10-4 decreases with increasing SPN10 for vehicles applying CNG as gaseous fuel, while VLPG Sub10-4 is rather stable in the detected SPN10 range.
Considering the SPN10 limits that would restrain the SPN4c levels below 6 × 10 11 1/km, SPN10 limit at 1 × 10 11 1/km would remove 94% of the observed SPN4c above 6 × 10 11 1/km and SPN10 limit at 2 3 × 10 11 1/km 75%. For the SPN2.5 data from the literature [13], the proportions were similar. In the literature [13], the SPN10 limits at 1, 2 and 3 × 10 11 1/km, would limit out 81%, 69% and 63% of SPN2.5 above 6 × 10 11 1/km, respectively.
The excess of SPN10 over SPN23 (sub23-10) showed a decreasing trend along increasing SPN23 emissions. Similar results are shown for gasoline and diesel light-duty vehicles before [18]. When the upcoming SPN10 method is considered, the detected high sub23-10 fractions did not lead directly to high SPN10 emissions. For example, VCNG2 sub23-10 fractions reached levels of 400%, yet the absolute level of SPN10 remained below 6 × 10 11 1/km. In other words, the current SPN23 method could identify most of tests with SPN10 emissions higher than 6 × 10 11 1/km. Nevertheless, for bi-fuel vehicles the SPN10 emissions were in some tests above 10 12 1/km, while SPN23 was below the DI SPN limit and, thus, the high SPN emission may be detected with the recently introduced SPN-method, not with the method applied in the current European regulation. Thus, regulating SPN10 instead of SPN23 with the same limit increases the stringency particularly for gas-fueled vehicles with high sub-23 nm fraction. The loss corrected SPN4 levels, however, could easily reach 10 12 1/km, while SPN10 was around 6 × 10 11 1/km. We believe that these particles are true and not an artefact, because we used systems with a catalytic stripper [48]. If the current DI SPN limit of 6 × 10 11 1/km is considered also for the tested PFI vehicles’ <23 nm SPN, according to the data presented here, the SPN10 should be limited to 1 × 10 11 1/km to restrict the SPN4 emissions below the current DI SPN limit. Nevertheless, the <10 nm SPN emission characteristics should be studied further to ensure the findings. At this stage, the literature is lacking regarding the SPN4 measurement reproducibility, exact losses of the particle sizes <10 nm and the stability of the vehicle when it comes to SPN4 emissions. Thus, the limit of 1 × 10 11 1/km may not be considered as a recommendation of a regulatory limit, but it is only deduced from the measurement data presented here. It indicates though that a 10 nm limit might also control efficiently high sub-10 nm emissions.
Figure 5, with the corrected values, is given in the Appendix A (Figure A1). Even though the results in this figure are more accurate, the need for many counters to correct the results makes it impossible for regulatory purposes. Using one counter in the future regulations means that the results will be uncorrected.

5. Conclusions

The solid particle number (SPN) emissions of bi-fuel vehicles varied significantly between different vehicle models. Although none of them exceeded the (non-applicable) current European SPN limit for particles >23 nm, the inclusion of particles >10 nm exceeded the limit for one of the three vehicles. At low ambient temperature tests (−7 °C), two of the three vehicles exceeded the limit and all of them when particles below 23 nm were considered. The emissions of the LPG vehicle remained low. In general, the CNG operation had high concentration of particles <23 nm (two to 10 times more). The gasoline operation of the three vehicles resulted in exceeding the SPN limit in one case and in all cases when sub-23 nm particles were considered. Furthermore, all tests at −7 °C exceeded the SPN limit, even when considering only particles >23 nm. The sub-23 nm fraction was vehicle dependent (for all temperatures), ranging from 20% for the high emitting CNG vehicle, 70% for the second CNG vehicle and 300% for the LPG vehicle (in gasoline operation). The gasoline operation increased the emissions up to 100 times compared to the gaseous fuel. It was shown that decreasing the lower limit of 23 nm of the current regulation increases the stringency significantly for gaseous fuel vehicles. Lowering the >10 nm limit to 1 × 10 11 1/km significantly reduces the sub-10 nm emissions as well.

Supplementary Materials

The following are available online at https://www.mdpi.com/article/10.3390/atmos12070893/s1, Table S1. Solid particle number, SPN4, SPN10 and SPN23, emissions, with and without loss correction, of the three vehicles VLPG, VCNG1 and VCNG2 for 23 °C hot start (HOT), 23 °C cold start (COLD) and sub-zero (SUB) cold start WLTC for gaseous fuel operation. Also excess of SPN4 over SPN10 (sub10-4) and SPN10 over SPN23 (sub23-10) with and without loss correction, Table S2. Solid particle number, SPN4, SPN10 and SPN23, emissions, with and without loss correction, of the three vehicles VLPG, VCNG1 and VCNG2 for 23 °C hot start (HOT), 23 °C cold start (COLD) and sub-zero (SUB) cold start WLTC for gasoline operation. Also excess of SPN4 over SPN10 (sub10-4) and SPN10 over SPN23 (sub23-10) with and without loss correction.

Author Contributions

Conceptualization, T.L. and B.G.; formal analysis, T.L.; writing—original draft preparation, T.L.; writing—review and editing, B.G. and T.L. Both authors have read and agreed to the published version of the manuscript.

Funding

This research received no external funding.

Institutional Review Board Statement

Not applicable.

Informed Consent Statement

Not applicable.

Data Availability Statement

Data available upon request from corresponding author.

Acknowledgments

The authors would like to acknowledge the technical staff of VELA. P. Le Lijour, M. Sculati, M. Cadario, A. Migneco, C. Ferrarese and D. Lesueur for the technical support.

Conflicts of Interest

The authors declare no conflict of interest.

Appendix A

Particle fractions below 23 nm corrected for particle losses.
Figure A1. Particle fractions below 23 nm. Data measured with gaseous fuels is presented with filled markers and data for liquid (gasoline) with open markers; (a) sub23-10 fraction for corrected SPN10 as a function of SPN23. Shaded area marks data for which SPN10 is above limit 6 × 10 11 1/km, while SPN23 is below the limit; (b) sub10-4 fraction for corrected SPN4 and SPN10 as a function of corrected SPN10. Grey vertical lines show SPN10c levels and curved, dash-dotted lines SPN4c levels. Labels 1, 2, 6, 10 and 30 refer to emission level multiples of 10 11 1/km. Data labelled ref is acquired from literature [13] and represents in left axes corrected sub23-10 and in right axes corrected sub10-2.5 levels instead of sub10-4.
Atmosphere 12 00893 g0a1

References

  1. European Parliament and Council. Directive 2003/30/EC of the European Parliament and of the Council of 8 May 2003 on the Promotion of the Use of Biofuels or Other Renewable Fuels for Transport. Off. J. Eur. Union 2003, 123, 1–42. [Google Scholar]
  2. EAFO European Alternative Fuels Observatory. Available online: https://www.eafo.eu/ (accessed on 27 October 2020).
  3. Bae, C.; Kim, J. Alternative Fuels for Internal Combustion Engines. Proc. Combust. Inst. 2017, 36, 3389–3413. [Google Scholar] [CrossRef]
  4. Chala, G.T.; Abd Aziz, A.R.; Hagos, F.Y. Natural Gas Engine Technologies: Challenges and Energy Sustainability Issue. Energies 2018, 11, 2934. [Google Scholar] [CrossRef] [Green Version]
  5. Kakaee, A.-H.; Paykani, A.; Ghajar, M. The Influence of Fuel Composition on the Combustion and Emission Characteristics of Natural Gas Fueled Engines. Renew. Sustain. Energy Rev. 2014, 38, 64–78. [Google Scholar] [CrossRef]
  6. Morganti, K.J.; Foong, T.M.; Brear, M.J.; da Silva, G.; Yang, Y.; Dryer, F.L. The Research and Motor Octane Numbers of Liquefied Petroleum Gas (LPG). Fuel 2013, 108, 797–811. [Google Scholar] [CrossRef]
  7. Winkel, R.; Hamelinck, C.; Bardout, M.; Bucquet, C.; Ping, S.; Cuijpers, M.; Artuso, D.; Bonafede, S. Alternative Fuels and Infrastructure in Seven Non-EU Markets; Publications Office of the European Union: Luxembourg, 2016. [Google Scholar]
  8. Demirbas, A. Fuel Alternatives to Gasoline. Energy Sources Part B Econ. Plan. Policy 2007, 2, 311–320. [Google Scholar] [CrossRef]
  9. Giechaskiel, B.; Woodburn, J.; Szczotka, A.; Bielaczyc, P. Particulate Matter (PM) Emissions of Euro 5 and Euro 6 Vehicles Using Systems with Evaporation Tube or Catalytic Stripper and 23 nm or 10 nm Counters; SAE Tech. Pap. 2020-01-2203; SAE International: Warrendale, PA, USA, 2020. [Google Scholar] [CrossRef]
  10. Myung, C.L.; Lee, H.; Choi, K.; Lee, Y.J.; Park, S. Effects of Gasoline, Diesel, LPG, and Low-Carbon Fuels and Various Certification Modes on Nanoparticle Emission Characteristics in Light-Duty Vehicles. Int. J. Automot. Technol. 2009, 10, 537–544. [Google Scholar] [CrossRef]
  11. Schreiber, D.; Forss, A.-M.; Mohr, M.; Dimopoulos, P. Particle Characterisation of Modern CNG, Gasoline and Diesel Passenger Cars; SAE Tech. Pap. 2007-24-0123; SAE International: Warrendale, PA, USA, 2007. [Google Scholar] [CrossRef] [Green Version]
  12. Giechaskiel, B.; Lähde, T.; Drossinos, Y. Regulating Particle Number Measurements from the Tailpipe of Light-Duty Vehicles: The next Step? Environ. Res. 2019, 172, 1–9. [Google Scholar] [CrossRef]
  13. Toumasatos, Z.; Kontses, A.; Doulgeris, S.; Samaras, Z.; Ntziachristos, L. Particle Emissions Measurements on CNG Vehicles Focusing on Sub-23nm. Aerosol Sci. Technol. 2020, 55, 182–193. [Google Scholar] [CrossRef]
  14. Giechaskiel, B.; Lahde, T.; Suarez-Bertoa, R.; Clairotte, M.; Grigoratos, T.; Zardini, A.; Perujo, A.; Martini, G. Particle Number Measurements in the European Legislation and Future JRC Activities. Combust. Engines 2018, 174, 3–16. [Google Scholar] [CrossRef]
  15. Dimopoulos Eggenschwiler, P.; Schreiber, D.; Schröter, K. Characterization of the Emission of Particles Larger than 10 Nm in the Exhaust of Modern Gasoline and CNG Light Duty Vehicles. Fuel 2021, 291, 120074. [Google Scholar] [CrossRef]
  16. NGVA Europe VEHICLE CATALOGUE. 2019. Available online: https://www.ngva.eu/wp-content/uploads/2019/09/NGVAEurope_VehicleCatalogue_Sep2019.pdf (accessed on 9 July 2021).
  17. European Parliament and Council. EC-2017/1151 Commission Regulation (EU) 2017/1151 of 1 June 2017 Supplementing Regulation (EC) No 715/2007 of the European Parliament and of the Council on Type-Approval of Motor Vehicles with Respect to Emissions from Light Passenger and Commercial Vehicles (Euro 5 and Euro 6) and on Access to Vehicle Repair and Maintenance Information. Off. J. Eur. Union 2017, 60, 1–732. [Google Scholar]
  18. Giechaskiel, B.; Joshi, A.; Ntziachristos, L.; Dilara, P. European Regulatory Framework and Particulate Matter Emissions of Gasoline Light-Duty Vehicles: A Review. Catalysts 2019, 9, 586. [Google Scholar] [CrossRef] [Green Version]
  19. Mamakos, A.; Dardiotis, C.; Martini, G. Assessment of Particle Number Limits for Petrol Vehicles. In JRC Scientific and Policy Reports; Publications Office of the European Union: Luxembourg, 2012. [Google Scholar]
  20. Giechaskiel, B.; Mamakos, A.; Andersson, J.; Dilara, P.; Martini, G.; Schindler, W.; Bergmann, A. Measurement of Automotive Nonvolatile Particle Number Emissions within the European Legislative Framework: A Review. Aerosol Sci. Technol. 2012, 46, 719–749. [Google Scholar] [CrossRef]
  21. Giechaskiel, B.; Vanhanen, J.; Väkevä, M.; Martini, G. Investigation of Vehicle Exhaust Sub-23 Nm Particle Emissions. Aerosol Sci. Technol. 2017, 51, 626–641. [Google Scholar] [CrossRef] [Green Version]
  22. Alanen, J.; Saukko, E.; Lehtoranta, K.; Murtonen, T.; Timonen, H.; Hillamo, R.; Karjalainen, P.; Kuuluvainen, H.; Harra, J.; Keskinen, J.; et al. The Formation and Physical Properties of the Particle Emissions from a Natural Gas Engine. Fuel 2015, 162, 155–161. [Google Scholar] [CrossRef]
  23. Alanen, J.; Isotalo, M.; Kuittinen, N.; Simonen, P.; Martikainen, S.; Kuuluvainen, H.; Honkanen, M.; Lehtoranta, K.; Nyyssönen, S.; Vesala, H.; et al. Physical Characteristics of Particle Emissions from a Medium Speed Ship Engine Fueled with Natural Gas and Low-Sulfur Liquid Fuels. Environ. Sci. Technol. 2020, 54, 5376–5384. [Google Scholar] [CrossRef]
  24. Giechaskiel, B. Differences between Tailpipe and Dilution Tunnel Sub-23 Nm Nonvolatile (Solid) Particle Number Measurements. Aerosol Sci. Technol. 2019, 53, 1012–1022. [Google Scholar] [CrossRef] [Green Version]
  25. Giechaskiel, B.; Lähde, T.; Schwelberger, M.; Kleinbach, T.; Roske, H.; Teti, E.; van den Bos, T.; Neils, P.; Delacroix, C.; Jakobsson, T.; et al. Particle Number Measurements Directly from the Tailpipe for Type Approval of Heavy-Duty Engines. Appl. Sci. 2019, 9, 4418. [Google Scholar] [CrossRef] [Green Version]
  26. Tabata, K.; Takahashi, M.; Takeda, K.; Tsurumi, K.; Kiya, Y.; Tobe, S.; Ogura, A. Studies on Characteristics of Nanoparticles Generated in a Gasoline Direct-Injection Engine; SAE Tech. Pap. 2019-01-2328; SAE International: Warrendale, PA, USA, 2019. [Google Scholar] [CrossRef]
  27. Kuuluvainen, H.; Karjalainen, P.; Saukko, E.; Ovaska, T.; Sirviö, K.; Honkanen, M.; Olin, M.; Niemi, S.; Keskinen, J.; Rönkkö, T. Nonvolatile Ultrafine Particles Observed to Form Trimodal Size Distributions in Non-Road Diesel Engine Exhaust. Aerosol Sci. Technol. 2020, 54, 1345–1358. [Google Scholar] [CrossRef]
  28. Sgro, L.A.; Sementa, P.; Vaglieco, B.M.; Rusciano, G.; D’Anna, A.; Minutolo, P. Investigating the Origin of Nuclei Particles in GDI Engine Exhausts. Combust. Flame 2012, 159, 1687–1692. [Google Scholar] [CrossRef]
  29. Abdul-Khalek, I.S.; Kittelson, D.B.; Graskow, B.R.; Wei, Q.; Bear, F. Diesel Exhaust Particle Size: Measurement Issues and Trends; SAE Tech. Pap. 980525; SAE International: Warrendale, PA, USA, 1998. [Google Scholar] [CrossRef]
  30. Lee, D.; Miller, A.; Kittelson, D.; Zachariah, M.R. Characterization of Metal-Bearing Diesel Nanoparticles Using Single-Particle Mass Spectrometry. J. Aerosol Sci. 2006, 37, 88–110. [Google Scholar] [CrossRef]
  31. Dobbins, R.A. Hydrocarbon Nanoparticles Formed in Flames and Diesel Engines. Aerosol Sci. Technol. 2007, 41, 485–496. [Google Scholar] [CrossRef] [Green Version]
  32. Filippo, A.D.; Maricq, M.M. Diesel Nucleation Mode Particles: Semivolatile or Solid? Environ. Sci. Technol. 2008, 42, 7957–7962. [Google Scholar] [CrossRef]
  33. Neoh, K.G.; Howard, J.B.; Sarofim, A.F. Effect of Oxidation on the Physical Structure of Soot. Symp. Combust. 1985, 20, 951–957. [Google Scholar] [CrossRef]
  34. Donaldson, K.; Tran, L.; Jimenez, L.; Duffin, R.; Newby, D.; Mills, N.; MacNee, W.; Stone, V. Combustion-Derived Nanoparticles: A Review of Their Toxicology Following Inhalation Exposure. Part. Fibre Toxicol. 2005, 2, 10. [Google Scholar] [CrossRef] [Green Version]
  35. Lin, C.-C.; Chen, S.-J.; Huang, K.-L.; Lee, W.-J.; Lin, W.-Y.; Tsai, J.-H.; Chaung, H.-C. PAHs, PAH-Induced Carcinogenic Potency, and Particle-Extract-Induced Cytotoxicity of Traffic-Related Nano/Ultrafine Particles. Environ. Sci. Technol. 2008, 42, 4229–4235. [Google Scholar] [CrossRef]
  36. Lindner, K.; Ströbele, M.; Schlick, S.; Webering, S.; Jenckel, A.; Kopf, J.; Danov, O.; Sewald, K.; Buj, C.; Creutzenberg, O.; et al. Biological Effects of Carbon Black Nanoparticles Are Changed by Surface Coating with Polycyclic Aromatic Hydrocarbons. Part. Fibre Toxicol. 2017, 14, 8. [Google Scholar] [CrossRef]
  37. Duffin, R.; Tran, C.L.; Clouter, A.; Brown, D.M.; MacNee, W.; Stone, V.; Donaldson, K. The Importance of Surface Area and Specific Reactivity in the Acute Pulmonary Inflammatory Response to Particles. Ann. Occup. Hyg. 2002, 46, 242–245. [Google Scholar] [CrossRef]
  38. Li, N.; Sioutas, C.; Cho, A.; Schmitz, D.; Misra, C.; Sempf, J.; Wang, M.; Oberley, T.; Froines, J.; Nel, A. Ultrafine Particulate Pollutants Induce Oxidative Stress and Mitochondrial Damage. Environ. Health Perspect. 2003, 111, 455–460. [Google Scholar] [CrossRef]
  39. Manke, A.; Wang, L.; Rojanasakul, Y. Mechanisms of Nanoparticle-Induced Oxidative Stress and Toxicity. BioMed Res. Int. 2013, 2013, 942916. [Google Scholar] [CrossRef] [PubMed] [Green Version]
  40. Limbach, L.; Wick, P.; Manser, P.; Grass, R.; Bruinink, A.; Stark, W. Exposure of Engineered Nanoparticles to Human Lung Epithelial Cells:  Influence of Chemical Composition and Catalytic Activity on Oxidative Stress. Environ. Sci. Technol. 2007, 41, 4158–4163. [Google Scholar] [CrossRef]
  41. Oberdörster, G. Pulmonary Effects of Inhaled Ultrafine Particles. Int. Arch. Occup. Environ. Health 2000, 74, 1–8. [Google Scholar] [CrossRef]
  42. UNECE. Global Technical Regulation No. 15; Worldwide Harmonized Light Vehicles Test Procedure; UNECE: Geneva, Switzerland, 2020. [Google Scholar]
  43. Lahde, T.; Giechaskiel, B.; Martini, G. Development of Measurement Methodology for Sub 23 nm Particle Number (PN) Measurements; SAE Paper 2020-01-2211; SAE International: Warrendale, PA, USA, 2020. [Google Scholar] [CrossRef]
  44. Aakko-Saksa, P.; Koponen, P.; Roslund, P.; Laurikko, J.; Nylund, N.-O.; Karjalainen, P.; Rönkkö, T.; Timonen, H. Comprehensive Emission Characterisation of Exhaust from Alternative Fuelled Cars. Atmos. Environ. 2020, 236, 117643. [Google Scholar] [CrossRef]
  45. Bielaczyc, P.; Szczotka, A.; Woodburn, J. Regulated and Unregulated Exhaust Emissions from CNG Fueled Vehicles in Light of Euro 6 Regulations and the New WLTP/GTR 15 Test Procedure. SAE Int. J. Engines 2015, 8, 1300–1312. [Google Scholar] [CrossRef]
  46. Saraf, R.R.; Thipse, S.S.; Saxena, P.K. Comparative Assessment on Performance and Emissions of LPG/Gasoline Bi-Fuel Passenger Car PFI Engines; SAE Tech. Pap. 2009-01-1665; SAE International: Warrendale, PA, USA, 2009. [Google Scholar] [CrossRef]
  47. ECE/TRANS. Addendum 15: United Nations Global Technical Regulation No. 15—Amendment 6—Appendix 1; United Nations: Geneva, Switzerland, 2021. [Google Scholar]
  48. Giechaskiel, B.; Melas, A.D.; Lähde, T.; Martini, G. Non-Volatile Particle Number Emission Measurements with Catalytic Strippers: A Review. Vehicles 2020, 2, 342–364. [Google Scholar] [CrossRef]
  49. Giechaskiel, B.; Lähde, T.; Melas, A.D.; Valverde, V.; Clairotte, M. Uncertainty of Laboratory and Portable Solid Particle Number Systems for Regulatory Measurements of Vehicle Emissions. Environ. Res. 2021, 197, 111068. [Google Scholar] [CrossRef]
  50. European Parliament and Council. EC-692/2008 Commission Regulation (EC) No 692/2008 Implementing and Amending Regulation (EC) No 715/2007 of the European Parliament and of the Council on Type-Approval of Motor Vehicles with Respect to Emissions from Light Passenger and Commercial Vehicles (Euro 5 and Euro 6) and on Access to Vehicle Repair and Maintenance Information). Off. J. Eur. Union 2008, 199, 1–136. [Google Scholar]
  51. Dimaratos, A.; Toumasatos, Z.; Doulgeris, S.; Triantafyllopoulos, G.; Kontses, A.; Samaras, Z. Assessment of CO2 and NOx Emissions of One Diesel and One Bi-Fuel Gasoline/CNG Euro 6 Vehicles During Real-World Driving and Laboratory Testing. Front. Mech. Eng. 2019, 5, 62. [Google Scholar] [CrossRef] [Green Version]
  52. Melaika, M.; Etikyala, S.; Dahlander, P. Particulates from a CNG DI SI Engine during Warm-Up; SAE Tech. Pap. 2021-01-0630; SAE International: Warrendale, PA, USA, 2021. [Google Scholar] [CrossRef]
  53. Zhu, R.; Hu, J.; Bao, X.; He, L.; Lai, Y.; Zu, L.; Li, Y.; Su, S. Tailpipe Emissions from Gasoline Direct Injection (GDI) and Port Fuel Injection (PFI) Vehicles at Both Low and High Ambient Temperatures. Environ. Pollut. 2016, 216, 223–234. [Google Scholar] [CrossRef]
  54. Suarez-Bertoa, R.; Astorga, C. Impact of Cold Temperature on Euro 6 Passenger Car Emissions. Environ. Pollut. 2018, 234, 318–329. [Google Scholar] [CrossRef]
  55. Favre, C.; Bosteels, D.; May, J. Exhaust Emissions from European Market-Available Passenger Cars Evaluated on Various Drive Cycles; SAE Tech. Pap. 2013-24-0154; SAE International: Warrendale, PA, USA, 2013. [Google Scholar] [CrossRef] [Green Version]
  56. Mamakos, A.; Martini, G.; Marotta, A.; Manfredi, U. Assessment of Different Technical Options in Reducing Particle Emissions from Gasoline Direct Injection Vehicles. J. Aerosol Sci. 2013, 63, 115–125. [Google Scholar] [CrossRef]
  57. Chan, T.W.; Meloche, E.; Kubsh, J.; Brezny, R. Black Carbon Emissions in Gasoline Exhaust and a Reduction Alternative with a Gasoline Particulate Filter. Environ. Sci. Technol. 2014, 48, 6027–6034. [Google Scholar] [CrossRef] [PubMed]
  58. Chan, T.W.; Meloche, E.; Kubsh, J.; Brezny, R.; Rosenblatt, D.; Rideout, G. Impact of Ambient Temperature on Gaseous and Particle Emissions from a Direct Injection Gasoline Vehicle and Its Implications on Particle Filtration. SAE Int. J. Fuels Lubr. 2013, 6, 350–371. [Google Scholar] [CrossRef]
  59. Roberts, A.; Brooks, R.; Shipway, P. Internal Combustion Engine Cold-Start Efficiency: A Review of the Problem, Causes and Potential Solutions. Energy Convers. Manag. 2014, 82, 327–350. [Google Scholar] [CrossRef] [Green Version]
  60. Kayes, D.; Hochgreb, S. Mechanisms of Particulate Matter Formation in Spark-Ignition Engines. 2. Effect of Fuel, Oil, and Catalyst Parameters. Environ. Sci. Technol. 1999, 33, 3968–3977. [Google Scholar] [CrossRef]
  61. Khan, M.I.; Yasmin, T.; Shakoor, A. Technical Overview of Compressed Natural Gas (CNG) as a Transportation Fuel. Renew. Sustain. Energy Rev. 2015, 51, 785–797. [Google Scholar] [CrossRef]
  62. Semin, R.; Bakar, A. A Technical Review of Compressed Natural Gas as an Alternative Fuel for Internal Combustion Engines. Am. J. Eng. Appl. Sci. 2008, 1, 302–311. [Google Scholar]
  63. Cho, H.M.; He, B.-Q. Spark Ignition Natural Gas Engines—A Review. Energy Convers. Manag. 2007, 48, 608–618. [Google Scholar] [CrossRef]
  64. Bielaczyc, P.; Szczotka, A.; Woodburn, J. A Comparison of Exhaust Emissions from Vehicles Fuelled with Petrol, LPG and CNG. IOP Conf. Ser. Mater. Sci. Eng. 2016, 148, 12060. [Google Scholar] [CrossRef] [Green Version]
  65. Ristovski, Z.D.; Jayaratne, E.R.; Morawska, L.; Ayoko, G.A.; Lim, M. Particle and Carbon Dioxide Emissions from Passenger Vehicles Operating on Unleaded Petrol and LPG Fuel. Sci. Total Environ. 2005, 345, 93–98. [Google Scholar] [CrossRef] [Green Version]
Figure 1. Solid particle number (SPN) emissions of the three vehicles VLPG (top), VCNG1 (middle) and VCNG2 (bottom) for 23 °C hot start (HS), 23 °C cold start (CS) and sub-zero (Sub) cold start WLTC for gaseous fuel operation: (a) SPN4, SPN10 and SPN23 emissions. Black edge bars represent the particle loss corrected values (see Section 2.2). Red dashed lines show the DI vehicle SPN-limit (6 × 10¹¹ 1/km) (not applicable for the vehicles of this study). Black data labels (%) on left columns show the excess of SPN in sub-zero compared to cold start. White data labels show the number of repeats; (b) excess of SPN4 over SPN10 (sub10-4) and SPN10 over SPN23 (sub23-10). Black edge bars represent the excess after particle loss correction. Black data labels (%) show sub10-4 and sub23-10 for uncorrected SPN.
Atmosphere 12 00893 g001
Figure 2. Solid particle number (SPN) emissions of the three vehicles VLPG (top), VCNG1 (middle) and VCNG2 (bottom) for 23 °C hot start (HS), 23 °C cold start (CS) and sub-zero (Sub) cold start WLTC for liquid (gasoline) fuel operation: (a) SPN4, SPN10 and SPN23 emissions. Black edge bars represent the particle loss corrected values (see Section 2.2). Red dashed lines show the DI vehicle SPN-limit (6 × 10¹¹ 1/km) (not applicable for the vehicles of this study). Black data labels (%) on left columns show the excess of SPN in sub-zero compared to cold start. White data labels show the number of repeats; (b) excess of SPN4 over SPN10 (sub10-4) and SPN10 over SPN23 (sub23-10). Black edge bars represent the excess after particle loss correction. Black data labels (%) show sub10-4 and sub23-10 for uncorrected SPN.
Atmosphere 12 00893 g002
Figure 3. SPN measured in liquid fuel operation as a function of SPN measured in gaseous operation. Data labels in or next marker refer to 23 °C hot start (H, circle) or cold start (C, diamond) or to sub-zero (S, star) tests. Blue markers are for LPG, red for VCNG1 and yellow for VCNG2.
Atmosphere 12 00893 g003
Figure 4. Sub-zero (Sub, top) and 23 °C cold start (CS, bottom) SPN23 time series with liquid (LF) and gaseous (GF) fuel in sub-zero tests for (a) VLPG; (b) VCNG1; and (c) VCNG2.
Atmosphere 12 00893 g004
Figure 5. Particle fractions below 23 nm. Data measured with gaseous fuels is presented with filled markers and data for liquid (gasoline) with open markers; (a) sub23-10 fraction for uncorrected SPN10 as a function of SPN23. Shaded area marks data for which SPN10 is above limit 6 × 10 11 1/km, while SPN23 is below the limit; (b) sub10-4 fraction for corrected SPN4c as a function of SPN10. Grey vertical lines show SPN10 levels and curved, dash-dotted lines SPN4c levels. Labels 1, 2, 6, 10 and 30 refer to emission level multiples of 10 11 1/km. Data labelled ref is acquired from literature [13] and represents in left axes corrected sub23-10 and in right axes corrected sub10-2.5 levels instead of sub10-4.
Atmosphere 12 00893 g005
Table 1. Characteristics of the tested vehicles.
AbbreviationVCNG1VCNG2VLPG
Vehicle classM1M1M1
Model Year201820192018
Odometer reading425312233003
Emissions standard6d-temp6d-temp-evap6d-temp-evap
Rated power (kW)639651
Emission controlTWCTWCTWC
Engine capacity (cm3)87514981242
Vehicle typeBi-fuelMono-fuel (gas)Bi-fuel
FuelsCNG/E10CNG/(E5)LPG/E10
Fuel injectionPFI/PFIPFI *PFI/PFI
Declared CO2 (g/km)110/14996/-135/147
* For VCNG2, the reserve fuel injection type is not disclosed in official documentation. PFI = port fuel injection; TWC = three-way catalyst.
Publisher’s Note: MDPI stays neutral with regard to jurisdictional claims in published maps and institutional affiliations.

