
Seasonality of the Airborne Ambient Soot Predominant Emission Sources Determined by Raman Microspectroscopy and Thermo-Optical Method

 , , , , and
Abstract
1. Introduction
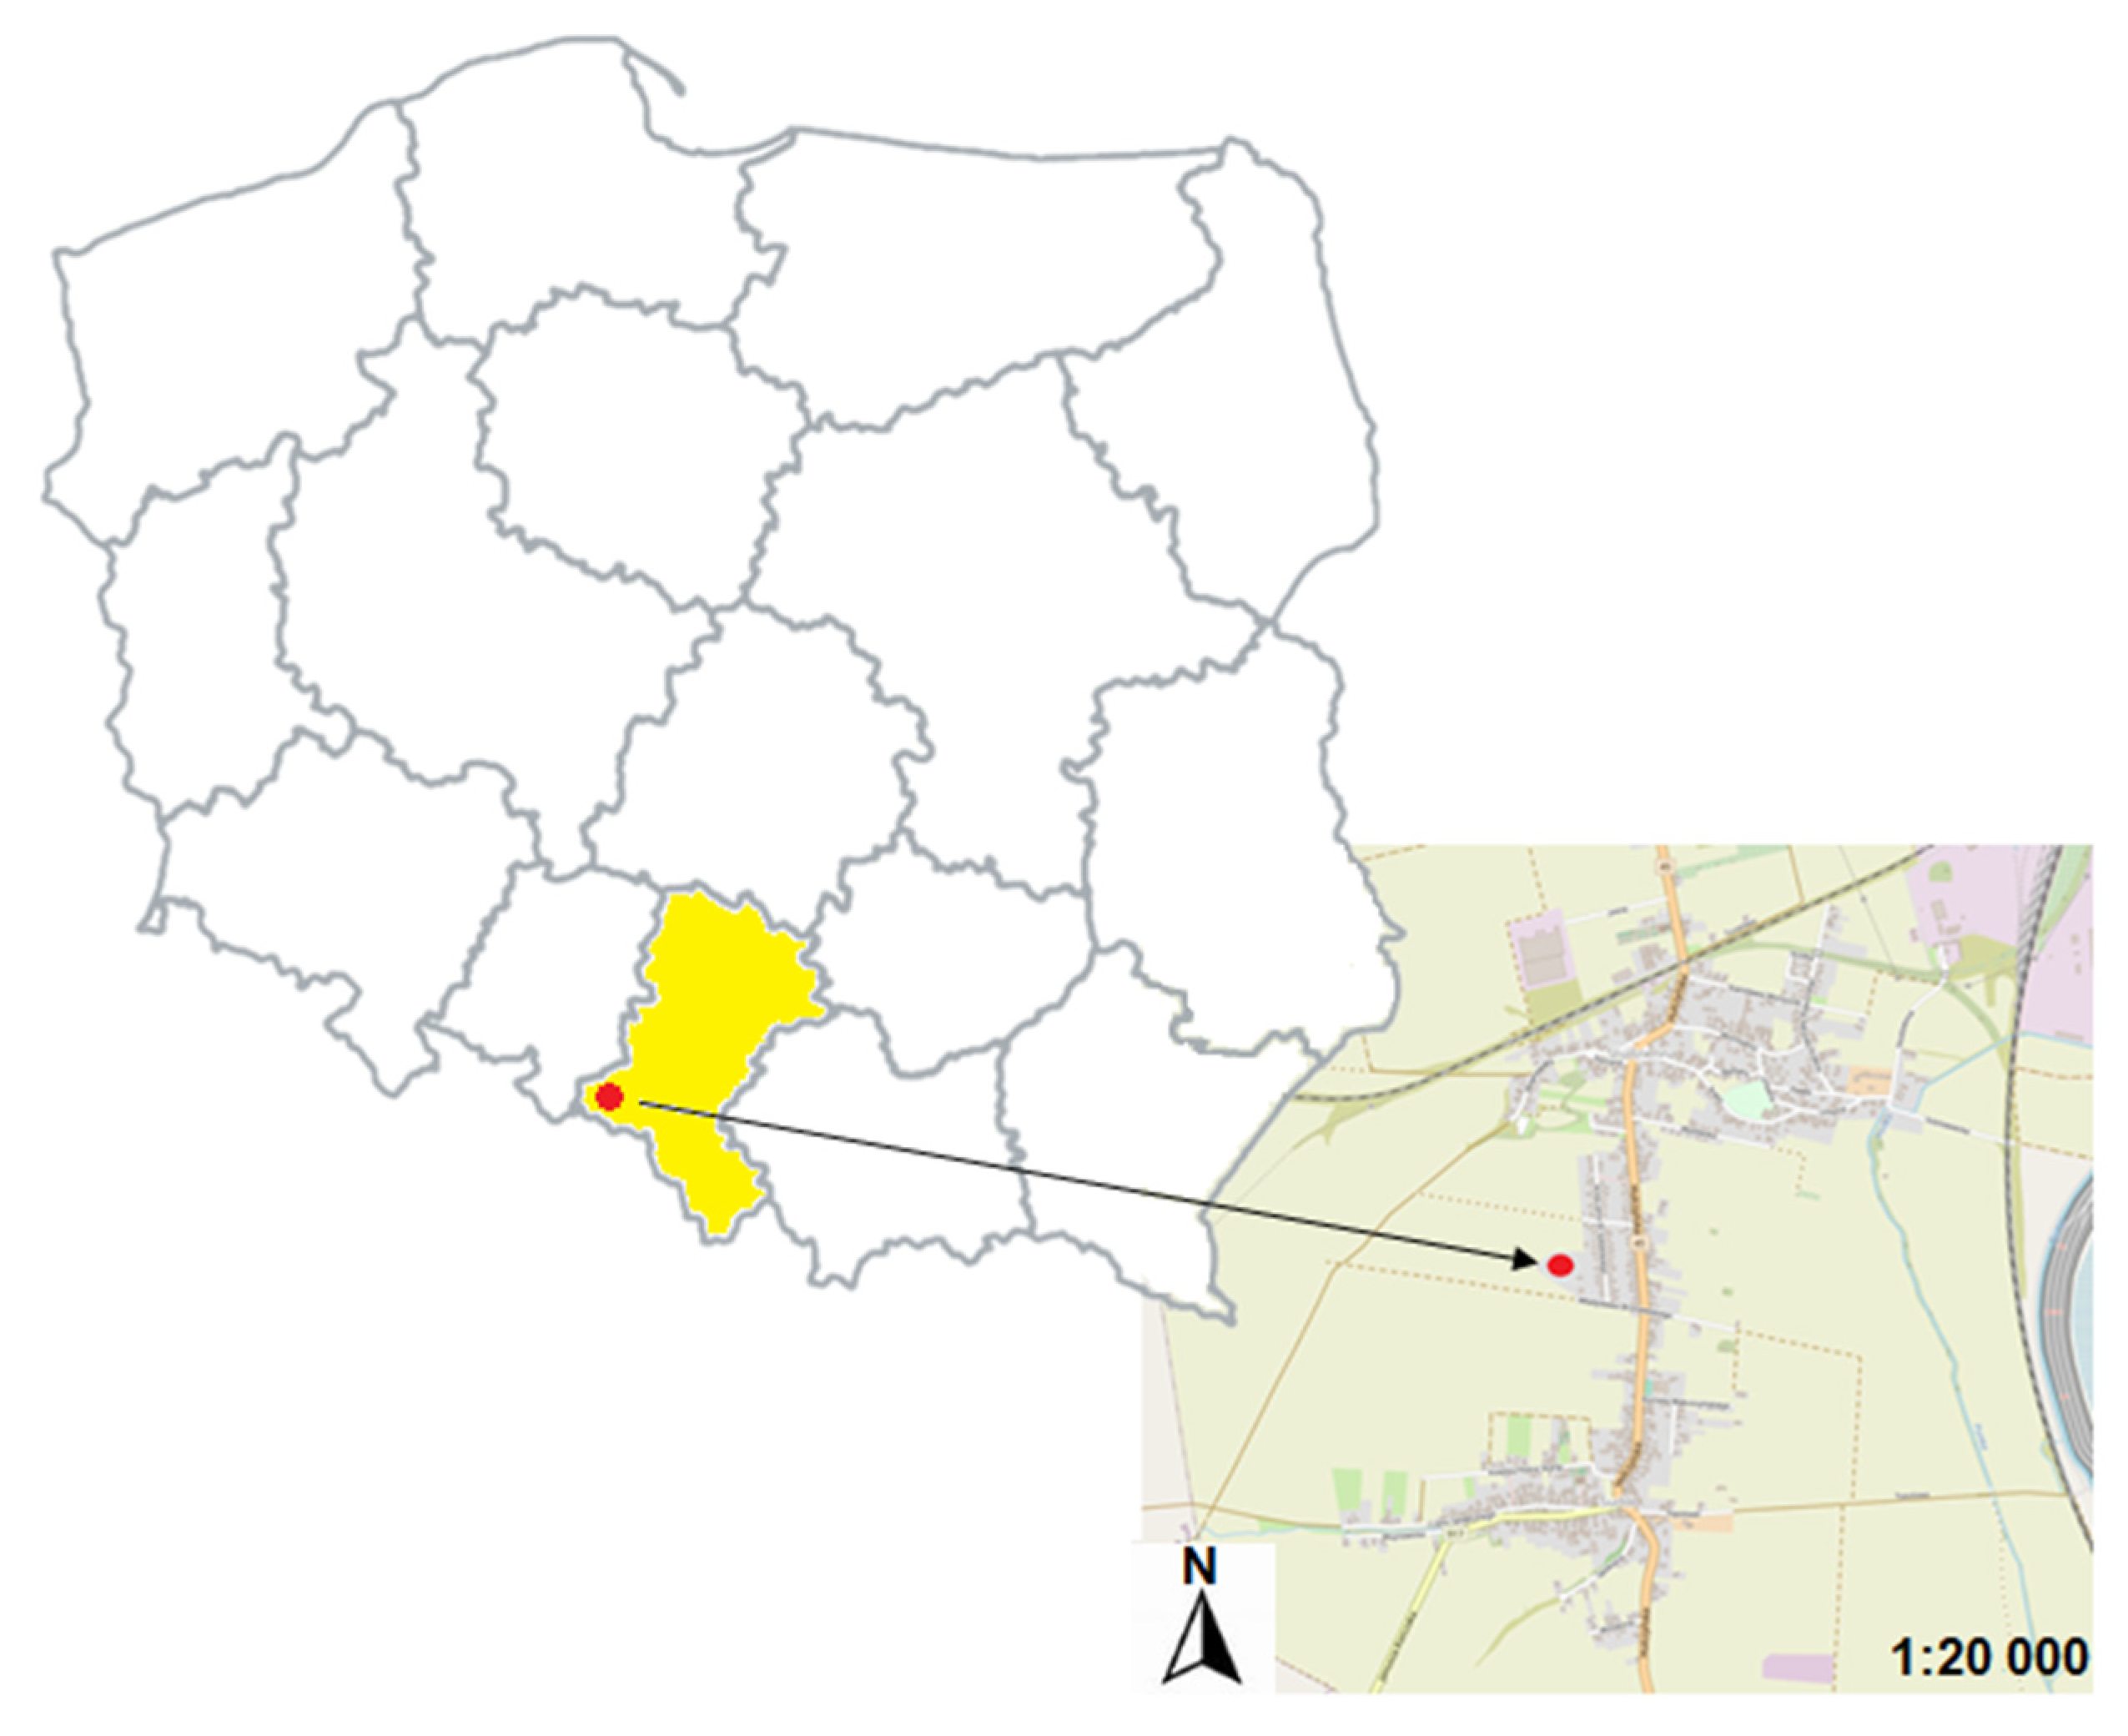
2. Sampling Site
3. Materials and Methods
3.1. Sample Description
3.2. Raman Spectroscopy
3.3. Thermal-Optical Transmittance (TOT) Analysis
4. Results and Discussion
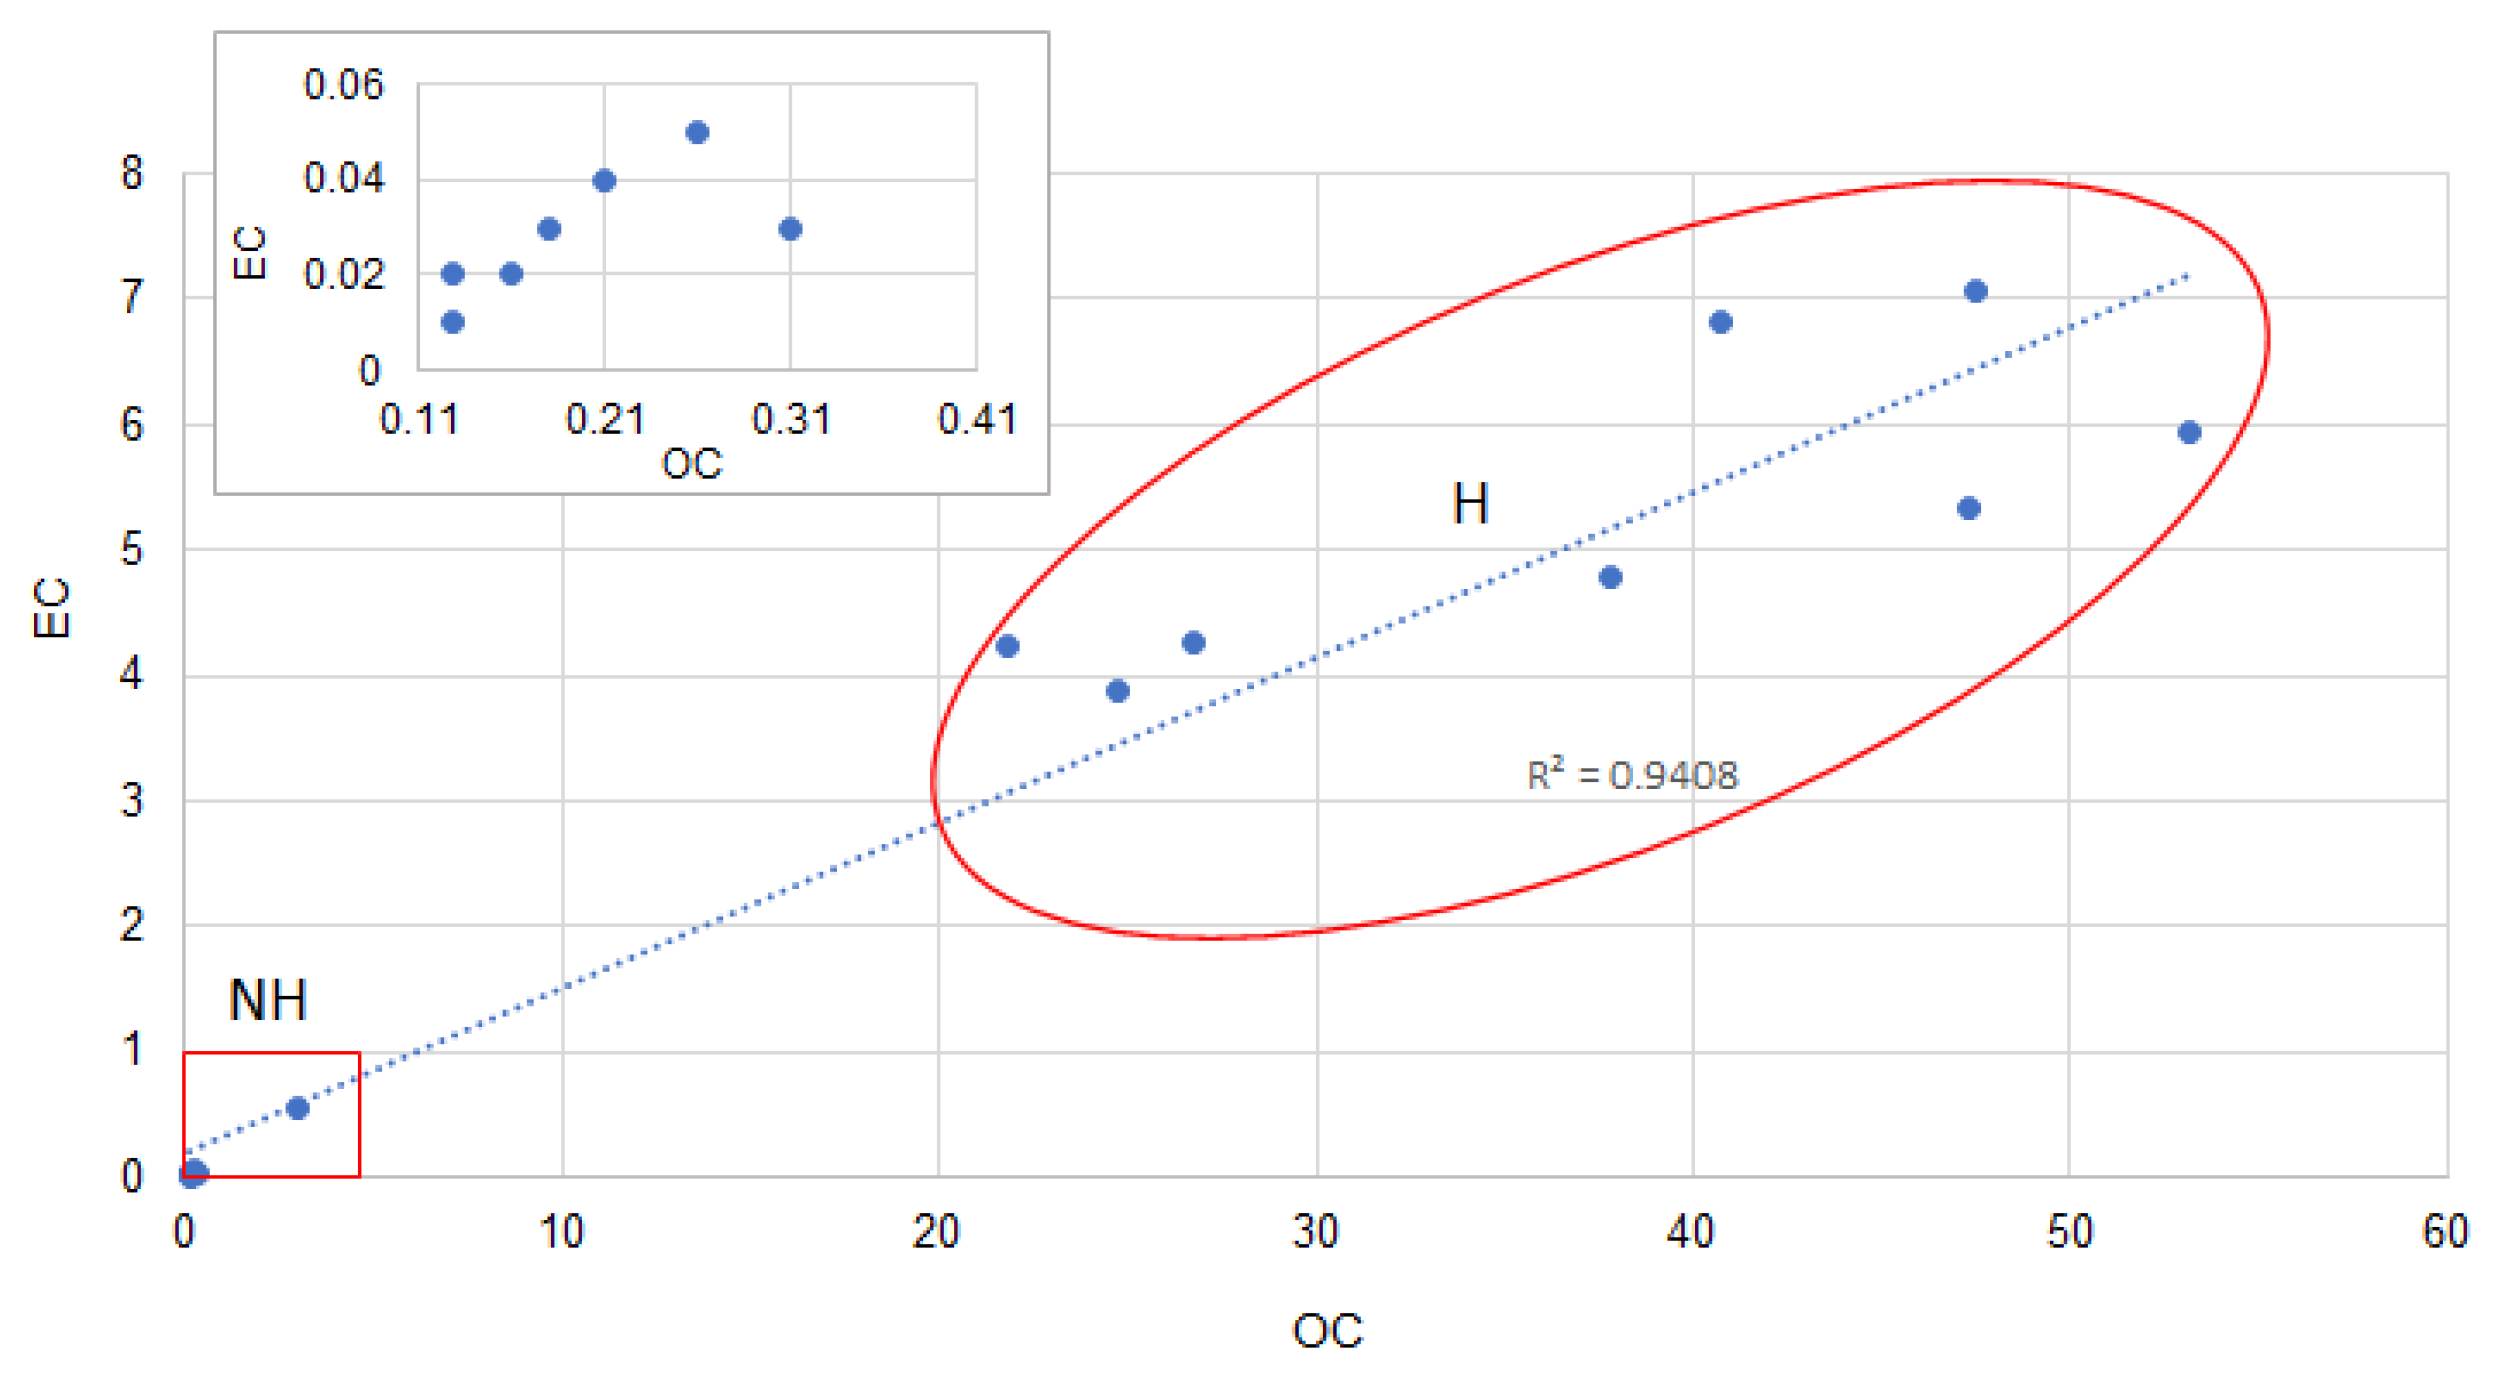
4.1. Mass Concentrations of PM2.5, OC and EC
4.2. Raman Spectroscopy
4.2.1. Generalities
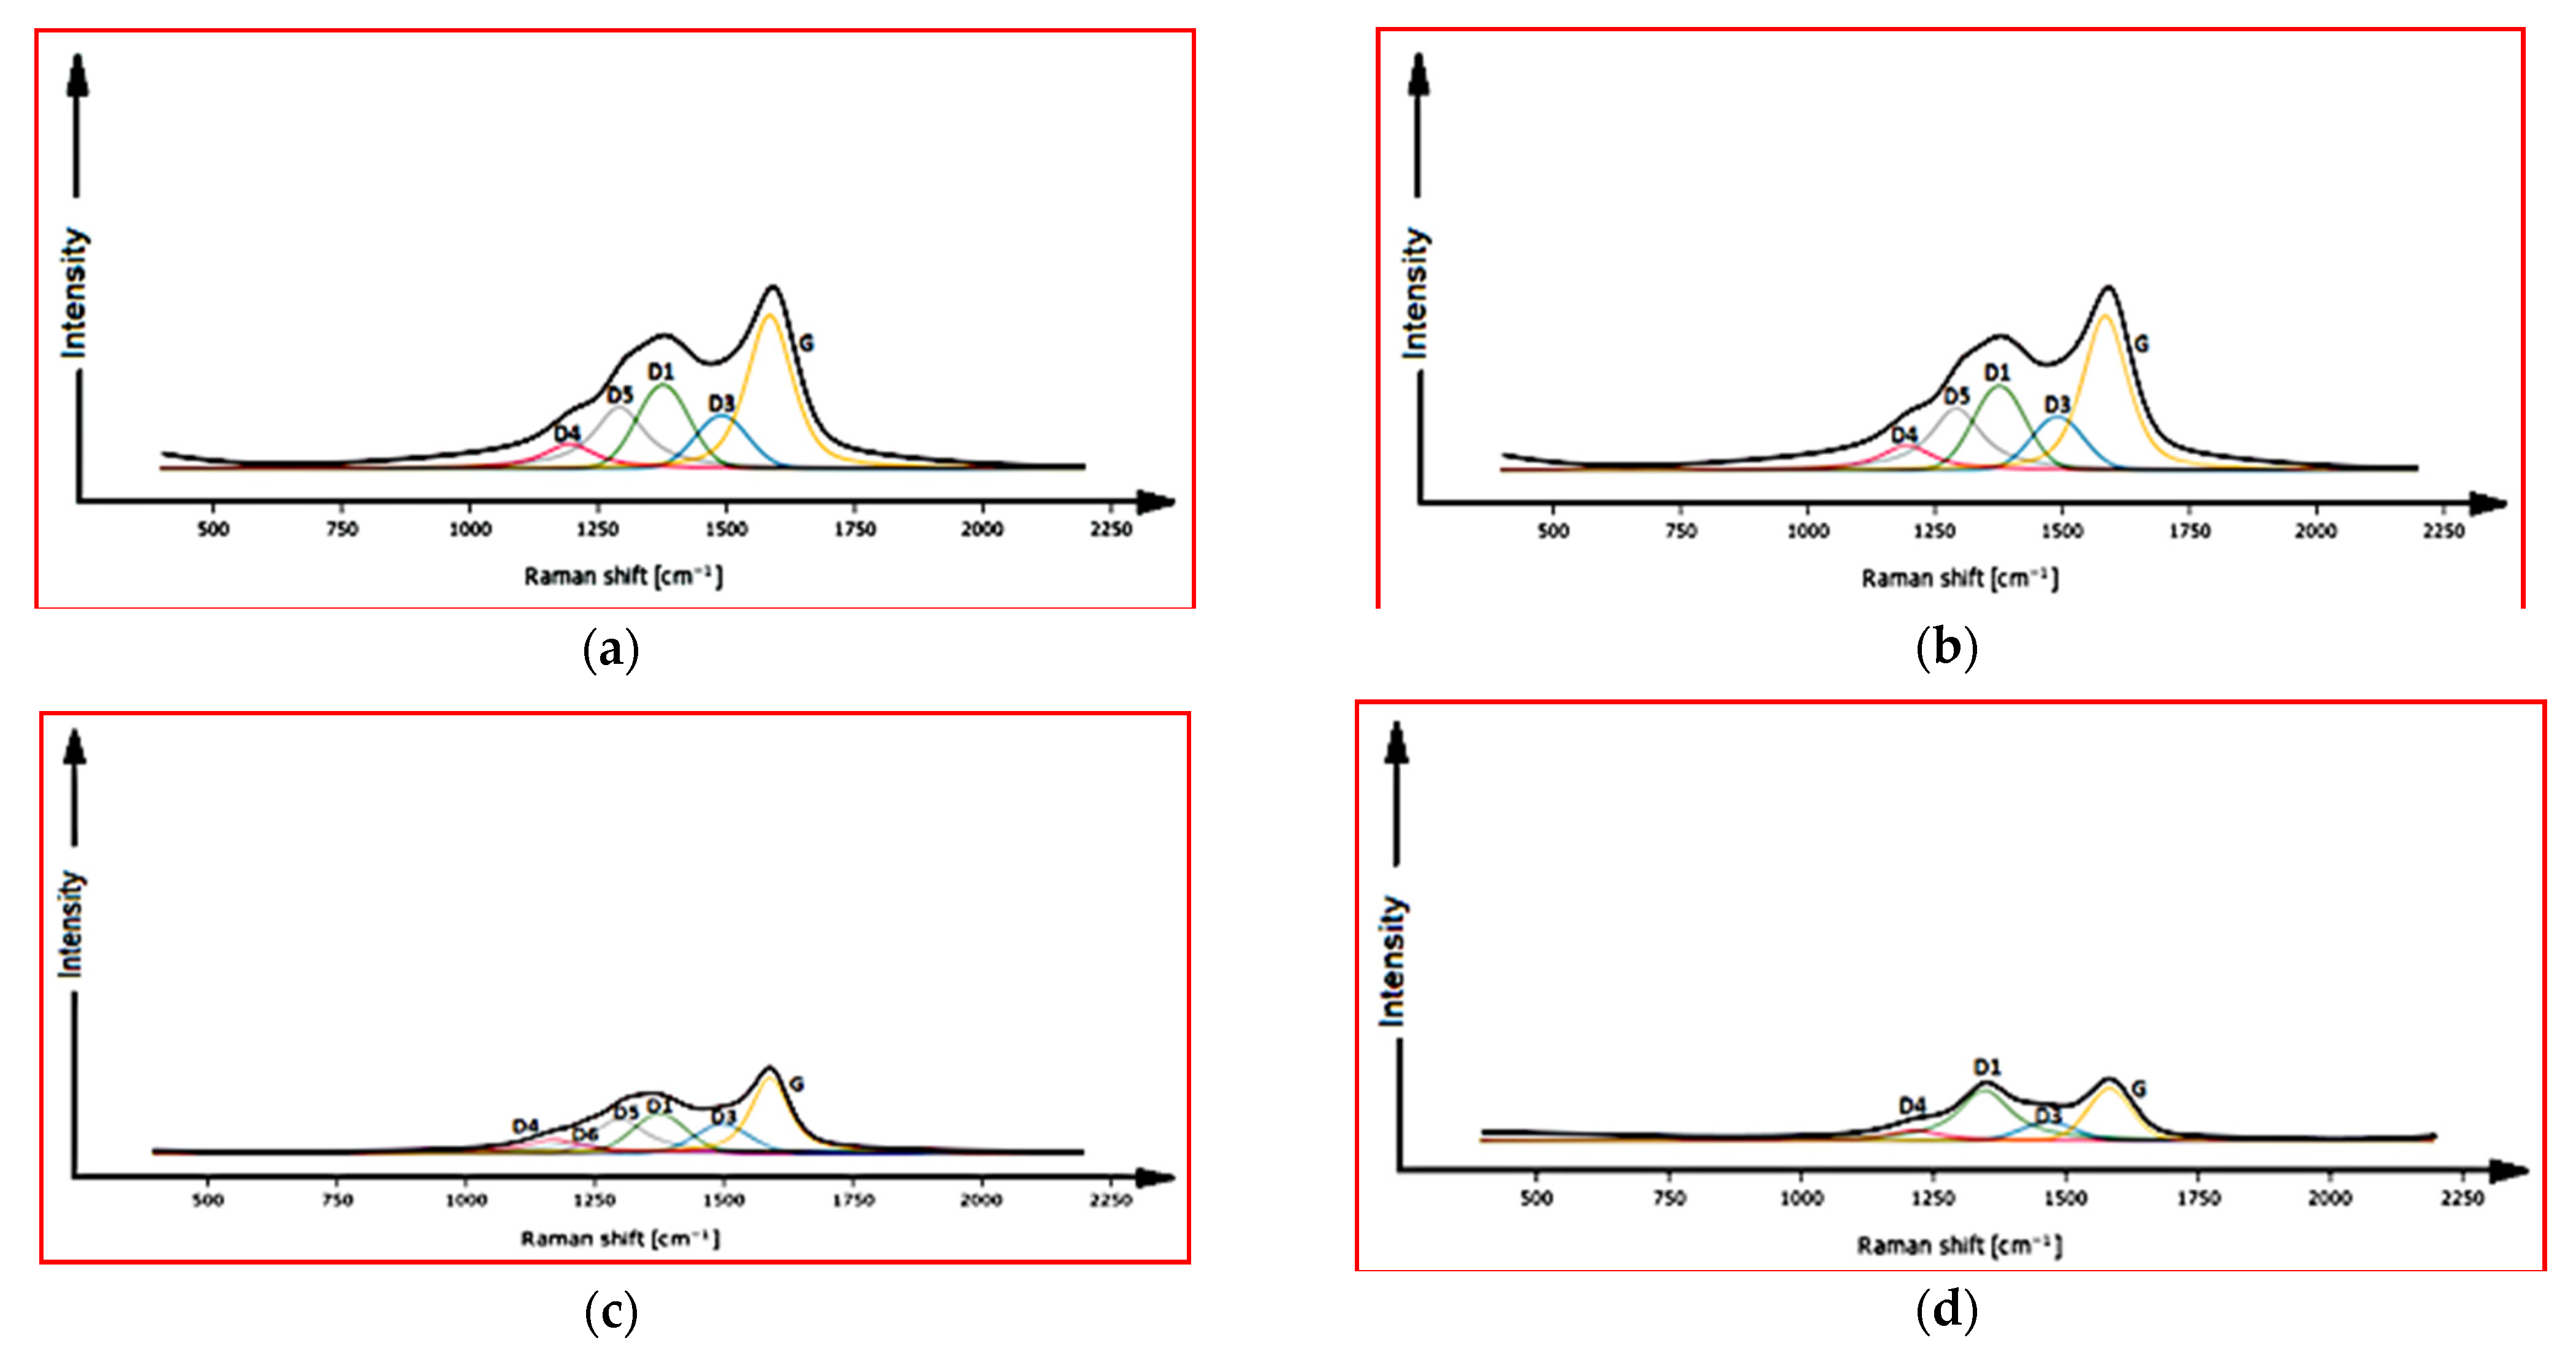
4.2.2. Reference Samples
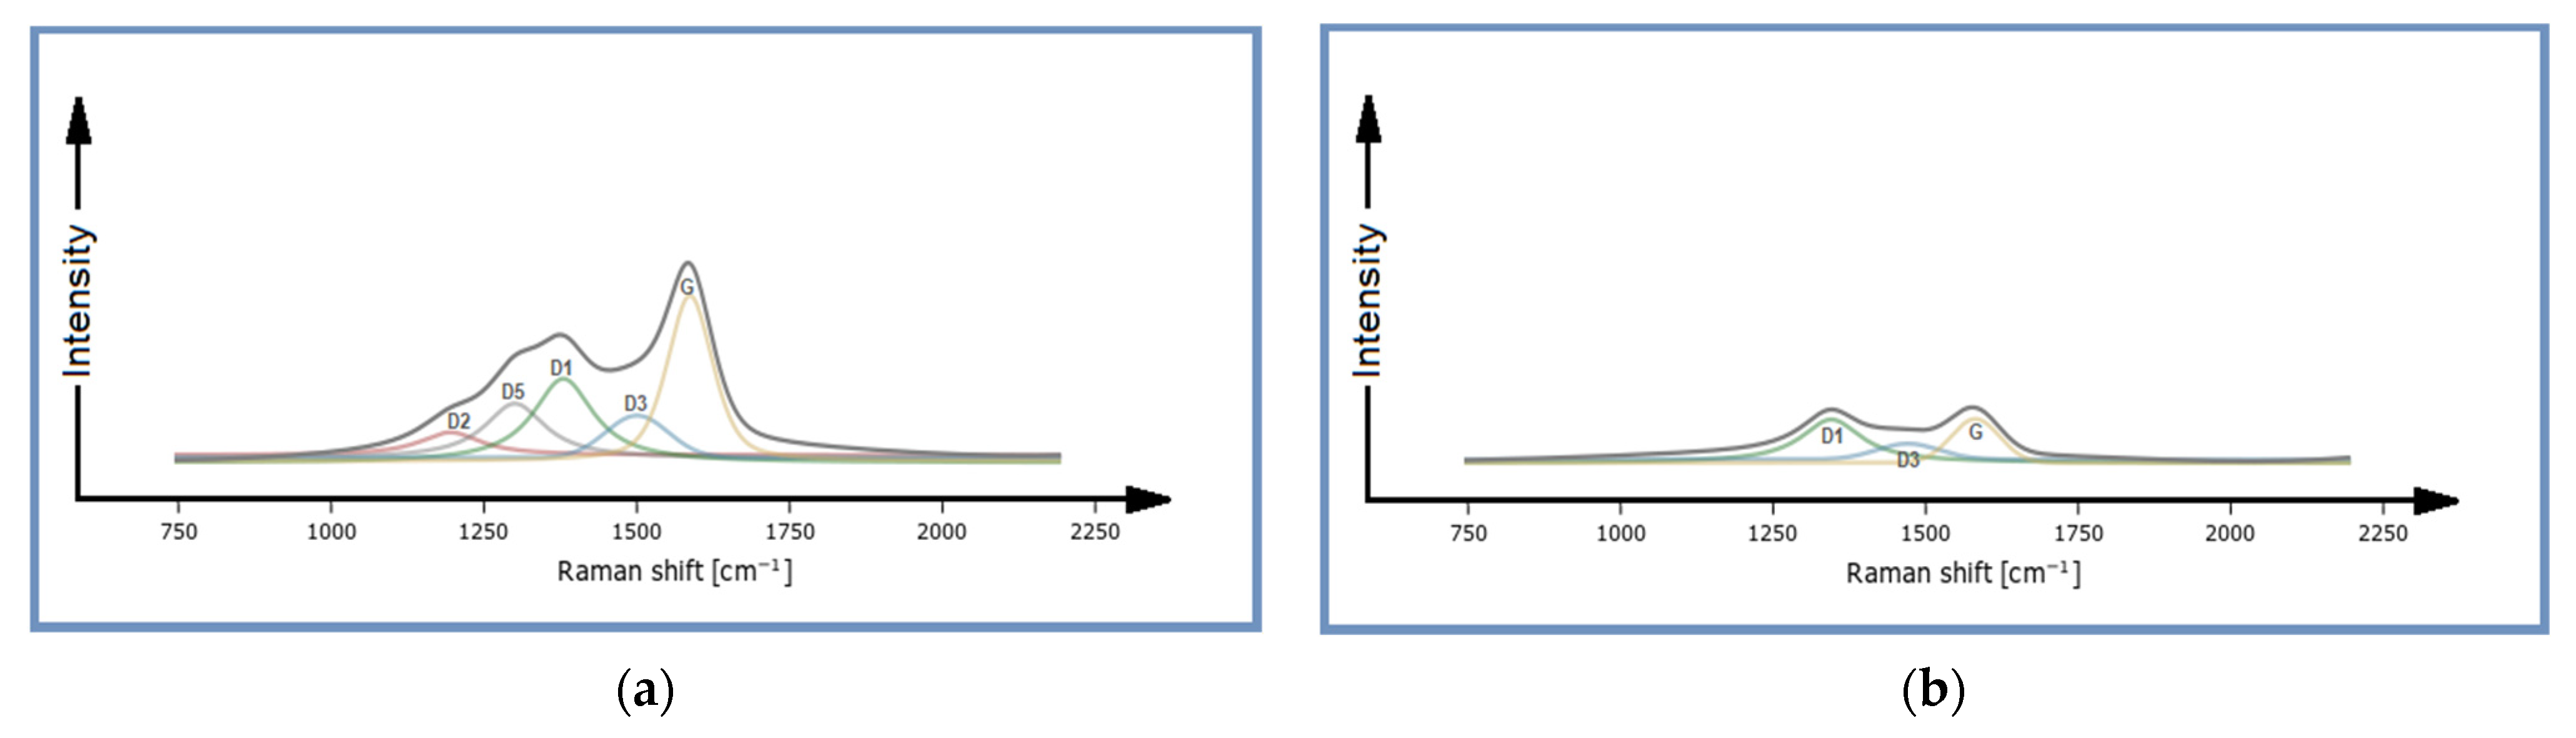
4.2.3. Ambient Soot
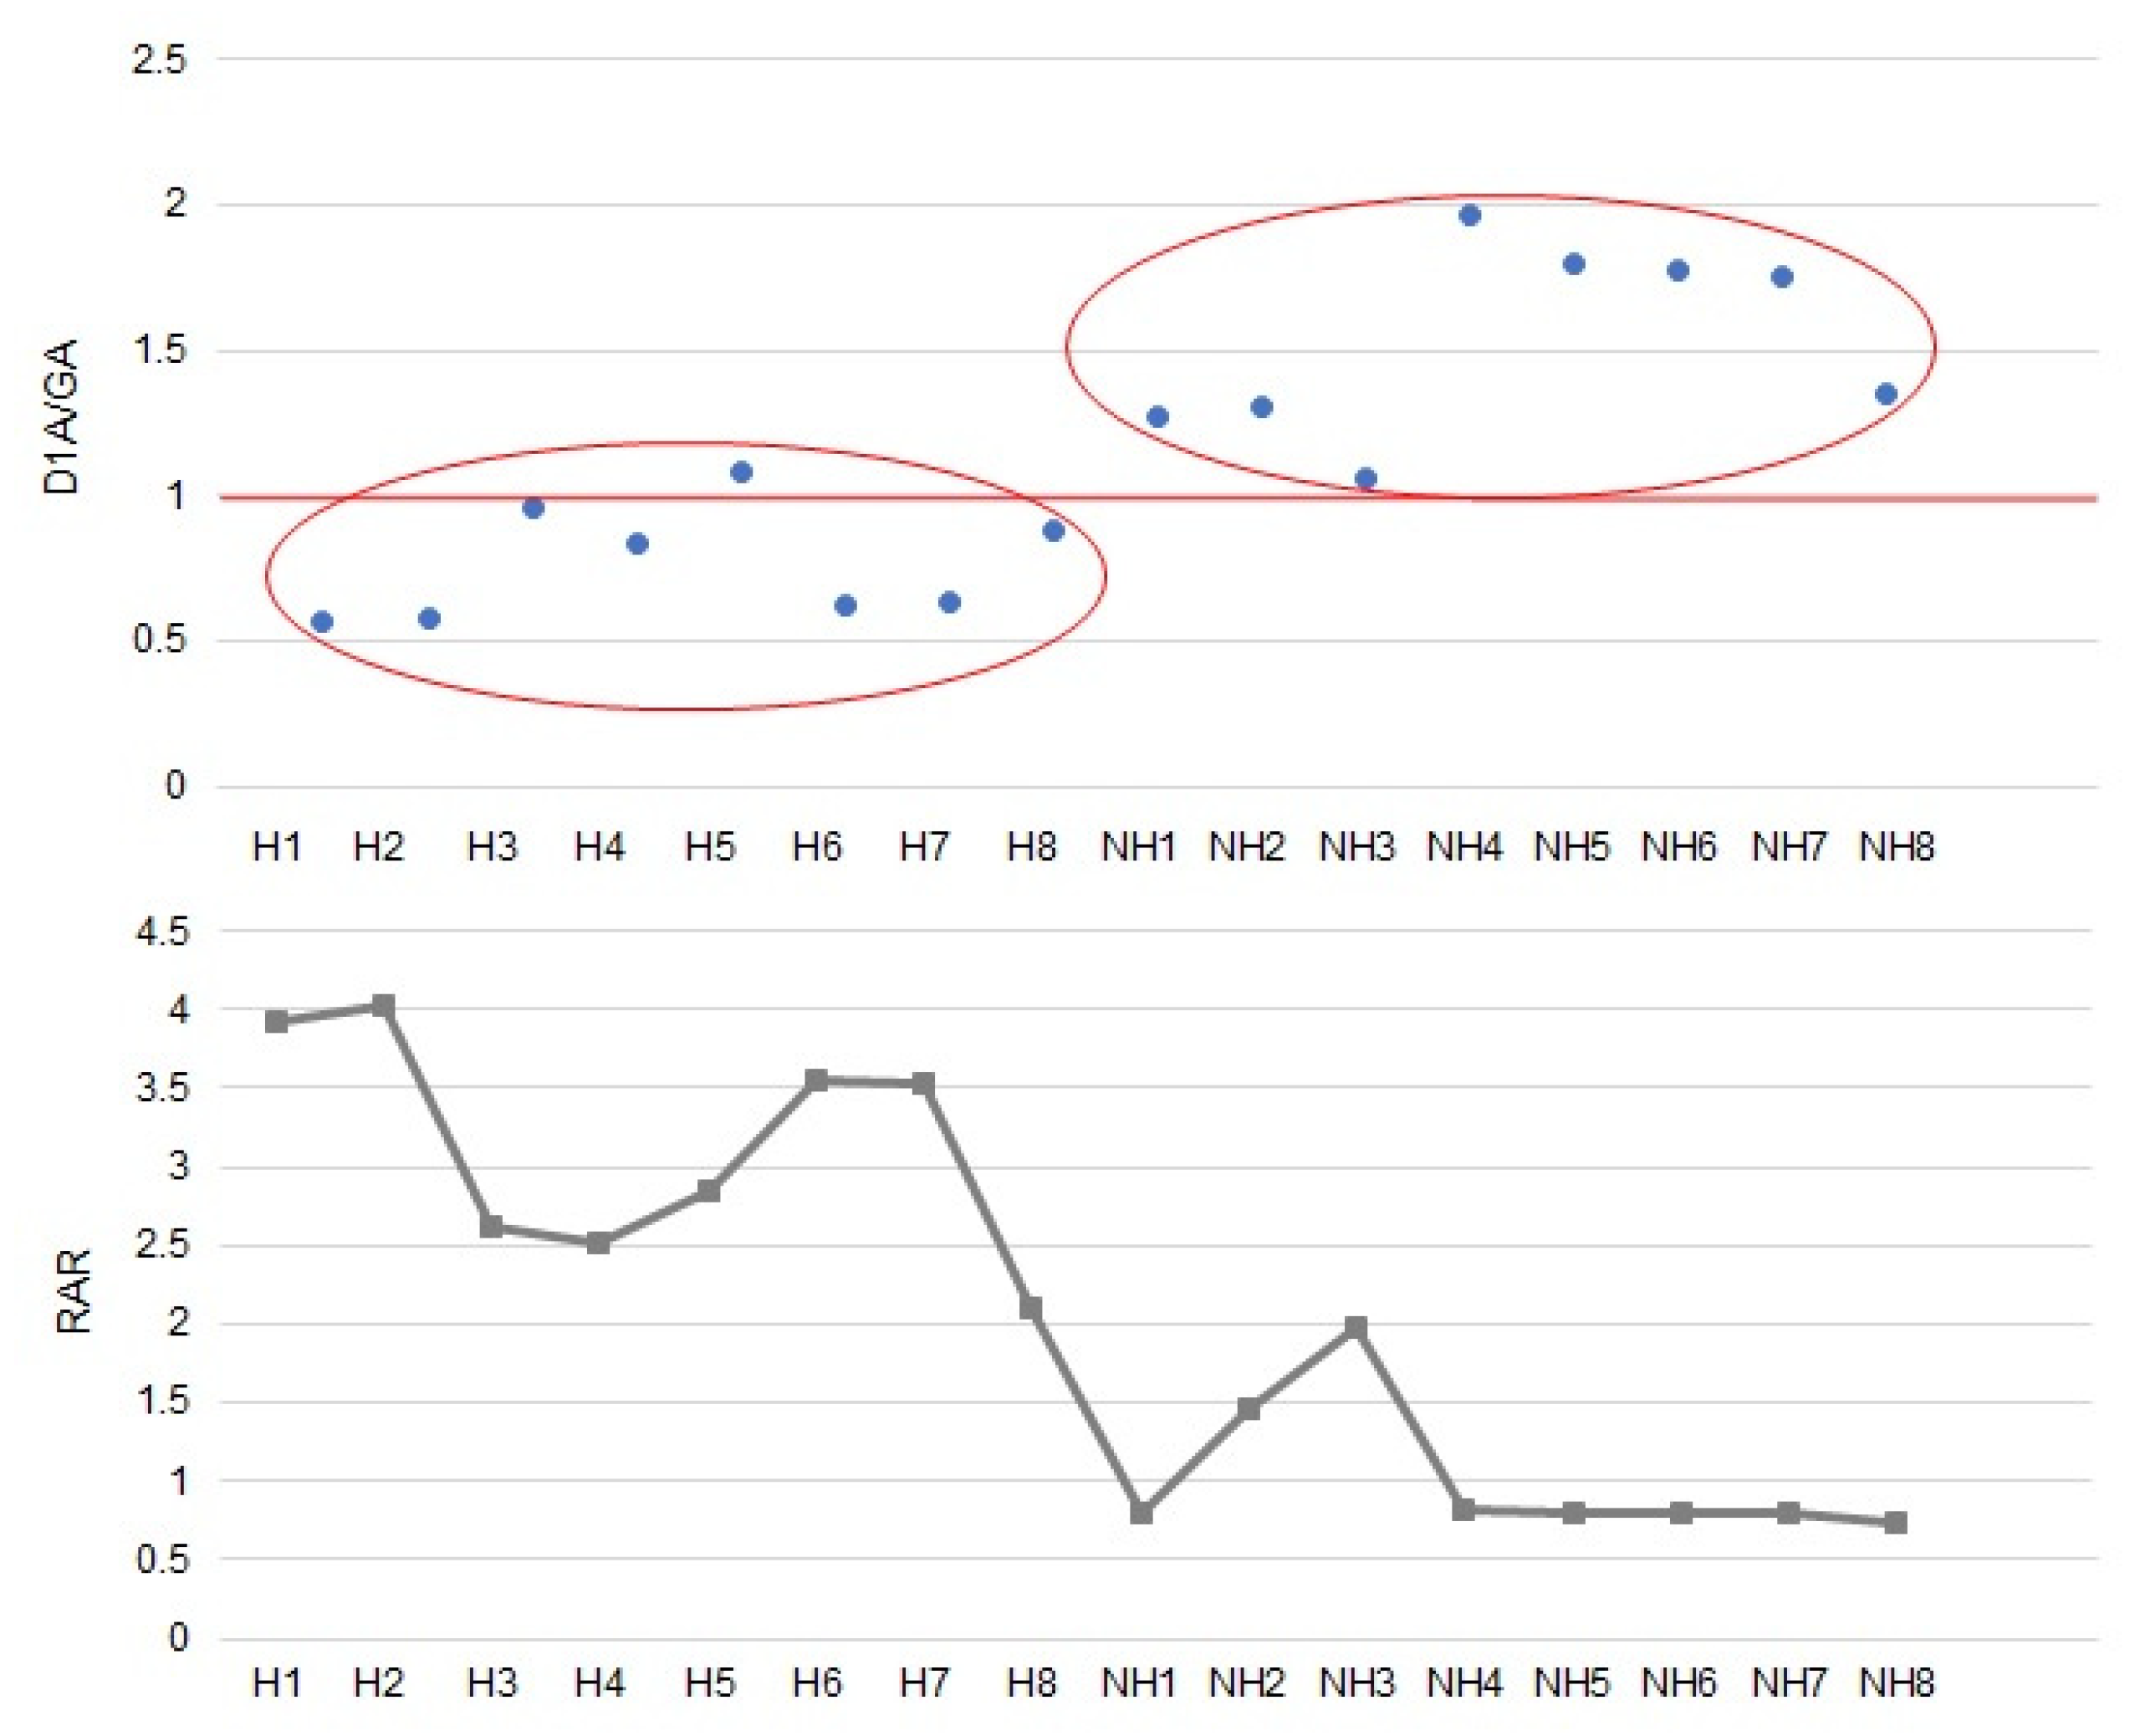
4.3. Relations between Raman ID/IG Parameter and TOT Data
5. Conclusions
Supplementary Materials
Author Contributions
Funding
Institutional Review Board Statement
Informed Consent Statement
Data Availability Statement
Acknowledgments
Conflicts of Interest
References
- Contini, D.; Vecchi, R.; Viana, M. Carbonaceous aerosols in the atmosphere. Atmosphere 2018, 9, 181. [Google Scholar] [CrossRef]
- Tomasi, C.; Lupi, A. Primary and secondary sources of atmospheric aerosol. In Atmospheric Aerosols. Life Cycles and Effects on Air Quality and Climate; Tomasi, C., Fuzzi, S., Kokhanovsky, A., Eds.; Wiley Series in Atmospheric Physics and Remote Sensing; Wiley-VCH Verlag GmbH & Co. KgaA: Weinheim, Germany, 2017; pp. 1–86. [Google Scholar]
- Buseck, P.R.; Adachi, K.; Gelencsér, A.; Tompa, É.; Pósfai, M. Are black carbon and soot the same? Atmos. Chem. Phys. Discuss. 2012, 12, 24821–24846. [Google Scholar] [CrossRef]
- Karanasiou, A.; Minguillón, M.C.; Viana, M.; Alastuey, A.; Putaud, J.-P.; Maenhaut, W.; Panteliadis, P.; Močnik, G.; Favez, O.; Kuhlbusch, T.A.J. Thermal-optical analysis for the measurement of elemental carbon (EC) and organic carbon (OC) in ambient air: A literature review. Atmos. Meas. Tech. Discuss. 2015, 8, 9649–9712. [Google Scholar] [CrossRef]
- Gilardoni, S.; Fuzzi, S. Chemical composition of aerosols of different origin. In Atmospheric Aerosols. Life Cycles and Effects on Air Quality and Climate; Tomasi, C., Fuzzi, S., Kokhanovsky, A., Eds.; Wiley Series in Atmospheric Physics and Remote Sensing; Wiley-VCH Verlag GmbH & Co. KgaA: Weinheim, Germany, 2017; pp. 183–221. [Google Scholar]
- Petzold, A.; Ogren, J.A.; Fiebig, M.; Laj, P.; Li, S.-M.; Baltensperger, U.; Holzer-Popp, T.; Kinne, S.; Pappalardo, G.; Sugimoto, N.; et al. Recommendations for reporting “black carbon” measurements. Atmos. Chem. Phys. 2013, 13, 8365–8379. [Google Scholar] [CrossRef]
- Bond, T.C.; Doherty, S.J.; Fahey, D.W.; Forster, P.M.; Berntsen, T.; DeAngelo, B.J.; Flanner, M.G.; Ghan, S.; Kärcher, B.; Koch, D. Bounding the role of black carbon in the climate system: A scientific assessment. J. Geophys. Res. Atmos. 2013, 118, 5380–5552. [Google Scholar] [CrossRef]
- Pawlyta, M.; Rouzaud, J.-N.; Duber, S. Raman microspectroscopy characterization of carbon blacks: Spectral analysis and structural information. Carbon 2015, 84, 479–490. [Google Scholar] [CrossRef]
- Gelencsér, A. Carbonaceous Aerosol; Springer: Berlin, Germany, 2004; p. 350. [Google Scholar]
- Bhandari, J.; China, S.; Chandrakar, K.K.; Kinney, G.; Cantrell, W.; Shaw, R.A.; Mazzoleni, L.R.; Girotto, G.; Sharma, N.; Gorkowski, K.; et al. Extensive soot compaction by cloud processing from laboratory and field observations. Sci. Rep. Nat. Res. 2019, 9, 11824. [Google Scholar] [CrossRef] [PubMed]
- Pósfai, M.; Molnár, Á. Aeorosl particles in the atmosphere: A mineralogical introduction. In EMU Notes in Mineralogy; European Mineralogical Union: Université de Lille, France; Mineralogical Society of Great Britain and Ireland: London, UK, 2000; Volume 2, pp. 197–252. [Google Scholar]
- Kis, V.K.; Pósfai, M.; Lábár, J.L. Nanostructure of atmospheric soot particles. Atmos. Environ. 2006, 40, 5533–5542. [Google Scholar] [CrossRef]
- Sadezky, A.; Muckenhuber, H.; Grothe, H.; Niessner, R.; Pöschl, U. Raman microspectroscopy of soot and related carbonaceous materials: Spectral analysis and structural information. Carbon 2005, 43, 1731–1742. [Google Scholar] [CrossRef]
- Jabłońska, M.; Janeczek, J. Identification of industrial point sources of airborne dust particles in an urban environment by a combined mineralogical and meteorological analyses: A case study from the Upper Silesian conurbation, Poland. Atmos. Pollut. Res. 2019, 10, 980–988. [Google Scholar] [CrossRef]
- WHO Regional Office for Europe, Copenhagen, Denmark. Health Effects of Black Carbon. Available online: http://www.euro.who.int/en/health-topics/environment-and-health/air-quality/publications/2012/health-effects-of-black-carbon-2012 (accessed on 11 June 2021).
- Fuzzi, S.; Gilardoni, S.; Kokhanovsky, A.A.; Di Nicolantonio, W.; Sonoyo, M.; Sano, I.; Nakata, M.; Tomasi, C.; Lanconelli, C. Aerosol and air quality. In Atmospheric Aerosols. Life Cycles and Effects on Air Quality and Climate; Tomasi, C., Fuzzi, S., Kokhanovsky, A., Eds.; Wiley Series in Atmospheric Physics and Remote Sensing; Wiley-VCH Verlag GmbH & Co. KgaA: Weinheim, Germany, 2017; pp. 183–221. [Google Scholar]
- Buseck, P.R.; Pósfai, M. Airborne minerals and related aerosol particles: Effects on climate and the environment. Proc. Natl. Acad. Sci. USA 1999, 96, 3372–3379. [Google Scholar] [CrossRef]
- Chen, Y.; Shah, N.; Braun, A.; Huggins, F.E.; Huffman, G.P. Electron microscopy investigation of carbonaceous particulate matter generated by combustion of fossil fuels. Energy Fuels 2005, 19, 1644–1651. [Google Scholar] [CrossRef]
- Li, W.J.; Shao, L.Y.; Buseck, P.R. Haze types in Beijing and the influence of agricultural biomass burning. Atmos. Chem. Phys. 2010, 10, 8119–8130. [Google Scholar] [CrossRef]
- Tumolva, L.; Park, J.-Y.; Kim, J.; Miller, A.L.; Chow, J.C.; Watson, J.G.; Park, K. Morphological and elemental classification of freshly emitted soot particles and atmospheric ultrafine particles using the TEM/EDS. Aerosol Sci. Technol. 2010, 44, 202–215. [Google Scholar] [CrossRef]
- Pawlyta, M.; Hercman, H. Transmission electron microscopy (TEM) as a tool for identification of combustion products: Application to black layers in speleothems. Ann. Soc. Geol. Pol. 2016, 86, 237–248. [Google Scholar] [CrossRef]
- Escribano, R.; Sloan, J.J.; Siddique, N.; Sze, N.; Dudev, T. Raman spectroscopy of carbon-containing particles. Vib. Spectrosc. 2001, 26, 179–186. [Google Scholar] [CrossRef]
- Commodo, M.; Joo, P.H.; De Falco, G.; Minutolo, P.; D’Anna, A.; Gülder, Ö.L. Raman spectroscopy of soot sampled in high-pressure diffusion flames. Energy Fuels 2017, 31, 10158–10164. [Google Scholar] [CrossRef]
- Ge, H.; Ye, Z.; He, R. Raman spectroscopy of diesel and gasoline engine-out soot using different laser power. J. Environ. Sci. 2019, 79, 74–80. [Google Scholar] [CrossRef] [PubMed]
- Sze, S.-K.; Siddique, N.; Sloan, J.J.; Escribano, R. Raman spectroscopic characterization of carbonaceous aerosols. Atmos. Environ. 2001, 35, 561–568. [Google Scholar] [CrossRef]
- Mertes, S.; Dippel, B.; Schwarzenböck, A. Quantification of graphitic carbon in atmospheric aerosol by Raman spectroscopy and first application for the determination of mass absorption efficiences. J. Aerosol Sci. 2004, 35, 347–361. [Google Scholar] [CrossRef]
- Ivleva, N.P.; McKeon, U.; Niessner, R.; Pöschl, U. Raman microspectroscopic analysis of size-resolved atmospheric aerosol particle samples collected with an ELPI: Soot, humic-like substances, and inorganic compounds. Aerosol Sci. Technol. 2007, 41, 655–671. [Google Scholar] [CrossRef]
- Nordmann, S.W.; Birmili, W.; Weinhold, K.; Müller, K.; Spindler, G.; Wiedensohler, A. Measurements of the mass absorption cross section of atmospheric soot particles using Raman spectroscopy. J. Geophys. Res. Atmos. 2013, 118, 12075–12085. [Google Scholar] [CrossRef]
- Catelani, T.; Pratesi, G.; Zoppi, M. Raman characterization of ambient airborne soot and associated mineral phases. Aerosol Sci. Technol. 2014, 48, 13–21. [Google Scholar] [CrossRef]
- Ongeo. Geoportal. Available online: https://ongeo.pl/geoportal/raciborz/zanieczyszczenie-powietrza (accessed on 5 December 2020).
- Błaszczak, B.; Mathews, B. Characteristics of the carbonaceous matter in aerosol from selected urban and rural areas of Southern Poland. Atmosphere 2020, 11, 687. [Google Scholar] [CrossRef]
- Rogula-Kozłowska, W.; Klejnowski, K.; Rogula-Kopiec, P.; Ośródka, L.; Krajny, E.; Błaszczak, B.; Mathews, B. Spatial and seasonal variability of the mass concentrations and chemical composition of PM2.5 in Poland. Air Qual. Atmos. Health 2014, 7, 41–58. [Google Scholar] [CrossRef]
- Lünsdorf, N.K.; Lünsdorf, J.O. Evaluating Raman spectra of carbonaceous matter by automated, iterative curve-fitting. Int. J. Coal Geol. 2016, 160, 51–62. [Google Scholar] [CrossRef]
- Goryl, M.; Banasik, K.; Smolarek-Lach, J.; Marynowski, L. Utility of Raman spectroscopy in estimates of the thermal maturity of Ediacaran organic matter: An example from the East European Craton. Geochemistry 2019, 79, 467–474. [Google Scholar] [CrossRef]
- Rantitsch, G.; Bhattacharyya, A.; Schenk, J. Microstructural evolution of blast furnace coke during experimental heating—The IFORS approach. BHM Bergund Hüttenmännische Mon. 2019, 164, 257–260. [Google Scholar] [CrossRef][Green Version]
- Reizer, M.; Juda-Rezler, K. Explaining the high PM10 concentrations observed in Polish urban areas. Air Qual. Atmos. Health 2016, 9, 517–531. [Google Scholar] [CrossRef]
- Klejnowski, K.; Janoszka, K.; Czaplicka, M. Characterization and seasonal variations of organic and elemental carbon and levoglucosan in PM10 in Krynica Zdroj, Poland. Atmosphere 2017, 8, 190. [Google Scholar] [CrossRef]
- Zioła, N.; Błaszczak, B.; Klejnowski, K. Temporal variability of equivalent Black Carbon components in atmospheric air in Southern Poland. Atmosphere 2021, 12, 119. [Google Scholar] [CrossRef]
- Khan, M.B.; Masiol, M.; Formenton, G.; Di Gilio, A.; de Gennaro, G.; Agostinelli, C.; Pavoni, B. Carbonaceous PM2.5 and secondary organic aerosol across the Venetto region (NE Italy). Sci. Total Environ. 2016, 542, 172–181. [Google Scholar] [CrossRef]
- Sandrini, S.; Fuzzi, S.; Piazzalunga, A.; Prati, P.; Bonasoni, P.; Cavalli, F.; Bove, M.C.; Calvello, M.; Cappelletti, D.; Colombi, C.; et al. Spatial and seasonal variability of carbonaceous aerosol in Italy. Atmos. Environ. 2014, 99, 587–598. [Google Scholar] [CrossRef]
- Putaud, J.-P.; van Dingenen, R.; Alastuey, A.; Bauer, H.; Birmili, W.; Cyrys, J.; Flentje, H.; Fuzzi, S.; Gehrig, R.; Hansson, H.C.; et al. A European aerosol phenomenology 3: Physical and chemical characteristics of particulate matter from 60 rural, urban, and kerbside sites across Europe. Atmos. Environ. 2010, 44, 1308–1320. [Google Scholar] [CrossRef]
- Godec, R.; Čačkovič, M.; Šega, K. Winter mass concentrations of carbon species in PM10, PM2.5 and PM1 in Zagreb air, Croatia. Bull. Environ. Contam. Toxicol. 2012, 89, 1087–1090. [Google Scholar] [CrossRef]
- Zhu, C.S.; Cao, J.J.; Tsai, C.J.; Shen, Z.X.; Liu, S.X.; Huang, R.J.; Zhang, N.N.; Wang, P. The rural carbonaceous aerosols in coarse, fine, and ultrafine particles during haze pollution in northwestern China. Environ. Sci. Pollut. Res. 2016, 23, 4569–4575. [Google Scholar] [CrossRef]
- Titos, G.; del Águila, A.; Cazorla, A.; Lyamani, H.; Casquero-Vera, J.A.; Colombi, C.; Cuccia, E.; Gianelle, V.; Močnik, G.; Alastuey, A.; et al. Spatial and temporal variability of carboanceous aerosol: Assessing the impact of biomass burning in the urban environment. Sci. Total Environ. 2017, 578, 613–627. [Google Scholar] [CrossRef]
- Li, X.; Jiang, L.; Bai, Y.; Yang, Y.; Liu, S.; Chen, X.; Xu, J.; Liu, Y.; Wang, Y.; Guo, X.; et al. Wintertime aerosol chemistry in Beijing during haze period: Significant contribution from secondary formation and biomass burning emission. Atmos. Res. 2019, 218, 25–33. [Google Scholar] [CrossRef]
- Gilardoni, S.; Massoli, P.; Marinoni, A.; Mazzoleni, C.; Freedman, A.; Lonati, G.; De Iullis, S.; Gianelle, V. Spatial and temporal variability of carbonaceous absorption in the Po valley. Aerosol Air Qual. Res. 2020, 20, 2624–2639. [Google Scholar] [CrossRef]
- Nasdala, L.; Smith, D.C.; Kaindl, R.; Zieman, M.A. Raman spectroscopy: Analytical perspectives in mineralogical research. In EMU Notes in Mineralogy; Beran, A., Libowitzky, E., Eds.; Eötvös University Press: Budapest, Hungary, 2004; Volume 6, pp. 281–343. [Google Scholar]
- Jawarhi, T.; Roid, A.; Casado, I. Raman spectroscopic characterization of some commercially available carbon black materials. Carbon 1995, 33, 1561–1565. [Google Scholar] [CrossRef]
- Patel, M.; Ricardo, C.L.; Scardi, P.; Aswath, P.B. Morphology, structure and chemistry of extracted diesel soot—Part I: Transmission electron microscopy, Raman spectroscopy, X-ray photoelectron spectroscopy and synchrotron X-ray diffraction study. Tribol. Int. 2012, 52, 29–39. [Google Scholar] [CrossRef]
- Henry, D.G.; Jarvis, I.; Gillmore, G.; Stephenson, M. A rapid method for determining organic matter maturity using Raman spectroscopy: Application to carboniferous organic-rich mudstones and coals. Int. J. Coal Geol. 2019, 203, 87–98. [Google Scholar] [CrossRef]
- Ferralis, N.; Matys, E.F.; Knoll, A.H.; Hallmann, C.; Summons, R.E. Rapid, direct and non-destructive assessment of fossil organic matter via microRaman spectroscopy. Carbon 2016, 108, 440–449. [Google Scholar] [CrossRef]
- Khatibi, S.; Abarghani, A.; Liu, K.; Guedes, A.; Valentim, B.; Ostadhassan, M. Backtracking to parent maceral from produced bitumen with Raman spectroscopy. Minerals 2020, 10, 679. [Google Scholar] [CrossRef]
- Romero-Sarmiento, M.-F.; Rouzaud, J.-N.; Bernard, S.; Deldicque, D.; Thomas, M.; Littke, R. Evolution of Barnett Shale organic carbon structure and nanostructure with increasing maturation. Org. Geochem. 2014, 71, 7–16. [Google Scholar] [CrossRef]
- Beyssac, O.; Goffé, B.; Petitet, J.-P.; Froigneux, E.; Moreau, M.; Rouzaud, J.-N. On the characterization of disordered and heterogeneous carbonaceous materials by Raman spectroscopy. Spectrochim. Acta Part A 2003, 59, 2267–2276. [Google Scholar] [CrossRef]
- Sharma, M.; Singh, G.; Vaish, R. Diesel soot coated non-woven fabric for oil-water separation and adsorption applications. Sci. Rep. 2019, 9, 8503. [Google Scholar] [CrossRef] [PubMed]
- Sharma, V.U.D.; Gangopadhyay, A.; Aswath, P. Structure and chemistry of crankcase and exhaust soot extracted from diesel engines. Carbon 2016, 103, 327–338. [Google Scholar] [CrossRef]
- Liu, Y.; Song, C.L.G.; Wang, X.; Li, N. Virgin and extracted soots in premixed methane flames: A comparison of surface functional groups, graphitization degree, and oxidation reactivity. Energy Fuels 2017, 31, 6413–6421. [Google Scholar] [CrossRef]
- Pfau, S.A.; La Rocca, A.; Haffner-Staton, E.; Rance, G.A.; Fay, M.W.; Brough, R.J.; Malizia, S. Comparative nanostructure analysis of gasoline turbocharged direct injection and diesel soot-in-oil with carbon black. Carbon 2018, 139, 342–352. [Google Scholar] [CrossRef]
- Zhang, X.; Lyu, G.; Song, C.; Qiao, Y. Effects of biodiesel addition on the physical properties and reactivity of the exhaust soot particles from diesel engine. Energies 2020, 13, 4206. [Google Scholar] [CrossRef]
- Schito, A.; Romano, C.; Corrado, S.; Grido, D.; Poe, B. Diagenetic thermal evolution of organic matter by Raman spectroscopy. Org. Geochem. 2017, 106, 57–67. [Google Scholar] [CrossRef]
- Kouketsu, Y.; Mizukami, T.; Mori, H.; Endo, S.; Aoya, M.; Hara, H.; Nakamura, D.; Wallis, S. A new approach to develop the Raman carbonaceous material geothermometer for low-grade metamorphism using peak width. Isl. Arc 2014, 23, 33–50. [Google Scholar] [CrossRef]
- Opoczyński, K. Summary of GPR2015 Results Obtained for the Domestic Road Network outside Urban Areas (In Polish: Synteza Wyników GPR15 na Zamiejskiej Sieci Dróg Krajowych). Available online: www.gddkia.gov.pl/userfiles/articles/g/generalny-pomiar-ruchu-w-2015_15598//SYNTEZA/Synteza_GPR2015.pdf (accessed on 29 January 2021).


| Sample | D * | G * | D1 | D2 | D3 | D4 | D5 | D6 | G |
|---|---|---|---|---|---|---|---|---|---|
| W1 | 1356 | 1589 | 1380 | - | 1494 | 1196 | 1294 | - | 1586 |
| W2 | 1367 | 1595 | 1364 | - | 1499 | 1192 | 1278 | - | 1594 |
| C | 1337 | 1598 | 1382 | - | 1502 | 1238 | 1303 | 1174 | 1594 |
| E | 1353 | 1595 | 1353 | - | 1472 | 1218 | - | - | 1589 |
| Sample | DSTA | Std | GSTA | Std | DSTA/GSTA | D1A/GA | RAR | RBS | FWHMG | ID/IG |
|---|---|---|---|---|---|---|---|---|---|---|
| W1 | 286.128 | 0.535 | 199.476 | 0.070 | 1.43 | 0.51 | 4.04 | 233 | 106 | 0.69 |
| W2 | 275.838 | 0.036 | 195.904 | 0.172 | 1.41 | 0.59 | 3.57 | 228 | 88 | 0.70 |
| C | 286.043 | 0.254 | 195.294 | 0.033 | 1.46 | 0.56 | 4.31 | 261 | 86 | 0.67 |
| E | 218.924 | 0.052 | 205.596 | 0.015 | 1.06 | 1.57 | 1.10 | 242 | 96 | 0.97 |
Publisher’s Note: MDPI stays neutral with regard to jurisdictional claims in published maps and institutional affiliations. |
© 2021 by the authors. Licensee MDPI, Basel, Switzerland. This article is an open access article distributed under the terms and conditions of the Creative Commons Attribution (CC BY) license (https://creativecommons.org/licenses/by/4.0/).
Share and Cite
Zioła, N.; Banasik, K.; Jabłońska, M.; Janeczek, J.; Błaszczak, B.; Klejnowski, K.; Mathews, B. Seasonality of the Airborne Ambient Soot Predominant Emission Sources Determined by Raman Microspectroscopy and Thermo-Optical Method. Atmosphere 2021, 12, 768. https://doi.org/10.3390/atmos12060768
Zioła N, Banasik K, Jabłońska M, Janeczek J, Błaszczak B, Klejnowski K, Mathews B. Seasonality of the Airborne Ambient Soot Predominant Emission Sources Determined by Raman Microspectroscopy and Thermo-Optical Method. Atmosphere. 2021; 12(6):768. https://doi.org/10.3390/atmos12060768
Chicago/Turabian StyleZioła, Natalia, Kamila Banasik, Mariola Jabłońska, Janusz Janeczek, Barbara Błaszczak, Krzysztof Klejnowski, and Barbara Mathews. 2021. "Seasonality of the Airborne Ambient Soot Predominant Emission Sources Determined by Raman Microspectroscopy and Thermo-Optical Method" Atmosphere 12, no. 6: 768. https://doi.org/10.3390/atmos12060768
APA StyleZioła, N., Banasik, K., Jabłońska, M., Janeczek, J., Błaszczak, B., Klejnowski, K., & Mathews, B. (2021). Seasonality of the Airborne Ambient Soot Predominant Emission Sources Determined by Raman Microspectroscopy and Thermo-Optical Method. Atmosphere, 12(6), 768. https://doi.org/10.3390/atmos12060768