Article

Source Apportionment and Health Risk Assessment of Metal Elements in PM2.5 in Central Liaoning’s Urban Agglomeration

1
State Key Laboratory of Environmental Criteria and Risk Assessment, Chinese Research Academy of Environmental Sciences, Beijing 100012, China
2
Tianjin Key Laboratory of Hazardous Waste Safety Disposal and Recycling Technology, School of Environomental Science and Safety Engineering, Tianjin University of Technology, Tianjin 300834, China
*
Authors to whom correspondence should be addressed.
These authors contributed equally to this work.
Atmosphere 2021, 12(6), 667; https://doi.org/10.3390/atmos12060667
Submission received: 28 April 2021 / Revised: 19 May 2021 / Accepted: 21 May 2021 / Published: 24 May 2021

Abstract

:
To better understand the source and health risk of metal elements in PM2.5, a field study was conducted from May to December 2018 in the central region of the Liaoning province, China, including the cities of Shenyang, Anshan, Fushun, Benxi, Yingkou, Liaoyang, and Tieling. 24 metal elements (Na, K, V, Cr, Mn, Co, Ni, Cu, Zn, As, Mo, Cd, Sn, Sb, Pb, Bi, Al, Sr, Mg, Ti, Ca, Fe, Ba, and Si) in PM2.5 were measured by ICP-MS and ICP-OES. They presented obvious seasonal variations, with the highest levels in winter and lowest in summer for all seven cities. The sum of 24 elements were ranged from to in these cities. The element mass concentration ratio was the highest in Yingkou in the spring (26.15%), and the lowest in Tieling in winter (3.63%). The highest values of elements in PM2.5 were mostly found in Anshan and Fushun among the studied cities. Positive matrix factorization (PMF) modelling revealed that coal combustion, industry, traffic emission, soil dust, biomass burning, and road dust were the main sources of measured elements in all cities except for Yingkou. In Yingkou, the primary sources were identified as coal combustion, metal smelting, traffic emission, soil dust, and sea salt. Health risk assessment suggested that Mn had non-carcinogenic risks for both adults and children. As for Cr, As, and Cd, there was carcinogenic risks for adults and children in most cities. This study provides a clearer understanding of the regional pollution status of industrial urban agglomeration.

1. Introduction

With the rapid development of China’s economy and the gradual increase of urban population density and the successful progress of industrialization, the use of coal and the number of motor vehicles has increased rapidly, and the continuous industrial emissions and motor vehicle exhaust has led to serious particulate pollution. Atmospheric particulates can cause harm to human health, and studies have found that air pollution ranks fourth among the health risk factors in China, after poor dietary habits, high blood pressure, and smoking [1]. Atmospheric particulates are likely to cause respiratory and cardiovascular diseases. Studies have found that, on average, atmospheric particulates cause 3.1 million deaths globally every year [2]. Therefore, atmospheric particulate pollution has had a considerable impact on restricting the development of the country and harming human health.
Atmospheric fine particles (PM2.5), with many inorganic and organic constituents, are the primary pollutant in China [3]. They have a large surface area and act as a carrier of crustal elements and trace elements, including heavy metals (e.g., V, Cr, Mn, Ni, Cu, Zn, As, Cd, and Pb) [4]. The early stage mechanistic pathways in cells are oxidative stress and inflammation, and some of their health effects, such as alteration of acute cardiac function, are partly linked to the presence of trace metals in PM2.5 [3]. Pb can cause changes in the circulatory and nervous systems, leading to motor and cognitive impairment in newborns [5]. Higher compositions of Ni and V in PM2.5 was associated with higher cardiovascular or respiratory hospital admissions for persons 65 years and older [6]. Excessive As can affect wound repair, cause damage to lung tissue, and lead to cancer [7]. Therefore, it is of great significance to study the characteristics of heavy metal components in PM2.5 in order to evaluate the sources and health risks of atmospheric particulates.
Source apportionment and health risk assessment are often used to study particulate matter. Source analysis is essential for developing control strategies to improve air quality, with several models having been designed and widely used for this purpose, such as chemical mass balance [8,9], positive matrix factorization (PMF) [10], and principal component analysis (PCA) [11,12]. PMF is considered the most suitable tool for resource allocation. The reason is that less prior knowledge of the sources is required as compared to CMB, and PMF can limit factors such as missing data at the time of processing and the load to non-negative values as compared to PCA [8,9,11]. Source resolution has been used in many cities and regions. For example, Zhao et al. [13] analyzed 18 elements in PM2.5 samples collected in Beijing from 22 August 2018 to 21 August 2019. Based on the obtained data set, they performed PMF analyses and identified five main sources: soil and dust, vehicle non-exhaust emissions, biomass, industrial processes, and fuel combustion. Yao et al. [14] found that secondary sulfate and nitrate (54.3%), biomass combustion (15.8%), industry (10.7%), crustal materials (8.3%), vehicles (5.2%), and copper smelting (4.9%) were the major sources of PM2.5 in the Yellow River Delta National Nature Reserve of the North China Plain from January to November 2011. Health risk assessments, which consider the toxicity of heavy metals and their different exposure pathways, provide a preliminary assessment of potential health effects in humans and are widely used in current research. Some studies have integrated source apportionment with health risk evaluations to estimate source-specific health risks [4,15,16]. Peng et al. [17] assessed the contribution of sources to bound heavy metals (i.e., Cr, Co, Ni, As, Cd, and Pb) in PM2.5 in Huzhou, China, and ranked the contribution of sources to cancer risk in the following order: soil dust, coal burning, cement dust, vehicle sources, and secondary sources.
The development of urbanization in China has meant that more and more city clusters are gradually forming. Due to mutual influence, the regional transportation of air pollutants between cities makes air quality even worse [18]. Therefore, understanding the characteristics of regional pollution plays an important role in its control and minimization. At present, some research exists of cities in urban agglomeration, such as Beijing-Tianjin-Hebei, the Yangtze River Delta, and the Pearl River Delta [19,20,21,22]. However, these studies are mainly based on observations performed in single cities during single seasons [12,23,24,25], instead of being a comprehensive multi-city analysis. In order to better understand the relationship between urban clusters and the pollution situation of cities in urban agglomerations, the urban agglomeration of central Liaoning (hereafter referred to simply as “urban agglomerations”) was chosen as a case study. Liaoning Province is the most important industrial base in northeastern China. There are seven cities in central Liaoning, which is typical of an industrialized zone [26].
In this study, airborne PM2.5 aerosol sampling was carried out in central Liaoning’s urban agglomeration during the year 2018. The concentrations of 24 metal elements in aerosol samples were determined, in order to characterize the metals in PM2.5 across the four seasons. Furthermore, a positive matrix factorization (PMF) receptor model was also used to quantify the sources of these elements. Finally, the health risks induced by PM-bound metals and pollution sources were assessed separately.

2. Materials and Methods

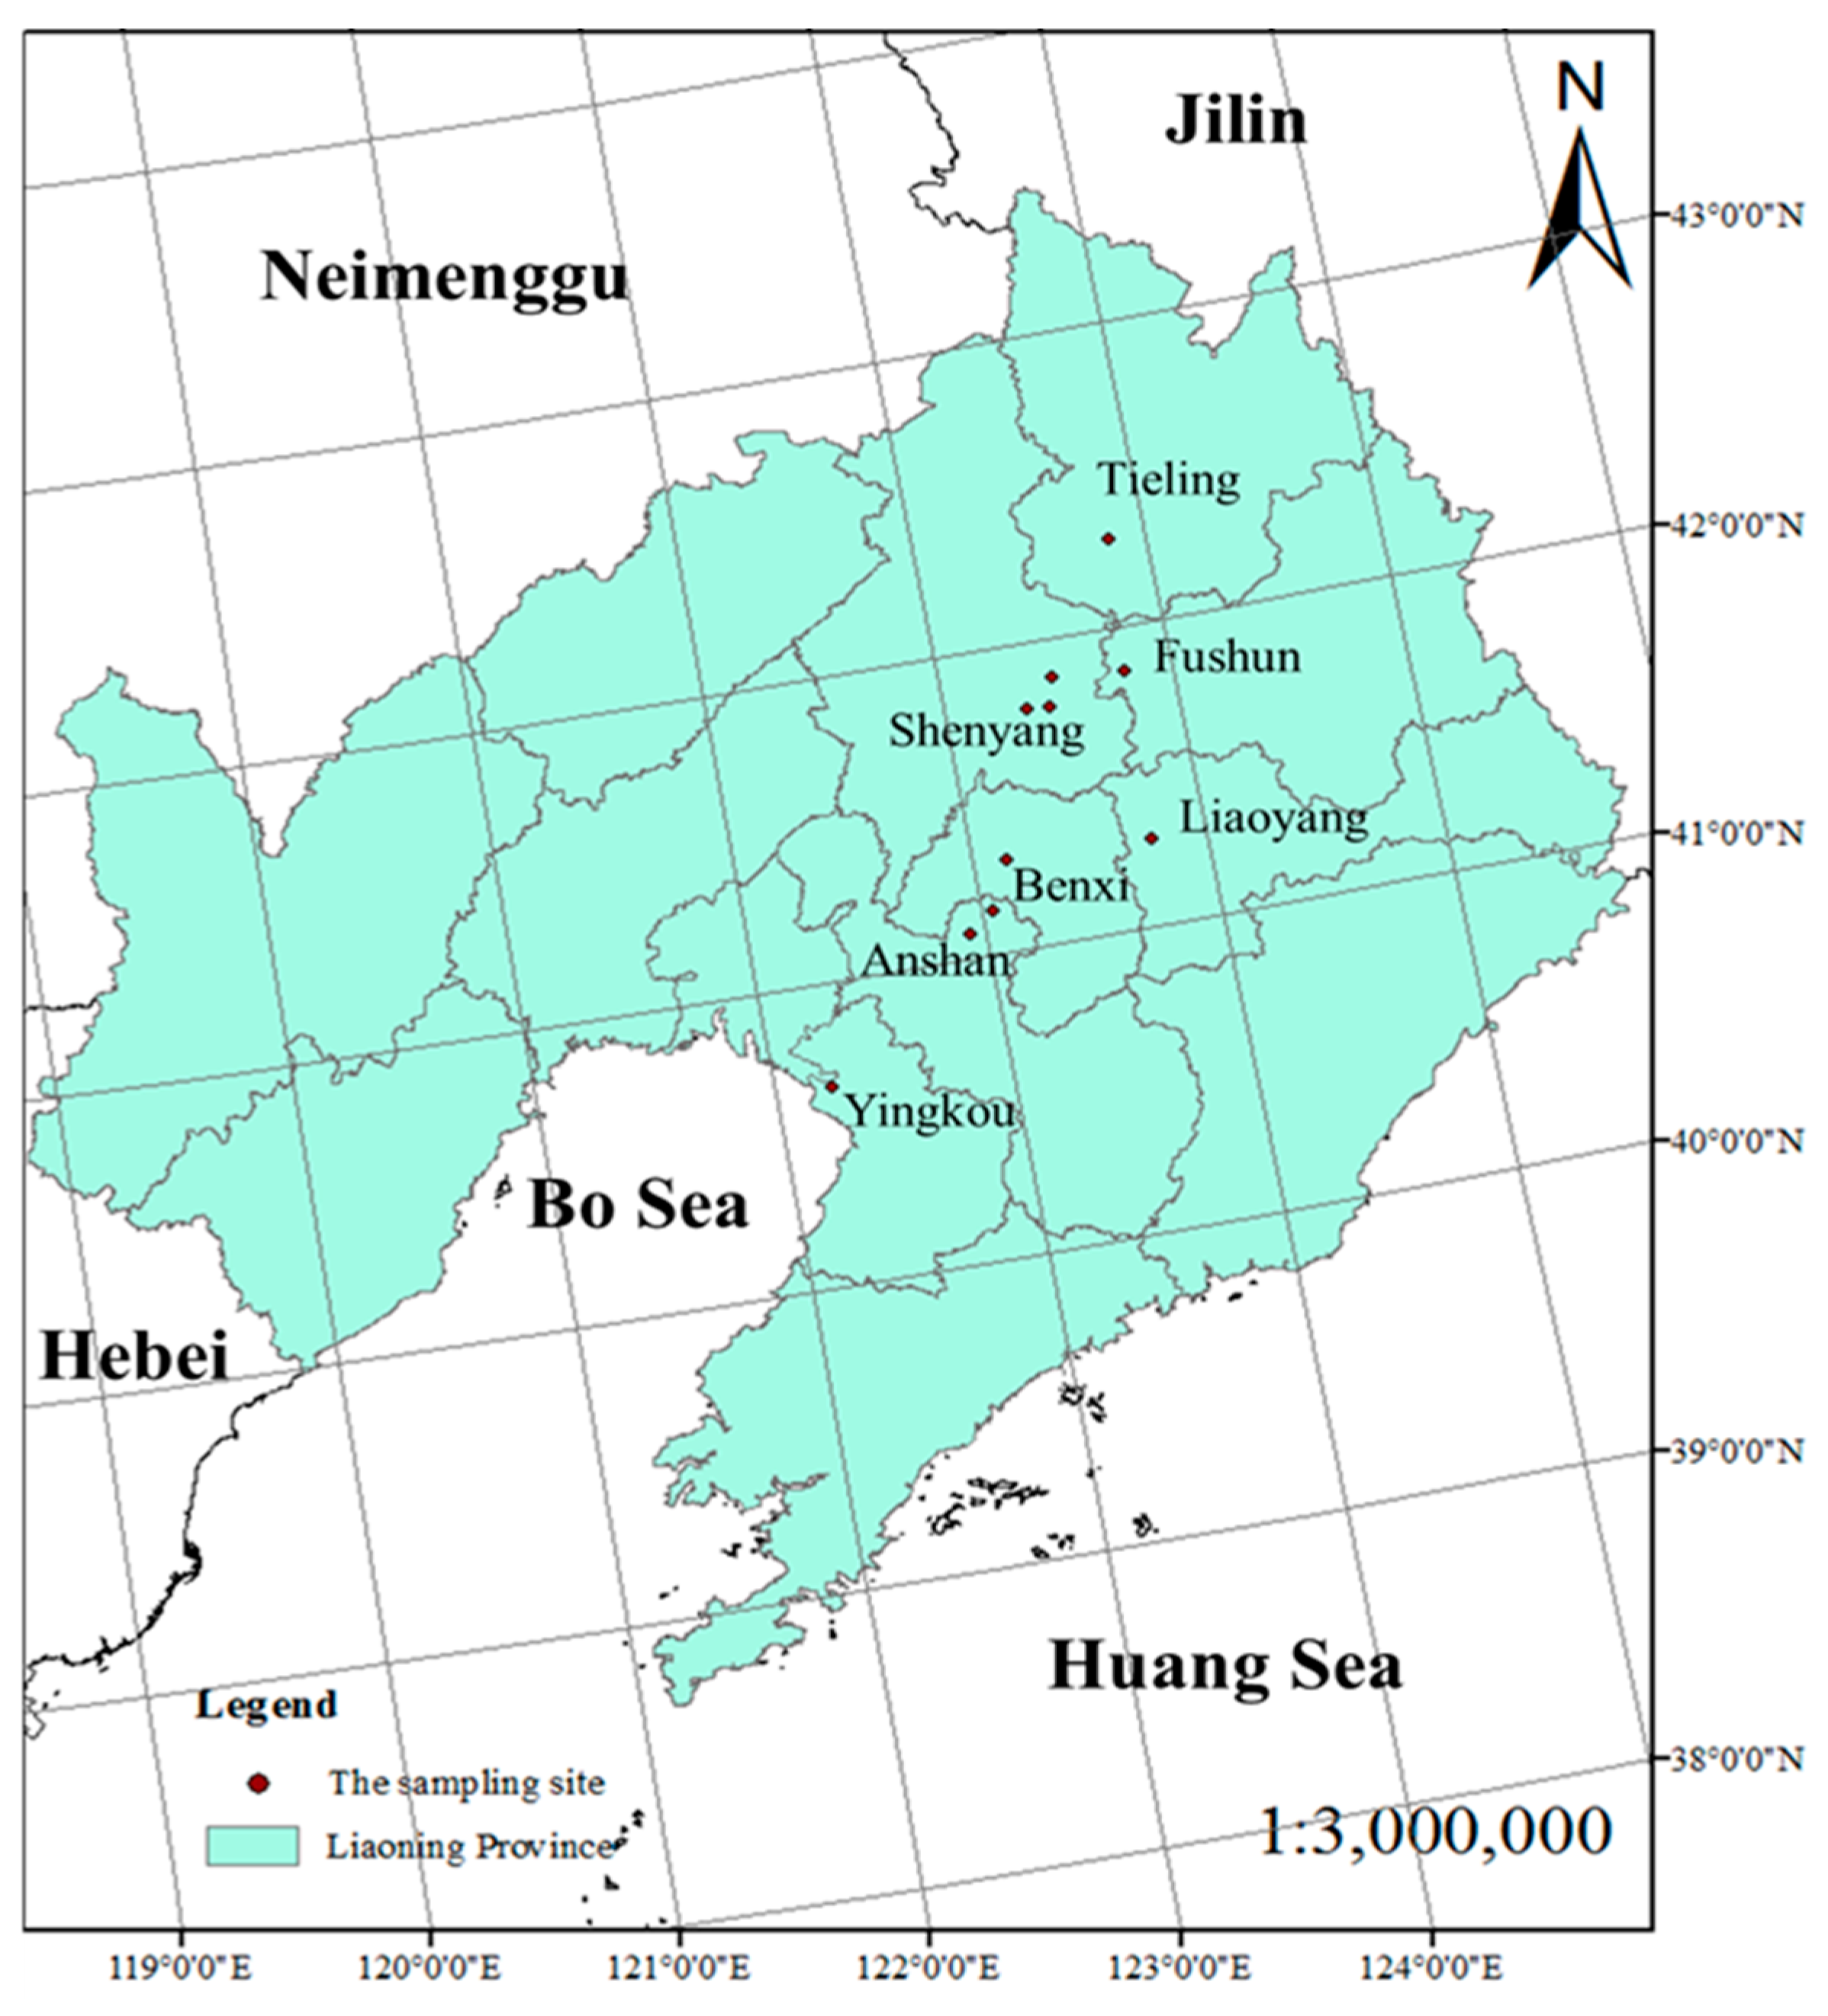
2.1. Sampling Method

In this study, PM2.5 samples were collected on Teflon filters (Φ = 47mm, Whatman, USA) by PM2.5 samplers (16.7 L/min, Comde-Derenda, Germany). Samples were taken from May 2 to 16 (spring), July 23 to August 6 (summer), October 8 to 22 (fall), and December 7 to 21 (winter), for 23 h a day. To ensure the samples were representative, sampling was avoided during rainy or windy weather. According to the population distribution, scale, industrial layout, and other factors of each city, a total of 10 sampling sites were set up for simultaneous sampling in 7 cities, including 3 in Shenyang, 2 in Anshan, and 1 in each of the other cities (Figure 1). A total of 600 samples (60 for each site) were generated for analysis. Before sampling, the Teflon filters were pre-heated to 60 °C for 4 h and conditioned in a desiccator at 20 ± 0.1 °C and 50 ± 1% relative humidity for 48h. The filters were weighed with a Comde-Derenda AWS-1 automatic weighing system (±1 μg sensitivity, Comde-Derenda, Germany) before and after sampling. Additionally, the blank filters were concurrently collected in four sampling periods for the purpose of eliminating errors. After weighing, the filters were kept in filter boxes and stored in the refrigerator at −20 °C until chemical analysis was performed.
To understand the divergence of PM2.5 and its chemical composition between different sampling sites in the same city, the coefficient of divergence (COD) was calculated.
COD j k = 1 p i = 1 p ( X i j X i k X i j + X i k ) 2   ,
where CODjk is the coefficient of divergence, p is the number of element components participating in the calculation, and X i j and X i k represent the average concentration for an element component, i, at sites j and k, respectively. It has been reported that if COD approaches 0, concentrations can be considered to be spatially homogeneous; if COD approaches 1, the difference is more significant [27,28]. As shown in Table S1, the COD value in (a) ranged from 0.12 to 0.16, and in (b) ranged from 0.12 to 0.13. Therefore, the spatial variation of the elements of PM2.5 in the same city is not significant. The average value of the sites is used to represent the concentration in Shenyang and Anshan, respectively, in subsequent discussions.

2.2. Chemical Analysis

24 metal elements were analyzed in this study. A total of 16 metallic elements (Na, K, As, Mo, Cd, Sn, Sb, V, Cr, Mn, Co, Ni, Cu, Zn, Pb, and Bi) were analyzed by inductively coupled plasma-mass spectrometry (ICP-MS) (7500a, Agilent Technologies, USA). Half of each Teflon filter carrying PM was placed in a Teflon dissolution vessel for acid treatment. Each sample was heated and refluxed with 5 mL extract (pH = 5.4) and 1 mL HF at 120 °C for 2 h and then rose to 130 °C to completely evaporate the solution. Then 10 mL 12% HCl was added and reflux was heated for 20 min. The remaining eight elements (Al, Sr, Mg, Ti, Ca, Fe, Ba, and Si) were analyzed by inductively coupled plasma-optical emission spectroscopy (ICP-OES) (Vista-MPX, Agilent Technologies, USA). Another half of each Teflon filter was placed in a nickel crucible for alkali treatment. The sample was treated with 300 °C in muffle furnace, and kept at the constant temperature for 40 min, and then gradually rose to 550 °C. The filter after ashing was humidified with absolute ethanol, and added 0.2 g solid sodium hydroxide. The mixture melted at 500 °C for 40 min in muffle furnace. The molten sample was transferred to a volumetric flask containing 2 mL HCl, and diluted to 10 mL with ultra-pure water [28,29]. The ICP-MS detection limits of Na, K, As, Mo, Cd, Sn, Sb, V, Cr, Mn, Co, Ni, Cu, Zn, Pb, and Bi were 0.7639, 1.0271, 0.0143, 0.0012, 0.0003, 0.0011, 0.0007, 0.0017, 0.0168, 0.0094, 0.0004, 0.0091, 0.026, 0.1144, 0.0054, and 0.0001 µg L−1. And the ICP-OES detection limits of Al, Sr, Mg, Ti, Ca, Fe, Ba, and Si were 0.45, 0.004, 0.47, 0.24, 0.39, 1.81, 0.02, and 0.69 µg L−1.

2.3. PMF Model

PMF is a receptor source resolution model which has been widely used in the study of atmospheric particulate matter source resolution. It operates by using the least squares method to determine the main source of pollutants and calculates the contribution rate of each non-negative factor to the pollution source and the time change sequence [23,30]. The spectrum matrix of the receptor component can be divided into two non-negative sub-matrices, which respectively represent the factor contribution matrix and the factor component spectrum matrix. This is demonstrated by the following formula:
X = GF + E,
where X is an n × m matrix, representing the spectrum of the receptor components, G is an n × p matrix, representing factor contribution; F is a p × m matrix, representing the factor component spectrum; n is the number of samples; m is the number of chemical components; p is the number of factors; and E is the residual matrix.
E is expressed by the coefficient in the matrix, as shown in the following formula:
X i j = i = 1 p g i k f k i + e i j ,
where X i j is the concentration of component j in sample i; P is the number of factors; fkj is the concentration of component j in the component spectrum of factor k; g i k is the relative contribution of k factor to i sample; and eij is the residual of j component on i sample during PMF calculation.
When the PMF model runs, the factor contribution matrix and factor component spectrum matrix are limited to non-negative results, and thus each element in G and F will not have negative values. The optimal result is obtained when “ X 2 ” is the smallest, represented by Q, as shown in the following formula:
Q = i = 1 n i = 1 m ( e i j σ i j ) 2 ,
where eij is the residual of component j in sample i, and σij is the uncertainty of component j in sample i.
In this study, the PMF 5.0 model (USEPA) was used for source apportionment of 24 measured elements in PM2.5. Firstly, the concentrations and uncertainty were input, and a series of data checks (signal-to-noise (S/N) ratio, concentration relation, time series, etc.) were conducted. If the S/N ratio was greater than 1, the species was marked “Strong”. If the S/N ratio was between 0.5 and 1, it was categorized as “Weak”. If the S/N ratio was less than 0.5, it was categorized as “Bad”. In addition, based on the concentration relation and time series, if some species were modelled poorly, they were additionally categorized as “Bad”. Following this, the run times and the number of factors were selected to run on Basic settings, and the minimum Q (Robust) was selected from the results. Finally, the feasibility of the solution was investigated via comparison between the simulated value and the observed value and residual analysis, and the pollution source category was determined according to the factor spectrogram. Combined with the factor contribution, the preliminary source analysis results of annual PM2.5 in the urban agglomeration were given.

2.4. Health Risk Assessment

Health risk assessment is a model recommended by the United States Environmental Protection Agency (EPA) to evaluate the population exposure level and health risk of ambient particle-bound heavy metals [31]. Generally, there are three ways for heavy metals to enter the human body: via the respiratory system, skin contact, and hand-oral intake [15,32]. Due to incomplete data on skin contact and hand-oral intake, only carcinogenic and non-carcinogenic risks were considered as they related to the respiratory pathway. Therefore, this study investigated non-carcinogenic and carcinogenic risks of nine heavy metal elements (V, Cr, Mn, Ni, Cu, Zn, As, Cd, and Pb) entering the human body through respiratory channels. Different age groups have different sensitivities to air pollutants, so we divided the exposed population in the study area into two age groups: children and adults. In this study, the average daily exposure (ADD) of 9 heavy metal elements and the lifetime average daily exposure (LADD) of Cr, Ni, As, and Cd were calculated by the following formulae:
ADD = C UCL × EF × ED AT × BW × InhR ,
LADD = C UCL × EF AT × ( InhR child × ED child BW child + InhR adult × ED adult BW adult ) ,
where EF is exposure frequency in days per year; ED is the exposure duration in years; AT is the risk averaging exposure time, where AT = ED × 365 (days) for non-carcinogenic risk and AT = 70 × 365 (days) for carcinogenic risk; BW is the body weight (kg); and InhR is the inhalation rate (m3/day). The parameters involved in the exposure assessment are described in Table S2 [33,34,35]. CUCL is the concentration of heavy metal elements, mg/m3. In order to improve the accuracy of evaluation results and obtain a reasonable maximum exposure, the upper limit of 95% confidence interval is used to estimate the reasonable maximum exposure, and the calculation formula is as follows:
C UCL = X ¯ + [ Z α + β 6 n × ( 1 + 2 × Z α 2 ) ] × STD n ,
where X ¯ is the arithmetic mean, STD is the standard deviation, β is the skewness coefficient, α is the error probability, Zα is the quantile of the standard normal distribution of (1-α), and n is the number of samples.
The health risk of every evaluated element was divided into the non-carcinogenic risk (HQ) of a single metal, the total non-carcinogenic risk (HI), and the carcinogenic risk (Risk), which were calculated by the following equations:
HQ i = ADD i / Rfd i ,
HI = HQ i ,
Risk = LADD × SF ,
where ADDi is the average daily exposure to metal i entering the human body through respiratory channels (mg/kg·d), RfDi is the reference value of daily exposure health risk of i metal entering the human body through respiratory channels (mg/kg·d), LADD is the lifetime daily exposure of carcinogenic heavy metals through respiratory channels (mg/kg·d), and SF is the carcinogenic slope factor of heavy metal elements (kg·d/mg). When HI(HQ) ≤ 1, there is no health hazard, whereas when HI (HQ) > 1, there is a possible health hazard. When Risk is between 10−6 and 10−4, risk management measures should be taken [15,32]. Table S3 shows the RfD and SF values of heavy metal elements entering the human body through respiration [36].

3. Results and Discussion

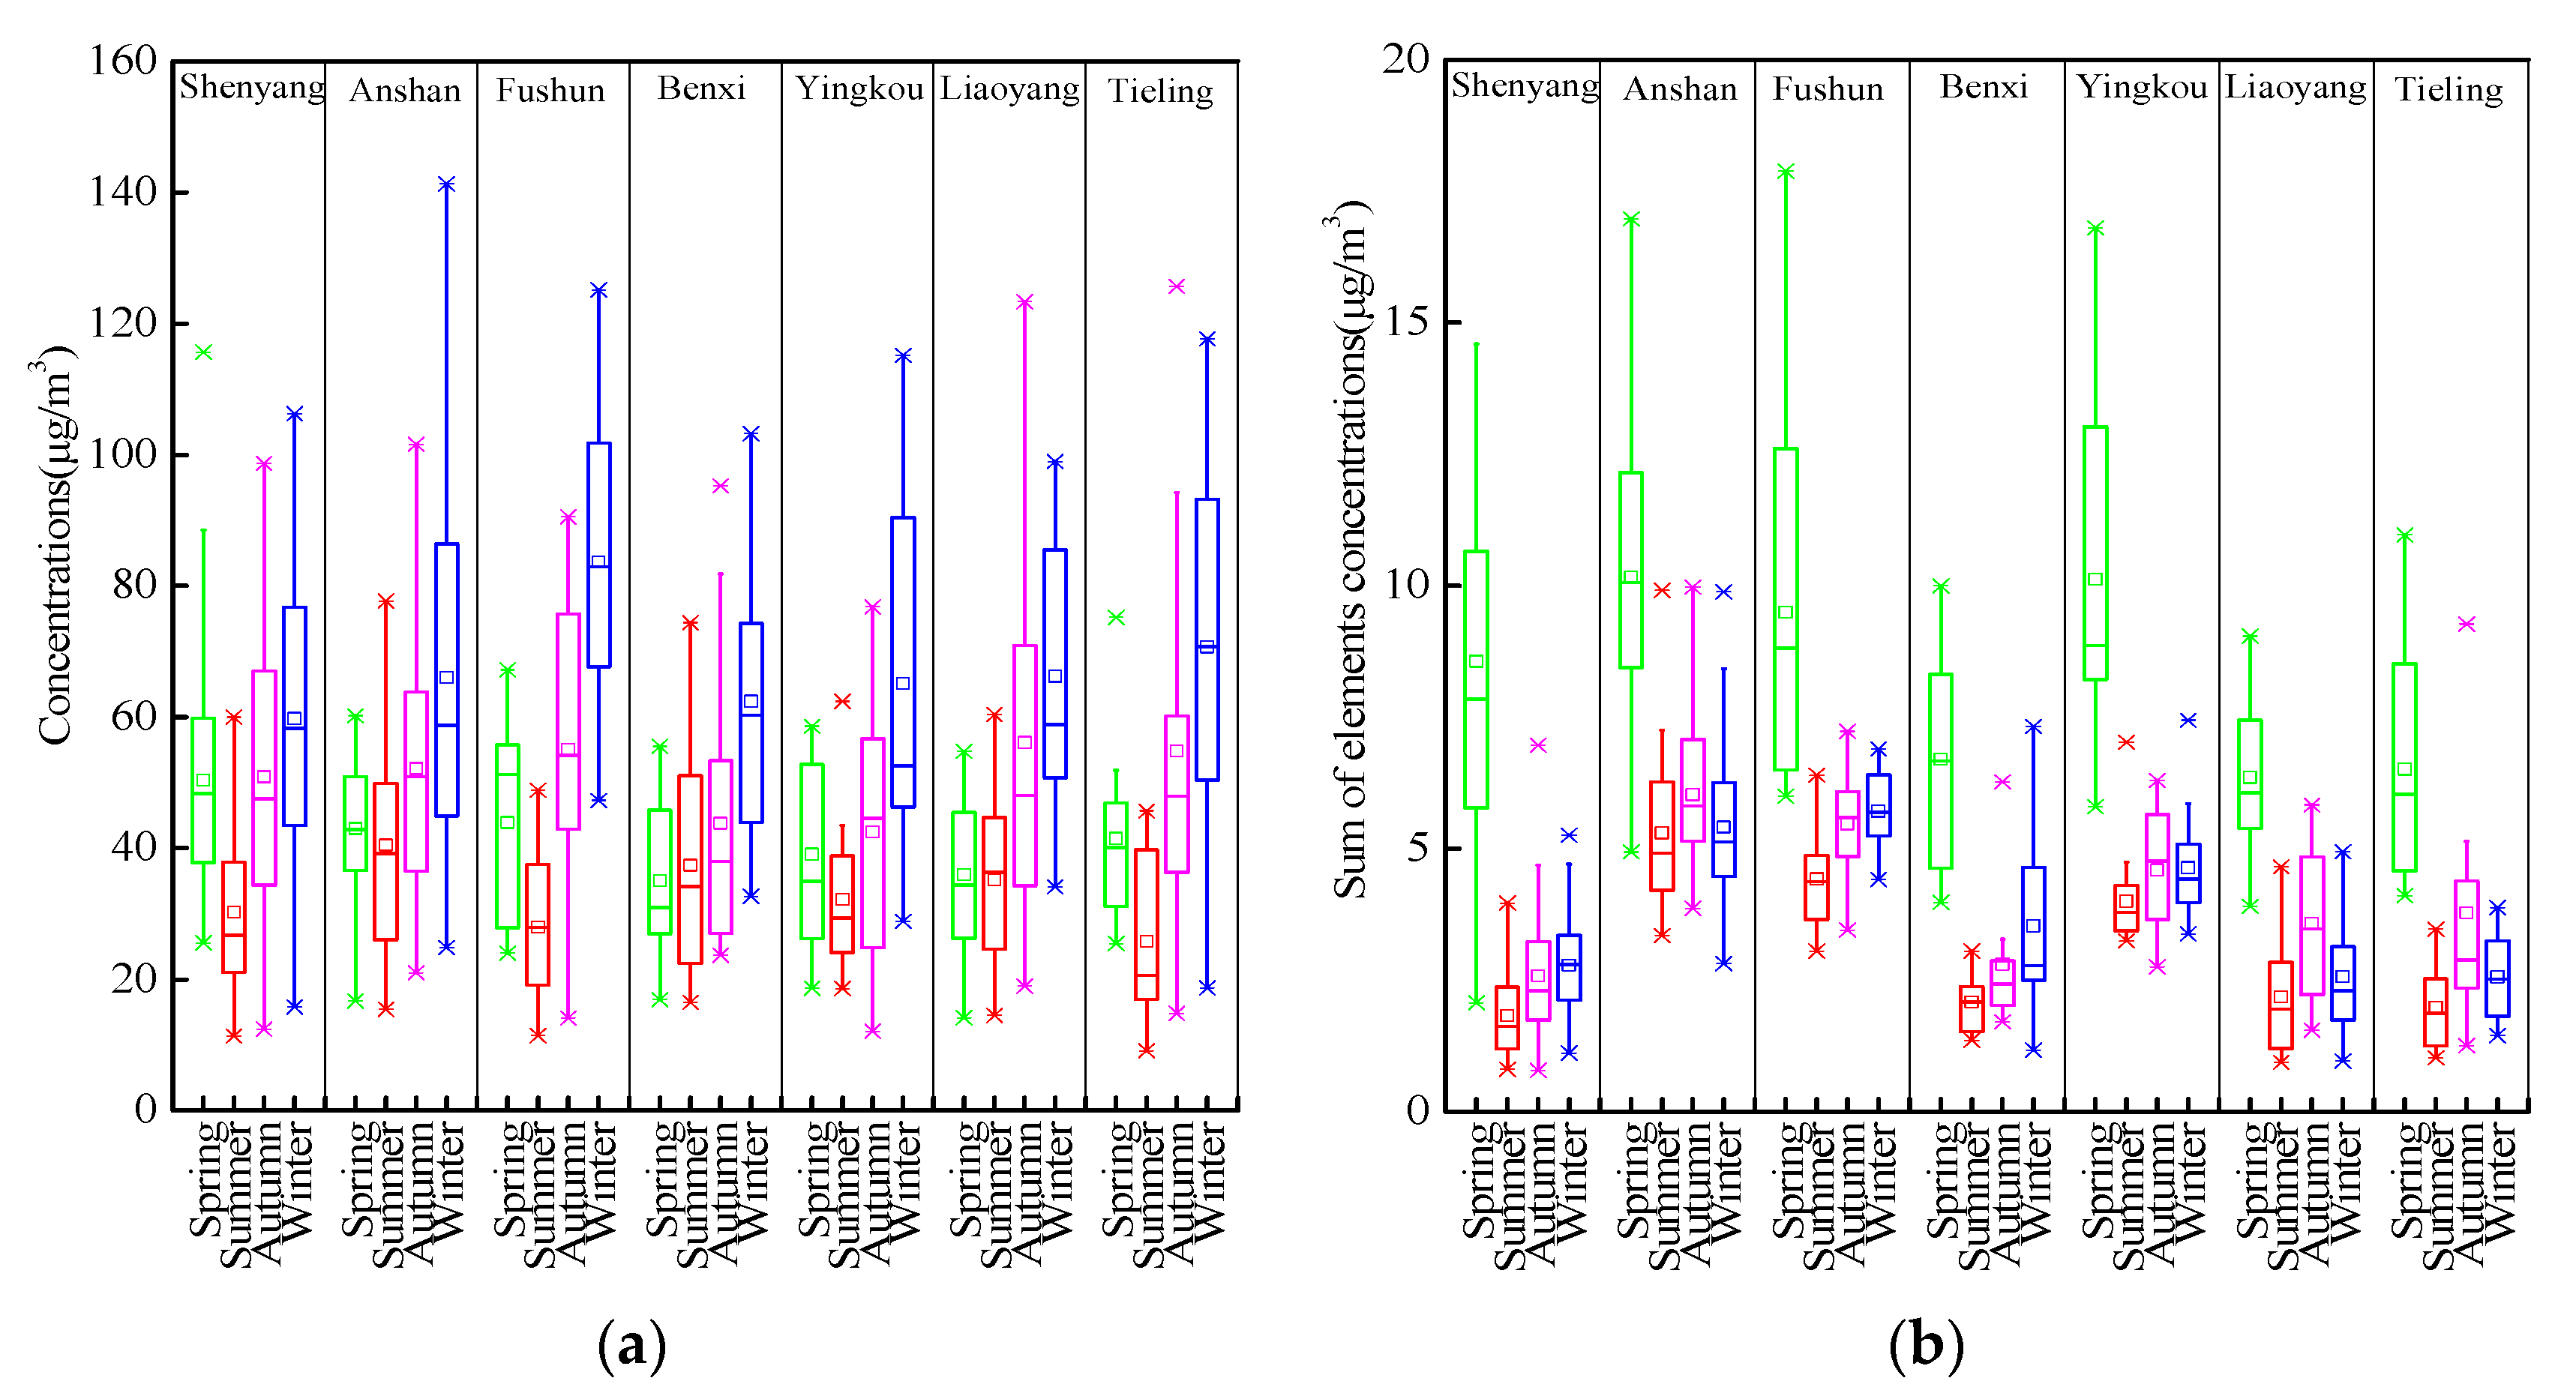
3.1. General Element Concentrations in PM2.5

Figure 2a shows the seasonal mean concentrations of PM2.5 measured at the seven cites. In the measurement, the annual mean concentrations of PM2.5 within the urban agglomeration is 48.10 µg/m3, which was much higher than the limit of annual average PM2.5 in ambient air quality standards in China (Grade II, 35 μg/m3, GB 3095-2012). There was little difference in annual average concentrations of PM2.5 in the seven cities. The highest annual concentration was 52.62 μg/m3 in Fushun and the lowest was 44.67 μg/m3 in Benxi. However, the annual mean concentration of PM2.5 is lower than that in Xinxiang (112 µg/m3), Agra (190 µg/m3), and Delhi (131 µg/m3) [35,36,37], and close to that in Shanghai (47 µg/m3) and Chifeng (36.2 µg/m3) [38,39]. PM2.5 concentrations presented obvious seasonal variations throughout the year, with an order of winter > autumn > spring > summer at all sites in the urban agglomeration. In Fushun, the average concentrations of PM2.5 in winter was 83.63 μg/m3, nearly three times its concentration in summer (27.95 μg/m3). The seasonal patterns, which showed maximum levels in winter and minimum levels in summer, were similar to those observed at many urban cites in China, e.g., Beijing, Wuhan, and Shandong [24,25,32]. The concentrations peak in winter partially due to the reduced height of the atmospheric mixing layer, the stable inversion layer that frequently forms, which inhibits the diffusion of pollutants. This is further amplified by relatively low precipitation [40]. In addition, extra coal consumption for heating resulted in high particle emissions and further exacerbated the decrease in air quality during the cold season [41].
Figure 2b is the seasonal mean concentrations of the sum of elements in PM2.5 measured at the seven sites. The sum of 24 elements was ranged from to in these cities. The element concentration ratio was much higher in spring than it was during the other three seasons. This is due to the higher concentrations of crustal elements in spring, and the mass of crustal elements was far greater than that of man-made elements. In spring, the element mass concentration ratio of Yingkou was the highest at 26.15%. This corresponds to the high proportion of soil dust (30.47%) in the sources of pollution identified in Yingkou, as demonstrated by the PMF results (see Section 3.3). In winter, the element mass concentration ratio of Tieling was the lowest at 3.63%. This is due to the overall high mass concentration of PM2.5 in Tieling.

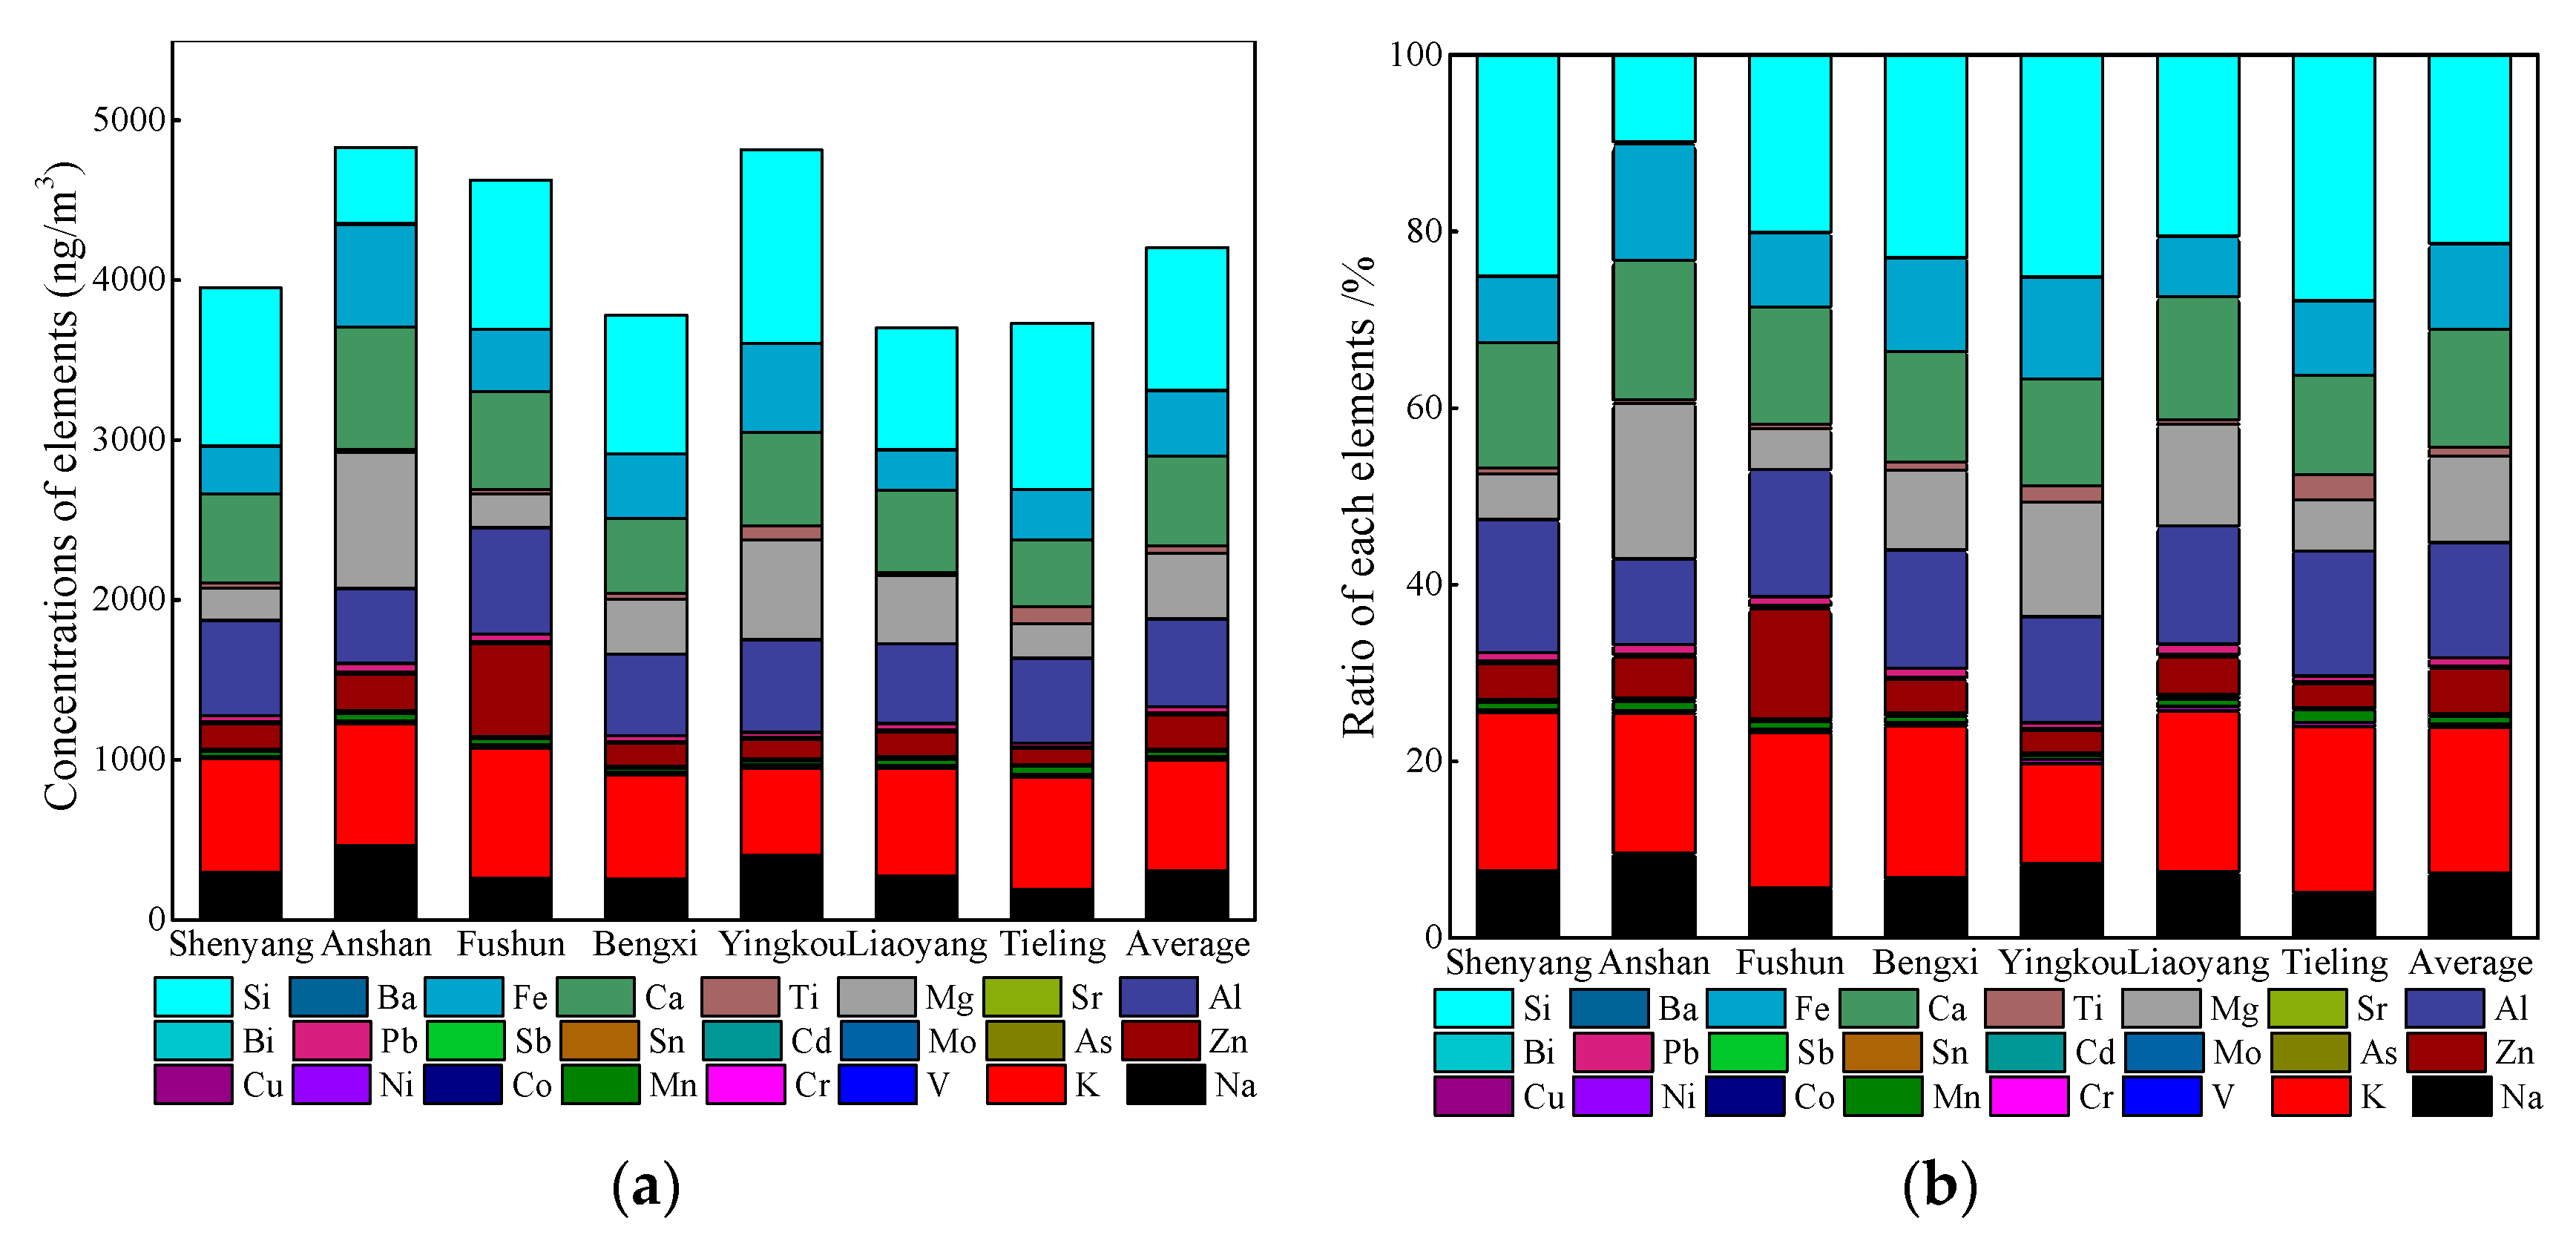
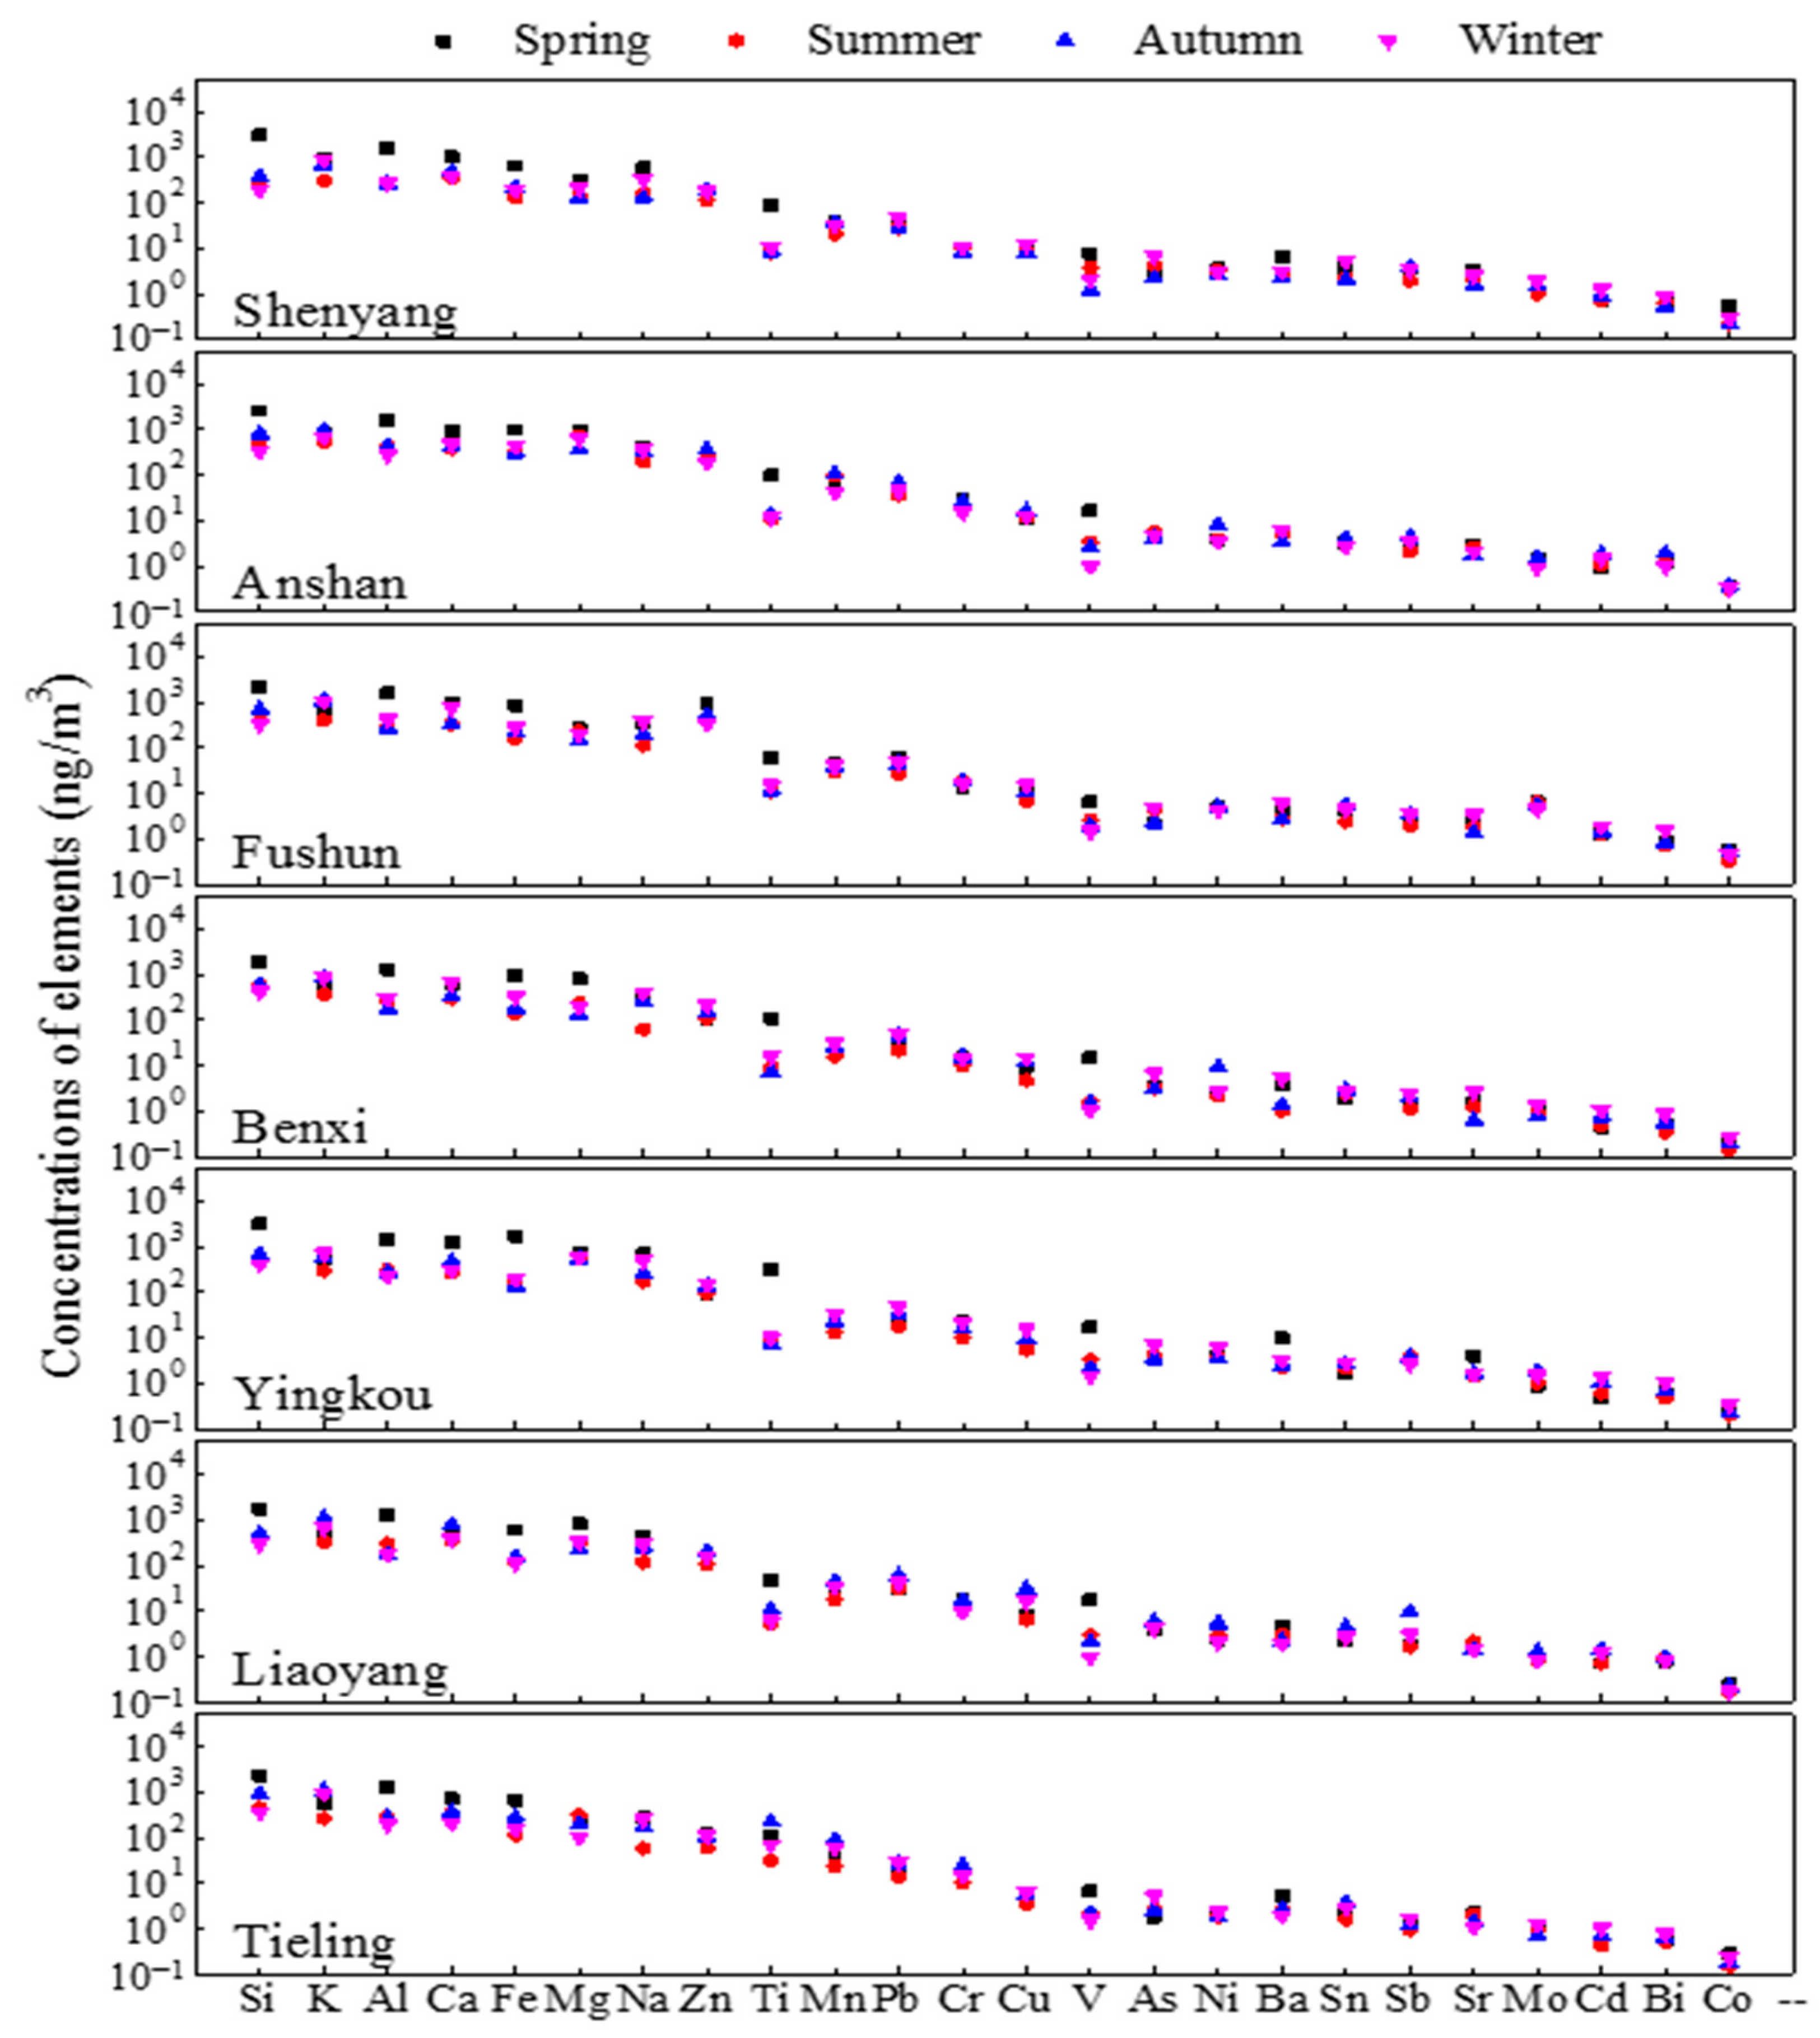
3.2. Element Composition

24 elements in PM2.5 (Na, K, V, Cr, Mn, Co, Ni, Cu, Zn, As, Mo, Cd, Sn, Sb, Pb, Bi, Al, Sr, Mg, Ti, Ca, Fe, Ba, and Si) were measured in this study. As shown in Figure 3, the measured crustal element (Na, K, Al, Mg, Ti, Ca, Fe, and Si) accounted for 91.95% of the make-up of PM2.5 in the study area, while the proportion of man-made elements in PM2.5 was 8.05%. Among them, the highest concentration was seen for Zn at 211.18 ng/m3. The high concentrations of Mg in Anshan and Yingkou were due to the relatively developed magnesite clinker industries present in these cities. The reserves of magnesite deposits in Anshan are 2.76 billion tons, accounting for 79% of those in China and 20% of those worldwide [42]. The reserves of magnesite in Yingkou are 1.48 billion tons, and the industrial added value of the magnesite clinker industry accounts for 14.5% of the whole industry in 2018 [43]. The concentration of K was highest in Fushun due to the presence of biomass combustion [14,32], while Zn, Co, and Sn concentration were high due to the large amount of traffic emissions [19,44,45]. The highest concentrations of Si were seen in Anshan and Tieling at 1207.18 ng/m3 and 1038.72 ng/m3, respectively. Since Si is the marker element of soil dust [28], the contribution of dust in these two places may be relatively high. In Anshan, the highest concentration of As and Cr was due to coal combustion [46,47,48]. Overall, the highest concentrations of individual elements were mostly found in Anshan and Fushun. Compared to other cities in China, concentrations of Si, Ca, and Ti, are higher in this study. Frequent dust weather and intensive construction activities were the important reasons [49]. Intense open burning of biomass straws lead to a higher concentration of K observed in southeastern area of Inner Mongolia (Chifeng) [39]. Previous studies have shown that V and Ni are mainly originated from diesel and fuel oil combustion, and their concentrations in this study are significantly lower than those in Shanghai [38]. Compared with cities of developed countries, such as Hamilton, Canada [50], content of metal elements in PM2.5 in Liaoning is significantly higher, and concentration is 10–100 times higher than that in these areas. In New Delhi, India, a developing country, most of its elements are one or two orders of magnitude higher than Liaoning’s urban agglomeration [37].
The concentrations of different elements vary across different seasons. Figure 4 shows the changes in concentration of 24 elements over time and space. The concentration of K was relatively high in autumn and winter in all cities except Shenyang; this is because K is identified as a marker element of biomass combustion [32], which mostly occurs in autumn and winter in this area. The concentration of K was highest overall in Anshan, Fushun, and Liaoyang, which is the same as the results indicated by the PMF. The concentration of Ca was high in spring, which is due to the sand blown into the air by the heavy spring winds and the pollution caused by soil dust [19]. The concentration of Ca was the highest in Yingkou, which corresponds to soil dust’s large contribution (30.47%) in the PMF results. The concentrations of Mg are explained by the same mechanisms as Ca, as the crustal elements had higher concentrations in spring. The concentrations of Mg were highest in Anshan due to the presence of the magnesite clinker industry. The concentration of As is the highest in winter, as it is an indicator element of coal combustion, and coal combustion increases in the cold months. Due to the high As concentration in Anshan and Liaoyang, the contribution of coal combustion as a pollution source is also high. The concentration changes of Cd and Pb were the same as those of As, both of which were higher in winter, which was also demonstrated by research conducted in Xianlin, Nanjing [30]. The highest concentrations of all three elements were seen in Anshan. In general, the concentrations of most crustal elements were higher in spring, while the concentrations of man-made elements were higher in winter.

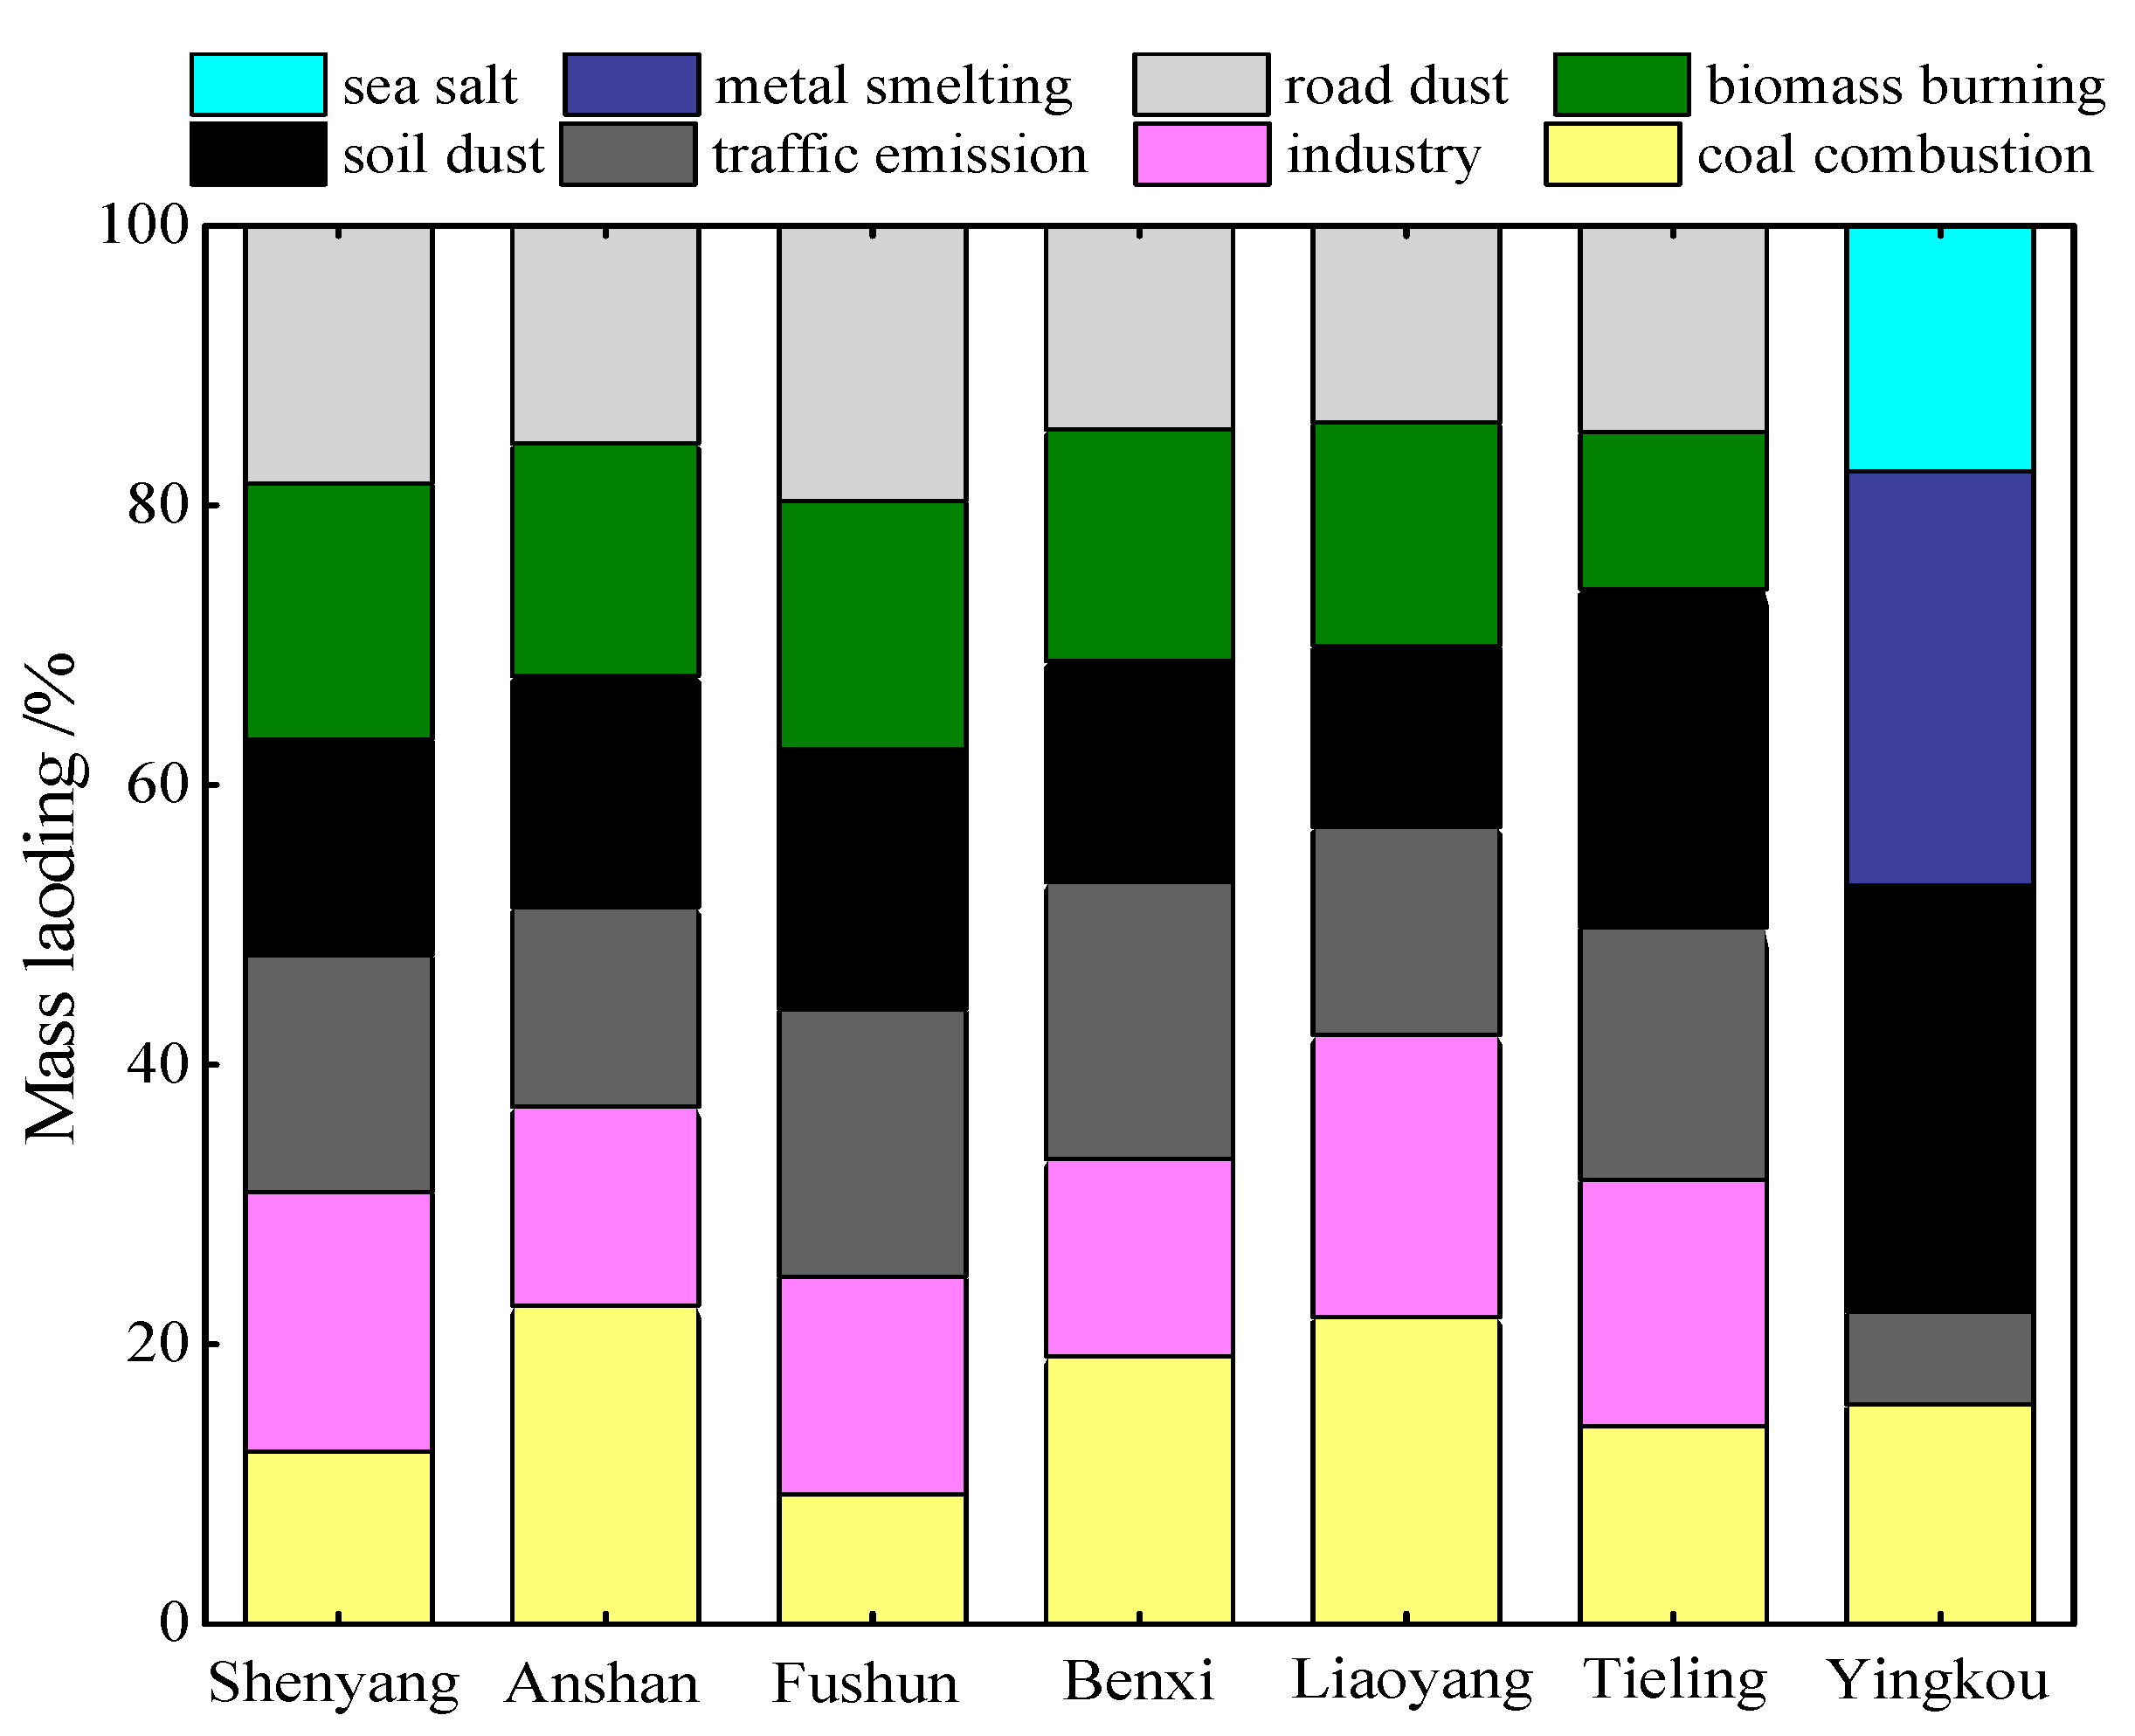
3.3. Source Identification

PMF analysis was conducted to investigate the sources of PM2.5 pollution in the urban agglomeration. Because Yingkou is close to the sea, whereas the industrial structure of the other six cities is similar, the PMF source analysis of the other six cities is done together, excluding Yingkou. Three, four, five, six, and seven sources were separately tested in the PMF analysis for optimum results. Based on the PMF simulation results, combined with regional and local emissions, different pollutant factors for different cities were identified.
Six factors were identified by PMF analysis in the six cities excluding Yingkou. The factor profiles are shown in Figure S1. The Q(true)/Q(exp) value of PM2.5 was 0.97, indicating that the analytical result was reasonable. These six sources were identified as (1) coal combustion, (2) industry, (3) traffic emission, (4) soil dust, (5) biomass burning, and (6) road dust. Coal combustion is characterized by the high loadings of the crustal elements As (36.80%), Cr (26.40%), and Na (23.23%). A study in Taiwan [46] discovered that high concentrations of As and Cr were attributed to coal combustion. Many other studies have also verified a connection between high levels of As and Cr and coal combustion [40]. Zhang et al. [44] stated that the presence of Na in airborne PM2.5 in Beijing was another element associated with coal combustion. These elements have commonly been identified as tracers for coal combustion [44,45,46]. The second factor, industry emissions, is characterized by high loadings of V (63.88%) and Ni (30.55%). Ni and V are elements known to come from oil combustion [46]. V is a tracer for any oil combustion process that uses raw materials in an industrial setting [46]. Ni is released from the burning of fuels (coal and oil combustion) and by electroplating units [35]. The third factor, traffic emission, is characterized by elevated levels of Zn (25.60%), Mo (53.83%), and Sn (30.82%). Zn can originate from tire abrasion, brake linings, lubricants, and corrosion of vehicular parts [30]. Mo comes from gasoline/diesel engine emissions [46]. Sn likely results from the abrasion of tires and brake linings [51]. Soil dust, the fourth factor, is characterized by high concentrations of crustal elements including Si (78.79%), Ti (63.67%), Al (53.22%), and Fe (46.15%). The reason this source contribution peaked in spring is probably due to the occurrence of dust storms, which occur frequently in the dry climate of spring [14]. Si, Al, Ti, and Fe were the dominant chemical components in soil dust profiles [19]. Factor five was notably characterized by high levels of K (48.58%) and was determined to be related to the burning of biomass [14,32]. Finally, the sixth factor contained a high proportion of Ca (48.92%), Ba (60.34%) Mg (30.13%), and Fe (24.50%). Mg, Ca, and Fe are mainly crustal elements, and Fe may come from the wear of tires and metal parts [13]. In addition, Ba is significantly linked to car brake linings and emissions from wearing [3]. As a result, factor six was identified as road dust.
Five factors were identified by PMF analysis in Yingkou, and the factor profiles are shown in Figure S2. The Q(true)/Q(exp) value of PM2.5 was 0.85, indicating that the analytical result was reasonable. These five sources were identified as (1) coal combustion, (2) metal smelting, (3) traffic emission, (4) soil dust, and (5) sea salt. The first factor, coal combustion, is characterized by the high loading of the crustal elements As (58.67%), Ni (64.24%), and Zn (47.33%). The make-up of this factor differed slightly from that of the urban sites above. Coal combustion is also an important source of carbonaceous aerosols in north China. As and Zn are the identifying elements of coal combustion, and V comes from coal burning [35]. These elements have commonly been distinguished as tracers for coal combustion [3]. The second factor, metal smelting, was notably characterized by V (44.30%), Fe (63.38%), Al (55.03%), and Ti (45.39%). Fe in ambient aerosols can be categorized as steel-related, but other metals such as V, Al, and Ti are also associated with iron and steel processing [30]. Factor three, traffic emission, displays high loadings for Zn (39.92%), Cu (45.21%), Mo (68.67%), and Sn (32.39%). These aerosol species are all enriched in vehicular emissions. Factor four, soil dust, was characterized by Si (41.59%), Ca (37.20%), and Mg (52.13%). Si, Ca, and Mg are crustal elements mostly originating in soil. Factor five was identified as sea salt due to high Na (73.78%) and median Mg (34.55%). Na is commonly found near the ocean, mainly depending on sea waves and evaporation [32]. This is due to Yingkou being a coastal city.
The contributions of each source to each city are shown in Figure 5. Except Yingkou, the contribution values of the six factors in the other six cities have little difference, indicating that the difference of pollution sources among cities is small. The contributions of coal combustion in Anshan, Benxi, and Liaoyang were 22.76%, 19.80%, and 22.91%, respectively, indicating that there was more coal-burning in these cities. Shenyang had the largest contribution of industrial sources at 18.6%, which was due to its large number of industries. In Fushun, road dust contributed 19.71%. This may be because there is a road around the site used for sampling and more vehicles pass by, which produces a considerable amount of dust. The contribution of soil dust in Tieling was up to 30%. As for Yingkou, soil dust and metal smelting contributed 30.47% and 29.63%, respectively. The contribution of traffic emissions was the least as 6.64%. Metal smelting was steady across the four seasons. In the spring and summer, the contribution of soil dust was relatively high because of agricultural activity. Coal combustion sources increased significantly in the autumn and winter.

3.4. Health Risk Assessment

Exposure to PM2.5 bound metals may pose serious carcinogenic or non-carcinogenic risks to humans, depending on various factors such as exposure concentration, duration, and frequency [28,52]. Moreover, the level of toxicity affecting the human population caused by specific metals may depend on the persistent emission of these metals from one or more sources [32].

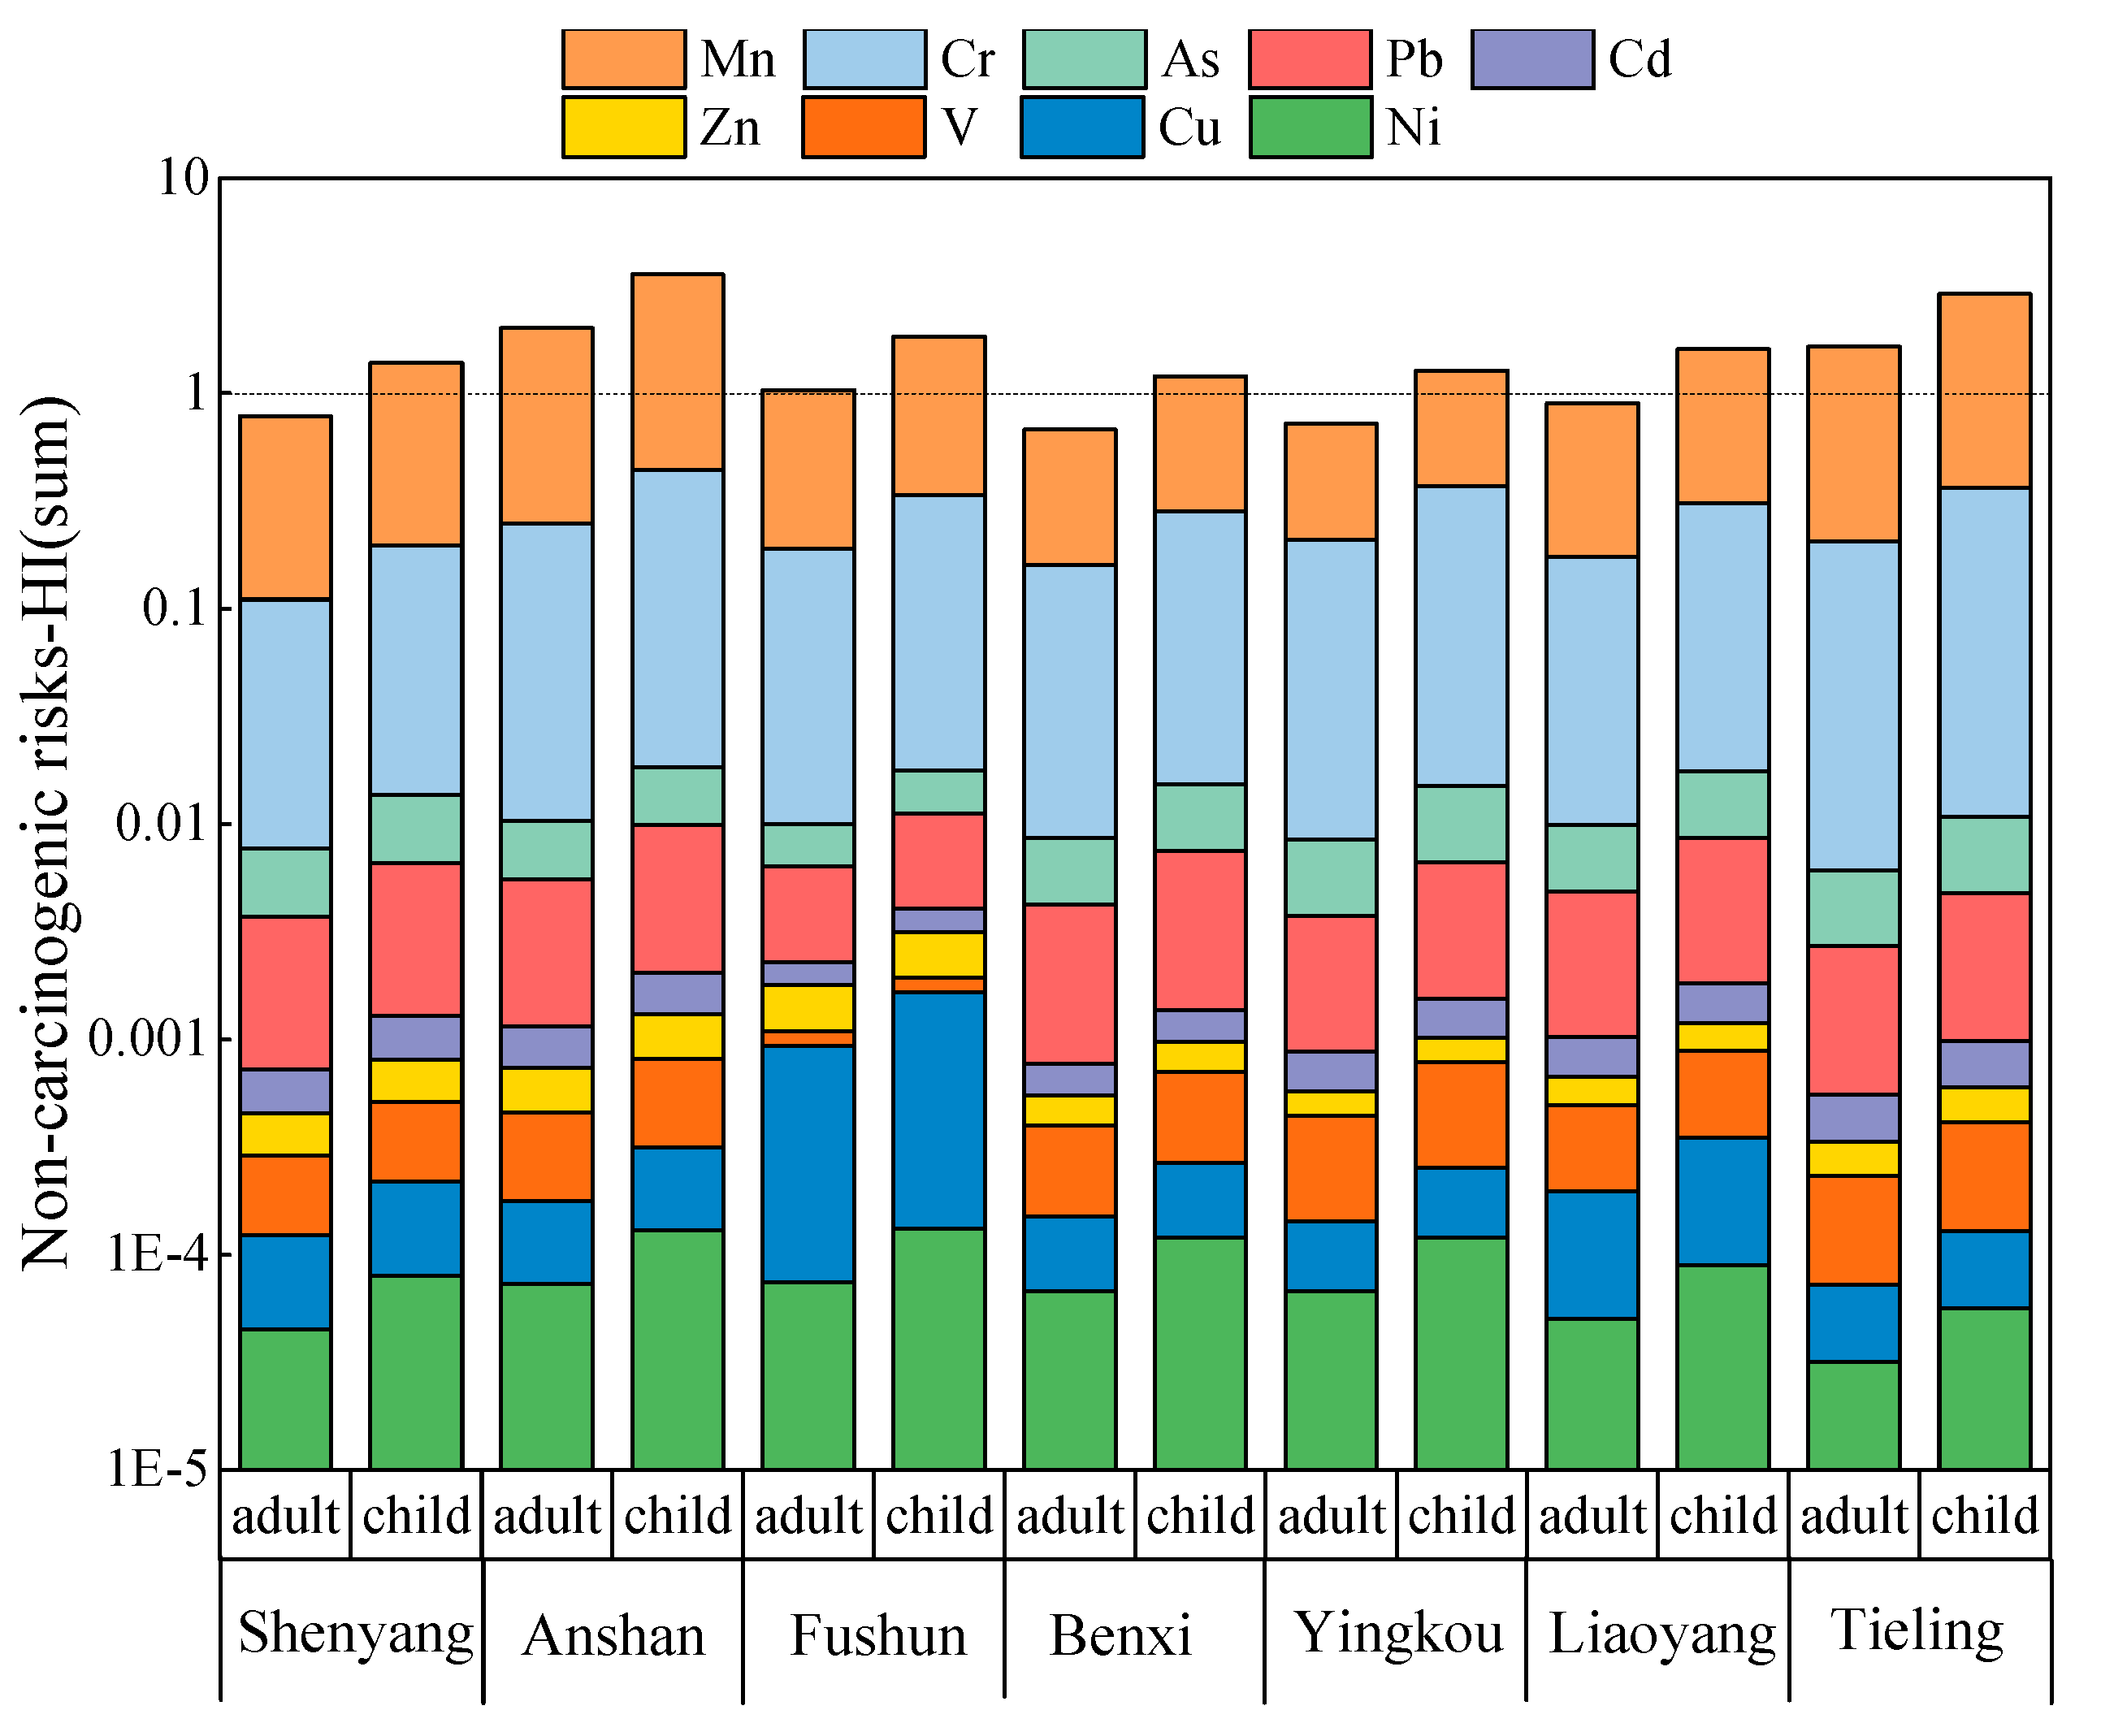
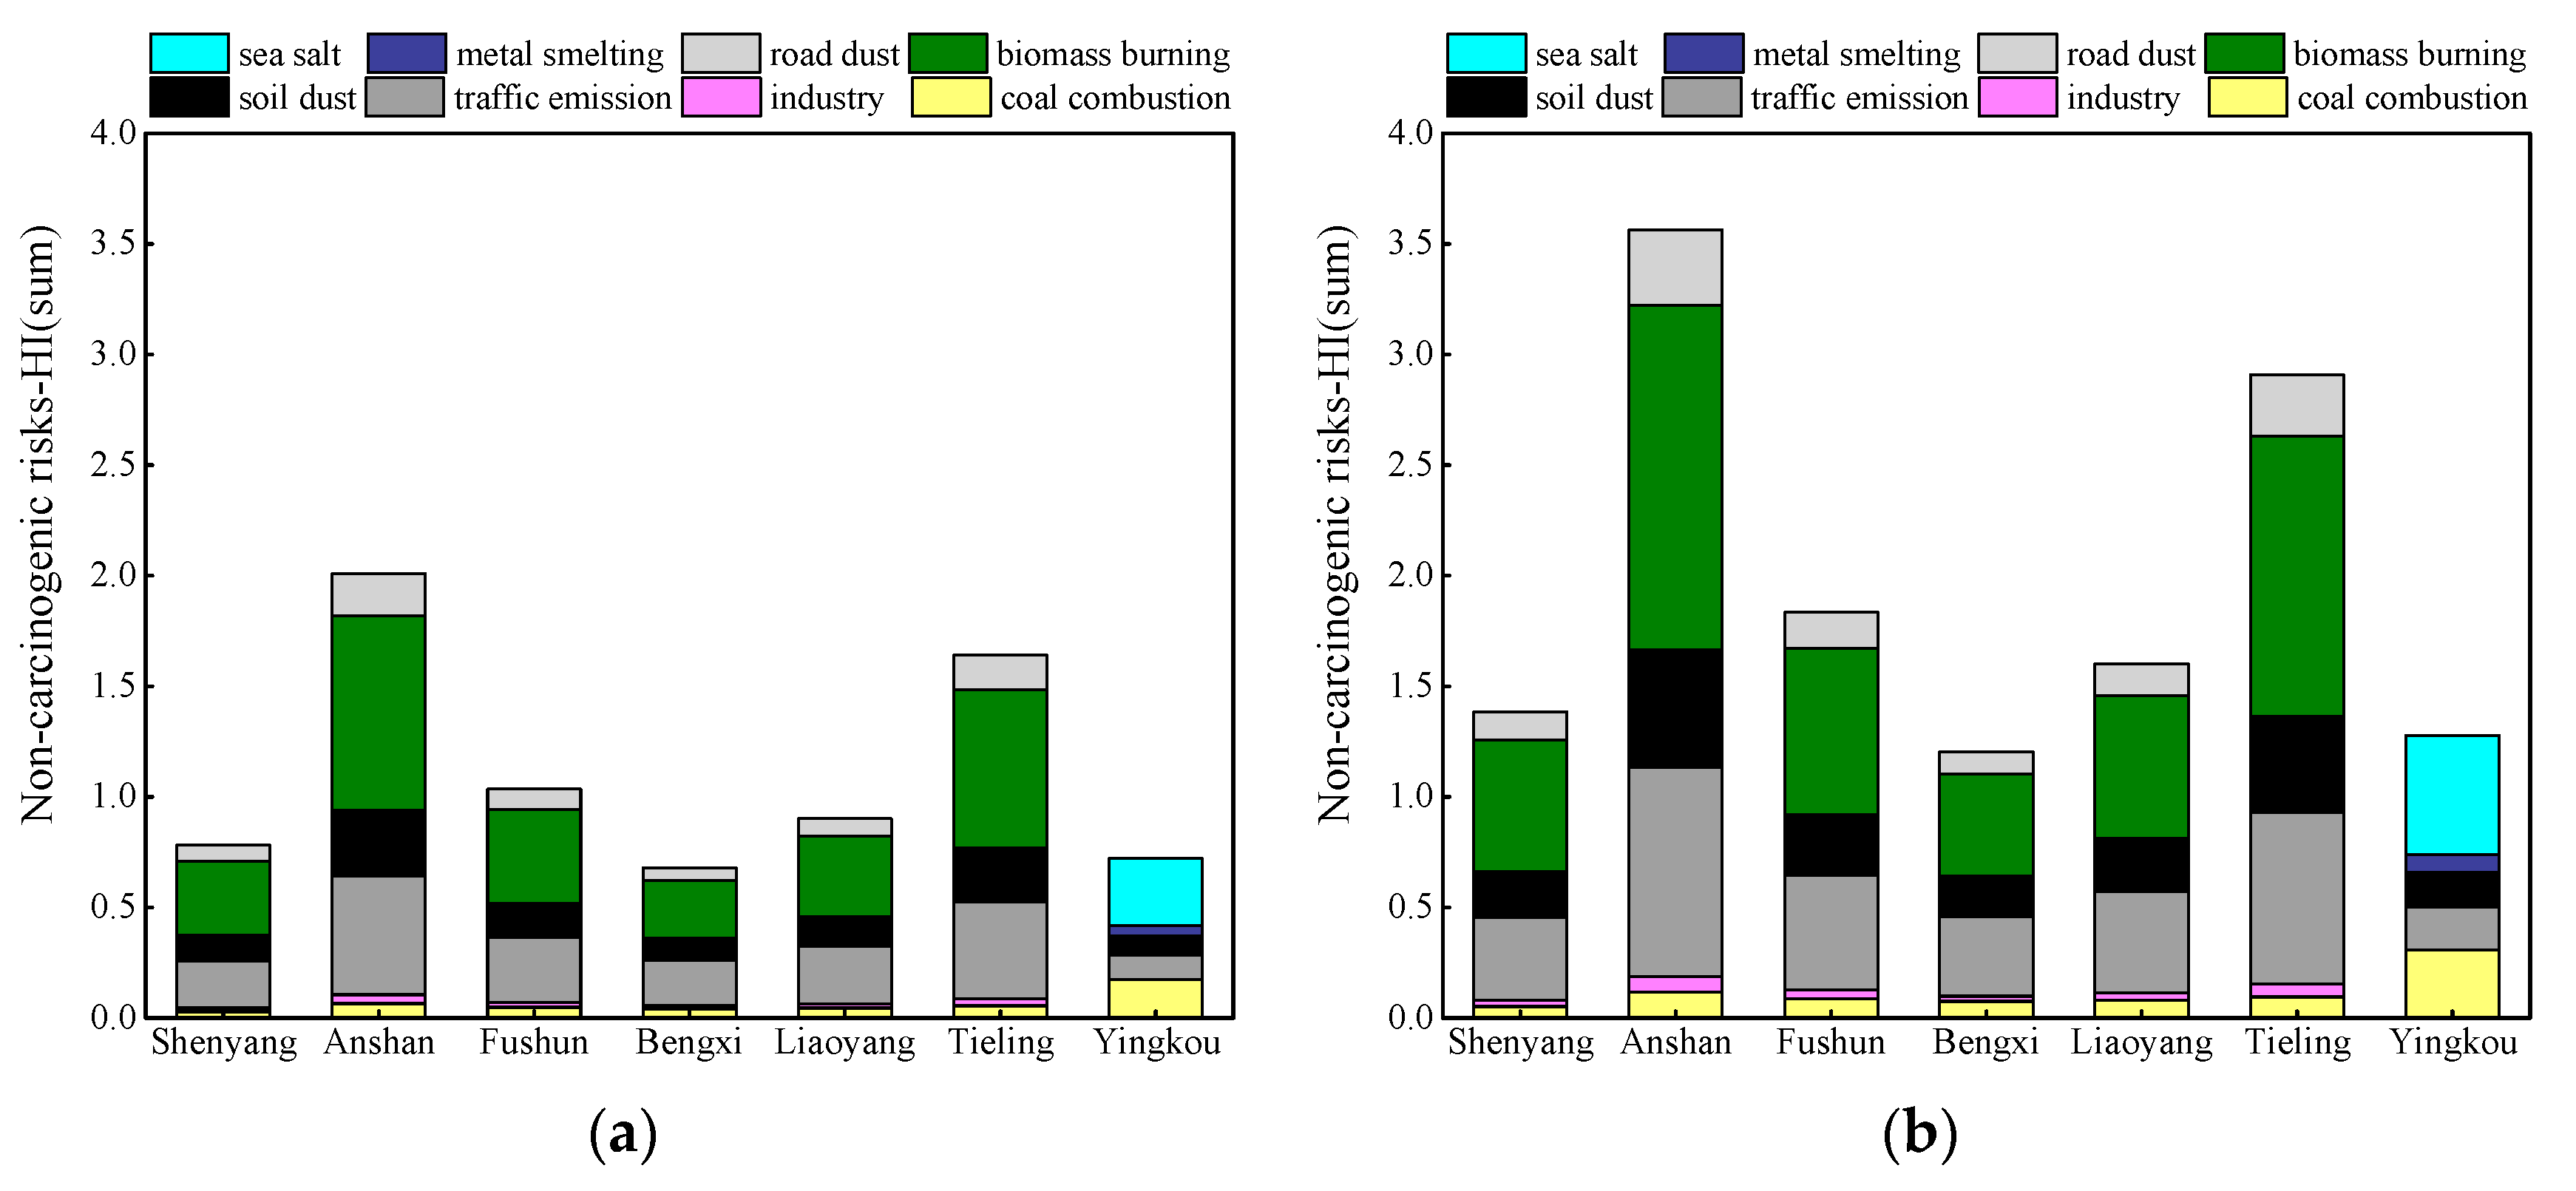
3.4.1. Non-Carcinogenic Risks

The non-carcinogenic risks of nine heavy metal elements via respiratory pathways at the seven sites are shown in Figure 6. Detailed information for each element can be seen in Figure S3. For adults, the HQ values of V, Cr, Ni, As, Cd, and Pb ranged from 1.57 × 10⁻⁴ to 5.34 × 10⁻⁴, 1.03 × 10⁻¹ to 2.38 × 10⁻¹, 3.19 × 10⁻⁵ to 7.45 × 10⁻⁵, 3.38 × 10⁻³ to 5.02 × 10⁻³, 2.19 × 10⁻⁴ to 4.93 × 10⁻⁴, and 2.16 × 10⁻³ to 4.41 × 10⁻³ for the agglomeration, respectively. The HQ of these six elements were lower than the maximum safe level (HQ = 1) for adults at the seven sites. Therefore, their potential non-carcinogenic risk can be ignored. The HQ of Cu and Zn in Anshan is much higher than in other cities; however, the HQ of Cu and Zn were <1 in the urban agglomeration overall, so their non-carcinogenic risks can also be ignored. For Mn, the HQ in Anshan and Tieling were 1.76 and 1.4, respectively, indicating the risk for adults cannot be ignored. Compared with adults, the HQ of the 9 elements were higher for children; however, except for Mn, the HQ of these other elements was less than 1 for children as well. Therefore, only the source of Mn in urban agglomeration is a cause for concern.
The HI values for children were higher than the safe level (HI = 1) at each site, while the HI values for adults were higher than the safe level at Anshan, Fushun, and Tieling. The accumulative non-carcinogenic risks for the human body were mainly caused by Cr and Mn, especially Mn. According to the PMF results of each city, the main sources of Mn are coal burning and biomass combustion, while the main sources of Cr are coal burning and traffic emission.
A detailed health risk assessment of pollutant sources can help to illustrate the importance of controlling the emission sources. In order to further explore the sources of heavy metal elements with severe non-carcinogenic risk, the PMF results were used to study the source allocation of these elements in detail. Figure 7 shows the accumulative risks of these elements. From the figure, the trends observed in children and adults are similar, and the total risk value is the highest in Anshan, followed by Tieling. For adults, the HI values in Anshan, Fushun, and Tieling were 2.01, 1.03, and 1.64, respectively, exceeding the safety level (HI = 1) and requiring attention. In the six cities other than Yingkou, the total risks for children were much higher than the acceptable level, which were mainly contributions of biomass burning and traffic emission. In Yingkou, the non-carcinogenic risks from sea salt and coal sources were high. The total HI values for children were much greater than for adults, implying that children were subject to higher carcinogenic risks in the urban agglomeration.

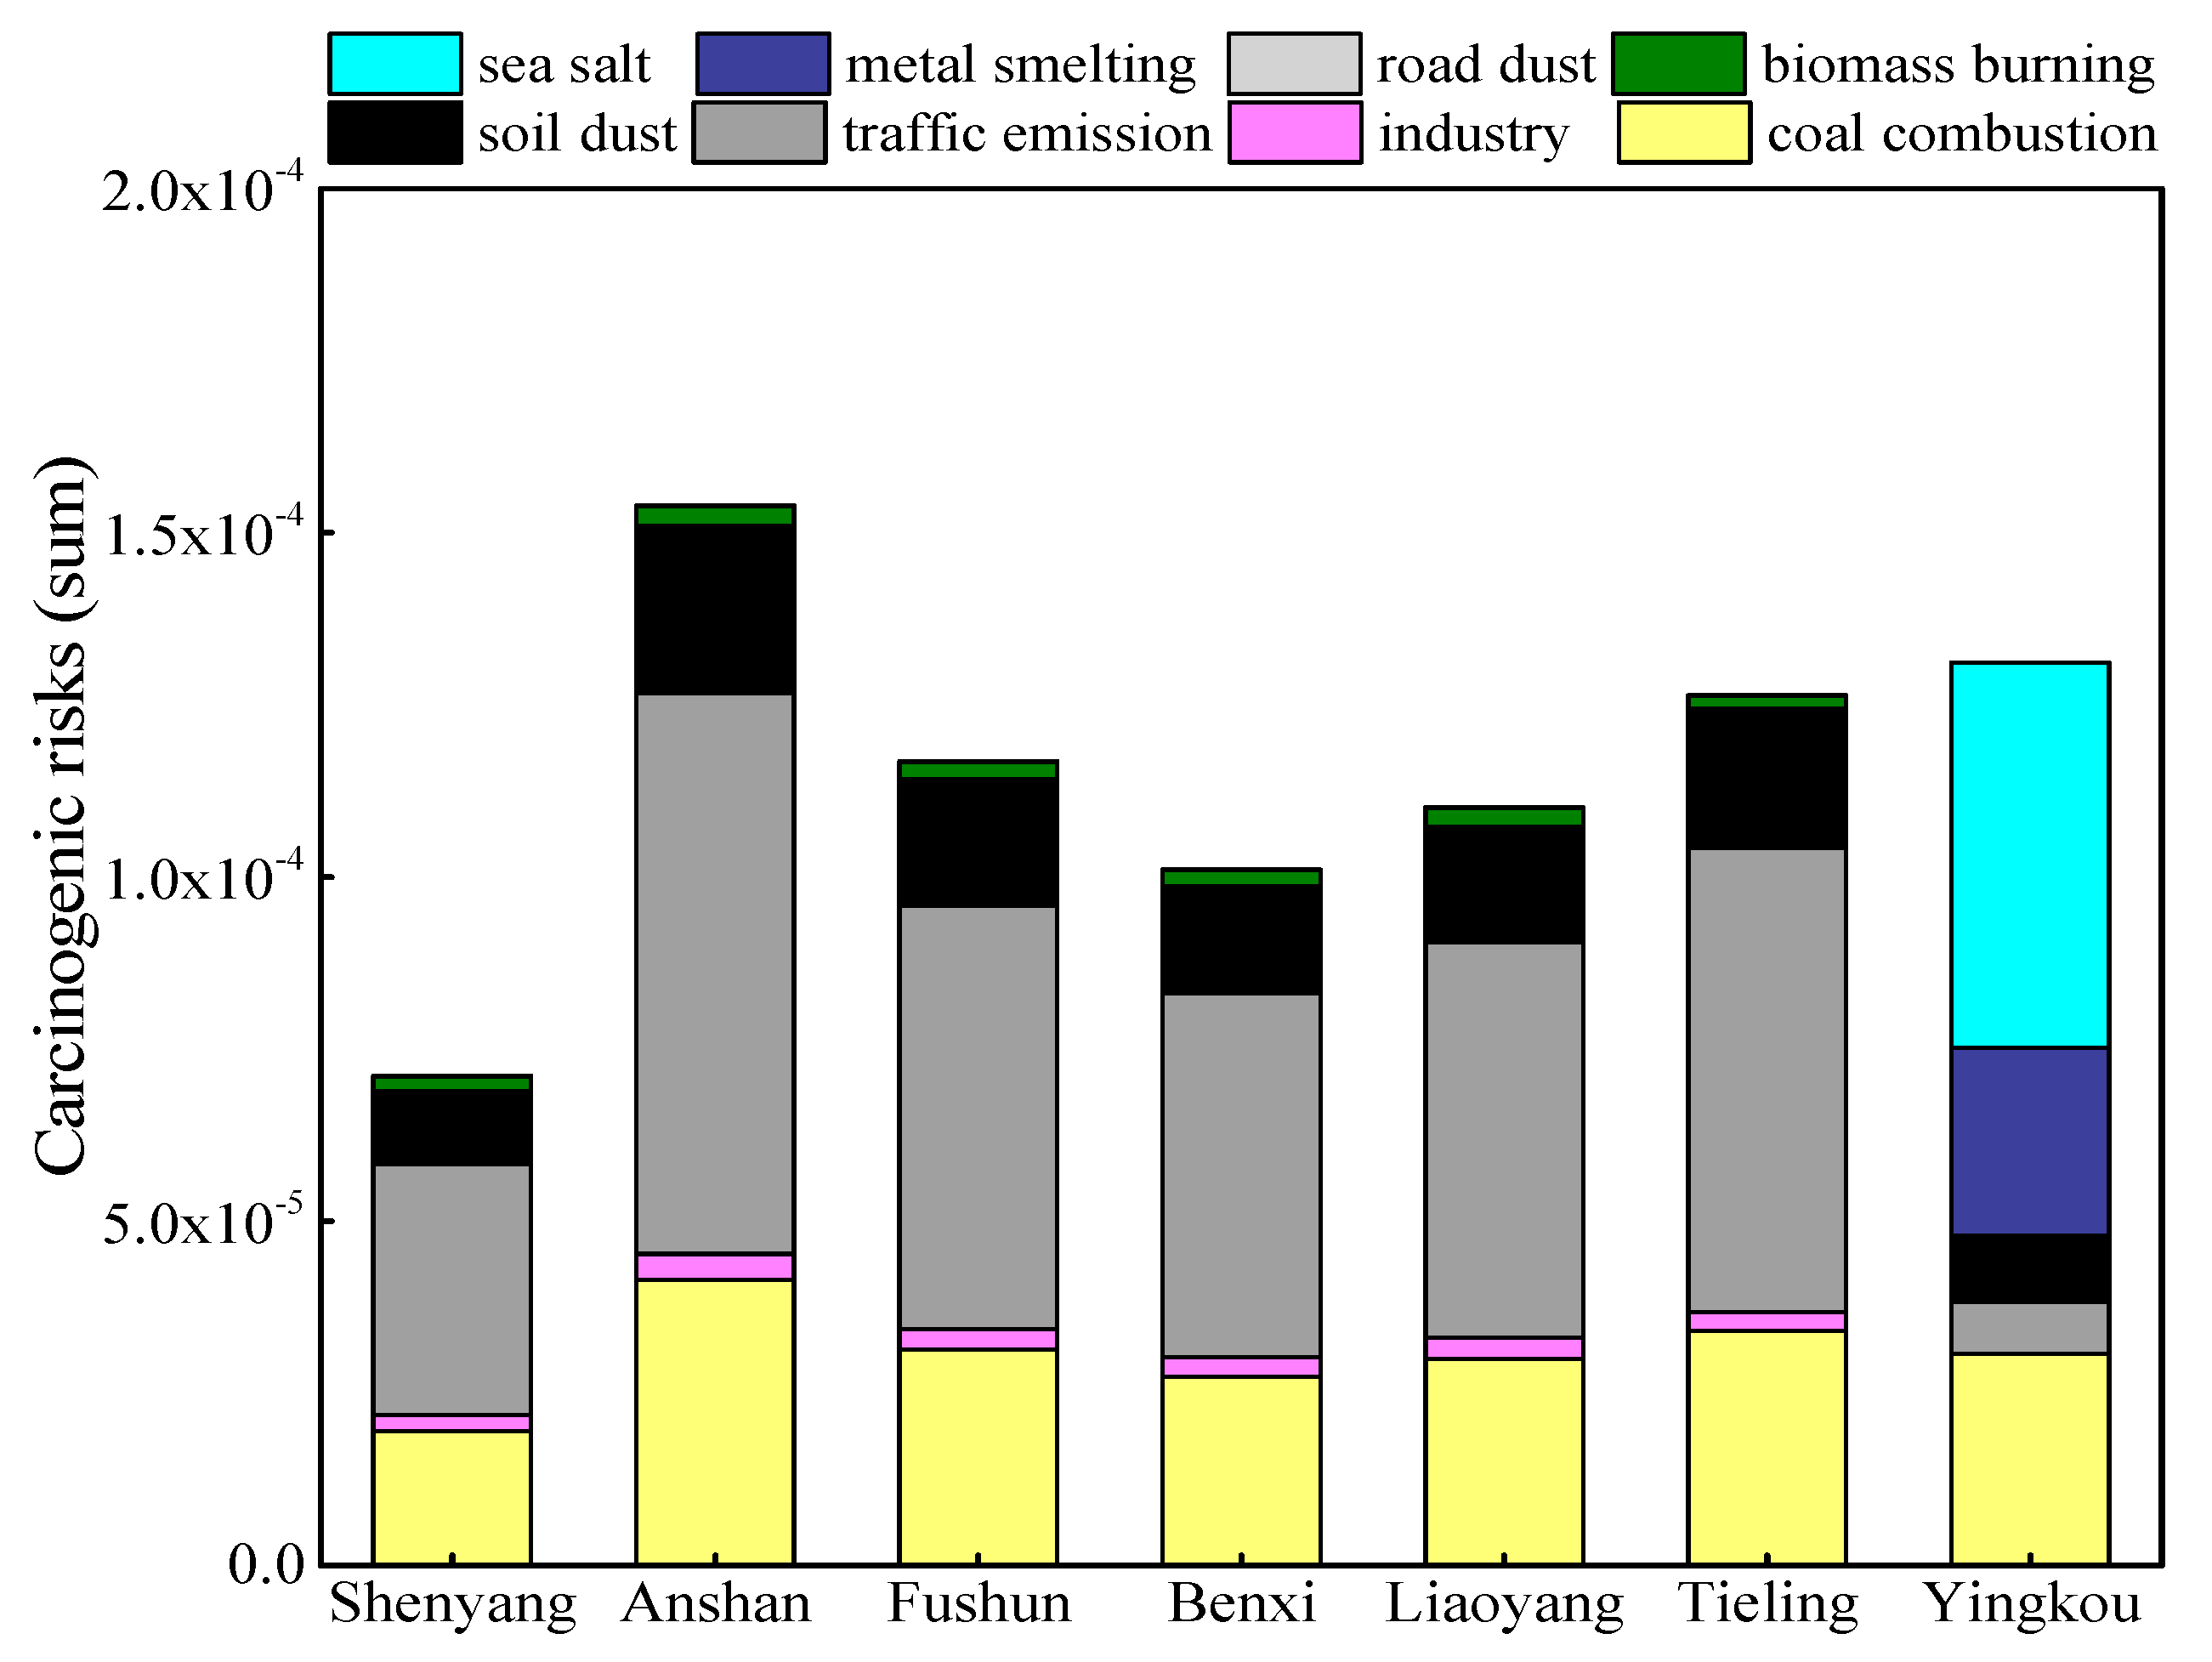
3.4.2. Carcinogenic Risks

As shown in Table 1, the Risk values of Cr and As at the seven sites ranged from 10−6 to 10−4, which requires attention. The Risk posed by Cd in Anshan, Fushun, and Liaoyang also exceeded the acceptable limit, implying that the carcinogenic risk posed by Cd to the human body was not negligible. Cr had the highest carcinogenic risk value in Anshan. According to the PMF results, coal burning contributed up to 22.76% among the six pollution sources. As had the highest carcinogenic risk value in Liaoyang, and the PMF results showed that the contribution of coal burning was up to 21.91%. Therefore, coal burning in Anshan and Liaoyang needs to be addressed. The carcinogenic risk value of Cd was highest in Fushun, and the contribution of biomass combustion according to PMF results was the highest at 17.73%. Biomass combustion in Fushun must also be concerned.
Figure 8 shows the carcinogenic risks of each source in the seven cities. From the figure, Anshan had the highest carcinogenic risk at 1.54 × 10⁻⁴, while Shenyang had the lowest risk at 7.12 × 10⁻⁵. In the six cities other than Yingkou, only road dust had a combined single-factor risk value of less than 10−6, below the level of causing a cancer risk. The carcinogenic risks of the other five pollution sources were between 10−4 and 10−6. Traffic emission and coal combustion both cause a high risk of cancer. In Yingkou, sea salt and coal combustion pose the highest cancer risks. Therefore, the cumulative carcinogenic risks caused by coal sources should be paid close attention to in urban agglomerations.

4. Conclusions

The spatiotemporal characteristics, sources, and health risk assessments of 24 metal elements in PM2.5 in central Liaoning’s urban agglomeration were investigated in this study.
The average PM2.5 concentrations appeared to have significant seasonality. Comparatively higher concentrations of PM2.5 occurred in winter, whereas the lowest concentrations were recorded in summer in all seven cities. The high concentrations of Mg in Anshan and Yingkou were due to the relatively developed magnesite clinker industry in these cities. The concentration of K was highest in Fushun due to abundant biomass combustion. The highest concentrations of Si were seen in Anshan and Tieling, at 1207.18 ng/m3 and 1038.72 ng/m3, respectively. In Anshan, the high concentrations of As and Cr were due to coal combustion. In general, the concentrations of most crustal elements were higher in spring, while the concentrations of man-made elements were higher in winter.
PMF modelling results showed that coal combustion, industry, traffic emission, soil dust, biomass burning, and road dust were the main sources of measured elements in six cities except Yingkou. In Yingkou, the five major sources were identified as coal combustion, metal smelting, traffic emission, soil dust, and sea salt.
The health risk assessment suggested that at Anshan and Tieling for adults, and at five of the cites (except Benxi and Yingkou) for children, the concentrations of Mn were higher than the maximum safe level. Compared to adults, the HQ of the nine heavy metal elements for children were higher. The Risk values of Cr and As at the seven cites were all between 10−6 and 10−4, which requires attention. The Risk of Cd in Anshan, Fushun, and Liaoyang also exceeded the acceptable maximum. In six of the cities other than Yingkou, contributions to non-carcinogenic risks were primarily made by biomass burning and traffic emission. In Yingkou, the non-carcinogenic risks from sea salt and coal sources were high. The cumulative carcinogenic risks caused by coal sources should be paid close attention to in urban agglomerations. This paper addresses the shortage of research into regional air pollution in industrial urban agglomerations and lays a foundation for further research on industrial urban agglomerations.

Supplementary Materials

The following are available online at https://www.mdpi.com/article/10.3390/atmos12060667/s1, Figure S1: The source profiles of trace elements in PM2.5 by PMF analysis at the six cities (including Shenyang, Anshan, Fushun, Bengxi, Liaoyang and Tieling) which demonstrate the concentration and percentage of the species to each factor, Figure S2: The source profiles of trace elements in PM2.5 by PMF analysis at Yingkou which demonstrate the concentration and percentage of the species to each factor, Figure S3: Non-carcinogenic risks of nine metal elements via respiratory pathway at seven cities, the yellow columns represent adult and the brown ones represent child, Table S1: COD values of elements concentration in PM2.5 at different sampling sites in different cities. (a) is three sites in Shenyang, (b) is two sites in Anshan, Table S2: Exposure parameter values used in the risk assessment calculations, Table S3: The reference dose of non-carcinogenic metals and the slope factor of carcinogenic metals.

Author Contributions

Conceptualization, Y.L., C.G. and X.W. (Xinhua Wang); Data curation, X.Z., Y.L., C.G. and X.W. (Xinhua Wang); Formal analysis, Q.G., L.L., X.Z. and C.G.; Funding acquisition, W.Y., C.G. and Z.B.; Investigation, X.Z., B.Y., C.G. and X.W. (Xinhua Wang); Methodology, Q.G. and C.G.; Project administration, W.Y., C.G., X.W. (Xinhua Wang) and Z.B.; Resources, B.Y. and W.Y.; Software, Q.G. and L.L.; Supervision, X.W. (Xiaoli Wang), C.G. and X.W. (Xinhua Wang); Validation, C.G. and X.W. (Xinhua Wang); Visualization, B.Y. and X.W. (Xinhua Wang); Writing—original draft, Q.G., L.L., X.W. (Xiaoli Wang) and C.G.; Writing—review & editing, Q.G., L.L. and C.G. All authors have read and agreed to the published version of the manuscript.

Funding

This research was funded by the National Key Research and Development Program of China (2017YFC0212503, 2017YFC0212501).

Institutional Review Board Statement

Not applicable.

Informed Consent Statement

Not applicable.

Data Availability Statement

The data presented in this study are available on request from the corresponding author.

Acknowledgments

The authors gratefully acknowledge the support of the National Key Research and Development Program of China (2017YFC0212503, 2017YFC0212501).

Conflicts of Interest

The authors declare no conflict of interest.

References

  1. Yang, G.; Wang, Y.; Zeng, Y.; Gao, G.F.; Liang, X.; Zhou, M.; Wan, X.; Yu, S.; Jiang, Y.; Naghavi, M.; et al. Rapid health transition in China, 1990–2010: Findings from the Global Burden of Disease Study 2010. Lancet 2013, 381, 1987–2015. [Google Scholar] [CrossRef]
  2. Lim, S.S.; Vos, T.; Flaxman, A.D.; Danaei, G.; Shibuya, K.; Adair-Rohani, H.; AlMazroa, M.A.; Amann, M.; Anderson, H.R.; Andrews, K.G.; et al. A comparative risk assessment of burden of disease and injury attributable to 67 risk factors and risk factor clusters in 21 regions, 1990–2010: A systematic analysis for the Global Burden of Disease Study 2010. Lancet 2012, 380, 2224–2260. [Google Scholar] [CrossRef] [Green Version]
  3. Duan, X.; Yan, Y.; Li, R.; Deng, M.; Hu, D.; Peng, L. Seasonal variations, source apportionment, and health risk assessment of trace metals in PM2.5 in the typical industrial city of changzhi, China. Atmos. Pollut. Res. 2021, 12, 365–374. [Google Scholar]
  4. Wang, X.; He, S.; Chen, S.; Zhang, Y.; Wang, A.; Luo, J.; Ye, X.; Mo, Z.; Wu, L.; Xu, P.; et al. Spatiotemporal characteristics and health risk assessment of heavy metals in PM2.5 in Zhejiang province. Int. J. Environ. Res. Pub. Heal. 2018, 15, 583. [Google Scholar] [CrossRef] [Green Version]
  5. Bellinger, D.C. Teratogen Update: Lead and Pregnancy. Birth Defects Res. A 2005, 73, 409–420. [Google Scholar] [CrossRef]
  6. Bell, M.L.; Belanger, K.; Ebisu, K.; Gent, J.F.; Lee, H.J.; Koutrakis, P.; Leaderer, B.P. Prenatal exposure to fine particulate matter and birth weight: Variations by particulate constituents and sources. Epidemiology 2010, 21, 884–891. [Google Scholar] [CrossRef] [PubMed] [Green Version]
  7. Soukup, D.; Buck, B.; Goossens, D.; Ulery, A.; McLaurin, B.T.; Baron, D.; Teng, Y. Arsenic concentrations in dust emissions from wind erosion and off-road vehicles in the Nellis Dunes Recreational Area, Nevada, USA. Aeolian Res. 2012, 5, 77–89. [Google Scholar] [CrossRef]
  8. Bullock, K.R.; Duvall, R.M.; Norris, G.A.; McDow, S.R.; Hays, M.D. Evaluation of the CMB and PMF models using organic molecular markers in fine particulate matter collected during the Pittsburgh Air Quality Study. Atmos. Environ. 2008, 42, 6897–6904. [Google Scholar] [CrossRef]
  9. Shi, G.; Zeng, F.; Li, X.; Feng, Y.; Wang, Y.; Liu, G.; Zhu, T. Estimated contributions and uncertainties of PCA/MLR–CMB results: Source apportionment for synthetic and ambient datasets. Atmos. Environ. 2011, 45, 2811–2819. [Google Scholar] [CrossRef]
  10. Hopke, P.K. Review of receptor modeling methods for source apportionment. J. Air Waste Manag. 2016, 66, 237–259. [Google Scholar] [CrossRef] [PubMed]
  11. Paatero, P. Least squares formulation of robust non-negative factor analysis. Chemometr. Intell. Lab. 1997, 37, 23–35. [Google Scholar] [CrossRef]
  12. Wang, F.; Guo, Z.; Lin, T.; Rose, N.L. Seasonal variation of carbonaceous pollutants in PM2.5 at an urban ‘supersite’ in Shanghai, China. Chemosphere 2016, 146, 238–244. [Google Scholar] [PubMed]
  13. Zhao, S.; Tian, H.; Luo, L.; Liu, H.; Wu, B.; Liu, S.; Bai, X.; Liu, W.; Liu, X.; Wu, Y.; et al. Temporal variation characteristics and source apportionment of metal elements in PM2.5 in urban Beijing during 2018–2019. Environ. Pollut. 2021, 268, 115856. [Google Scholar] [CrossRef] [PubMed]
  14. Yao, L.; Yang, L.; Yuan, Q.; Yan, C.; Dong, C.; Meng, C.; Sui, X.; Yang, F.; Lu, Y.; Wang, W. Sources apportionment of PM2.5 in a background site in the North China Plain. Sci. Total Environ. 2016, 541, 590–598. [Google Scholar] [CrossRef] [PubMed]
  15. Gao, Y.; Ji, H. Microscopic morphology and seasonal variation of health effect arising from heavy metals in PM2.5 and PM10: One-year measurement in a densely populated area of urban Beijing. Atmos. Res. 2018, 212, 213–226. [Google Scholar] [CrossRef]
  16. Mateos, A.C.; Amarillo, A.C.; Carreras, H.A.; Gonzalez, C.M. Land use and air quality in urban environments: Human health risk assessment due to inhalation of airborne particles. Environ. Res. 2018, 161, 370–380. [Google Scholar] [CrossRef]
  17. Peng, X.; Shi, G.; Liu, G.; Xu, J.; Tian, Y.; Zhang, Y.; Feng, Y.; Russell, A.G. Source apportionment and heavy metal health risk (HMHR) quantification from sources in a southern city in China, using an ME2-HMHR model. Environ. Pollut. 2017, 221, 335–342. [Google Scholar] [CrossRef]
  18. Shi, Y.; Bilal, M.; Ho, H.C.; Omar, A. Urbanization and regional air pollution across South Asian developing countries—A nationwide land use regression for ambient PM2.5 assessment in Pakistan. Environ. Pollut. 2020, 266, 115145. [Google Scholar] [CrossRef] [PubMed]
  19. Tao, J.; Zhang, L.; Cao, J.; Zhong, L.; Chen, D.; Yang, Y.; Chen, D.; Chen, L.; Zhang, Z.; Wu, Y.; et al. Source apportionment of PM2.5 at urban and suburban areas of the Pearl River Delta region, South China—With emphasis on ship emissions. Sci. Total Environ. 2017, 574, 1559–1570. [Google Scholar] [CrossRef]
  20. Xie, J.; Jin, L.; Cui, J.; Luo, X.; Li, J.; Zhang, G.; Li, X. Health risk-oriented source apportionment of PM2.5-associated trace metals. Environ. Pollut. 2020, 262, 114655. [Google Scholar] [CrossRef] [PubMed]
  21. Song, W.; Jia, H.; Huang, J.; Zhang, Y. A satellite-based geographically weighted regression model for regional PM2.5 estimation over the Pearl River Delta Region in China. Remote Sens. Environ. 2014, 154, 1–7. [Google Scholar] [CrossRef]
  22. Jiang, L.; He, S.; Zhou, H. Spatio-temporal characteristics and convergence trends of PM2.5 pollution: A case study of cities of air pollution transmission channel in Beijing-Tianjin-Hebei region, China. J. Clean Prod. 2020, 256, 120631. [Google Scholar] [CrossRef]
  23. Wang, X.; Shen, Z.; Liu, F.; Lu, D.; Tao, J.; Lei, Y.; Zhang, Q.; Zeng, Y.; Xu, H.; Wu, Y.; et al. Saccharides in summer and winter PM2.5 over Xi’an, Northwestern China: Sources, and yearly variations of biomass burning contribution to PM2.5. Atmos. Res. 2018, 214, 410–417. [Google Scholar] [CrossRef]
  24. Batterman, S.; Xu, L.; Chen, F.; Chen, F.; Zhong, X. Characteristics of PM2.5 concentrations across Beijing during 2013–2015. Atmos. Environ. 2016, 145, 104–114. [Google Scholar] [CrossRef] [PubMed] [Green Version]
  25. Zhang, F.; Wang, Z.; Cheng, H.; Lv, X.; Gong, W.; Wang, X.; Zhang, G. Seasonal variations and chemical characteristics of PM2.5 in Wuhan, central China. Sci. Total Environ. 2015, 518-519, 97–105. [Google Scholar] [CrossRef]
  26. Kong, S.; Ding, X.; Bai, Z.; Han, B.; Chen, L.; Shi, J.; Li, Z. A seasonal study of polycyclic aromatic hydrocarbons in PM2.5 and PM2.5-10 in five typical cities of Liaoning Province, China. J. Hazard. Mater. 2010, 183, 70–80. [Google Scholar] [CrossRef]
  27. Bell, M.L.; Ebisu, K.; Peng, R.D. Community-level spatial heterogeneity of chemical constituent levels of fine particulates and implications for epidemiological research. J. Expo. Sci. Environ. Epid. 2010, 21, 372–384. [Google Scholar] [CrossRef] [PubMed] [Green Version]
  28. Wang, N.; Zhao, X.; Wang, J.; Yin, B.; Geng, C.; Niu, D.; Yang, W.; Yu, H.; Li, W. Chemical composition of PM2.5 and its impact on inhalation health risk evaluation in a city with light industry in central China. Atmosphere 2020, 11, 340. [Google Scholar] [CrossRef] [Green Version]
  29. Kong, S.; Han, B.; Bai, Z.; Chen, L.; Shi, J.; Xu, Z. Receptor modeling of PM2.5, PM10 and TSP in different seasons and long-range transport analysis at a coastal site of Tianjin, China. Sci. Total Environ. 2010, 408, 4681–4694. [Google Scholar] [CrossRef]
  30. Li, H.; Wang, Q.g.; Yang, M.; Li, F.; Wang, J.; Sun, Y.; Wang, C.; Wu, H.; Qian, X. Chemical characterization and source apportionment of PM2.5 aerosols in a megacity of Southeast China. Atmos. Res. 2016, 181, 288–299. [Google Scholar] [CrossRef]
  31. Manual RAGF. Process for Conducting Probabilistic Risk Assessment; EPA: Washington, DC, USA, 1989. [Google Scholar]
  32. Zhang, J.; Zhou, X.; Wang, Z.; Yang, L.; Wang, J.; Wang, W. Trace elements in PM2.5 in Shandong Province: Source identification and health risk assessment. Sci. Total Environ. 2018, 621, 558–577. [Google Scholar] [CrossRef]
  33. US EPA (U.S. Environmental Protection Agency). Risk Assessment Guidance for Superfund Volume I: Human Health Evaluation Manual (Part A). 1989; EPA/540/R/1-89/002. Available online: http://www.epa.gov/swerrims/riskassessment/ragsa/index.htm (accessed on 20 October 2020).
  34. US EPA (U.S. Environmental Protection Agency). Risk Assessment Guidance for Superfund Volume I: Human Health Evaluation Manual (Part F). 2009; EPA-540-R-070-002. Available online: http://www.epa.gov/swerrims/riskassessment/ragsa/index.htm (accessed on 20 October 2020).
  35. Agarwal, A.; Mangal, A.; Satsangi, A.; Lakhani, A.; Kumari, K.M. Characterization, sources and health risk analysis of PM2.5 bound metals during foggy and non-foggy days in sub-urban atmosphere of Agra. Atmos. Res. 2017, 197, 121–131. [Google Scholar] [CrossRef]
  36. Feng, J.; Yu, H.; Su, X.; Liu, S.; Li, Y.; Pan, Y.; Sun, J.-H. Chemical composition and source apportionment of PM2.5 during Chinese Spring Festival at Xinxiang, a heavily polluted city in North China: Fireworks and health risks. Atmos. Res. 2016, 182, 176–188. [Google Scholar] [CrossRef]
  37. Jain, S.; Sharma, S.K.; Vijayan, N.; Mandal, T.K. Seasonal characteristics of aerosols (PM2.5 and PM10) and their source apportionment using PMF: A four year study over Delhi, India. Environ. Pollut. 2020, 262, 114337. [Google Scholar] [CrossRef]
  38. Chang, Y.; Huang, K.; Xie, M.; Deng, C.; Zou, Z.; Liu, S.; Zhang, Y. First long-term and near real-time measurement of trace elements in China’s urban atmosphere: Temporal variability, source apportionment and precipitation effect. Atmos. Chem. Phys. 2018, 18, 11793–11812. [Google Scholar] [CrossRef] [Green Version]
  39. Hao, Y.; Meng, X.; Yu, X.; Lei, M.; Li, W.; Shi, F.; Yang, W.; Zhang, S.; Xie, S. Characteristics of trace elements in PM2.5 and PM10 of Chifeng, Northeast China: Insights into spatiotemporal variations and sources. Atmos. Res. 2018, 213, 550–561. [Google Scholar] [CrossRef]
  40. Han, Y.; Kim, H.; Cho, S.; Kim, P.; Kim, W. Metallic elements in PM2.5 in different functional areas of Korea: Concentrations and source identification. Atmos. Res. 2015, 153, 416–428. [Google Scholar] [CrossRef]
  41. Li, X.; Ma, Y.; Wang, Y.; Liu, N.; Hong, Y. Temporal and spatial analyses of particulate matter (PM10 and PM2.5) and its relationship with meteorological parameters over an urban city in Northeast China. Atmos. Res. 2017, 198, 185–193. [Google Scholar] [CrossRef]
  42. Anshan Bureau Statistics. Analysis on the Development Status of Magnesite Clinker Industry in Anshan. 2020. Available online: http://tjj.anshan.gov.cn/html/TJJ/202012/0160707312168743.html (accessed on 20 January 2021).
  43. Yingkou Bureau Statistics Statistical Bulletins 2018 of Yingkou. 2019. Available online: http://tjj.yingkou.gov.cn/008/008002/20190515/528478a0-e80f-49f1-b293-89befc75271e.html (accessed on 20 October 2020).
  44. Zhang, R.; Jing, J.; Tao, J.; Hsu, S.C.; Wang, G.; Cao, J.; Lee, C.S.L.; Zhu, L.; Chen, Z.; Zhao, Y. Chemical characterization and source apportionment of PM2.5 in Beijing: Seasonal perspective. Atmos. Chem. Phys. 2013, 13, 9953–10007. [Google Scholar] [CrossRef] [Green Version]
  45. Mokhtar, M.M.; Taib, R.M.; Hassim, M.H. Understanding selected trace elements behavior in a coal-fired power plant in Malaysia for assessment of abatement technologies. J. Air Waste Manag. 2014, 64, 867–878. [Google Scholar] [CrossRef]
  46. Hsu, C.Y.; Chiang, H.C.; Lin, S.L.; Chen, M.J.; Lin, T.Y.; Chen, Y.C. Elemental characterization and source apportionment of PM10 and PM2.5 in the western coastal area of central Taiwan. Sci. Total. Environ. 2016, 541, 1139–1150. [Google Scholar] [CrossRef] [PubMed]
  47. Zhou, S.; Yuan, Q.; Li, W.; Lu, Y.; Zhang, Y.; Wang, W. Trace metals in atmospheric fine particles in one industrial urban city: Spatial variations, sources, and health implications. J. Environ. Sci. 2014, 26, 205–213. [Google Scholar] [CrossRef]
  48. Liu, J.; Chen, Y.; Chao, S.; Cao, H.; Zhang, A.; Yang, Y. Emission control priority of PM2.5-bound heavy metals in different seasons: A comprehensive analysis from health risk perspective. Sci. Total Environ. 2018, 644, 20–30. [Google Scholar] [CrossRef]
  49. Xu, C.; Guan, Q.; Lin, J.; Luo, H.; Yang, L.; Tan, Z.; Wang, Q.; Wang, N.; Tian, J. Spatiotemporal variations and driving factors of dust storm events in Northern China based on high-temporal-resolution analysis of meteorological data (1960–2007). Environ. Pollut. 2020, 260, 114084. [Google Scholar] [CrossRef] [PubMed]
  50. Sofowote, U.M.; Di Federico, L.M.; Healy, R.M.; Debosz, J.; Su, Y.; Wang, J.; Munoz, A. Heavy metals in the near-road environment: Results of semi-continuous monitoring of ambient particulate matter in the greater Toronto and Hamilton area. Atmos. Environ. 2019, 1, 100005. [Google Scholar] [CrossRef]
  51. Thorpe, A.; Harrison, R.M. Sources and properties of non-exhaust particulate matter from road traffic: A review. Sci. Total Environ. 2008, 400, 270–282. [Google Scholar] [CrossRef] [PubMed]
  52. Li, F.; Yan, J.; Wei, Y.; Zeng, J.; Wang, X.; Chen, X.; Zhang, C.; Li, W.; Chen, M.; Lü, G. PM2.5-bound heavy metals from the major cities in China: Spatiotemporal distribution, fuzzy exposure assessment and health risk management. J. Clean Prod. 2021, 286, 124967. [Google Scholar] [CrossRef]
Figure 1. Location of sampling sites (n = 10) in the seven cities of the urban agglomeration.
Atmosphere 12 00667 g001
Figure 2. (a) The seasonal mean concentrations of PM2.5 measured at the seven cities. (b) The seasonal mean concentrations of the sum of elements in PM2.5 measured at the seven cities. Shown in each subfigure are the mean (dot symbol), the median (horizontal line), the central 50% data (25th–75th percentiles; box), and the central 90% data (5th–95th percentiles; whiskers).
Atmosphere 12 00667 g002
Figure 3. (a) Annual average concentrations of 24 elements in PM2.5 at seven cities, (b) The average annual concentration of each element as a percentage of the total element concentration in PM2.5 at seven cities.
Atmosphere 12 00667 g003
Figure 4. The mean concentrations of total 24 PM2.5 elemental components in different seasons at seven cities, the y-coordinate is the logarithmic coordinate.
Atmosphere 12 00667 g004
Figure 5. Contribution percentage of the identified sources to PM2.5 at seven cities; while the first six cities share the same source, Yingkou is different from them.
Atmosphere 12 00667 g005
Figure 6. The non-carcinogenic risks (sum HI) of total nine metal elements to adults and children at seven cities. The y-coordinate is the logarithmic coordinate.
Atmosphere 12 00667 g006
Figure 7. Non-carcinogenic risks (sum HI) to adults and children from the PMF-identified sources of PM2.5 in seven cities ((a) non-carcinogenic risks to adults and (b) non-carcinogenic risks to children). While the first six cities share the same sources, Yingkou is different from them.
Atmosphere 12 00667 g007
Figure 8. Carcinogenic risks from the PMF-identified sources to PM2.5 in seven cities. While the first six cities share the same source, Yingkou is different from them.
Atmosphere 12 00667 g008
Table 1. Carcinogenic risks of metal elements at seven cities.
SpeciesShenyangAnshanFunshunBengxiYingkouLiaoyangTieling
Cr6.09 × 10−51.41 × 10−41.06 × 10−49.00 × 10−51.19 × 10−49.74 × 10−51.18 × 10−4
Ni3.87 × 10−76.26 × 10−76.38 × 10−75.81 × 10−75.81 × 10−74.33 × 10−72.73 × 10−7
As9.01 × 10−61.09 × 10−58.19 × 10−69.83 × 10−61.06 × 10−51.13 × 10−57.57 × 10−6
Cd8.54 × 10−71.28 × 10−61.54 × 10−66.83 × 10−79.40 × 10−71.11 × 10−66.83 × 10−7
Publisher’s Note: MDPI stays neutral with regard to jurisdictional claims in published maps and institutional affiliations.

