1. Introduction
An increase in PM
2.5 has a very serious impact on human health and may induce lung cancer, leukemia, breast cancer, and other malignant tumors [
1,
2,
3,
4]. To protect public health, many monitoring stations have been built to detect real-time PM
2.5 concentrations. These data provide a basis for predicting PM
2.5 values. The research on the classification of PM
2.5 data is the basis for studying the principle of PM
2.5 physical diffusion. At present, most researchers directly use the original PM
2.5 data to carry out the numerical prediction research of PM
2.5 through the black-box model. However, because black-box models only reflect the general causal relationship between related factors, they cannot express the specific physical process. As a result, the prediction results of these studies are not accurate enough. Therefore, to improve the prediction accuracy, it is necessary to conduct research on PM
2.5 data feature extraction and feature classification. After conducting these studies, the PM
2.5 prediction process will have a good ability to reflect the physical laws, so as to achieve the purpose of improving the prediction accuracy. Thus, to accurately predict PM
2.5, a study of the PM
2.5 transmission process classification is very important [
5].
There are many references regarding the physical diffusion mechanism of PM
2.5. The primary methodologies have included physical models, machine learning models, and hybrid models [
6,
7,
8,
9]. Physical models have been used to simulate the air transmission and the evolution of the chemical and physical changes by inputting prediction factors related to PM
2.5 [
10,
11,
12,
13]. For instance, a hidden Markov model (HMM) was conducted to predict the average 24-h PM
2.5 concentration in northern California [
14]. However, physical models are sensitive to initial and boundary conditions for simulating PM
2.5 transmissions, causing limitations in the PM
2.5 predictions [
15,
16,
17]. As a result, machine learning models have been adopted to overcome these limitations, and extreme values were predicted inaccurately due to a lack of knowledge regarding the physical mechanisms. To accurately predict the extreme values, hybrid models that used multiple models to simulate the physical transmission were proposed [
18,
19,
20,
21]. For instance, a hybrid model for predicting PM
2.5 concentration was designed using a principal component analysis (PCA), which was used for feature extraction in data preprocessing, and the least-squares support-vector machine (LSSVM) that improved the cuckoo search (CS) method [
22] was also used. To a certain extent, the prediction accuracy was improved using the hybrid models, but they are still in the phase of multiple statistical model combinations and unable to exactly reflect the physical mechanism of PM
2.5 transmission [
23,
24,
25,
26]. In addition to the selected black-box models for research, some researchers also only consider the concentration data of PM
2.5 itself or the concentration data of other atmospheric pollutants as factors affecting PM
2.5 [
27,
28,
29]. They have not studied the physical principles of PM
2.5 transmission. This will cause the accuracy of the research results to be low due to ignoring the transmission principle of PM
2.5 [
30,
31]. Therefore, some researchers have conducted research on the feature extraction of PM
2.5. For instance, a positive definite matrix was established to analyze the main components and forming factors of PM
2.5 in Switzerland [
32]. These studies of PM
2.5 prediction through feature extraction have improved the accuracy of PM
2.5 prediction to a certain extent. However, these methods only carry out simple research on the feature extraction of PM
2.5, and also cannot accurately reflect the physical mechanism of PM
2.5 transmission. Thus, the temporal feature classification of PM
2.5 transmission has become the key to connecting the physical mechanism and statistical theory during the process of considering the physical mechanisms and statistics.
PM
2.5 data are typically time-series data, so it is feasible to predict future development using the past trend of PM
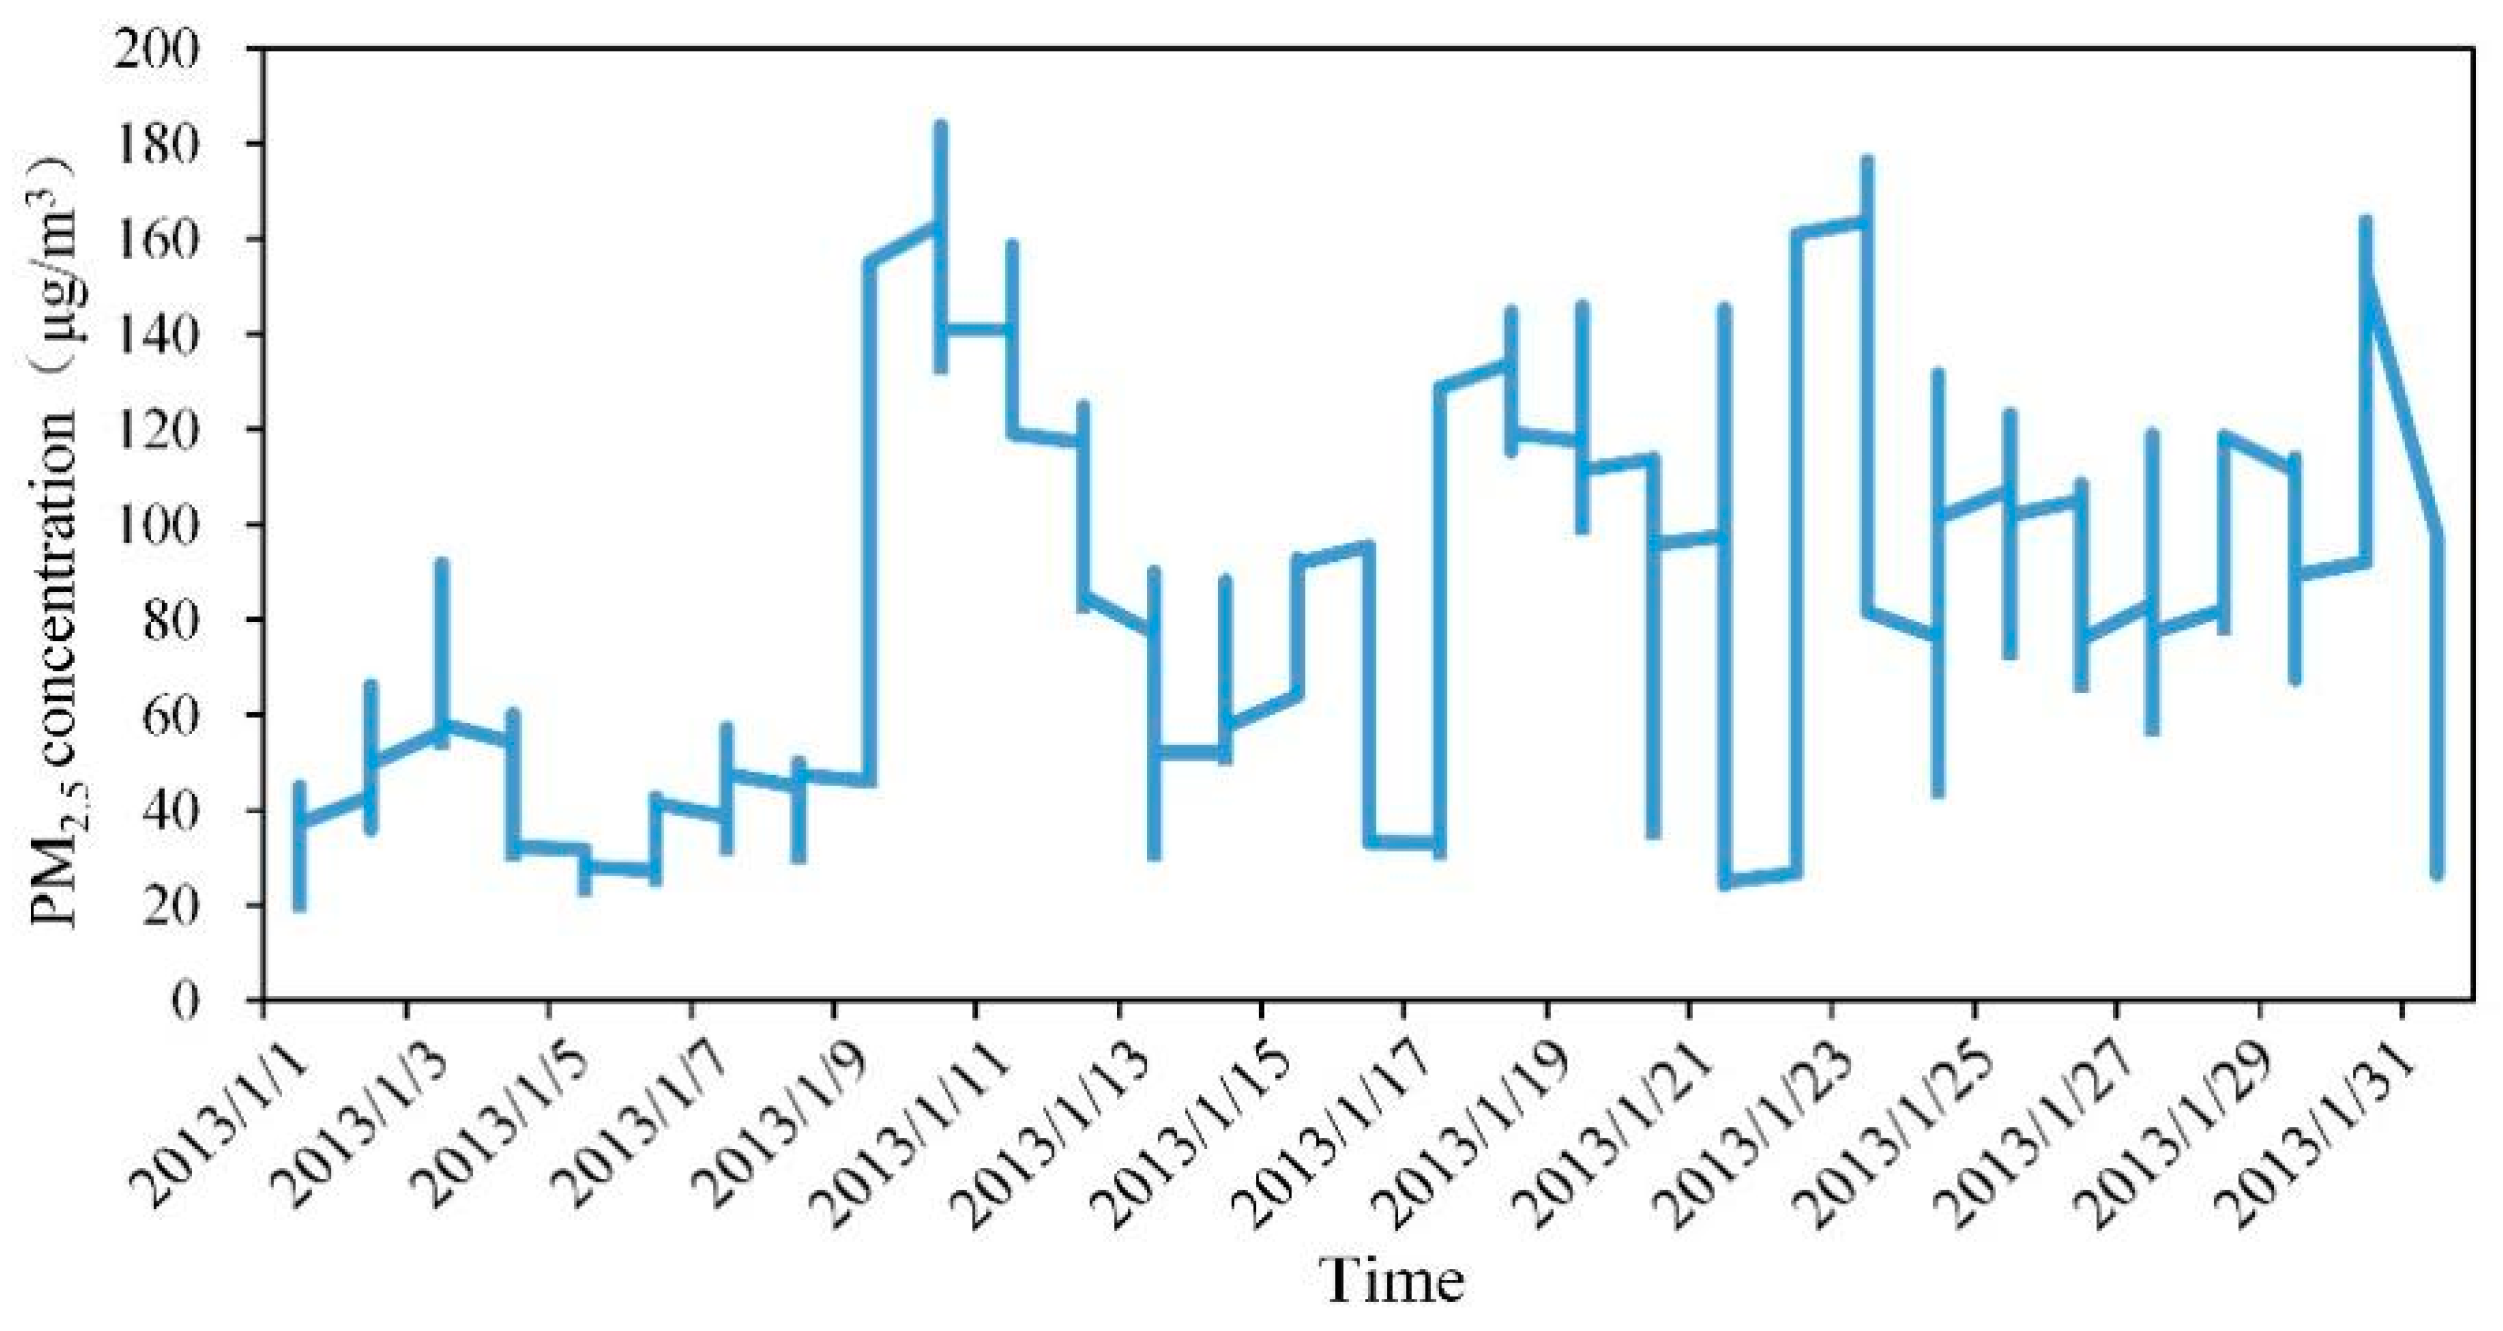
2.5 data. The candlestick chart was originally used to represent changes in stock prices over time [
33,
34,
35,
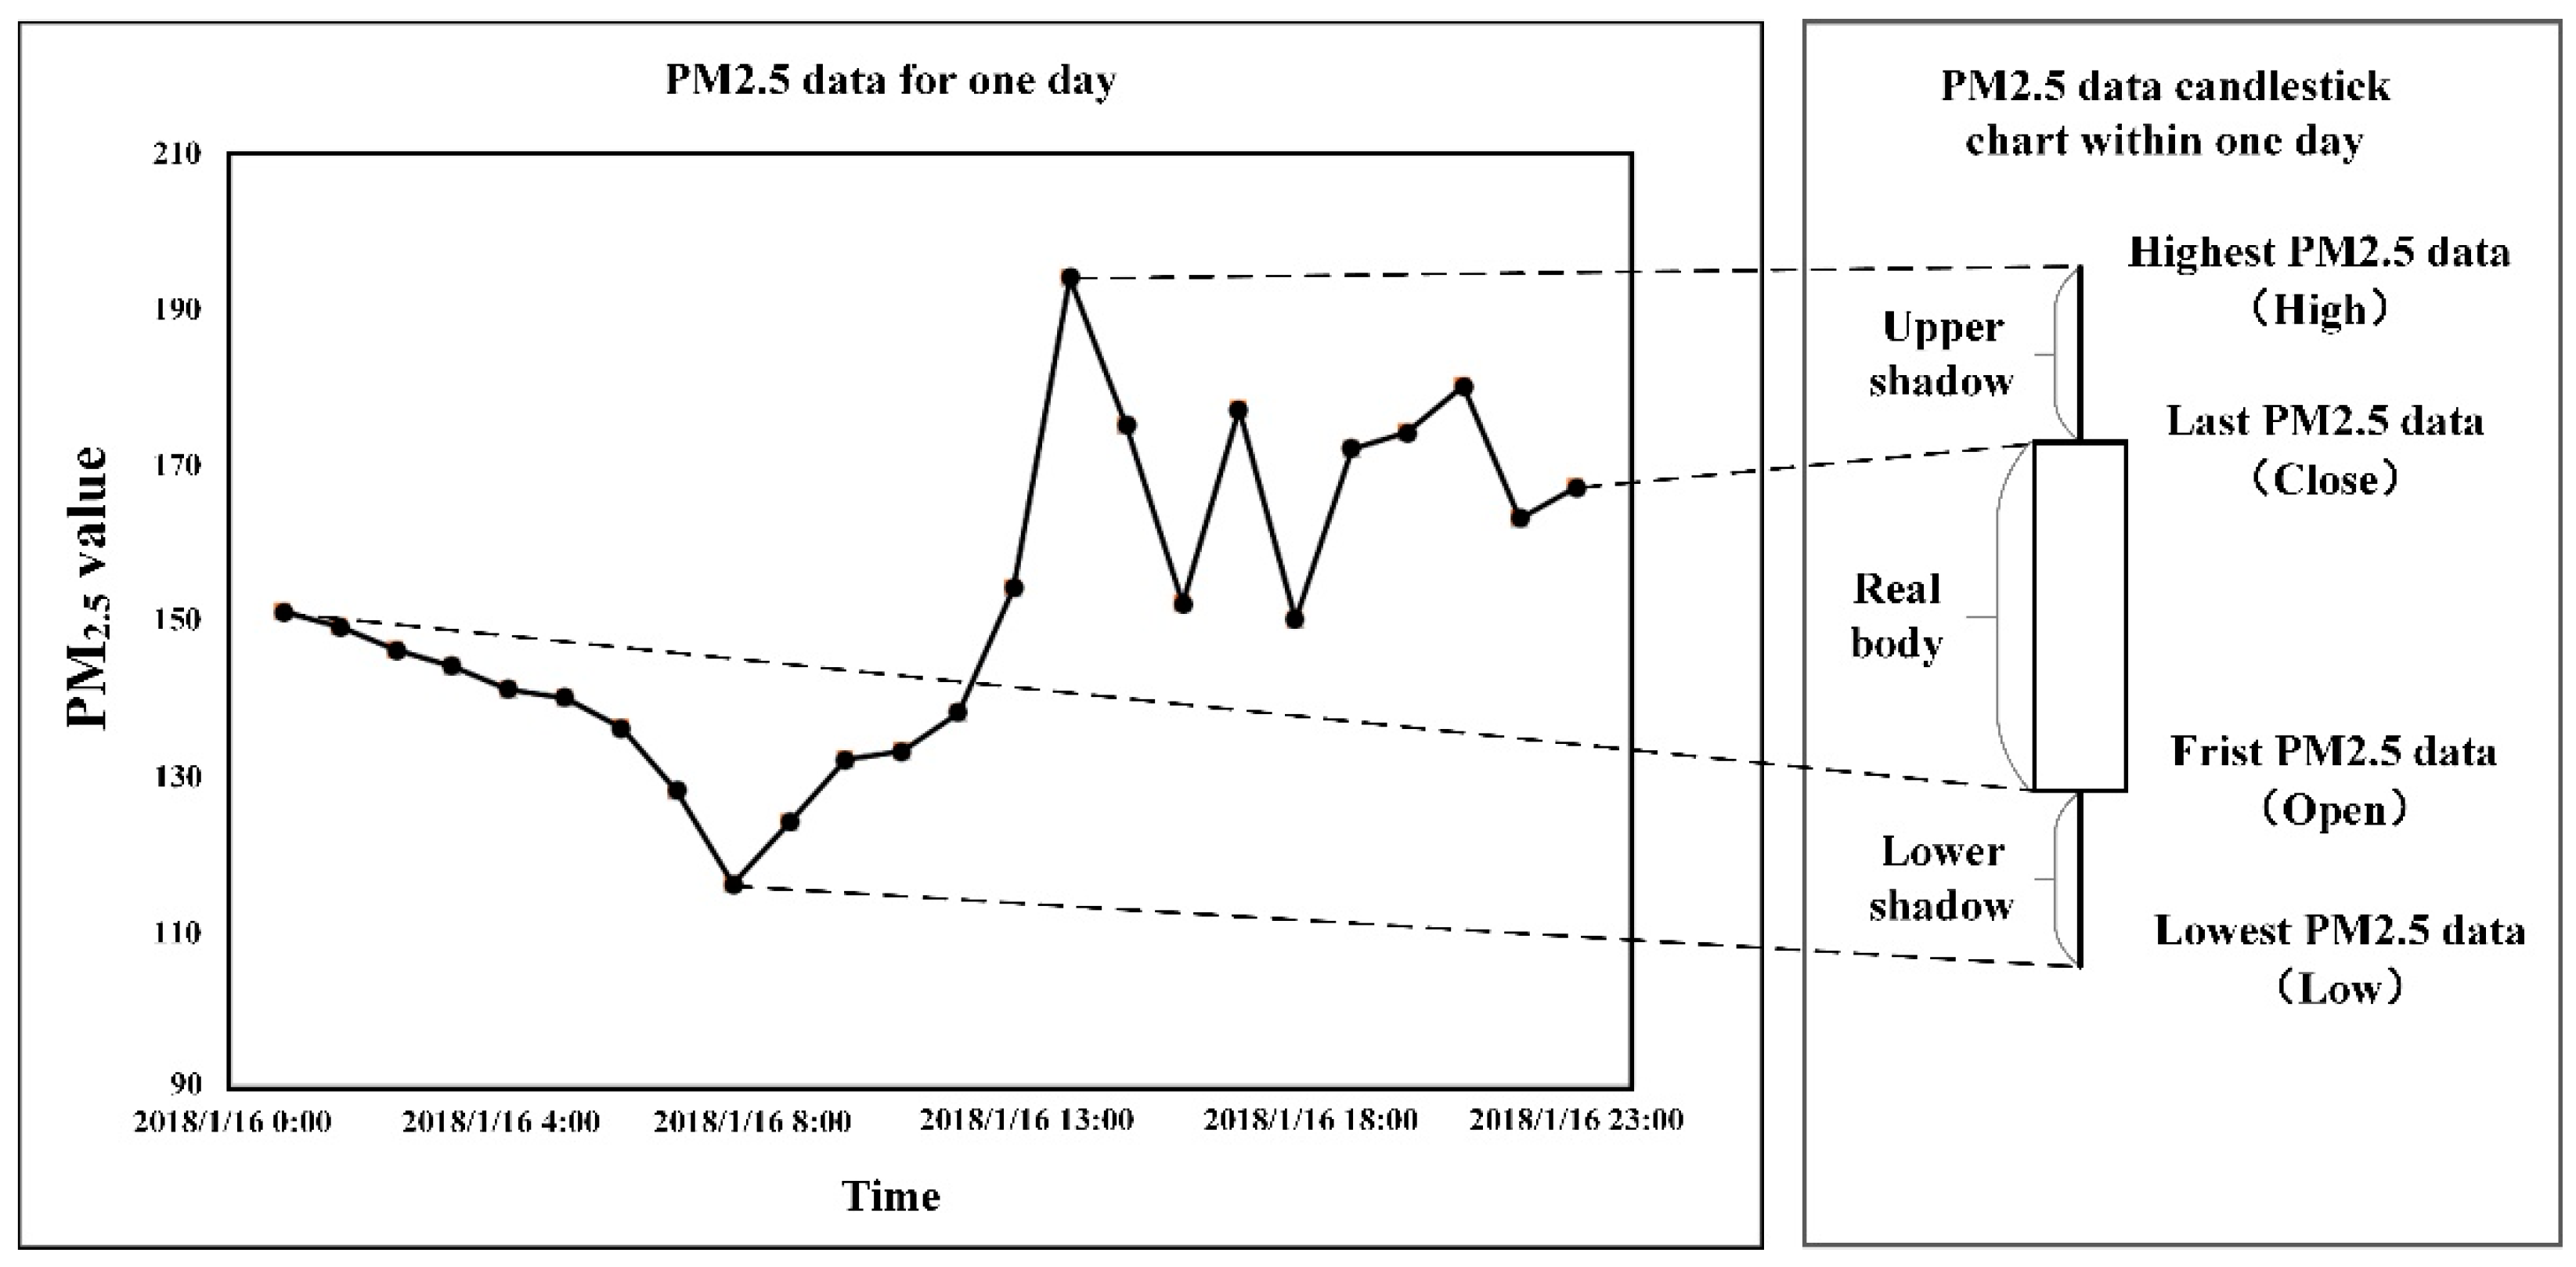
36]. It is a graph composed of stock data for multiple consecutive periods that can accurately reflect the four eigenvalues and the change process of stocks during a period [
37,
38,
39]. Many scholars have used the candlestick chart to extract temporal features for trend predictions [
40,
41,
42]. For example, the adaptive neuro-fuzzy inference system (ANFIS) is used to predict the stock market, which was constructed using the candlestick chart and imperial competitive algorithm (ICA) technology [
43]. A method based on the candlestick chart to predict the change in adolescent stress levels was proposed that used the trend in the candlestick chart to reflect the trend in adolescent stress [
44]. A novel fuzzy recommendation system for stock market investors was presented, and it adopted fuzzy Japanese candlesticks and included the effect of currency devaluation in the forecast [
45]. However, these applications did not study specific physical principles. Thus, for studying the direction of air pollution, the candlestick chart explained using the Gaussian diffusion model has physical meaning.
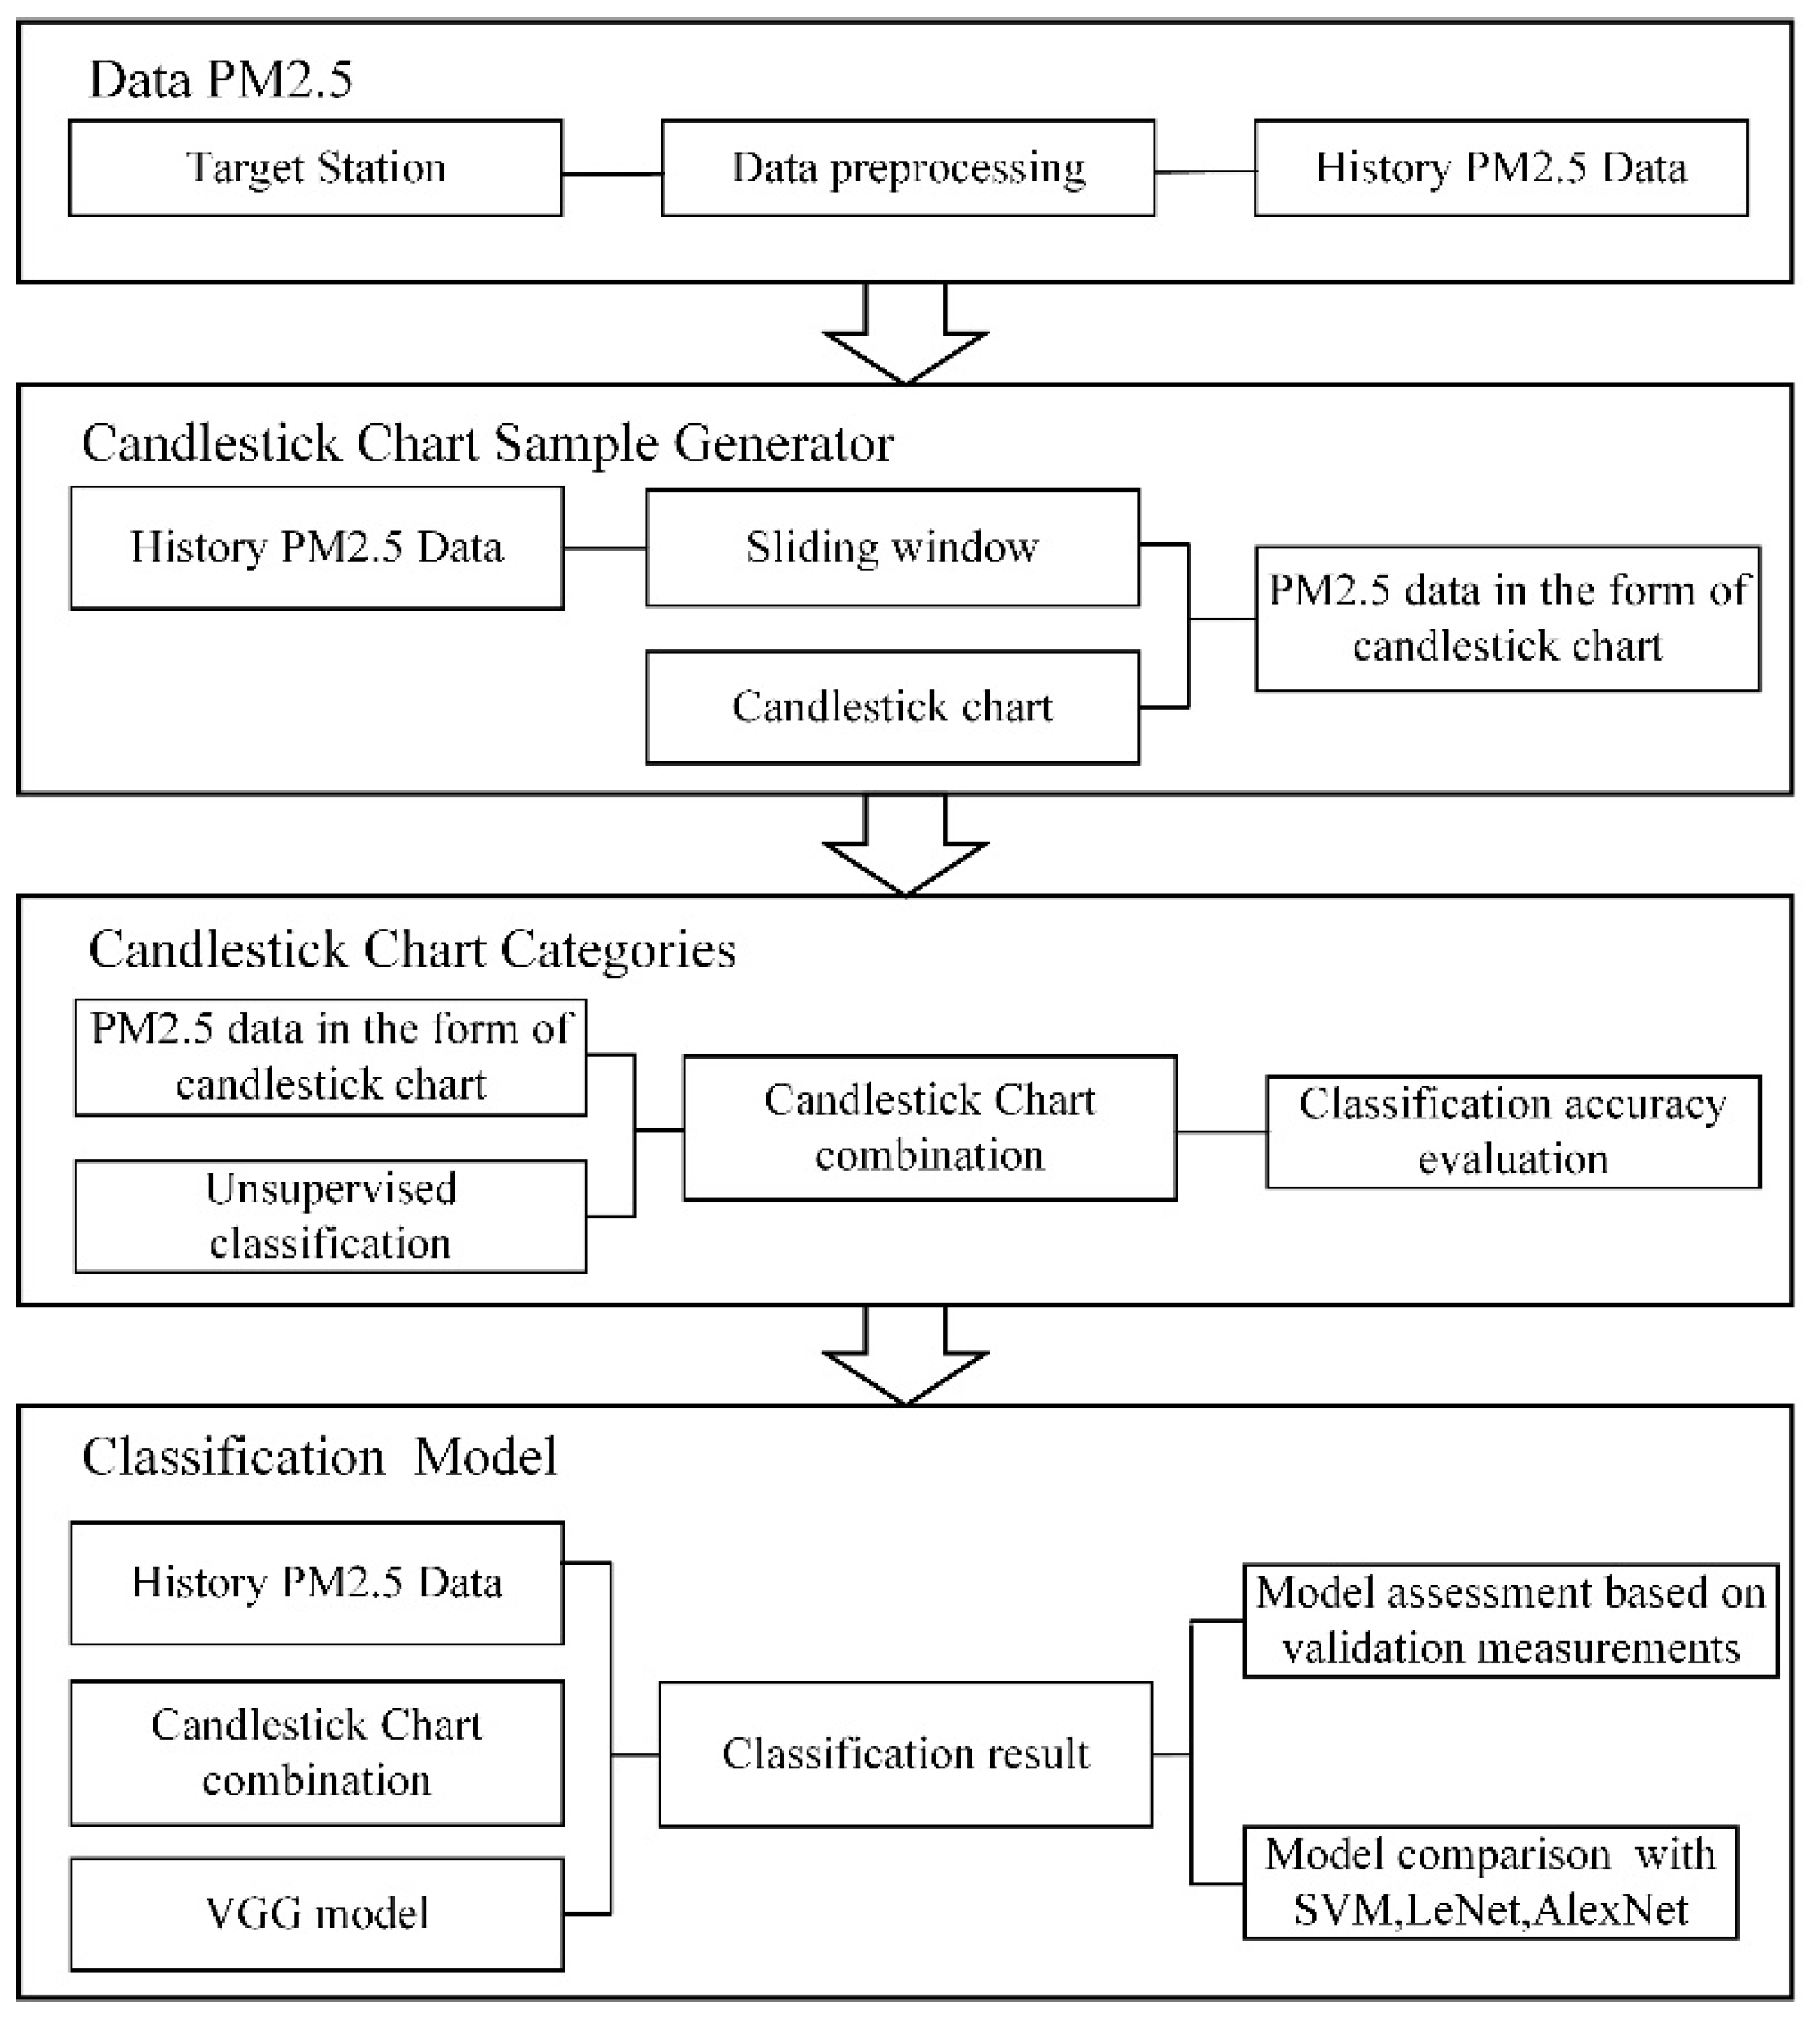
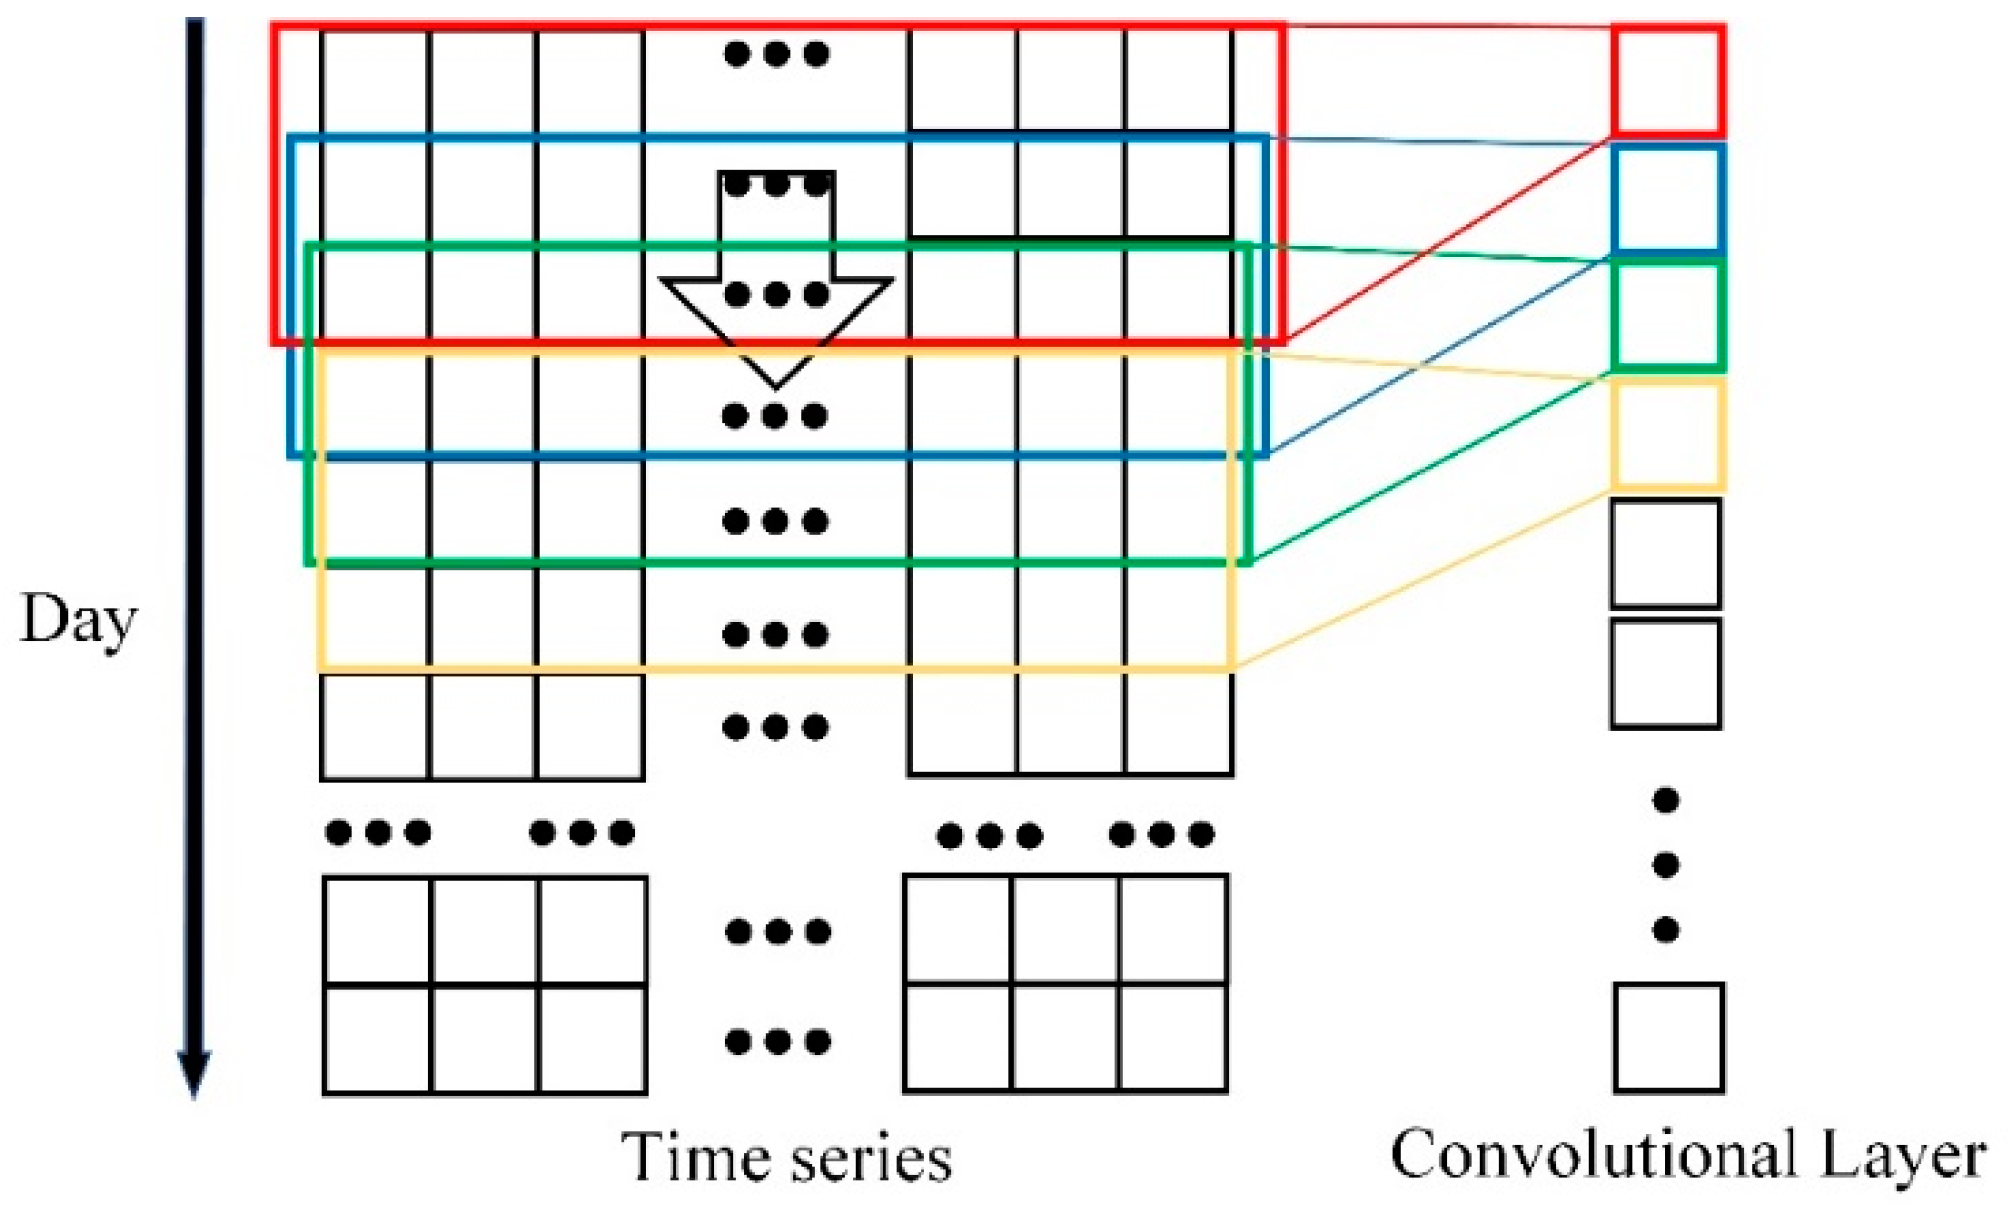
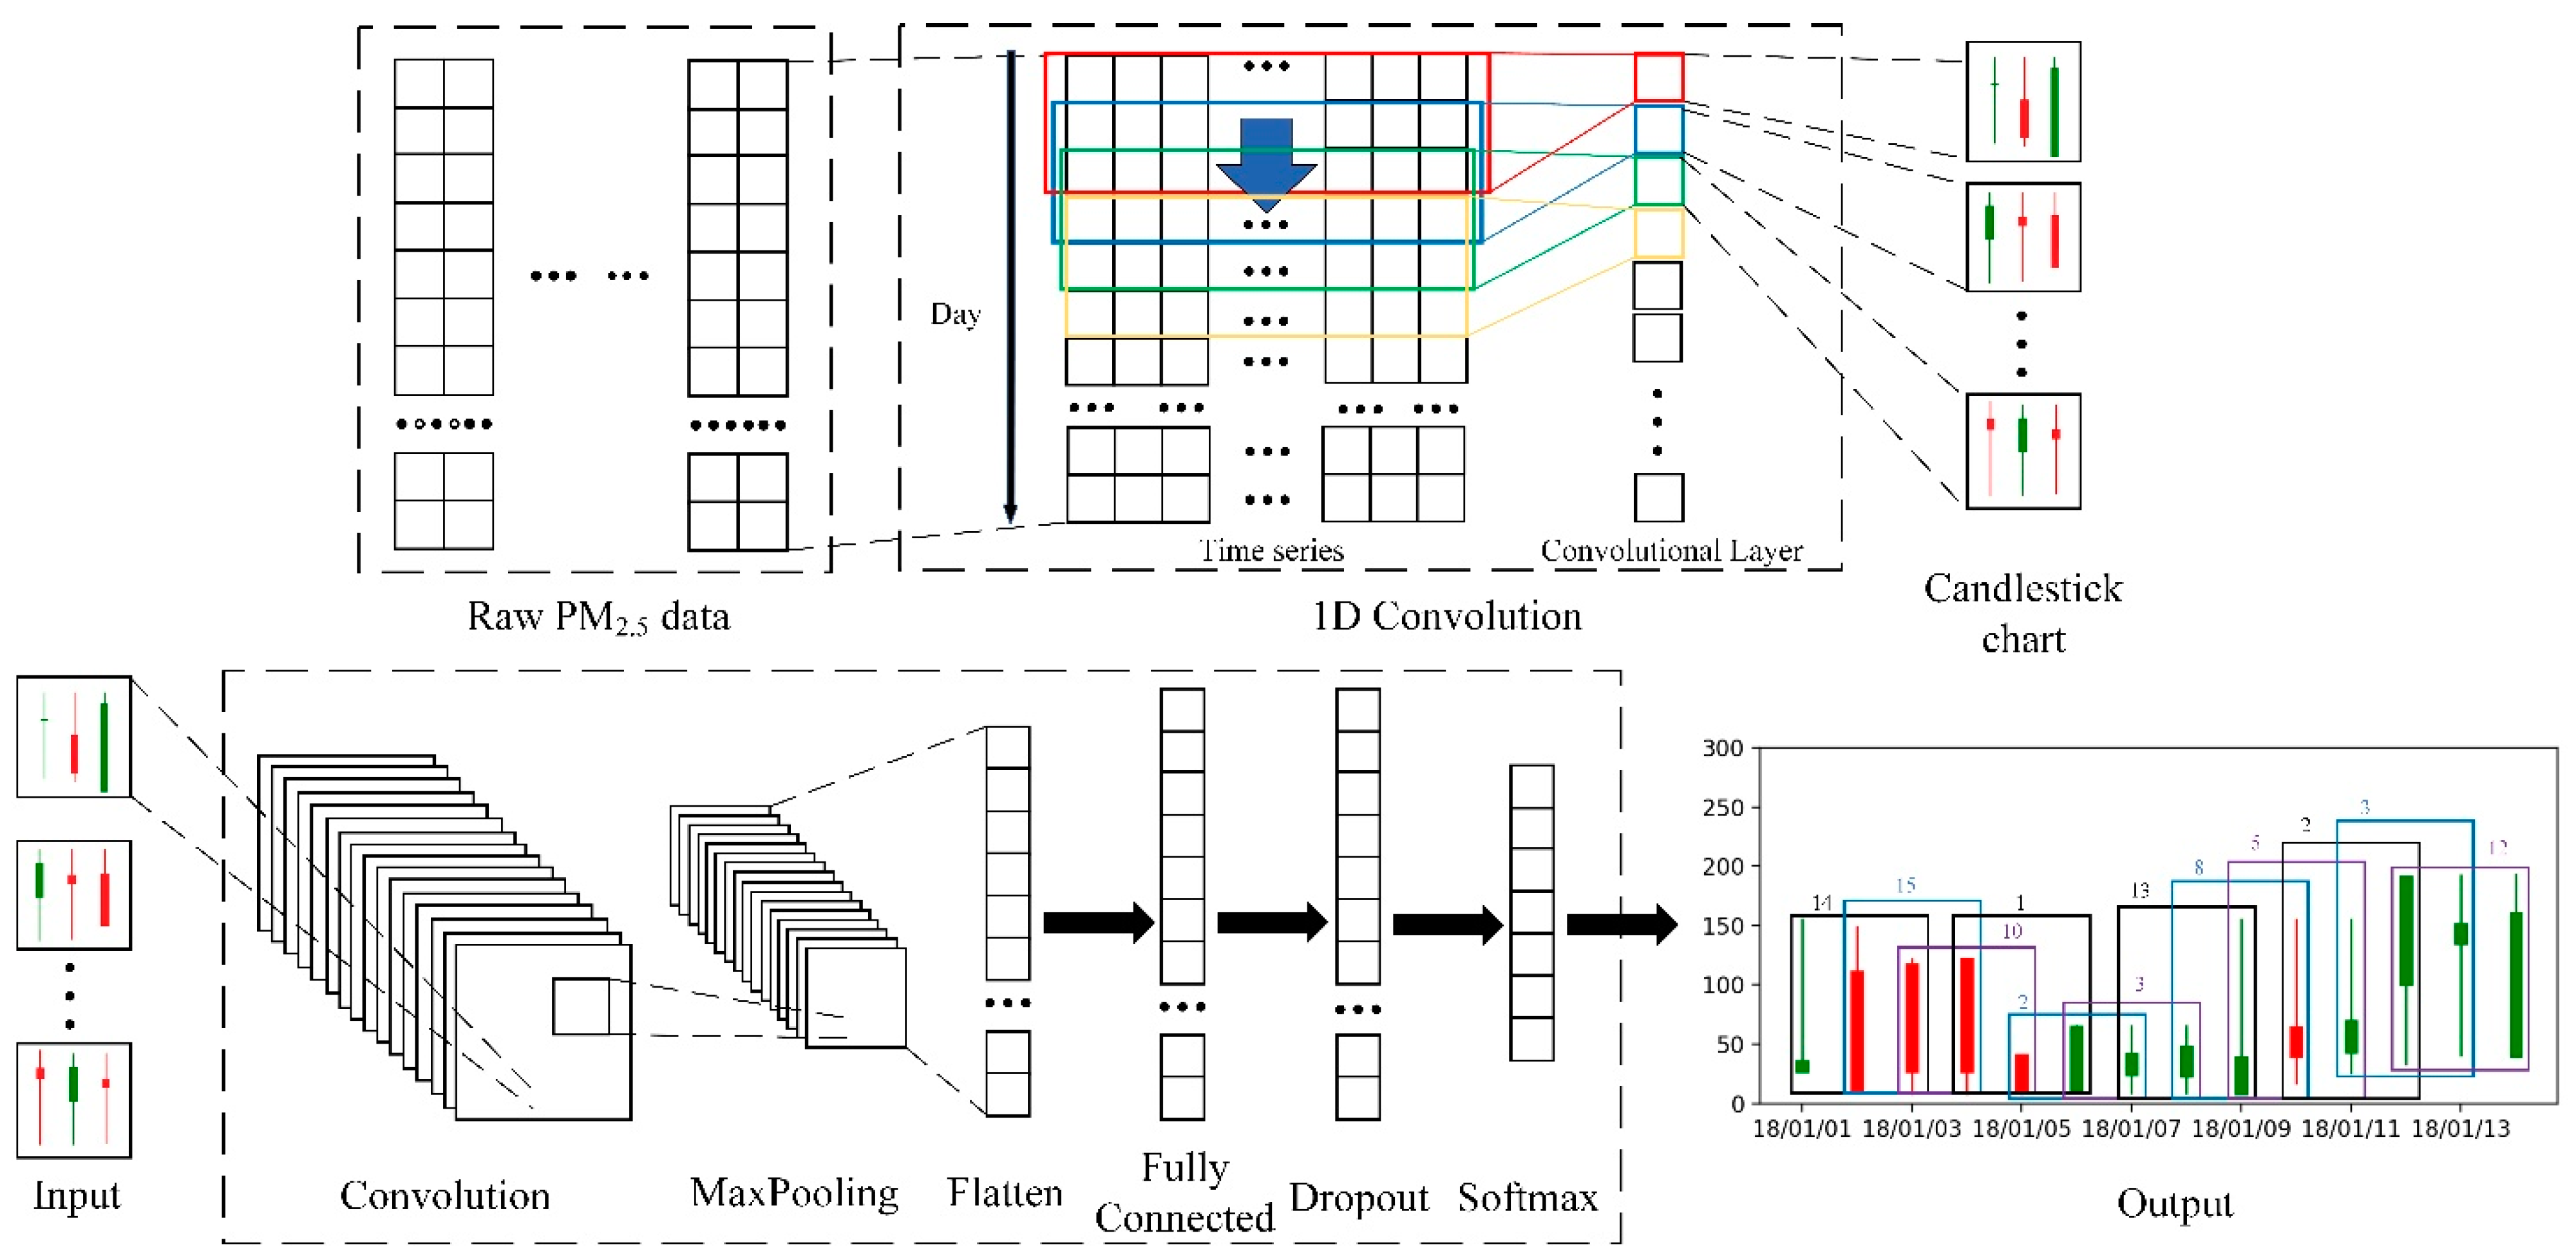
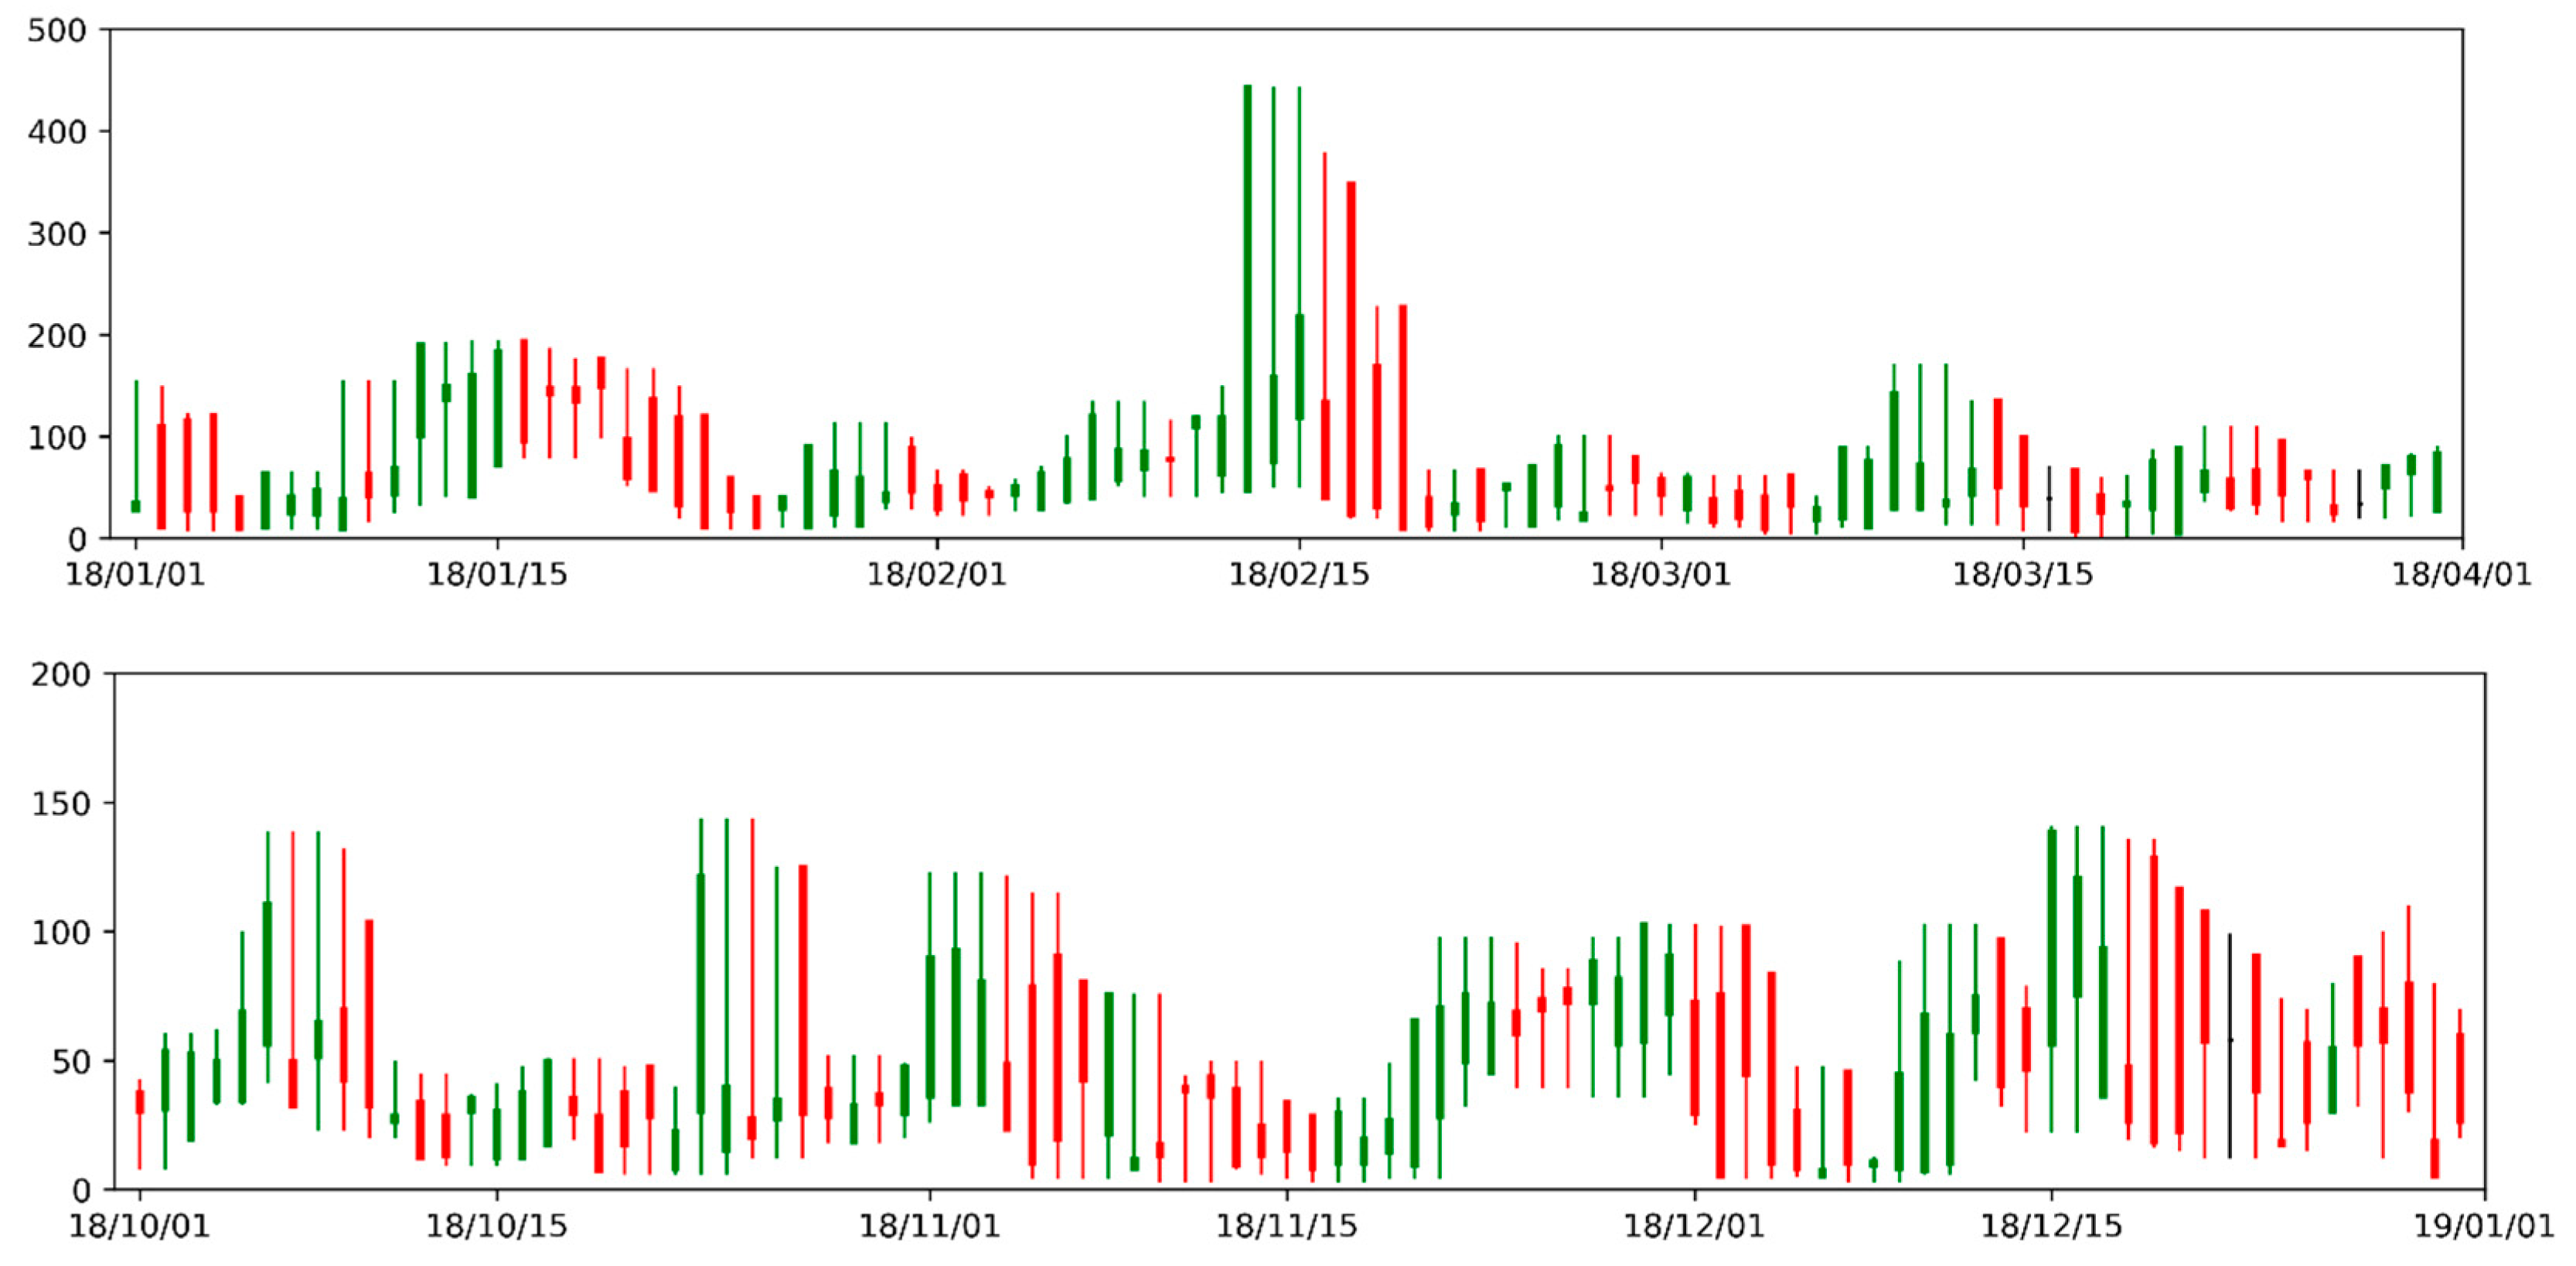
At present, these studies on PM2.5 cannot fully reflect the physical principles of PM2.5 transmission. This problem directly leads to the low accuracy of PM2.5 forecasts. This study examines the use of extracting the candlestick chart characteristics to reflect the PM2.5 diffusion characteristics. Therefore, a method for the candlestick chart characteristics to reflect the physical diffusion characteristics of PM2.5 is proposed. The candlestick chart characteristics, which are consistent with the principle of continuous time physical transmission, are used to reflect the PM2.5 physical diffusion characteristics. This technique will become a key to communicate the physical model and the statistical model, using candlestick chart features to reflect the features that affect PM2.5 concentration in the Gaussian diffusion model. The VGG model that improves the convolutional neural network model (CNN) is used to classify the PM2.5 data. This method proposes to solve the problem of the time series characteristics of the PM2.5 data to connect the physical principles and deep statistical learning theory.
5. Conclusions and Prospects
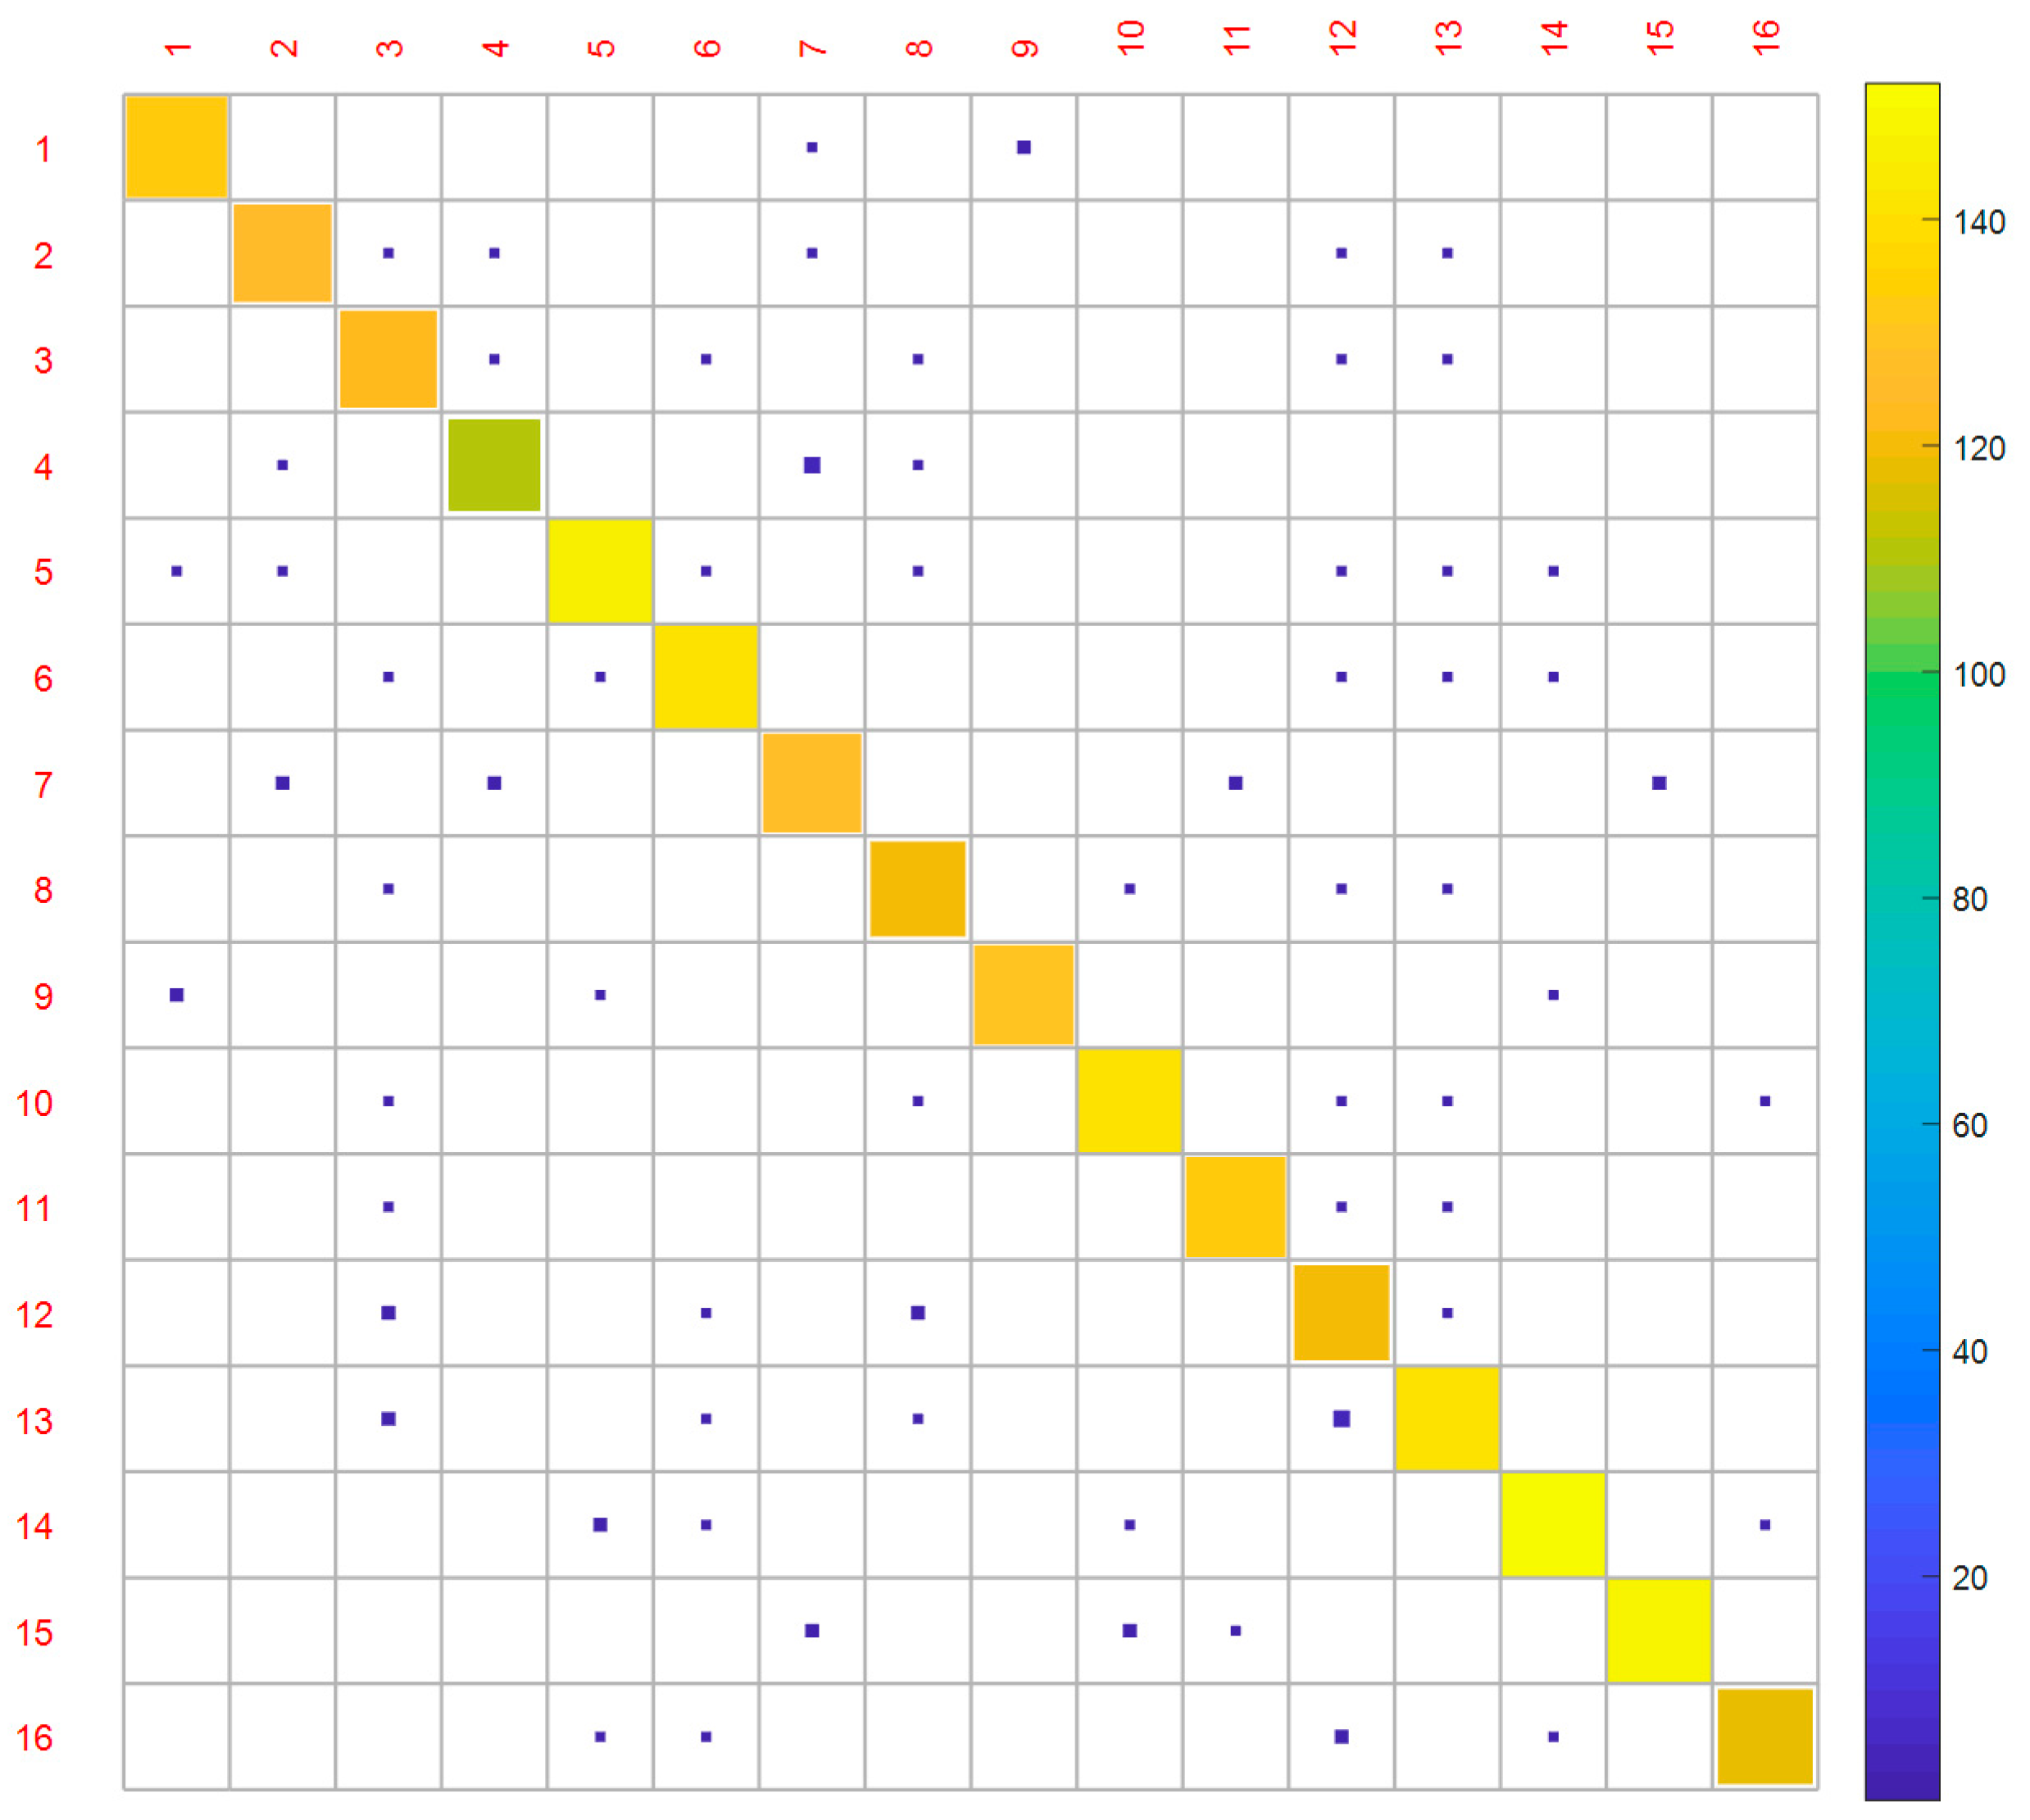
The physical principle of PM2.5 transmission has not been reflected by current studies that have examined PM2.5 transmission simulations. This is because the machine learning models and hybrid models used by these studies were black-box models. These black-box models are established based on the relationship between input and output. Although this reflects a general direct causal relationship between related factors, it cannot describe the specific physical process and lacks data on periodic characteristics. Therefore, a method was proposed to reflect the physical diffusion characteristics of PM2.5 using the candlestick chart characteristics. After implementing unsupervised classification on 2188 groups of PM2.5 data in the form of a candlestick chart from the Guilin Monitoring Station, 16 candlestick chart combinations were obtained. Using the average concentration change of PM2.5 in the next three days as the evaluation index, the accurate data for predicting the future change trend reached 99.68%, which was verified by the PM2.5 data of the site from 2013 to 2018. The candlestick chart feature that conformed to the physical transmission principle of the continuous period was extracted using the VGG model of the deformed conventional neural network model (CNN). These characteristics reflected the physical diffusion characteristics of PM2.5. Additionally, the classification accuracy of the PM2.5 data classification was improved using this method.
In the experimental verification portion, the performance of the model was evaluated and compared with the SVM, LeNet, and AlexNet models. The experimental results showed that the overall accuracy (OA) value of the candlestick chart combination classification was 96.19%, and the Kappa coefficient was 0.960. Compared with the support vector machines (SVM), LeNet, and AlexNet models, the overall accuracy of the VGG model was improved by 1.93% on average. It shows that the PM2.5 data was effectively classified using this method, and the VGG model combined with the candlestick chart was more accurate than the other classification models. In addition, the problem of connecting the physical mechanism and statistical theory using the time series characteristics of the PM2.5 transmission was solved.
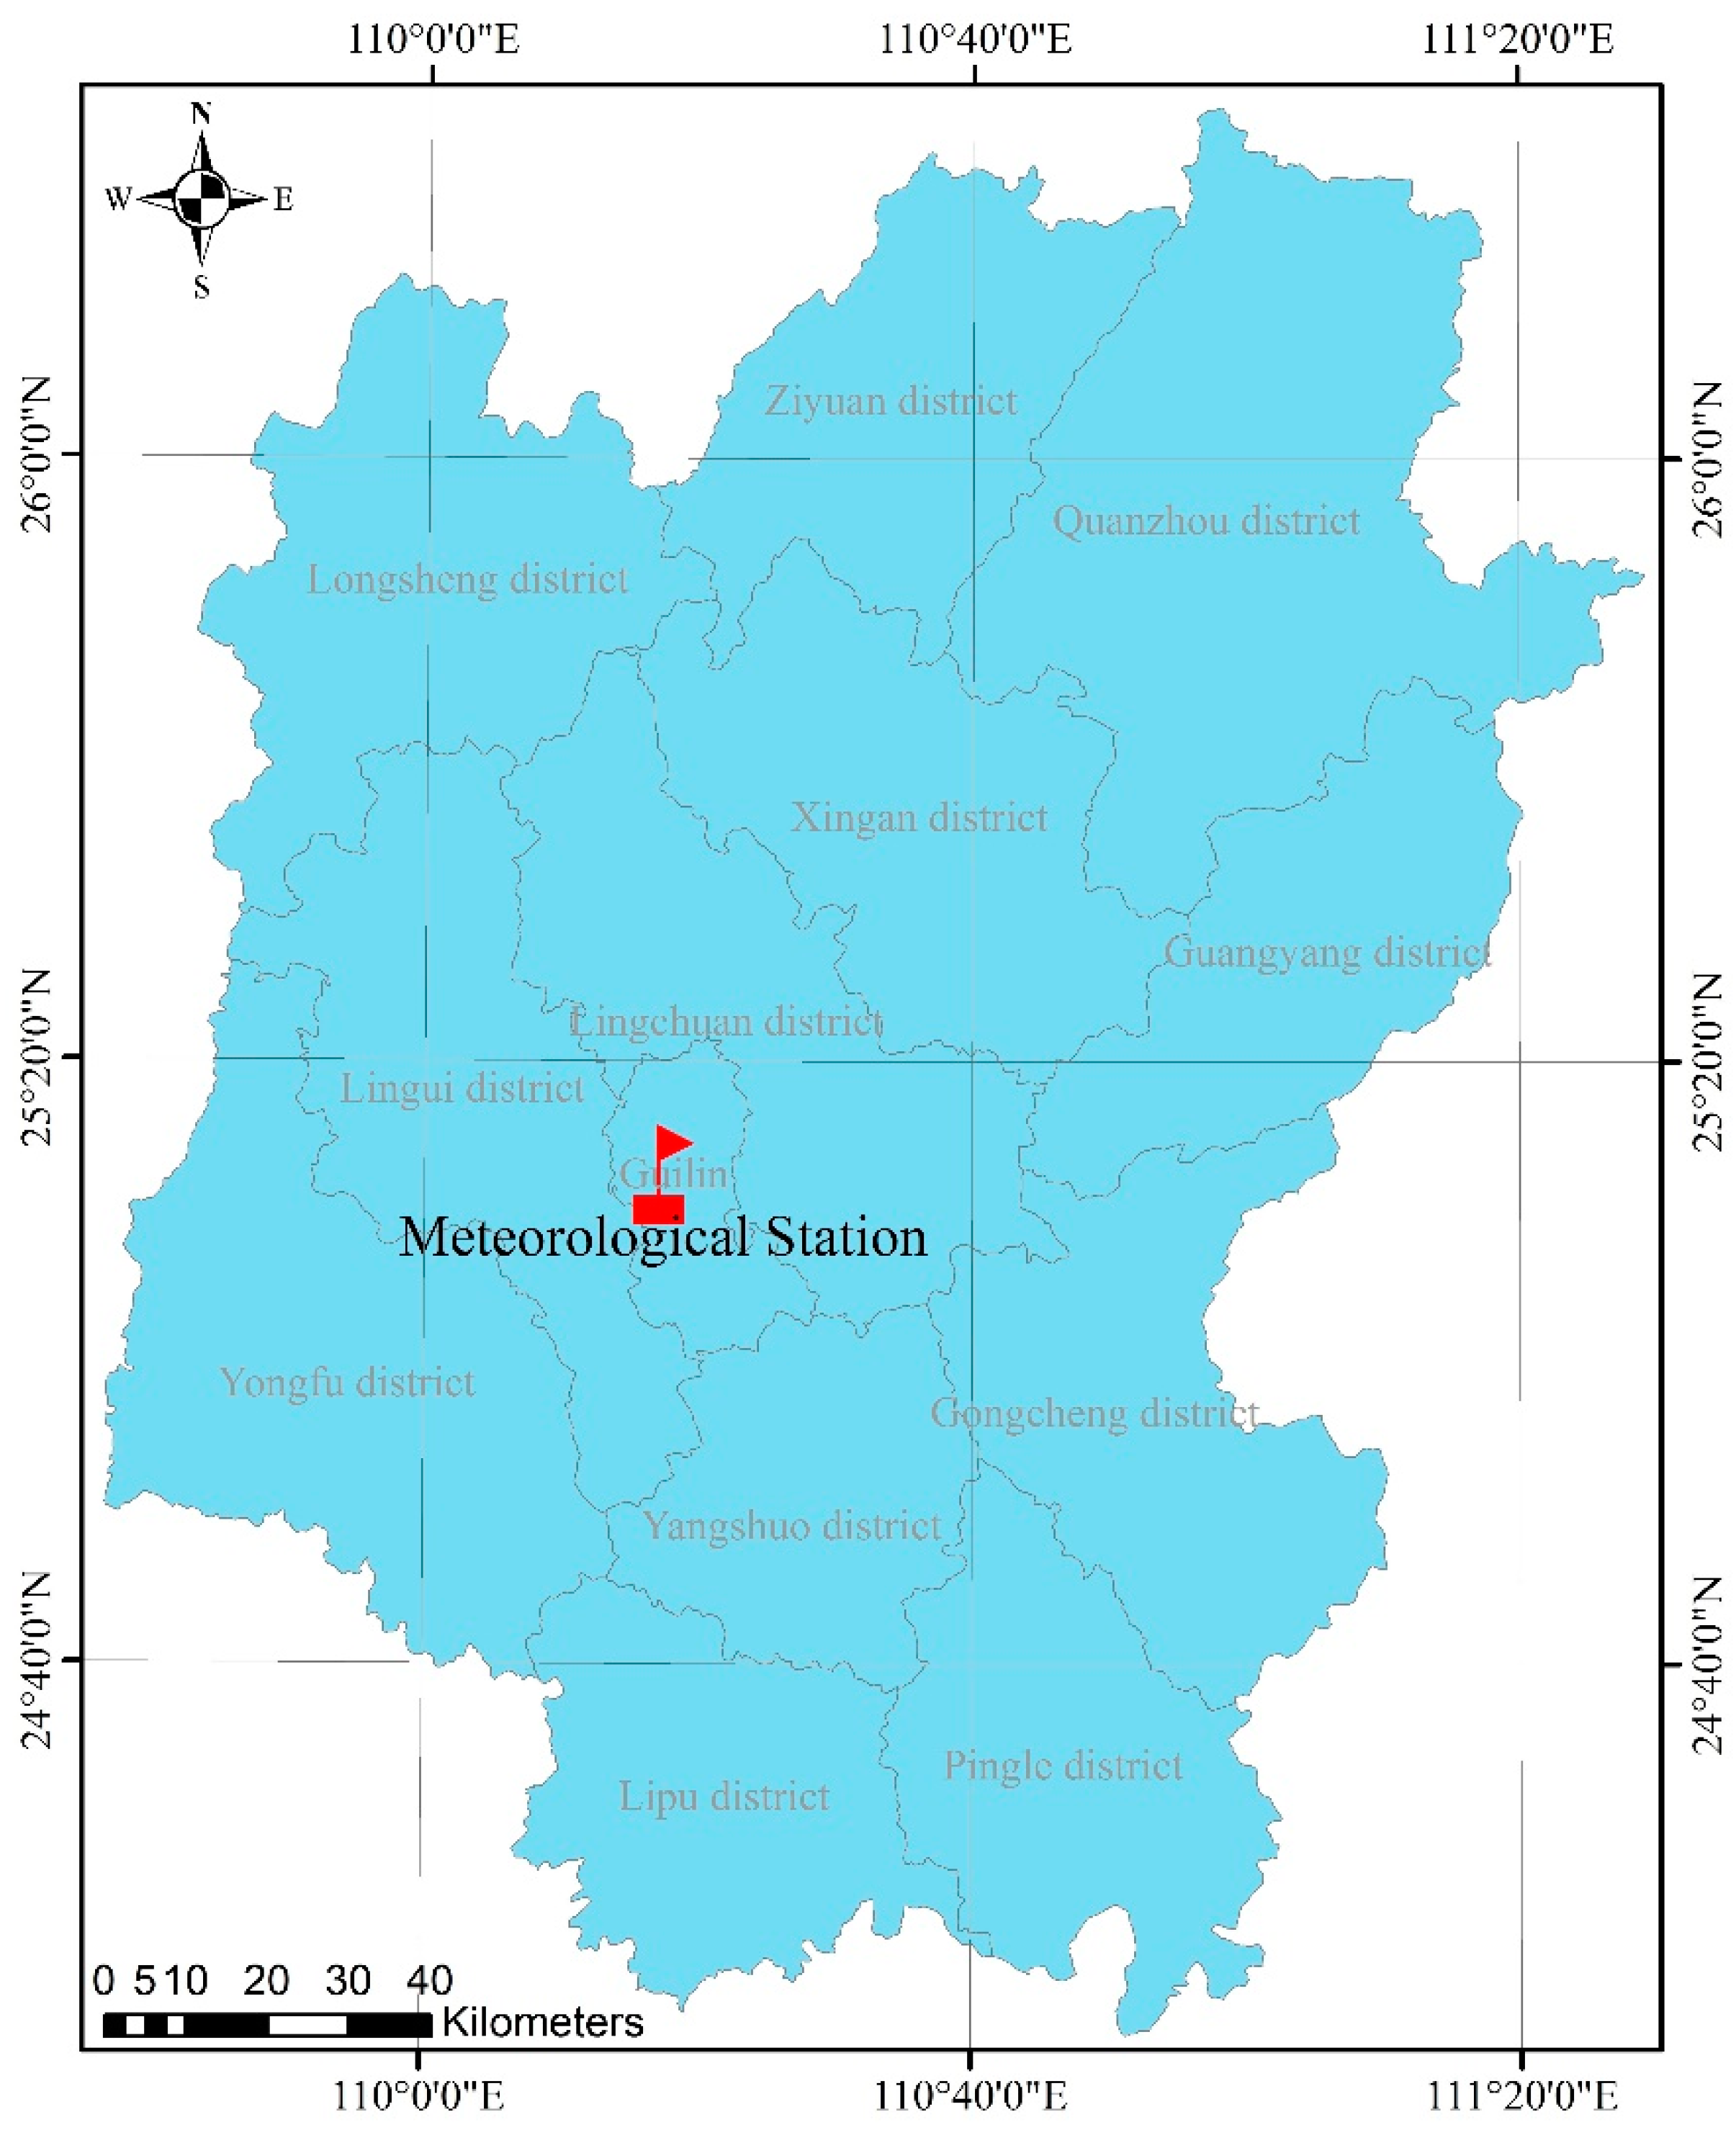
Guilin City was used as the research area during the research process. Therefore, the 16 candlestick chart combinations proposed are only applicable to the PM2.5 studies in this region, and their applicability to other regions remains to be verified. In addition, the method proposed by this study can only predict the PM2.5 change trend for the next three days, and an accurate predicted value of PM2.5 will be proposed in future research.
During the transmission of atmospheric pollutants, the transmission of PM2.5 is affected by factors such as temperature inversions, the natural environment, and human activities. By considering the atmospheric transmission trajectory, local atmospheric turbulence, and human activities, the area represented by the site, which is the regional center, was constructed using the equivalent distance weight method according to the terrain and vegetation. In addition, endogenous and exogenous pollution in the study area were also considered, and by using the backward air mass trajectory and the occurrence of a temperature inversion, a hybrid model of the VGG model based on the candlestick chart and the long and short-term memory network time cycle neural network (LSTM) was constructed. This technique is a more accurate research method to predict the specific value of PM2.5.


