Article

Estimations of the Erythemal UV Doses and the Amount of the Sun-Synthesized Vitamin D by Adults during the Cruise to Spitsbergen–Polar Measurement Campaign (2–21 July 2017)

by
Agnieszka Czerwińska
1,* and
Wiktoria Czuchraj
2
1
Institute of Geophysics, Polish Academy of Sciences, 01-452 Warsaw, Poland
2
The Sanitary-Epidemiological Station, 34-500 Zakopane, Poland
*
Author to whom correspondence should be addressed.
Atmosphere 2021, 12(4), 474; https://doi.org/10.3390/atmos12040474
Submission received: 17 March 2021 / Revised: 2 April 2021 / Accepted: 7 April 2021 / Published: 9 April 2021
(This article belongs to the Section Biometeorology)

Abstract

:
UV index (UVI) measurements were carried out by the hand-held instrument Solarmeter 6.5 onboard of MS Horyzont II during the cruise from Poland (Gdynia) to Spitsbergen (and back) in the period from 2 to 21 July 2017. A method is proposed to estimate the erythemal doses and sun-synthesized amount of vitamin D from a limited number of daily UVI observations. This study shows that the erythema could appear in a person with Caucasian type of skin characterized by Minimum Erythema Dose (MED) ~250 J m−2 after ~1 h exposure near the polar circle and up to few hours in the Svalbard. During this time, it was possible to get the dose of vitamin D3 equivalent to ~1000 IU of oral intake. The protection against UV overexposure should be applied even if UVI values during the cruise in the Arctic were always below the World Meteorological Organization (WMO) warning threshold of 3. To provide adequate amount of vitamin D, the exposure should be continued until getting 1 MED, after which the vitamin supplementation (or a diet rich in vitamin D) is necessary.

1. Introduction

Ultraviolet radiation (UVR) is a part of the solar radiation usually divided into three categories: UV-A (315–400 nm), UV-B (280–315 nm), and UV-C (100–280 nm). Participation of UV-B in total UVR energy at the ground level depends on many factors, including the solar zenith angle, total column ozone (TCO3), and the cloudiness level. It is much smaller under low solar elevation and high TCO3 [1,2]. In spite of low energy of UV-B radiation, it poses strong biological effects, being a risk factor for many diseases including skin cancer (malignant melanoma and squamous and basal carcinomas), and other diseases [3,4,5,6]. UV-B radiation also has beneficial effects triggering the vitamin D3 skin-mediated synthesis. There are numerous studies showing the vitamin D importance in prevention of various cancers such as breast, colon, prostate [7], and several other cancers [8]. In the recent years it has been widely discussed that skin cancer prevention should be balanced with spending time outdoors [9,10], as it may have a greater positive role than just vitamin D synthesis [11,12]. Very recently, a link of the serum vitamin D level with severity of COVID-19 infection is a widely discussed issue [13,14,15].
Overexposure to solar UV radiation may present a risk for people who spend most of their day outdoors. Concerning outdoor activity over the seas, Feister et al. [16] conducted measurements and simulation of a daily UV exposure of seafarers in subtropical and tropical regions. Moreover, Modense et al. [17] measured UV exposure of fishermen working in the Italian North Adriatic Sea. Both studies showed that there is a great risk of overexposure in these regions. This problem concerns not only the occupational overexposures, but it may also appear during tourist cruises, which became a popular way of spending leisure time in the high latitude regions (e.g., the summer Hurtigruten Norwegian costal voyages, which contrary to whole-year cruises attract also young people).
The intensity of UVR related to potential of skin damage is expressed as dimensionless UV index (UVI), i.e., the erythemal dose rate in mW m−2 divided by 25 m2 W−1 [18]. Several countries adopted UVI to alert people about overexposure risk and a need to apply protective steps against overexposure [19]. It has been assumed that for cases with UVI lower than three, it is safe to stay outdoors for an indefinite period of time. However, Lehmann et al. [20] claimed, that a prolonged exposure to UV radiation, even in the days, when UV Index (UVI) is 2 or lower, can pose a significant risk for people with Caucasian type of skin.
In this paper, the overexposure risk and amount of vitamin D produced in skin-mediated synthesis is estimated from the intra-day UVI measurements by the hand-held instrument Solarmeter 6.5 (by Solar Light Company, Inc., Glenside, Montgomery County, MD, USA). The UVI and temperature (to calculate unexposed skin area) measurements were carried out on board the MS Horyzont II during the cruise from Poland (Gdynia) to Spitsbergen (and back) in the period from 2 to 21 July 2017 (days 183–202 of the year). The duration of exposure needed to reach the Minimal Erythemal Dose (MED) (i.e., the minimal dose that produces a just noticeable actinic erythema on a single individual’s previously unexposed skin-http://cie.co.at/eilvterm/17-26-068, accessed on 8 April 2021) and the sun-synthesized daily vitamin D dose equivalent to 1000 IU (International Units) or 2000 IU taken orally will be calculated. These threshold values are recommended from recent national and overall guidelines for adults to keep adequate vitamin D level [21,22]. Although many countries recommend lower doses for vitamin supplementation, many researches show, that even the daily dose of 2000 IU could not be enough to increase the level of the serum of the 25 hydroxyvitamin D (25(OH)D) above 30 ng/mL [23,24]. The dose needed to improve vitamin D status depends also on frequency of supplementation, starting serum level and its deficiency.
In the polar region, UVI is expected to be usually low without risk of sunburn, and it is difficult to get enough vitamin D3 from the sun alone. Is this always true? This problem will be discussed in this paper. Conclusion are drawn from the study in a perspective of on-board activities during popular tourist cruises along Norwegian and Spitsbergen fiords and a sport activity in the vicinity of the Norwegian Sea.

2. Measurements and Methods

2.1. Observations on Board of the MS Horyzont II

Measurements were made during a cruise from Poland to Spitsbergen and back on board of the MS Horyzont II in the period 2–21 July 2017 (days 183–202). During 2 days (190 and 191), measurements were also conducted at the Polish Polar Station Hornsund, which is managed by the Institute of Geophysics, Polish Academy of Sciences. MS Horyzont II is a research vessel built in 2000 (https://www.vesselfinder.com/vessels/HORYZONT-II-IMO-9231925-MMSI-261208000, accessed on 8 April 2021).
The cruise sailed along the coasts of Poland, Germany, Denmark, Norway, and across the Norwegian and the Barents Sea. From 6th to 17th of July (days 187–198), the ship was located in the polar region (north of the Pole Circle ~66.6° N). The details of the geographical coordinates of the measurements’ sites with measured UVI are shown in the Appendix A (Table A1, Table A2, Table A3). Figure 1 illustrates these sites superposed on the ship’s route. Smartphone applications were used to determine time of observation and the geographical coordinates. The local time was converted into Greenwich Mean Time (GMT) and did not change during the whole cruise. Measurements (UVI by Solarmeter 6.5 and temperature) were made irregularly during all weather conditions (Table A1, Table A2, Table A3), usually between 10 a.m. and 2 p.m. GMT. As the MS Horyzont II is not a tourist ship, the UVI observer was not always allowed to enter the open deck of the ship—especially when the weather conditions were unstable.

2.2. UVI Observations

Solarmeter 6.5 (SM 6.5) No. 03927 was a digital hand-held radiometer to measure UVI (with the nominal resolution of 0.1 UVI) during the cruise. The producer recommends that SM 6.5 should be used in the position with sensor oriented normal towards the sky. De Paula Correa et al. [25] found that the SM 6.5 provides trustworthy UVI measurements with the accuracy of ±5%. This type of meter was also used in our previous field campaigns [26,27] and UVI measurements also were found out to be reliable.
Our SM 6.5, previously calibrated by Solar Light Co. (Glenside, Montgomery County, MD, USA), was also re-calibrated a few weeks before the cruise. This was against the Davis UV meter, which is a part of the Davis Weather station, during the inter-comparison campaign carried out on the roof of the IG PAS main building. UV sensor is a part of the Davis weather station Vantage Pro2™ and its spectral characteristic resembles the standard erythemal action spectrum defined by CIE—Commision Internationalle de L’Eclairage [28].
Davis UV meter located on the roof of IG PAS main building is regularly calibrated with the Brewer spectrophotometer no. 207 [29]. The comparison of the UVIs by the Davis instrument versus corresponding ones by the SM 6.5, showed a good agreement between the instruments with the determination coefficient of 0.97 and the linear regression fit y = 0.94x + 0.45. We found that the mean value of relative error in the range of UVI up to ~7 was ~6%. Nevertheless, for UVI in the range up to 3 (which is observed in the polar area), the mean value of relative error was ~20%. Taking this into consideration, we should bear in mind, that measurements could be burden with larger error than provided 5% by the producer and confirmed by other researchers for different conditions.

2.3. Calculations of the Erythemal Doses

The cloud and aerosol effects on UVR are parameterized using the cloud-aerosol modification factor (CMF), i.e., a quotient of measured UVI and corresponding hypothetical clear-sky UVI. The latter is estimated from Allaart et al. model that allows to reconstruct clear-sky UVIs with any time resolution based on only one TCO3 measurement [30]. Here, the ozone data was taken from the Ozone Monitoring Instrument (OMI) observations on the board of Aura satellite from NASA’s Earth Observing System (EOS) (https://www.esrl.noaa.gov/gmd/grad/neubrew/SatO3DataTimeSeries.jsp, accessed on 8 April 2021).
Precise calculations of the daily biologically weighted doses require a high resolution of UVI values throughout the entire day. However, the frequency of the SM 6.5 measurements was at best every 0.5 h (e.g., day 185 and 198) for only a few hours. Therefore, to have more data points for the time integral (i.e., for the dose calculations) we estimated the hypothetical clear-sky UVI values with a 5-min resolution and multiplied them by the pertaining CMF values. CMF values taken from the linear fit between the measuring points seems to work well in case of many intra-day SM 6.5 observations (>10). However, during limited number of days, only a few observations were made. For such days, a persistence of cloud-aerosol properties throughout the day is an alternative way to parameterize the cloud-aerosol attenuation of UVR.

2.4. Model Estimates of the Vitamin D3 Intake
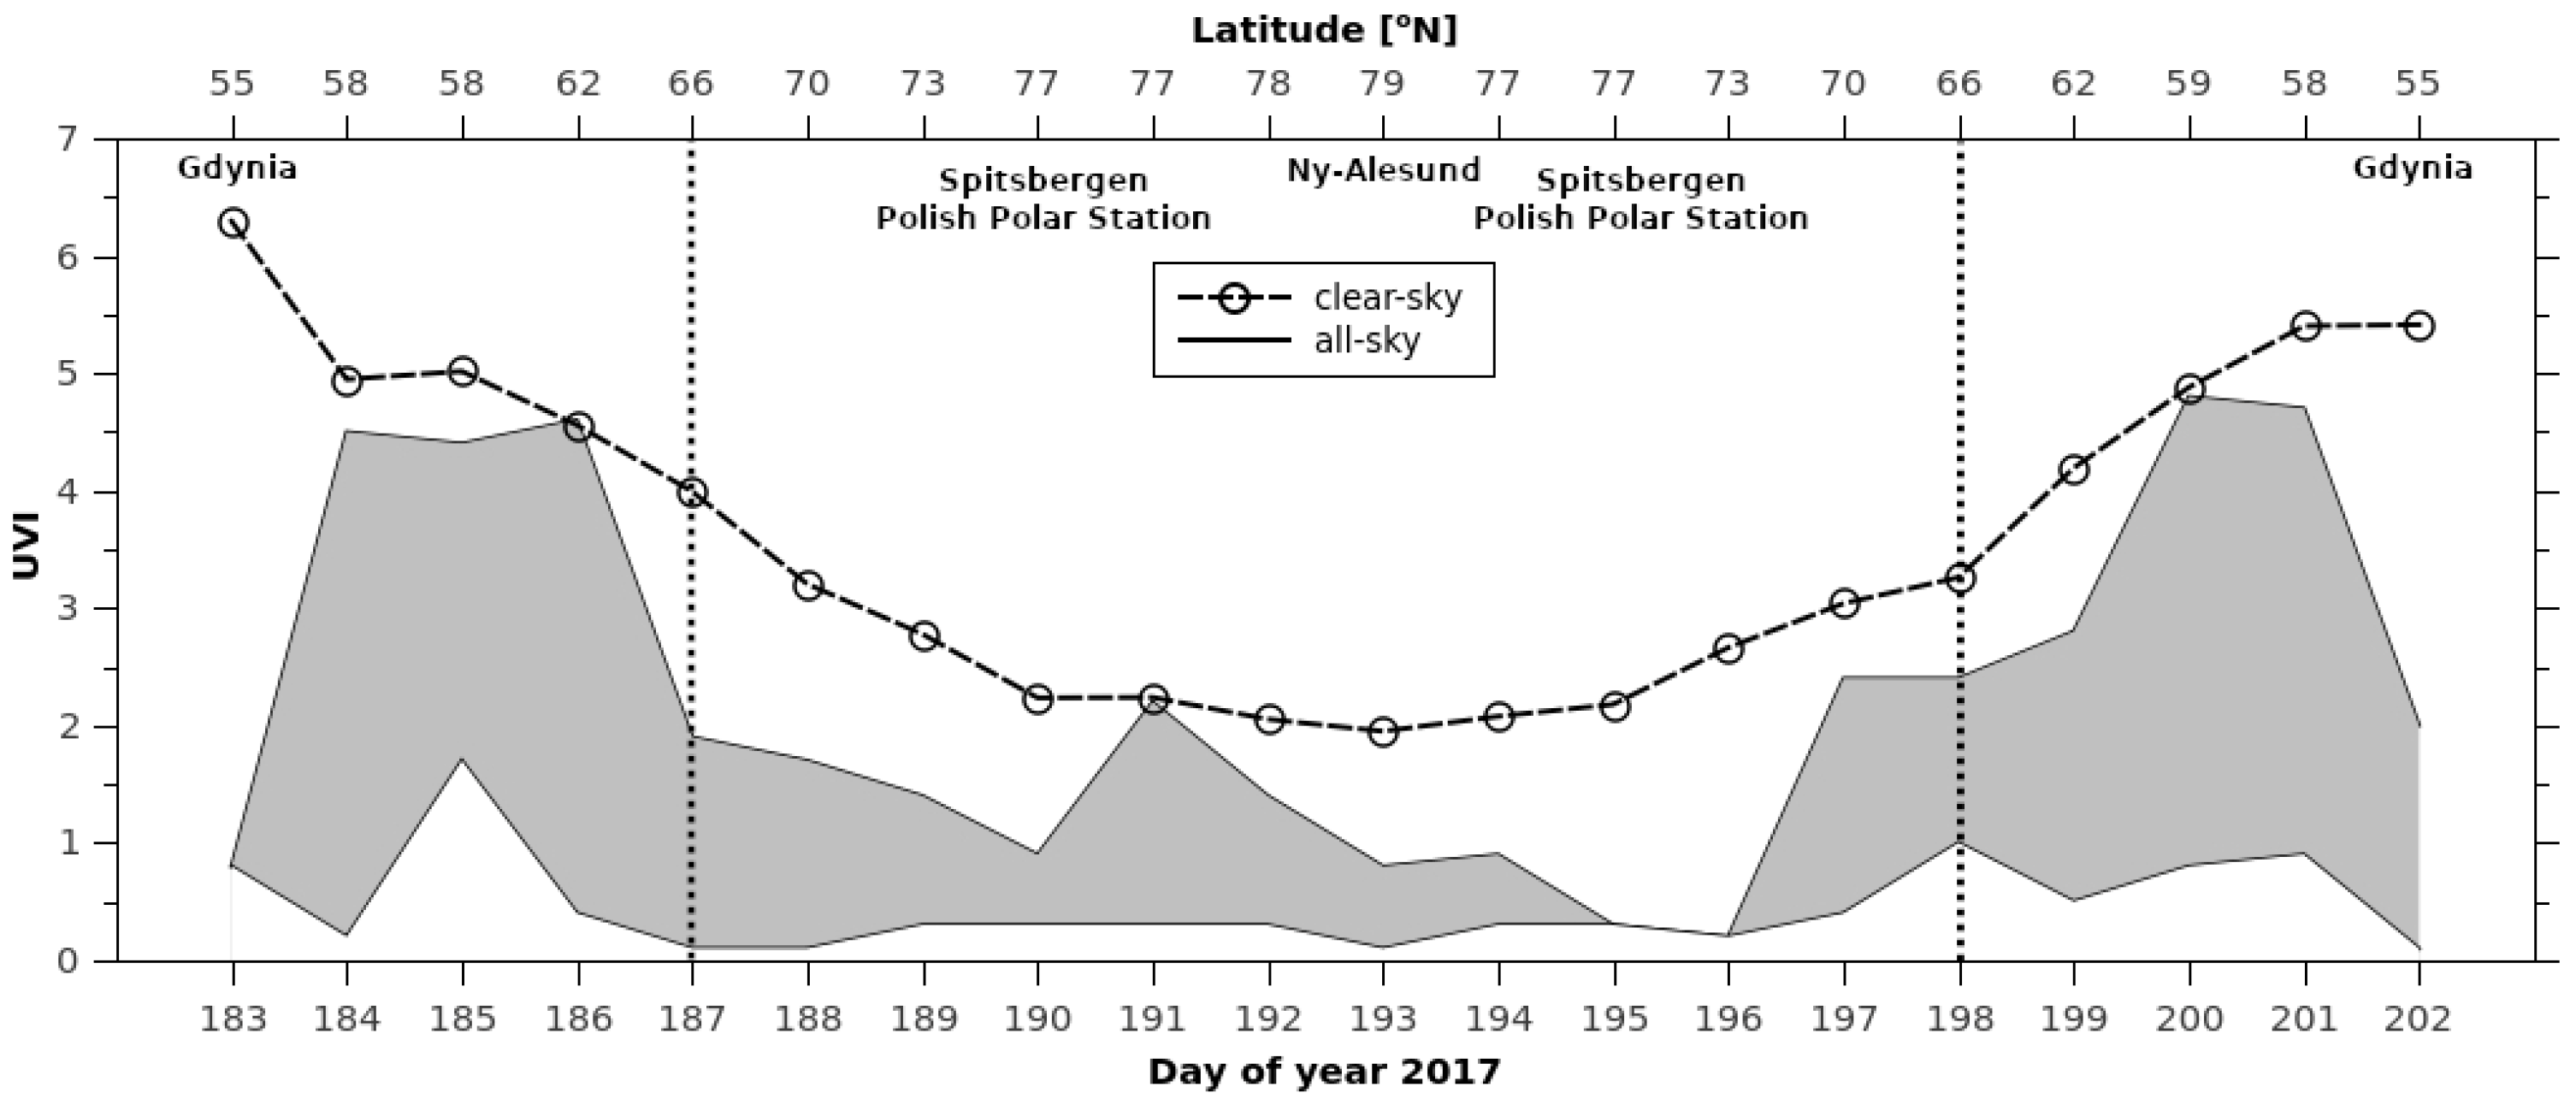
The amount of the sun-synthesized vitamin D3 due to the solar exposure that is equivalent to oral intake of vitamin D3 expressed in international units (IU, IU = 40 µg of vitamin D3) is calculated by our previous model [27,31]:
QVitD3,k (to, Δt) = Ratek∙VitD3,P (to, Δt)∙ESA∙AF
where QVitD3,k (to, Δt) is the amount of sun-synthesized Vitamin D3 in IU by a person with Fitzpatrick skin phototype “k” in the period from to to to + Δt, Ratek is equal to 6153 IU/MEDk, VitD3,P (to, Δt) is a personal pre-vitamin D3 dose (i.e., time and spectral integral of the spectral UV dose rate weighted by the action spectrum of the pre-vitamin D3 synthesis in the skin, CIE 2006 [32]) per 1 m2 (J m−2) in the period from t0 to t0 + Δt, ESA is a geometrical area of exposed skin (m2), and AF is an age factor. According to CIE action spectrum, the effect of UV-A on the vitamin D synthesis is negligible. However, there is a discussion in the literature, that UV-A may disturb the vitamin D production [33]. In this study, the doses were calculated for the person with the Fitzpatrick skin phototype 2 (as it is the most common type of skin for North Europe), with MED2 = 250 J m−2 [34] giving the Rate2 = 24.6 IU per 1 J m−2 of the VitD3, P (to, Δt).
VitD3,P (to, Δt) is calculated from the ambient (measured on a horizontal surface) pre-vitamin D3 weighted dose multiplied by the geometrical conversion factor (GCF). In this study, GCF was calculated from the model of Vernez et al. [35] for the upward position with hands alongside the body.
GCF = −3.396a + 10.714b − 9.199c + 56.991
where a = ln(Vis/10) − 1.758, b = Vis/10 − 5.800, c = cosSZA3 − 0.315, Vis–visible part of the sky from the body site surface [%], SZA–solar zenith angle. Vis for the considered body parts was taken from the supplemented material of the paper of Vernez et al. [35]. The value of GCF was ~0.45 for different parts of the body considered (face and hands) for SZAs corresponding to the selected hypothetical period of exposure. This value stays in agreement with Schmalwieser [36], who showed that parts of the body, which are not horizontally oriented to the sun, receive 20–50% of ambient exposure.
Ambient vitamin D3 dose was estimated from the measured UVI (SM6.5) multiplied by the empirical erythema-vitamin D3 conversion factor, which was taken from tabular values provided by Czerwińska and Krzyścin [37] and depends on SZA and TCO3. ESA was calculated as the total skin area from the Mosteller formula for the mean value of 1.96 m2 for average Northern European woman (1.82 m2) and man (2.1 m2) (https://www.worlddata.info/average-bodyheight.php, accessed on 8 April 2021) multiplied by the area of uncovered skin (AUS) [38]. AUS is depended on the temperature (T) in Celsius degrees, and it was calculated from the formula derived by Guzikowski et al. [31].
AUS = 9.8 − 0.105 T + 0.0012 T2 + 0.00186 T3
Although in this formula the measured temperature should be corrected for wind chill, here we could assume zero chill effects, for tourists, who prefer staying in windless areas while enjoying the cruise. In this study, we present results for AUS = 10% as it was the most frequent case of clothing within the Arctic part of the cruise. QVitD3,2 (to, Δt) was calculated for the 21 years old person with AF = 1 [39], assuming the most optimistic scenario, as efficiency of vitamin D synthesis is decreasing with age. Elder people cannot gain the recommended dose of vitamin D from the skin-mediated synthesis (or need doses that exceed 1 MED) and should supplement it regardless their type of activity. Model 1 was used to estimate duration of outdoor activity from the beginning of the UVI measurements to attain 1 MED2 and the vitamin D3 dose equivalent to oral intake of 1000 IU or 2000 IU.

3. Results

The daily maximum–minimum UVI range (shaded area) from the SM 6.5 measurements during the cruise and hypothetical clear-sky UVI daily maximum are shown in Figure 2. The dashed line shows UVI estimated for the clear-sky conditions with the use of Allaart et al. model [30]. Estimated clear-sky UVI at noon exceeded three for the observing sites south of 70° N and it was always above two. Whereas the maximum of measured UVI was rarely above two in the Arctic because of the UV attenuation by clouds and aerosols; it only happened three times on 10, 16, and 17 July (191, 197, and 198 calendar day), respectively. The measured UVI exceeded 4 south of ~60° N. Therefore, it seems that exceeding the MED threshold and the daily vitamin D3 intake of 1000 IU in polar regions will require prolonged outdoor activity and cannot be attained during a short sunbathing session as it is possible in subtropical and tropical regions.
Temperature was above 15 °C for all lower latitude measuring sites (south of the 60° N). It dropped to about 5 °C in Spitsbergen (Figure 3). Low surface temperature means use of cold protective clothing that limits vitamin D3 synthesis. Therefore, only small part of the whole body was probably exposed, i.e., ~10% (face, palms) in Spitsbergen comparing to about maxium 20% over the North Sea (head, neck, palms, short sleeve shirt).
During the cruise, there were only a few days with cloudless conditions (CMF = 1) during the intra-day UVI measurements. CMF ~0.5 were found north of the Arctic circle with the maximum UVR attenuation (CMF = 0.1) in the day 196 (15 July). A weak cloud-aerosol attenuation (the CMF daily mean ~0.8) appeared at the beginning and the end of the cruise over the Baltic Sea, i.e., in 4, 5, 19, and 20 July (185, 186, 200, and 201 days of the year), respectively.
Lucas et al. [40] and Lehmann et al. [20] claimed that the public health messages referring to UVI should be reconsidered. For the days with UVI of two (and even for UVI of one in certain circumstances), for prolonged exposure time, Lehmann et al. found that there is a risk of sunburn among people with Fitzpatrick skin phototype 1 and 2. For hypothetical clear-sky conditions, UVI higher than two occurred on all days except the day when MS Horyzont II was at the northernmost point of the cruise at Ny-Alesund (79° N). The measured UVI > 2 appeared in three days in the Arctic (i.e., 25% of days during the period 187–198 day of the year) and in all days when the ship was south of the polar circle.
Figure 4a shows duration of the exposure to get 1 MED2 from the ambient erythemal exposure (i.e., GCF = 1) and when horizontally oriented to the sun parts of the body were covered (i.e., GCF = 0.45). Figure 4b shows duration of the personal exposure equivalent to 1000 IU and 2000 IU oral intake of vitamin D3 for AUS = 10% (only face and palms are uncovered). Calculations of the erythemal and vitamin D3 doses were done using intra-day UVI measurements. The time integral of the erythemal and the vitamin D3 dose rates started at the moment of the first measurement and continued until the threshold of 1 MED2 or 1000 IU (2000 IU) was reached. It was found that the amount of 1000 IU is possible to gain without the erythema risk. However, the amount of 2000 IU is possible to gain for the exposure longer than that needed to get 1 MED2 on the horizontal plane. Thus, if we consider, that parts of the body oriented horizontally to the sun are covered by clothing and only face and palms are exposed (in this case, the personal erythemal exposure equals the ambient erythemal exposure multiplied by GCF of about 0.45, Section 2.3.), the 2000 IU threshold will be reached safely without the erythema risk. Time to get 1000 IU was ~1.5 h near the polar circle and varied from ~2.5 h up to ~6 h in Spitsbergen. For the northernmost sites during the cruise (on 195 and 196 day of the year) it was not possible to reach the 1000 IU threshold.

4. Discussion

For the people living in the North, the amount of vitamin D from skin-mediated synthesis in every-day life could be not sufficient [41,42] because of low intensity of solar radiation. Furthermore, the weather conditions are insufficient for large body area exposure, frequently only face and hands can be exposed. Kozlov and Verhubsky [43], who examined population from the Russian North, claimed that among others, the level of natural light has a significant effect on the serum of the 25(OH)D. However, many researches show, that “northerners” have sufficient level of 25(OH)D concentration in blood [44,45]. Some researchers found that recently a decrease in 25(OH)D is observed, especially in Greenland, but also in the northern regions of the United States and Canada (among modern Inuit and Indians) [43,46,47]. Probably, insufficient dose of vitamin D among young and modern “northerners” is connected with abandoning the traditional diet [46,47,48]. Nevertheless, there were no evidence that the level of 25(OH)D concentration in blood was improved after a change of diet to healthy Nordic diet, which contains large amount of fish [49]. Moreover, among vegetarians, fish-eaters, and meat-eaters, fish-eaters had lower level of vitamin D than meat-eaters [50]. Brader et al. [49] suspect that farmed fish does not contain much vitamin D. Furthermore, it may contain heavy metals [51], which are not neutral to human health.
This study shows that it is possible to get the dose of vitamin D3 equivalent to 2000 IU of oral intake, without the risk of getting sunburn, if parts of the body that are horizontally oriented to the sun (e.g., nose or ears) are protected from the sun by clothing or sunscreens for the Caucasian type of skin. However, the duration of such outdoor activities should last ~1.5 to 2 h near the polar circle and ~4 to 6 h in Svalbard. The dose of 2000 IU due to solar exposure is hard to achieve due to the low temperature but it is possible for people staying outdoor for several hours, e.g., natives (fishermen and hunters) and tourists enjoying cruises around the fjords, even if only palms and face are uncovered (if we assume that no SPF was used). Such cruises for the tourists could be beneficial for those with insufficient level of vitamin D but cannot do harm to those who has already sufficient vitamin D status, as the amount above the needed 25(OH)D dose is quickly decomposed [52]. The study refers to Caucasian type of skin and assumes decreasing ability to cutaneous vitamin D production with skin color (increasing melanin), which is a standard approach [53,54]. However, Young et al. [55] showed that melanin offers limited inhibition of vitamin D3 production.
Feister et al. [16] and Modense et al. [17] confirmed that there is a greater risk of an erythema occurrence for workers during sea cruises in low and mid-latitudes even during a short stay on the deck around midday. There exists an erythema risk for the outdoor stay (~1 h) also near the polar circle under clear-sky conditions (for UVI = 3, see Figure 2), if we assume that there is a possibility to uncover more parts of the body than just hands and face. For the vertically oriented parts of the body, there is a risk of erythema occurrence after 2 h of exposure. The calculation does not take into account the tanning effect (i.e., the natural increase in skin protection after prolonged exposure), as we examine person with Fitzpatrick phototype 2 (usually burns, and tans poorly). In the polar region it is possible, that the time spend outdoors for the crew and tourists/scientists during the cruise or outdoor activities would be long enough to receive 1 MED exposure, although it would be possible only for clear-sky conditions.

5. Conclusions

Czerwińska and Krzyścin [27] discussed that the large amount of vitamin D can be sun-synthesized in midlatitudes before the erythemal dose reaches the MED threshold for the Caucasian type of skin. This is also true in polar regions during summer months. In July it is possible to get a large amount of vitamin D during prolonged outdoor stay, with area of uncovered skin about 10%. Although during cloudy sky conditions this may be hard, as the wind renders it uncomfortable for most people to stay outdoors for longer than an hour. However, prolonged outdoor stay seems more likely during tourist cruises in windless onboard areas. Our estimations are based on the most optimistic scenario of UV exposure by younger people with Caucasian type of skin. Although it is possible to get the amount of vitamin D of 2000 IU, the estimations are burden with large uncertainties. In conclusion, the scenario according to which the solar exposure should be stopped just before sunburn or balanced with a diet (and supplementation) when the duration of such exposure is too long [27], should be followed also in the sub-polar and polar region.

Author Contributions

Conceptualization, A.C.; methodology, A.C.; software, A.C.; validation, A.C.; formal analysis, A.C.; investigation, A.C.; resources, A.C.; data curation, A.C. and W.C.; writing—original draft preparation, A.C.; writing—review and editing, A.C.; visualization, A.C.; supervision, A.C.; project administration, A.C.; funding acquisition, W.C. All authors have read and agreed to the published version of the manuscript.

Funding

This work has been supported within statutory activities No 3841/E-41/S/2020 of the Ministry of Science and Higher Education, Republic of Poland. The measuring device and the journey from Gdynia to Spitsbergen and back (conducted by Wiktoria Czuchraj) was financed by the Leading National Research Centre (KNOW) received by the Centre for Polar Studies for the period 2014–2018.

Institutional Review Board Statement

Not applicable.

Informed Consent Statement

Not applicable.

Data Availability Statement

Measurements of UVI are attached in the Appendix A. Any other data is available on the request ([email protected]).

Acknowledgments

Authors are grateful for the experience shared by Janusz W. Krzyścin. We also acknowledge the data providers from National Oceanic & Atmospheric Administration (NOAA) at the website: https://www.esrl.noaa.gov/gmd/grad/neubrew/SatO3DataTimeSeries.jsp, accessed on 8 April 2021.

Conflicts of Interest

The authors declare no conflict of interest.

Appendix A

Table A1, Table A2, Table A3 show time of the UV observation, corresponding geographical coordinates, and the measured UVI value. Table A1 shows the data collected during the cruise from Gdynia to Spitsbergen, Table A2 during a short stay in Svalbard, and Table A3 during the cruise back to Gdynia.
Table A1. Time, longitude, and latitude at the measuring site together with the observed UV index during the MS Horyzont II cruise from Gdynia-to Spitsbergen in the period 2–8 July 2017 (days 183–189).
DateHourLat° NLon° EUVIDateHourLat° NLon° EUVI
2 July 20171655.2512.870.85 July 20171762.624.200.6
3 July 20171057.3811.484.55 July 20171862.784.200.4
3 July 20171357.3811.003.56 July 201710:3065.525.851.7
3 July 20171657.8010.030.26 July 20171165.655.731.8
4 July 2017857.926.352.26 July 201711:3065.775.781.9
4 July 2017957.956.303.46 July 20171266.276.121.6
4 July 20171058.026.1246 July 20171666.486.320.6
4 July 20171158.105.934.26 July 20171766.626.400.1
4 July 201711:3058.105.754.46 July 20171866.836.530.1
4 July 20171258.205.704.36 July 20172067.256.820
4 July 201712:3058.235.703.67 July 20171069.438.321.1
4 July 20171358.275.403.87 July 20171169.558.421.5
4 July 201713:3058.355.333.57 July 20171269.788.551.7
4 July 20171458.405.323.27 July 20171369.928.671.1
4 July 201714:3058.475.172.57 July 20171470.078.780.8
4 July 20171558.835.101.77 July 20171670.359.000.5
5 July 20171061.474.1847 July 20171770.529.120.2
5 July 201710:3061.554.1847 July 20171870.759.300.1
5 July 20171161.654.204.67 July 20171970.909.420
5 July 201711:3061.684.2048 July 2017071.6510.020
5 July 20171261.874.204.18 July 20171073.3211.421.2
5 July 201712:3062.184.203.58 July 20171373.7711.831.4
5 July 201713:3062.134.203.28 July 20171473.9511.981.1
5 July 20171462.174.202.98 July 20171574.1012.120.7
5 July 201714:3062.224.202.88 July 201715:1074.1012.120.9
5 July 20171562.284.182.18 July 201716:3074.3712.380.3
5 July 201715:3062.324.181.8
Table A2. The same as Table A1 but during the MS Horyzont II stay in Svalbard in the period 9–14 July 2017 (days 190–195).
DateHourLat° NLon° EUVIDateHourLat° NLon° EUVI
9 July 2017976.9815.570.511 July 20171078.2315.631.4
9 July 20171076.9815.570.511 July 20171178.2315.631.2
9 July 20171276.9815.570.811 July 20171278.2315.631.2
9 July 20171376.9815.570.711 July 20171878.2315.630.3
9 July 20171476.9815.570.912 July 20171078.6511.750.8
9 July 20171576.9815.570.512 July 20171178.6511.750.8
9 July 20171676.9815.570.312 July 20171278.6511.750.7
10 July 2017776.9815.570.812 July 20171378.2312.780.6
10 July 20171176.9815.572.212 July 20171478.1512.780.3
10 July 20171376.9815.571.512 July 20171578.1212.820.3
10 July 20171476.9815.571.212 July 20171677.9813.130.3
10 July 20171676.9815.570.712 July 20171777.9813.130.1
10 July 20171776.9815.570.513 July 2017976.9815.570.7
10 July 20171876.9815.570.313 July 20171376.9815.570.9
11 July 2017778.1814.320.413 July 20171776.9815.570.3
11 July 2017878.2215.581.414 July 2017676.9815.570.3
Table A3. The same as Table A1 but during the MS Horyzont II cruise from Spitsbergen to Gdynia in the period 15–21 July 2017 (days 196–202).
DateHourLat° NLon° EUVIDateHourLat° NLon° EUVI
15 July 20178.574.1012.120.219 July 201713:3058.185.523.8
15 July 20171473.1211.250.219 July 201714:3058.085.732.6
15 July 20171972.4310.37019 July 20171558.035.832.1
16 July 20171071.108.900.419 July 20171657.956.031.2
16 July 20171369.328.252.419 July 20171757.806.550.8
16 July 20171668.988.000.419 July 20171957.706.853.2
17 July 2017966.536.351.620 July 2017957.6011.103.8
17 July 20179:3066.436.271.120 July 20179:3057.5511.204.5
17 July 20171066.336.231.520 July 20171057.4811.324.5
17 July 201710:3066.276.172.420 July 201710:3057.4311.375.1
17 July 20171266.005.981.220 July 20171157.4011.404.2
17 July 20171365.875.90120 July 201711:3057.3311.424.7
17 July 20171465.735.721.920 July 20171257.2011.484.7
17 July 20171665.435.60120 July 201712:3057.0311.554.4
18 July 20171062.584.031.320 July 20171356.9811.653.2
18 July 20171162.434.021.220 July 201713:3056.9211.723.1
18 July 20171262.234.022.820 July 20171456.8011.772.4
18 July 20171362.024.032.420 July 201714:3056.7711.821.1
18 July 20171461.625.13120 July 20171556.7011.870.9
18 July 20171661.624.030.521 July 20171054.7714.872
19 July 20179:3058.684.57321 July 20171154.7515.081.9
19 July 20171058.604.723.321 July 20171254.7515.470.9
19 July 20171158.484.92421 July 20171354.7515.651
19 July 201711:3058.435.034.321 July 20171454.7715.951
19 July 20171258.355.284.821 July 20171654.7516.370.5
19 July 201712:3058.325.234.321 July 20171754.7516.950.1
19 July 20171358.255.374.1

References

  1. Bilbao, J.; De Migue, A. Erythemal Solar Irradiance, UVER, and UV Index from Ground-Based Data in Central Spain. Appl. Sci. 2020, 10, 6589. [Google Scholar] [CrossRef]
  2. Fountoulakis, I.; Diémoz, H.; Siani, A.-M.; Laschewski, G.; Filippa, G.; Arola, A.; Bais, A.F.; De Backer, H.; Lakkala, K.; Webb, A.R.; et al. Solar UV Irradiance in a Changing Climate: Trends in Europe and the Significance of Spectral Monitoring in Italy. Environments 2019, 7, 1. [Google Scholar] [CrossRef] [Green Version]
  3. Armstrong, B.K.; Kricker, A. The epidemiology of UV induced skin cancer. J. Photochem. Photobiol. B Biol. 2001, 63, 8–18. [Google Scholar] [CrossRef]
  4. Lityńska, Z.; Schmalwieser, A.W.; Bais, A.; Ettler, K.L.; Gröbner, J.; Köpke, P.; Krzyścin, J.; den Outer, P.; Verdebout, J.; Zipoli, G.; et al. UV Radiation and Life; Publications Office of the European Union: Luxembourg, 2012. [Google Scholar]
  5. Calbó, J.; Pagès, D.; González, J.-A. Empirical studies of cloud effects on UV radiation: A review. Rev. Geophys. 2005, 43, RG2002. [Google Scholar] [CrossRef] [Green Version]
  6. Young, A.R. Acute effects of UVR on human eyes and skin. Prog. Biophys. Mol. Biol. 2006, 92, 80–85. [Google Scholar] [CrossRef]
  7. Holick, M.F.; Chen, T.C. Vitamin D deficiency: A worldwide problem with health consequences. Am. J. Clin. Nutr. 2008, 87, 1080S–1086S. [Google Scholar] [CrossRef] [Green Version]
  8. Moukayed, M.; Grant, W.B. The roles of UVB and vitamin D in reducing risk of cancer incidence and mortality: A review of the epidemiology, clinical trials, and mechanisms. Rev. Endocr. Metab. Disord. 2017, 18, 167–182. [Google Scholar] [CrossRef]
  9. Baggerly, C.A.; Cuomo, R.E.; French, C.B.; Garland, C.F.; Gorham, E.D.; Grant, W.B.; Heaney, R.P.; Holick, M.F.; Hollis, B.W.; McDonnell, S.L.; et al. Sunlight and Vitamin D: Necessary for Public Health. J. Am. Coll. Nutr. 2015, 34, 359–365. [Google Scholar] [CrossRef] [Green Version]
  10. McKenzie, R.L.; Liley, J.B.; Björn, L.O. UV Radiation: Balancing Risks and Benefits. Photochem. Photobiol. 2009, 85, 88–98. [Google Scholar] [CrossRef]
  11. Liu, D.; Fernandez, B.O.; Hamilton, A.; Lang, N.N.; Gallagher, J.M.; Newby, D.E.; Feelisch, M.; Weller, R.B. UVA irradiation of human skin vasodilates arterial vasculature and lowers blood pressure independently of nitric oxide synthase. J. Investig. Dermatol. 2014, 134, 1839–1846. [Google Scholar] [CrossRef] [Green Version]
  12. Alfredsson, L.; Armstrong, B.K.; Butterfield, D.A.; Chowdhury, R.; De Gruijl, F.R.; Feelisch, M.; Garland, C.F.; Hart, P.H.; Hoel, D.G.; Jacobsen, R.; et al. Insufficient Sun Exposure Has Become a Real Public Health Problem. Int. J. Environ. Res. Public Health 2020, 17, 5014. [Google Scholar] [CrossRef] [PubMed]
  13. Hernández, J.L.; Nan, D.; Fernandez-Ayala, M.; García-Unzueta, M.; A Hernández-Hernández, M.; López-Hoyos, M.; Muñoz-Cacho, P.; Olmos, J.M.; Gutiérrez-Cuadra, M.; Ruiz-Cubillán, J.J.; et al. Vitamin D Status in Hospitalized Patients with SARS-CoV-2 Infection. J. Clin. Endocrinol. Metab. 2021, 106, e1343–e1353. [Google Scholar] [CrossRef] [PubMed]
  14. Meltzer, D.O.; Best, T.J.; Zhang, H.; Vokes, T.; Arora, V.; Solway, J. Association of Vitamin D Status and Other Clinical Characteristics with COVID-19 Test Results. JAMA Netw. Open 2020, 3, e2019722. [Google Scholar] [CrossRef]
  15. Kaufman, H.W.; Niles, J.K.; Kroll, M.H.; Bi, C.; Holick, M.F. SARS-CoV-2 positivity rates associated with circulating 25-hydroxyvitamin D levels. PLoS ONE 2020, 15, e0239252. [Google Scholar] [CrossRef] [PubMed]
  16. Feister, U.; Meyer, G.; Kirst, U. Solar UV Exposure of Seafarers along Subtropical and Tropical Shipping Routes. Photochem. Photobiol. 2013, 89, 1497–1506. [Google Scholar] [CrossRef] [PubMed]
  17. Modenese, A.; Ruggieri, F.P.; Bisegna, F.; Borra, M.; Burattini, C.; Della Vecchia, E.; Grandi, C.; Grasso, A.; Gugliermetti, L.; Manini, M.; et al. Occupational Exposure to Solar UV Radiation of a Group of Fishermen Working in the Italian North Adriatic Sea. Int. J. Environ. Res. Public Health 2019, 16, 3001. [Google Scholar] [CrossRef] [Green Version]
  18. Vanicek, K.; Frei, T.; Litynska, Z.; Schmalwieser, A. UV-Index for the Public: A Guide for Publication and Interpretation of Solar UV Index Forecasts for the Public, Prepared by the Working Group 4 of the COST-713 Action “UVB forecasting” Report; European Union: Brussels, Belgium, 2000; 26p. [Google Scholar]
  19. Schmalwieser, A.W.; Gröbner, J.; Blumthaler, M.; Klotz, B.; De Backer, H.; Bolsée, D.; Werner, R.; Tomsic, D.; Metelka, L.; Eriksen, P.; et al. UV Index monitoring in Europe. Photochem. Photobiol. Sci. 2017, 16, 1349–1370. [Google Scholar] [CrossRef] [Green Version]
  20. Lehmann, M.; Pfahlberg, A.B.; Sandmann, H.; Uter, W.; Gefeller, O. Public Health Messages Associated with Low UV Index Values Need Reconsideration. Int. J. Environ. Res. Public Health 2019, 16, 2067. [Google Scholar] [CrossRef] [Green Version]
  21. Rusińska, A.; Pludowski, P.; Walczak, M.; Borszewska-Kornacka, M.K.; Bossowski, A.; Chlebna-Sokół, D.; Czech-Kowalska, J.; Dobrzanska, A.; Franek, E.; Helwich, E.; et al. Vitamin D Supplementation Guidelines for General Population and Groups at Risk of Vitamin D Deficiency in Poland—Recommendations of the Polish Society of Pediatric Endocrinology and Diabetes and the Expert Panel with Participation of National Specialist Consultants and Representatives of Scientific Societies—2018 Update. Front. Endocrinol. 2018, 9, 246. [Google Scholar] [CrossRef]
  22. Kimball, S.M.; Holick, M.F. Official recommendations for vitamin D through the life stages in developed countries. Eur. J. Clin. Nutr. 2020, 74, 1514–1518. [Google Scholar] [CrossRef]
  23. Holick, M.F.; Binkley, N.C.; Bischoff-Ferrari, H.A.; Gordon, C.M.; Hanley, D.A.; Heaney, R.P.; Murad, M.H.; Weaver, C.M. Evaluation, Treatment, and Prevention of Vitamin D Deficiency: An Endocrine Society Clinical Practice Guideline. J. Clin. Endocrinol. Metab. 2011, 96, 1911–1930. [Google Scholar] [CrossRef] [Green Version]
  24. Veugelers, P.J.; Pham, T.-M.; Ekwaru, J.P. Optimal Vitamin D Supplementation Doses that Minimize the Risk for Both Low and High Serum 25-Hydroxyvitamin D Concentrations in the General Population. Nutrients 2015, 7, 10189–10208. [Google Scholar] [CrossRef] [Green Version]
  25. Corrêa, M.D.P.; Godin-Beekmann, S.; Haeffelin, M.; Brogniez, C.; Verschaeve, F.; Saiag, P.; Pazmiño, A.; Mahé, E. Comparison between UV index measurements performed by research-grade and consumer-products instruments. Photochem. Photobiol. Sci. 2010, 9, 459–463. [Google Scholar] [CrossRef]
  26. Guzikowski, J.; Czerwińska, A.E.; Krzyścin, J.W.; Czerwiński, M.A. Controlling sunbathing safety during the summer holidays—The solar UV campaign at Baltic Sea coast in 2015. J. Photochem. Photobiol. B Biol. 2017, 173, 271–281. [Google Scholar] [CrossRef] [PubMed]
  27. Czerwińska, A.; Krzyścin, J. Numerical estimations of the daily amount of skin-synthesized vitamin D by pre-school children in Poland. J. Photochem. Photobiol. B Biol. 2020, 208, 111898. [Google Scholar] [CrossRef] [PubMed]
  28. McKinlay, A.F.; Diffey, B.L. A Reference spectrum for Ultraviolet Induced Erythema in Human Skin. CIE J. 1987, 6, 17–22. [Google Scholar]
  29. Krzyścin, J.W.; Narbutt, J.; Lesiak, A.; Jarosławski, J.; Sobolewski, P.; Rajewska-Więch, B.; Szkop, A.; Wink, J.; Czerwińska, A. Perspectives of the antipsoriatic heliotherapy in Poland. J. Photochem. Photobiol. B Biol. 2014, 140, 111–119. [Google Scholar] [CrossRef]
  30. Allaart, M.; Van Weele, M.; Fortuin, P.; Kelder, H. An empirical model to predict the UV-index based on solar zenith angles and total ozone. Meteorol. Appl. 1999, 11, 59–65. [Google Scholar] [CrossRef] [Green Version]
  31. Guzikowski, J.; Krzyścin, J.; Czerwińska, A.; Raszewska, W. Adequate vitamin D3 skin synthesis versus erythema risk in the Northern Hemisphere midlatitudes. J. Photochem. Photobiol. B Biol. 2018, 179, 54–65. [Google Scholar] [CrossRef]
  32. CIE (Commision Internationalle de L’Eclairage). Technical Report: Action Spectrum for the Production of Previtamin D3 in Human Skin. CIE J. 2006, 174, 1–12. [Google Scholar]
  33. Sallander, E.; Wester, U.; Bengtsson, E.; Edström, D.W. Vitamin D levels after UVB radiation: Effects by UVA additions in a randomized controlled trial. Photodermatol. Photoimmunol. Photomed. 2013, 29, 323–329. [Google Scholar] [CrossRef]
  34. Fitzpatrick, T.B. The Validity and Practicality of Sun-Reactive Skin Types I through VI. Arch. Dermatol. 1988, 124, 869–871. [Google Scholar] [CrossRef]
  35. Vernez, D.; Milon, A.; Vuilleumier, L.; Bulliard, J.-L.; Koechlin, A.; Boniol, M.; Doré, J.F. A general model to predict individual exposure to solar UV by using ambient irradiance data. J. Expo. Sci. Environ. Epidemiol. 2015, 25, 113–118. [Google Scholar] [CrossRef]
  36. Schmalwieser, A.W. Possibilities to estimate the personal UV radiation exposure from ambient UV radiation measurements. Photochem. Photobiol. Sci. 2020, 19, 1249–1261. [Google Scholar] [CrossRef]
  37. Czerwińska, A.; Krzyścin, J. Analysis of Measurements and Modelling of the Biologically Active UV Solar Radiation for Selected Sites in Poland—Assessment of Photo-Medical Effects; Publications of the Institute of Geophysics, Polish Academy of Sciences: Warsaw, Poland, 2020; Volume 428, 111p. [Google Scholar] [CrossRef]
  38. Mosteller, R.D. Simplified Calculation of Body-Surface Area. N. Engl. J. Med. 1987, 317, 1098. [Google Scholar] [CrossRef]
  39. MacLaughlin, J.A.; Holick, M.F. Aging decreases the capacity of human skin to produce vitamin D3. J. Clin. Investig. 1985, 76, 1536–1538. [Google Scholar] [CrossRef] [PubMed] [Green Version]
  40. Lucas, R.M.; Neale, R.E.; Madronich, S.; McKenzie, R.L. Are current guidelines for sun protection optimal for health? Exploring the evidence. Photochem. Photobiol. Sci. 2018, 17, 1956–1963. [Google Scholar] [CrossRef] [PubMed] [Green Version]
  41. Huotari, A.; Herzig, K.-H. Vitamin D and living in northern latitudes—An endemic risk area for vitamin D deficiency. Int. J. Circumpolar Health 2008, 67, 164–178. [Google Scholar] [CrossRef] [PubMed]
  42. Engelsen, O. The Relationship between Ultraviolet Radiation Exposure and Vitamin D Status. Nutrients 2010, 2, 482–495. [Google Scholar] [CrossRef] [Green Version]
  43. Kozlov, A.I.; Vershubsky, G.G. Systematic Review on 25-HydroxyvitaminD Levels in Various Populations of the Russian North. Hum. Physiol. 2019, 45, 565–575. [Google Scholar] [CrossRef]
  44. Ovesen, L.; Andersen, R.; Jakobsen, J. Geographical differences in vitamin D status, with particular reference to European countries. Proc. Nutr. Soc. 2003, 62, 813–821. [Google Scholar] [CrossRef] [Green Version]
  45. Ramnemark, A.; Norberg, M.; Pettersson-Kymmer, U.; Eliasson, M. Adequate vitamin D levels in a Swedish population living above latitude 63° N: The 2009 Northern Sweden MONICA study. Int. J. Circumpolar Health 2015, 74, 27963. [Google Scholar] [CrossRef] [PubMed] [Green Version]
  46. Andersen, S.; Laurberg, P.; Hvingel, B.; Kleinschmidt, K.; Heickendorff, L.; Mosekilde, L. Vitamin D status in Greenland is influenced by diet and ethnicity: A population-based survey in an Arctic society in transition. Br. J. Nutr. 2012, 109, 928–935. [Google Scholar] [CrossRef] [PubMed] [Green Version]
  47. Nielsen, N.O.; Jørgensen, M.E.; Friis, H.; Melbye, M.; Soborg, B.; Jeppesen, C.; Lundqvist, M.; Cohen, A.; Hougaard, D.M.; Bjerregaard, P. Decrease in Vitamin D Status in the Greenlandic Adult Population from 1987–2010. PLoS ONE 2014, 9, e112949. [Google Scholar] [CrossRef] [Green Version]
  48. Spiro, A.; Buttriss, J.L. Vitamin D: An overview of vitamin D status and intake in Europe. Nutr. Bull. 2014, 39, 322–350. [Google Scholar] [CrossRef] [Green Version]
  49. Brader, L.; Rejnmark, L.; Carlberg, C.; Schwab, U.; Kolehmainen, M.; Rosqvist, F.; Cloetens, L.; Landin-Olsson, M.; Gunnarsdottir, I.; Poutanen, K.S.; et al. Effects of a healthy Nordic diet on plasma 25-hydroxyvitamin D concentration in subjects with metabolic syndrome: A randomized, placebo-controlled trial (SYSDIET). Eur. J. Nutr. 2014, 53, 1123–1134. [Google Scholar] [CrossRef]
  50. Crowe, F.L.; Steur, M.; E Allen, N.; Appleby, P.N.; Travis, R.C.; Key, T.J. Plasma concentrations of 25-hydroxyvitamin D in meat eaters, fish eaters, vegetarians and vegans: Results from the EPIC–Oxford study. Public Health Nutr. 2011, 14, 340–346. [Google Scholar] [CrossRef] [PubMed] [Green Version]
  51. Jarosz-Krzemińska, E.; Mikołajczyk, N.; Adamiec, E. Content of toxic metals and as in marine and freshwater fish species available for sale in EU supermarkets and health risk associated with its consumption. J. Sci. Food Agric. 2021, 101, 2818–2827. [Google Scholar] [CrossRef]
  52. Holick, M.F. The Vitamin D Epidemic and its Health Consequences. J. Nutr. 2005, 135, 2739S–2748S. [Google Scholar] [CrossRef] [PubMed]
  53. Webb, A.R.; Kazantzidis, A.; Kift, R.C.; Farrar, M.D.; Wilkinson, J.; Rhodes, L.E. Colour Counts: Sunlight and Skin Type as Drivers of Vitamin D Deficiency at UK Latitudes. Nutrients 2018, 10, 457. [Google Scholar] [CrossRef] [Green Version]
  54. Kift, R.; Berry, J.L.; Vail, A.; Durkin, M.T.; Rhodes, L.E.; Webb, A.R. Lifestyle factors including less cutaneous sun exposure contribute to starkly lower vitamin D levels in U.K. South Asians compared with the white population. Br. J. Dermatol. 2013, 169, 1272–1278. [Google Scholar] [CrossRef] [PubMed]
  55. Young, A.R.; Morgan, K.A.; Ho, T.-W.; Ojimba, N.; Harrison, G.I.; Lawrence, K.P.; Jakharia-Shah, N.; Wulf, H.C.; Cruickshank, J.K.; Philipsen, P.A. Melanin has a Small Inhibitory Effect on Cutaneous Vitamin D Synthesis: A Comparison of Extreme Phenotypes. J. Investig. Dermatol. 2020, 140, 1418–1426.e1. [Google Scholar] [CrossRef] [PubMed]
Figure 1. Cruise logs of the MS Horyzont II during the Gdynia-Spitsbergen cruise (and back) in the period 2–21 July 2017 (days 183–202). Points (blue—cruise to Spitsbergen, green—cruise to Gdynia) show sites with the UV index (UVI) measurements. The disembarking ports are marked by red map pointers. The map was created with Google Maps software.
Atmosphere 12 00474 g001
Figure 2. The modelled clear-sky UVI (dashed line) and the daily range of the measured UVI during the cruise (the shaded area).
Atmosphere 12 00474 g002
Figure 3. The deck temperature and the area of uncovered skin estimated from Equation (3) on the assumption of zero wind chill factor.
Atmosphere 12 00474 g003
Figure 4. Daily duration of solar exposure for the entire cruise resulting in the ambient (or on vertical plane) erythemal dose of 1 MED2 (a), the personal vitamin D3 dose equivalent to 1000 IU (or 2000 IU) vitamin D3 taken orally (b). The exposure started with the moment of the first UVI measurements. Arrows for the 195 and 196 day of the year means the duration is longer than 7 h.
Atmosphere 12 00474 g004
Publisher’s Note: MDPI stays neutral with regard to jurisdictional claims in published maps and institutional affiliations.

