Article

Impact on Ultrafine Particles Concentration and Turbulent Fluxes of SARS-CoV-2 Lockdown in a Suburban Area in Italy

National Research Council of Italy, Institute of Atmospheric Sciences and Climate (CNR-ISAC), 73100 Lecce, Italy
*
Author to whom correspondence should be addressed.
Atmosphere 2021, 12(3), 407; https://doi.org/10.3390/atmos12030407
Submission received: 25 February 2021 / Revised: 18 March 2021 / Accepted: 19 March 2021 / Published: 21 March 2021
(This article belongs to the Section Aerosols)

Abstract

:
In order to slow the spread of SARS-CoV-2, governments have implemented several restrictive measures (lockdown, stay-in-place, and quarantine policies). These provisions have drastically changed the routines of residents, altering environmental conditions in the affected areas. In this context, our work analyzes the effects of the reduced emissions during the COVID-19 period on the ultrafine particles number concentration and their turbulent fluxes in a suburban area. COVID-19 restrictions did not significantly reduce anthropogenic related PM10 and PM2.5 levels, with an equal decrement of about 14%. The ultrafine particle number concentration during the lockdown period decreased by 64% in our measurement area, essentially due to the lower traffic activity. The effect of the restriction measures and the reduction of vehicles traffic was predominant in reducing concentration rather than meteorological forcing. During the lockdown in 2020, a decrease of 61% in ultrafine particle positive fluxes can be observed. At the same time, negative fluxes decreased by 59% and our observation site behaved, essentially, as a sink of ultrafine particles. Due to this behavior, we can conclude that the principal particle sources during the lockdown were far away from the measurement site.

Graphical Abstract

1. Introduction

SARS-CoV-2 is one of the deadliest viruses in the last century, which spread during a pandemic of COVID-19 [1]. The virus outbreak started in Wuhan, China [2] in the month of December 2019. China reported this new pathogen to the World Health Organization (WHO) on 31 December, and three months later the organization declared it a pandemic. To help slow the spread of SARS-CoV-2, governments have implemented several restrictive measures (lockdown and quarantine policies). These provisions have drastically changed the routines of residents, altering environmental conditions in areas of interest as many commercial activities are closed and many employees are working remotely from their homes. The impact of this virus on the socioeconomic level is causing markets to shake, world stock markets to collapse, all flights to be canceled, and borders to close. In Italy, the first confirmed case of infection was detected on 20 February 2020, in a small town in the north of Italy near Milan. On 21 February, the government adopted the first restrictive measures limiting travel, social, and economic activities. On 4 March, schools and universities were closed throughout the whole country. To contain the rapid spread of the infection, the government enforced the first lockdown measures over a large part of northern Italy on 8 March, restricting home-work mobility. Lockdown was extended to the entire country on 11 March and was maintained until 3 May 2020 (Figure 1).
However, this pandemic also caused air quality to improve in many of the world’s cities, reducing environmental pollution. As expected, also in Italy, after the local government adopted the mandatory measures, there was a significant reduction in transport and industry emissions. Recent research clearly shows that the restrictive measures adopted during March–April 2020 led to a significant reduction (about 64%) in Rome’s personal vehicle usage [3]. In large cities, air quality is influenced essentially by pollutant emissions from vehicular and industrial sources. The main pollutants emitted and monitored in urban regions are nitrogen compounds (NO, NO2), carbon monoxide (CO), ozone (O3), sulfur dioxide (SO2), and particulate matter (PM10, PM2.5) [4]. Adverse health effects related to particulate matter (PM) and nanoparticle exposure mainly concern the respiratory and cardiovascular systems [5], but there is also evidence that PM affects atherosclerosis and leads to adverse birth outcomes [6,7]. According to the World Health Organization (WHO; 2018), about 4 million deaths related to outdoor air pollution occur yearly around the world [8]. Particles enter directly into the respiratory system and are deposited in the lung region causing serious diseases, such as stroke, lung cancer, chronic obstructive pulmonary disease, heart disease, and respiratory infections, such as pneumonia [9,10,11]. This global closure has made it possible to obtain interesting environmental data for analysis and several scientific investigations related to these socio-ecological changes. Thus, these circumstances provide an unprecedented opportunity to assess the impact of anthropogenic activities, in particular road traffic, on air quality changes [12,13]. Several studies focused on the impacts of COVID-19 lockdown on air quality in different regions worldwide. In many works, the effect of the lockdown measures has been analyzed through the reduction in the concentration of PM10 and PM2.5 [14,15,16,17,18], or NO2, O3, and CO [19,20,21,22,23]. Other works specifically studied the effect of the lockdown period on ultrafine particle number concentrations [24,25,26]. However, to our knowledge, no studies deal with the effect of COVID-19 lockdown measures on the exchange (in emission and deposition) fluxes of ultrafine particles (UFPs). In this context, our work analyzes the effects of the reduced emissions during the COVID-19 period on the UFP number concentration and fluxes in a suburban area in Italy. For this study’s purpose, we compared the UFP number concentration and relative deposition and emission fluxes measured during the lockdown, with the corresponding values of the same period recorded in the previous 4 years (2016–2019). The mean values for the previous period were used as a baseline scenario, corresponding to regular traffic mobility conditions. In addition, the impact of lockdown on PM10 and PM2.5 mass concentration was investigated.

2. Materials and Methods

2.1. Site and Instruments

The observational campaign was carried out at the Environmental-Climate Observatory (ECO) of the Institute of Atmospheric Sciences and Climate (ISAC), Italian National Research Council (CNR) from April 2016 to November 2020. The site is located inside the university campus (N 40° 20′ 80′′, E 18° 07′ 28′′), about 3.5 km southwest of the town of Lecce in the southeast of Italy. The Observatory is a regional station of the Global Atmospheric Watch (GAW) network [27,28]. The area is characterized by clumps of trees (5–10 m tall), an open arrangement of buildings 3–6 stories tall, and internal campus roads. It can be considered an urban background site [29]. The measurement site is influenced by the activities (including traffic) inside the university campus and by the diffuse emissions of the town of Lecce and other small villages located nearby. Moreover, the area is sometimes downwind of the largest industrial settlements of the territory: the area of Taranto, about 80 km in the NW direction, and the area of Brindisi, about 30 km in the NNW direction [29].
The equipment was located about 10 m above the roof (20 m above ground level) on a telescopic mast to measure vertical fluxes using the eddy covariance method. An ultrasonic anemometer (Gill R3) was used to measure the three wind velocity components at 100 Hz and sonic temperature. The eddy covariance station included a condensation particle counter (CPC; TSI 3776), measuring the total particle number concentration at a sampling frequency of 10 Hz [30,31,32]. A thermo-hygrometer (Rotronic MP100) was used for the measurement of temperature and relative humidity. Temperature, air pressure, relative humidity, and wind speed and direction were also collected by a Vaisala WXT520 automatic weather station. The CPC inlet was placed at a small distance from the sampling volume of the anemometer (about 17 cm). The air sample was driven into the shelter by a silicon conductive tube 10 m in length (internal diameter 26 mm). A flow rate of 50 L min−1 was applied to the flow splitter for the sampling operation giving a turbulent flow (Reynolds number of about 2803) and minimizing the temporal distortion of concentration fluctuations. A portion of 1.5 L min−1 was aspirated by the CPC through a 0.42 m-long silicon conductive tube (6 mm internal diameter). The system used was able to detect particles of between 3 and 1000 nm in diameter (the upper limit of the CPC). A further detailed description of the instrumental setup for fluxes can be found in [33]. Daily PM10 and PM2.5 measurements were carried out using a dual-channel sampler (SWAM 5a Dual Channel Monitor, FAI Instruments, Italy) operating at the flow rate of 2.3 m3 h−1. Through the β-ray attenuation method, the instrument measures particulate mass concentration, collected on quartz microfiber filters (Whatman Q-grade, diameter 47 mm), with an uncertainty of 0.5–0.6 μg m−3 [34]. Measurements of particle number size distribution were carried out by a mobility particle size spectrometer (MPSS) composed of a Vienna-type differential mobility analyzer (DMA)(electrode length 28 cm) coupled with a condensation particle counter (TSI 3772, British Antarctic Survey, Cambridge, England), located inside the observatory. Each measurement was made in five minutes and covered a particle diameter range of 10 to 800 nm, divided into forty channels [35].

2.2. Methods

The UFP dataset from the CPC is a discontinuous time series from April 2016 to November 2020. A spike detection algorithm (Vickers et al. 1997) was applied on raw high-frequency data for both the sonic anemometer and the CPC, which defines spikes as absolute deviations from the mean of a threshold value, that is 6 times σ (where σ is the variance of 10 min sub-interval). This threshold allows recording of, within 1%, the number of spikes within a 30-min-averaging period. The measured time series were treated with a three-dimensional rotation in the local streamlines reference system to remove errors due to wind sensor misalignment [36,37]. The turbulent particle fluxes from UFP data, F N = w N ¯ , were calculated as the covariance between the fluctuations of the scalar particle number concentration ( N ) and fluctuations (w′) of the vertical wind velocity (w), using the eddy covariance method [38] over 30-min-averaging periods. The average and fluctuating parts were extracted by performing a linear detrending to reduce the effects of slow changes in atmospheric parameters (i.e., the daily meteorological cycle) on the calculated vertical turbulent fluxes [39,40]. A data selection was performed taking in consideration wind calm periods (u * < 0.1 m s−1) [41]. A percentage of about 14% was discarded. Time lag, due to the transport of air samples from the sonic anemometer position to the CPC by the sampling line, was determined with a mean value of 5 s. Finally, a stationarity test was performed for the particle concentration data series, after the detrending process, as described in [42], choosing a threshold for the non-stationarity index of 2, which gave good results in other similar works [43]. The percentage of non-stationary data was 14.5%. Non-stationary cases were removed from the following analysis. The high frequency under sampling generates an error on FN that needs to be corrected. The correction used was based on the approach developed by [44]. The average correction for the high-frequency losses was about 6%. The uncertainty on FN due to the random statistical counting errors in the CPC was estimated according to [45], and it was 0.2%. A detailed description of all methods and corrections utilized in the eddy covariance measurements can be found in [33]. The source areas for both scalar concentrations and fluxes have been evaluated using a “scalar passive tracer” model [46]. As established in [33], the mean footprint of our site, considering the average atmospheric conditions, is about 1 km for fluxes and 2 km for concentration.

3. Results

The main aim of this work is to establish whether the lockdown period, with the essential switching-off of a series of anthropogenic sources, had an impact on UFP number concentration and its exchange fluxes on our site. In order to obtain strong evidence of air quality changes during the 2020 lockdown period at our site, environmental data have been compared against the pre- and post-lockdown periods in the first attempt. Thus, environmental data have been compared against a mirrored period occurring during the previous 4 years (from 2016–2019), as is done in many other works [47,48,49]. Data analysis focused on an extended period from January 1 to July 31, 2020, dividing it further into the following phases: (a) from January 1 to March 10—pre-lockdown phase; (b) from March 11 to May 3—lockdown phase; (c) from May 4 to July 31—post-lockdown period. To investigate the statistical significance of the differences in concentration values among the two measurement periods, the PM concentration time series of the two different groups were compared using the Mann–Whitney–Wilcoxon (MWW) rank-sum test [50].

3.1. PM Concentration

The typical yearly average mass concentrations at the site are 24.0 μg m−3 (±0.4 μg m−3 standard error) for PM10 and 15.0 μg m−3 (±0.2 μg m−3) for PM2.5, taking into consideration only the 2016–2019 years. Average mass concentration has been calculated only on this last dataset in order to avoid a bias in the mean values introduced by the lockdown period and the general decrease in human activities during 2020. The typical yearly average ratio PM2.5/PM10 is 0.6 (±0.1). Overall, PM10 and PM2.5 concentration show a decreasing trend in the last years (from 2016 to 2020) in our measurement site, with a general decrease of 20% and 42% for PM10 and PM2.5, respectively. On the other hand, there is no clear reduction trend throughout the period regarding PM10 and PM2.5 concentration, as can be observed in Figure 2a,c. However, considering a comparison between the lockdown period and the mirror period in 2016–2019 for PM concentrations, a decrease has been observed. In particular, a reduction of 14% (with a mean anomaly of −1.27 μg m−3) in PM10, from a mean value of 25 (±2 μg m−3) to 22 (±2 μg m−3) during the 2020 lockdown. The p-value being slightly greater than 0.05 (p = 0.06) for reductions in concentration levels shows that the COVID-19 restriction did not significantly reduce anthropogenic-related PM10 levels. PM2.5 mass concentration changed from 13.6 (±0.5 μg m−3) to 11.7 (±0.8 μg m−3), with a percentage reduction of 14%. (with a mean anomaly of −1.89 μg m−3). In this case, p = 0.10, so the median difference is not statistically significant at a 5% probability level.
According to the reduction of the concentrations, the ratio of PM2.5/PM10 does not show a significant change, remaining constant (0.54). The small reductions in PM10 and PM2.5 mass concentrations are not as significant as observed for the UFP number concentration, as we will explain in the following. However, a Saharan dust transport event has been observed during the lockdown phase in 2020, starting on March 28 and ending on March 31, with a maximum concentration in PM10 of 80 (±2 μg m−3). In order to avoid introducing a bias in the calculation of the decrease, the Saharan dust event has been eliminated from the analysis of the reduction in mass concentration of PM10 and PM2.5. In this case, a decrease of about 11% for PM10 and 12% for PM2.5 can be observed. In the pre-lockdown period, a slight decrease in mass concentration can be observed both for PM10 and PM2.5, with a reduction of 20% and 41%, respectively. On the other hand, during the post-lockdown, a larger reduction can be noted: PM10 exhibited a 28% decrease (with a mean anomaly of −5.94 μg m−3) while PM2.5 decreased by 42% (with a mean anomaly of −5.09 μg m−3). This decrease is probably due to the general restriction in societal activities in the extension of safe pandemic measures (such as working from home, mobility restriction, curfew). A similar reduction in PM2.5 mass concentration has been observed also in Dubai and Mumbai, with a reduction of 11% and 14%, respectively [14]. However, great effects of lockdown measures have been observed for PM2.5 (50% less) in the city of Beijing [14]. PM2.5 decreased by 12% in São Paulo, 37% in Los Angeles, 24% in New York, and 28% in Paris [21]. PM10 and PM2.5 concentrations reduced by about half in comparison to the pre-lockdown [15] in New Delhi. PM2.5 concentration reduced by 21% to the average of the same days in 2018–2019 in Almaty, Kazakhstan [13]. It is worth considering that our observations are representative of a suburban area of a medium-sized Mediterranean city, while many of the aforementioned cities exceed 10 million inhabitants.

3.2. UFP Concentration

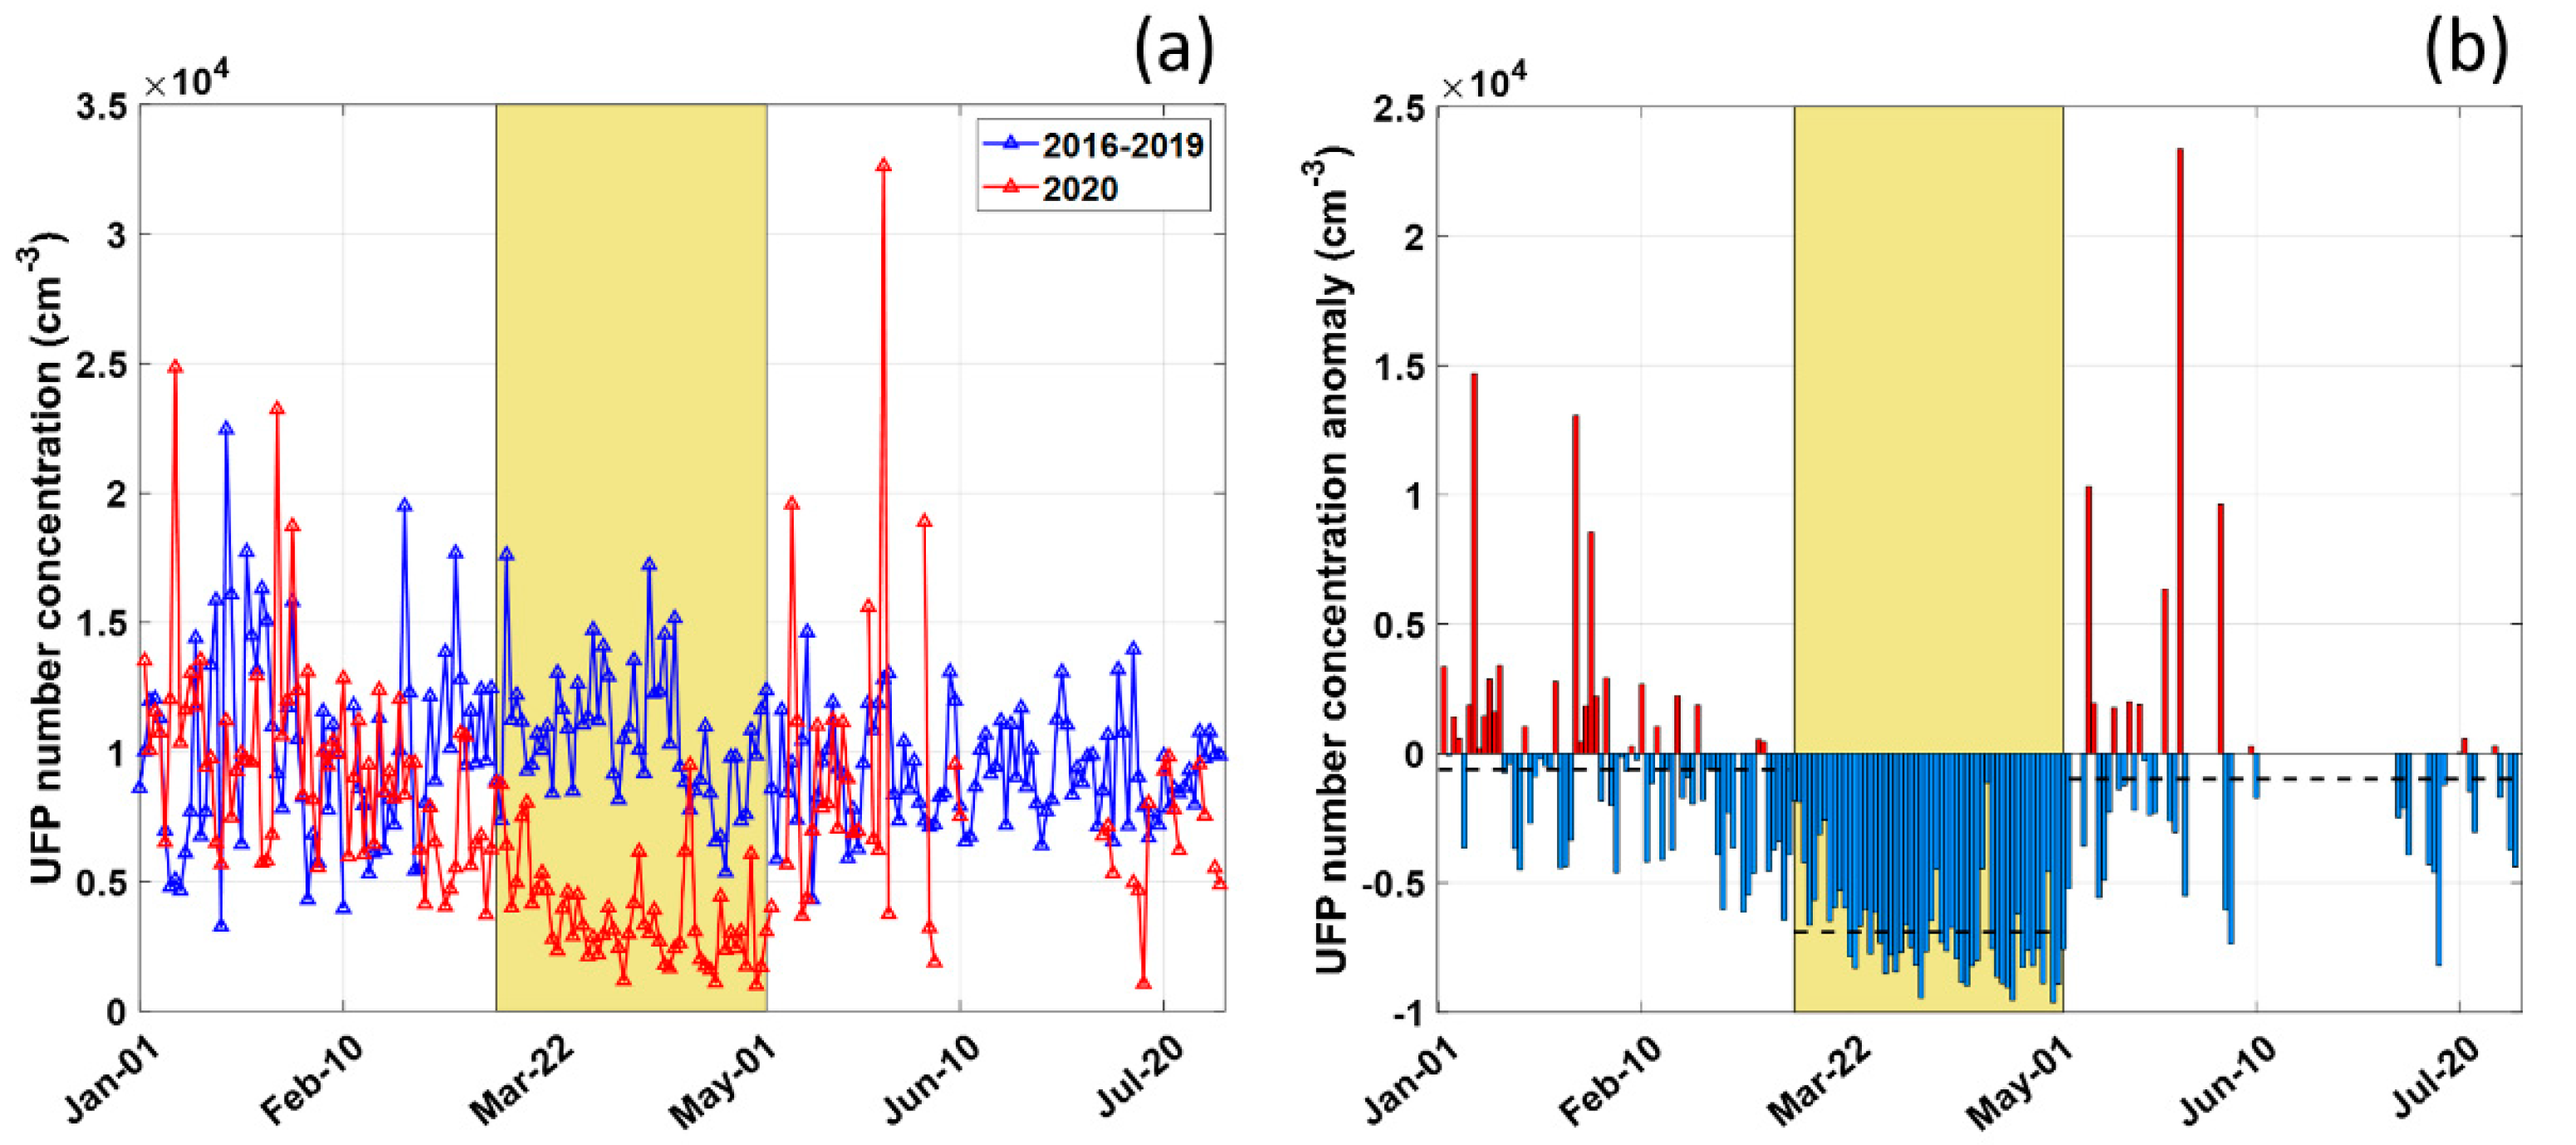
On average, in this measurement site, an average UFP number concentration of 9606 (±4027 standard deviation) cm−3 was observed at this measurement site, also taking into consideration the period from 2016 to 2019 for PM10 and PM2.5 analyses. The average UFP concentration observed for the year 2020 is 6551 (±3880) cm−3 with a reduction of about 32% on average per year, essentially due to the pandemic restrictions. Particle number concentration during the lockdown period was 3726 (±2044) cm−3, against a mean value in the previous mirror period (from March 11 to May 3 within 2016–2019) of 10538 (±4357) cm−3 with a percentage decrease of 64% in our measurement area (Figure 3a). As can be observed in Figure 3b, a negative anomaly is present during the 2020 lockdown phase. Specifically, a mean anomaly of −6902 cm−3 was observed in this phase. This difference was calculated with respect to the mean value in that phase of the same days in 2016–2019.
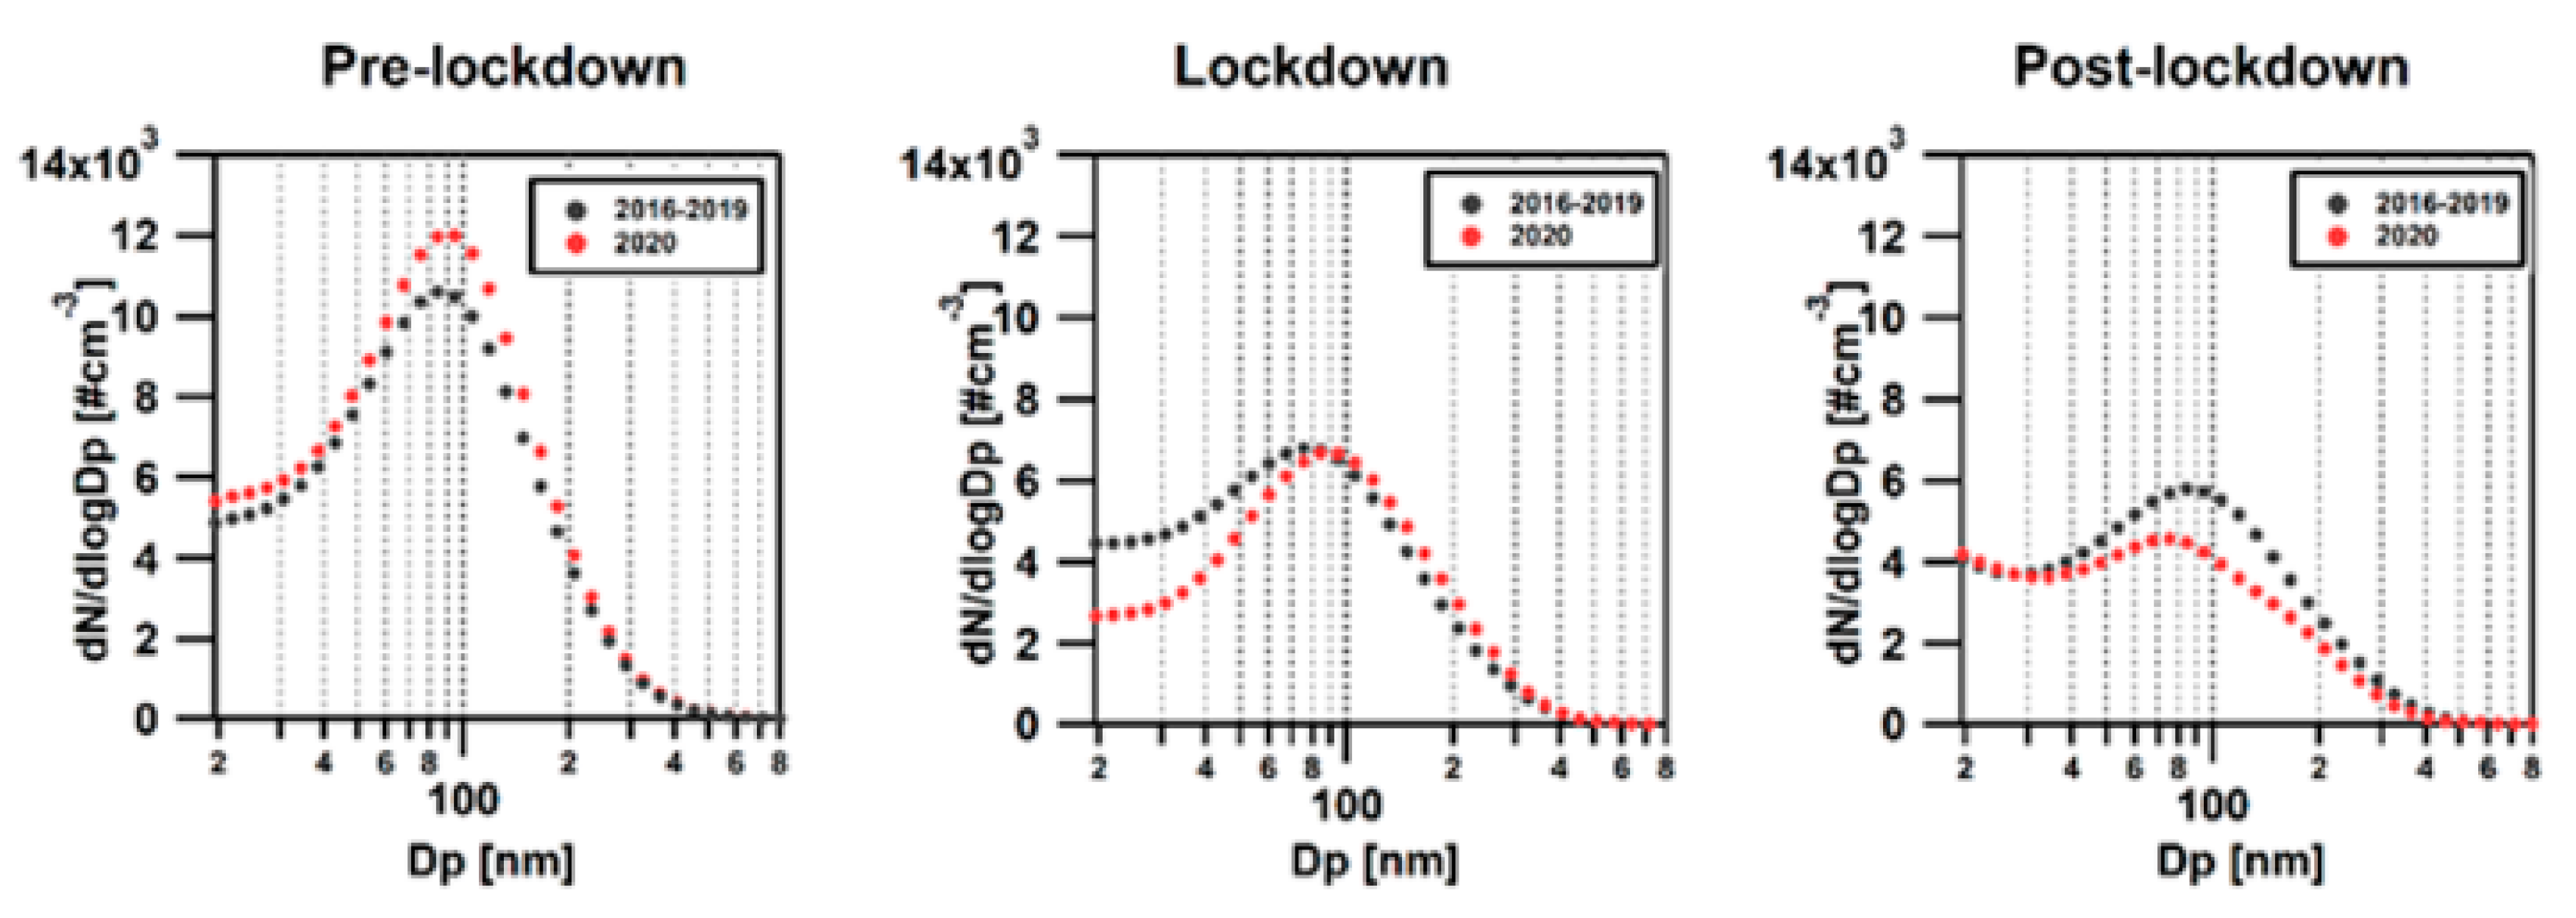
Results of testing for UFPs indicate that during the lockdown, at a 5% probability level (p < 0.05), the observed median concentrations are statistically different for the two groups. As at our site, also in Somerville (MA, USA), a contraction between 45% and 69% in the median particle number concentration has been observed [24]. In Tianjin, China, particle number concentration of traffic nucleation and traffic emissions decreased by 41% [25]. The same analysis has been performed for periods pre- and post-lockdown, in order to assess concentration differences. A mean anomaly of −614 cm−3 for pre-lockdown and −984 cm−3 for post-lockdown was calculated. This behavior was also confirmed by the comparison between particle number size distributions. As shown in Figure 4, the shape of curves is very similar in each phase, with number concentrations governed by the Aitken particles mode (less than 100 nm in diameter). Each curve has a maximum median diameter of around 80 nm but exhibits different concentrations. During the lockdown, in the size distribution range between 20–70 nm, the particle number size distributions showed a reduction that is on average 30% lower compared to the same days in 2016–2019, which is probably correlated to lower traffic activity during this phase. Additionally, during the post-lockdown period, there was a reduction of 23% on average, but only concerning the interval between 40–200 nm.
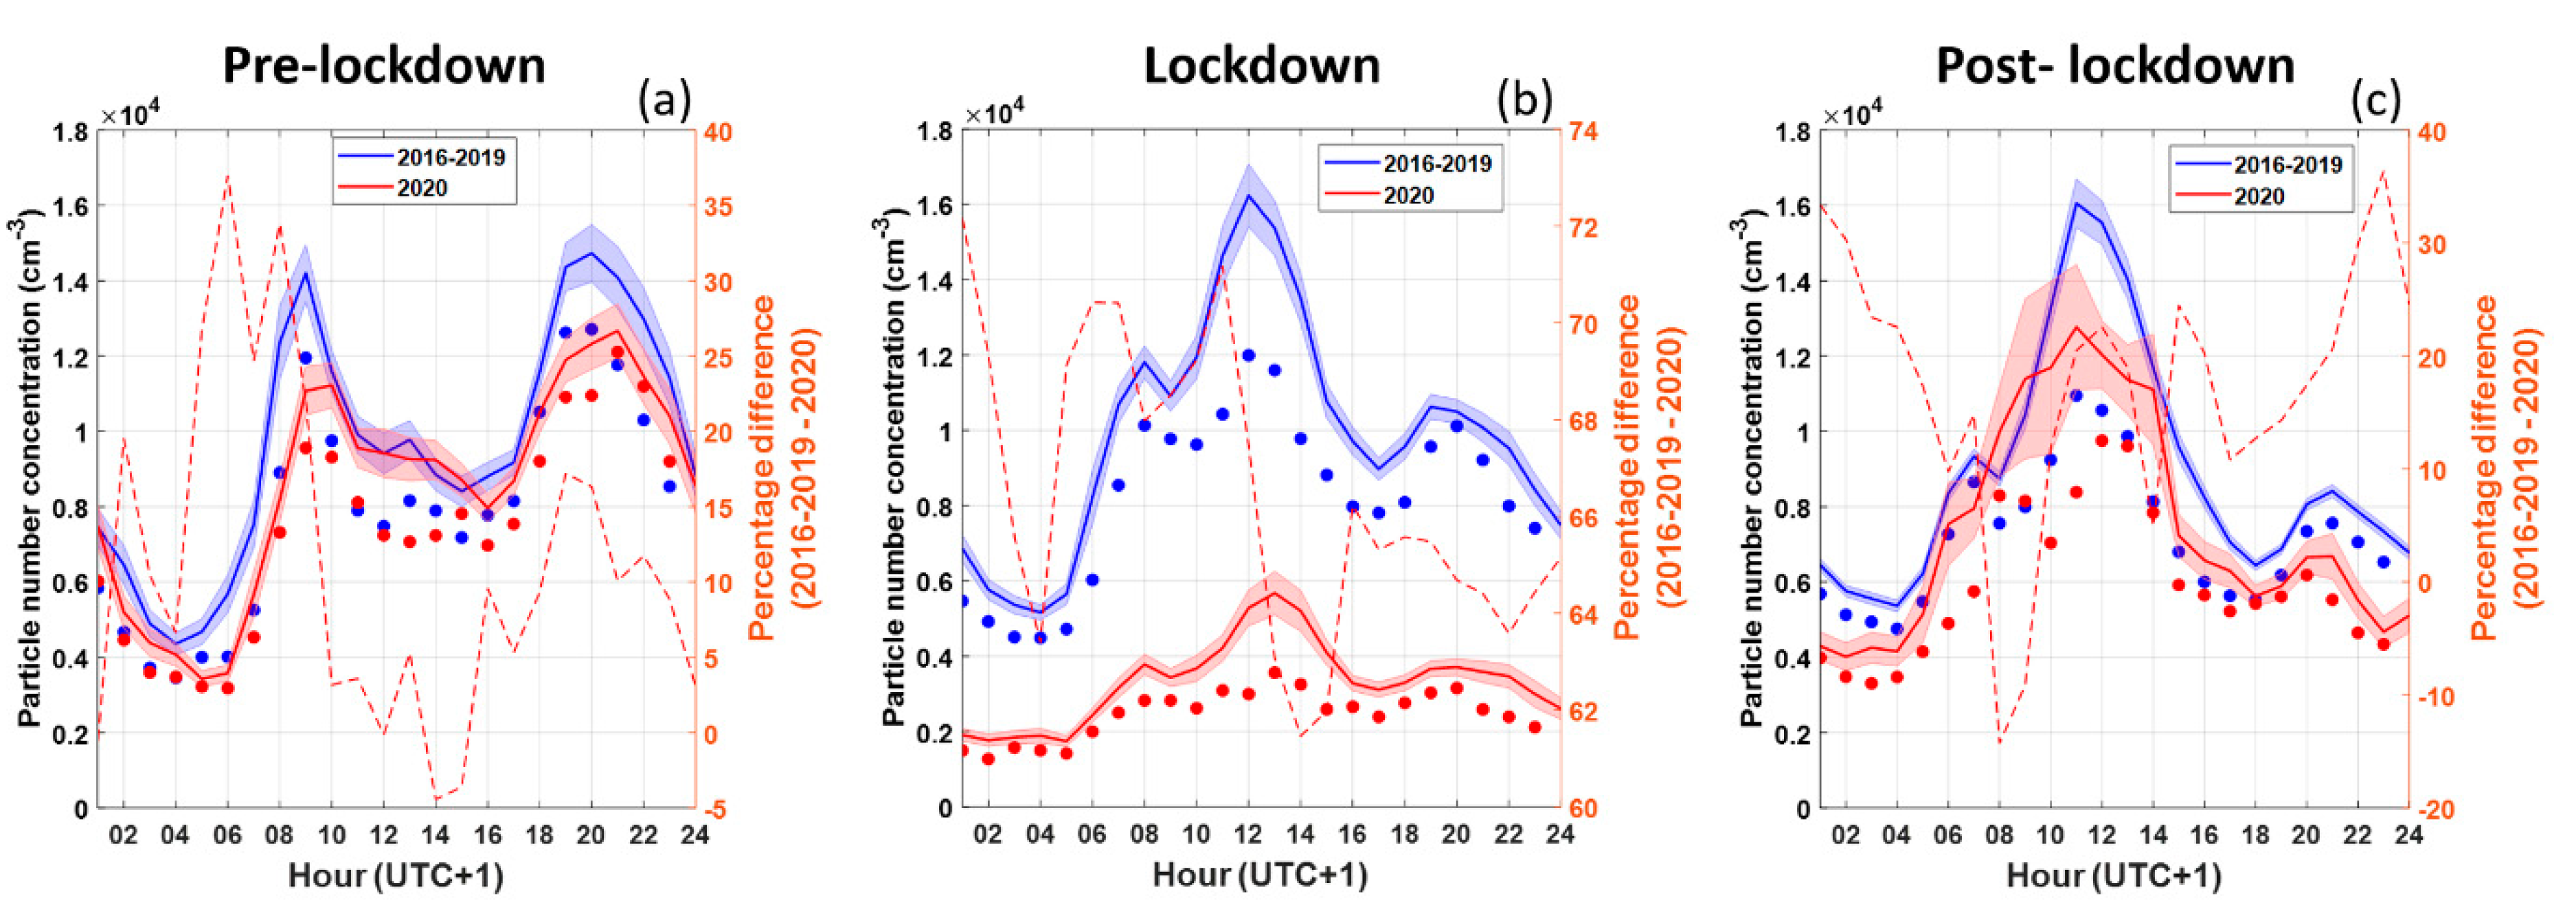
In order to concurrently outline the differences between UFP number concentration during the pre-lockdown, lockdown, and post-lockdown phases and also a further difference with the previous mirror period in the period from 2016 to 2019, a diurnal cycle has been calculated for each of these periods (Figure 5). The diurnal cycle is very similar for the pre-lockdown period with respect to the previous period (Figure 5a), with differences of about 12%, whereas, for the post-lockdown phase, the contraction is about 10%. The general pattern of the diurnal cycle during the lockdown does not change with respect to the previous period, although it is completely flattened by the reduced human activities in the area observed. For the pre- and post-lockdown periods, the diurnal pattern is strictly similar, evidencing the road traffic activity in the morning (8:00) and evening (20:00) with its rush hours.
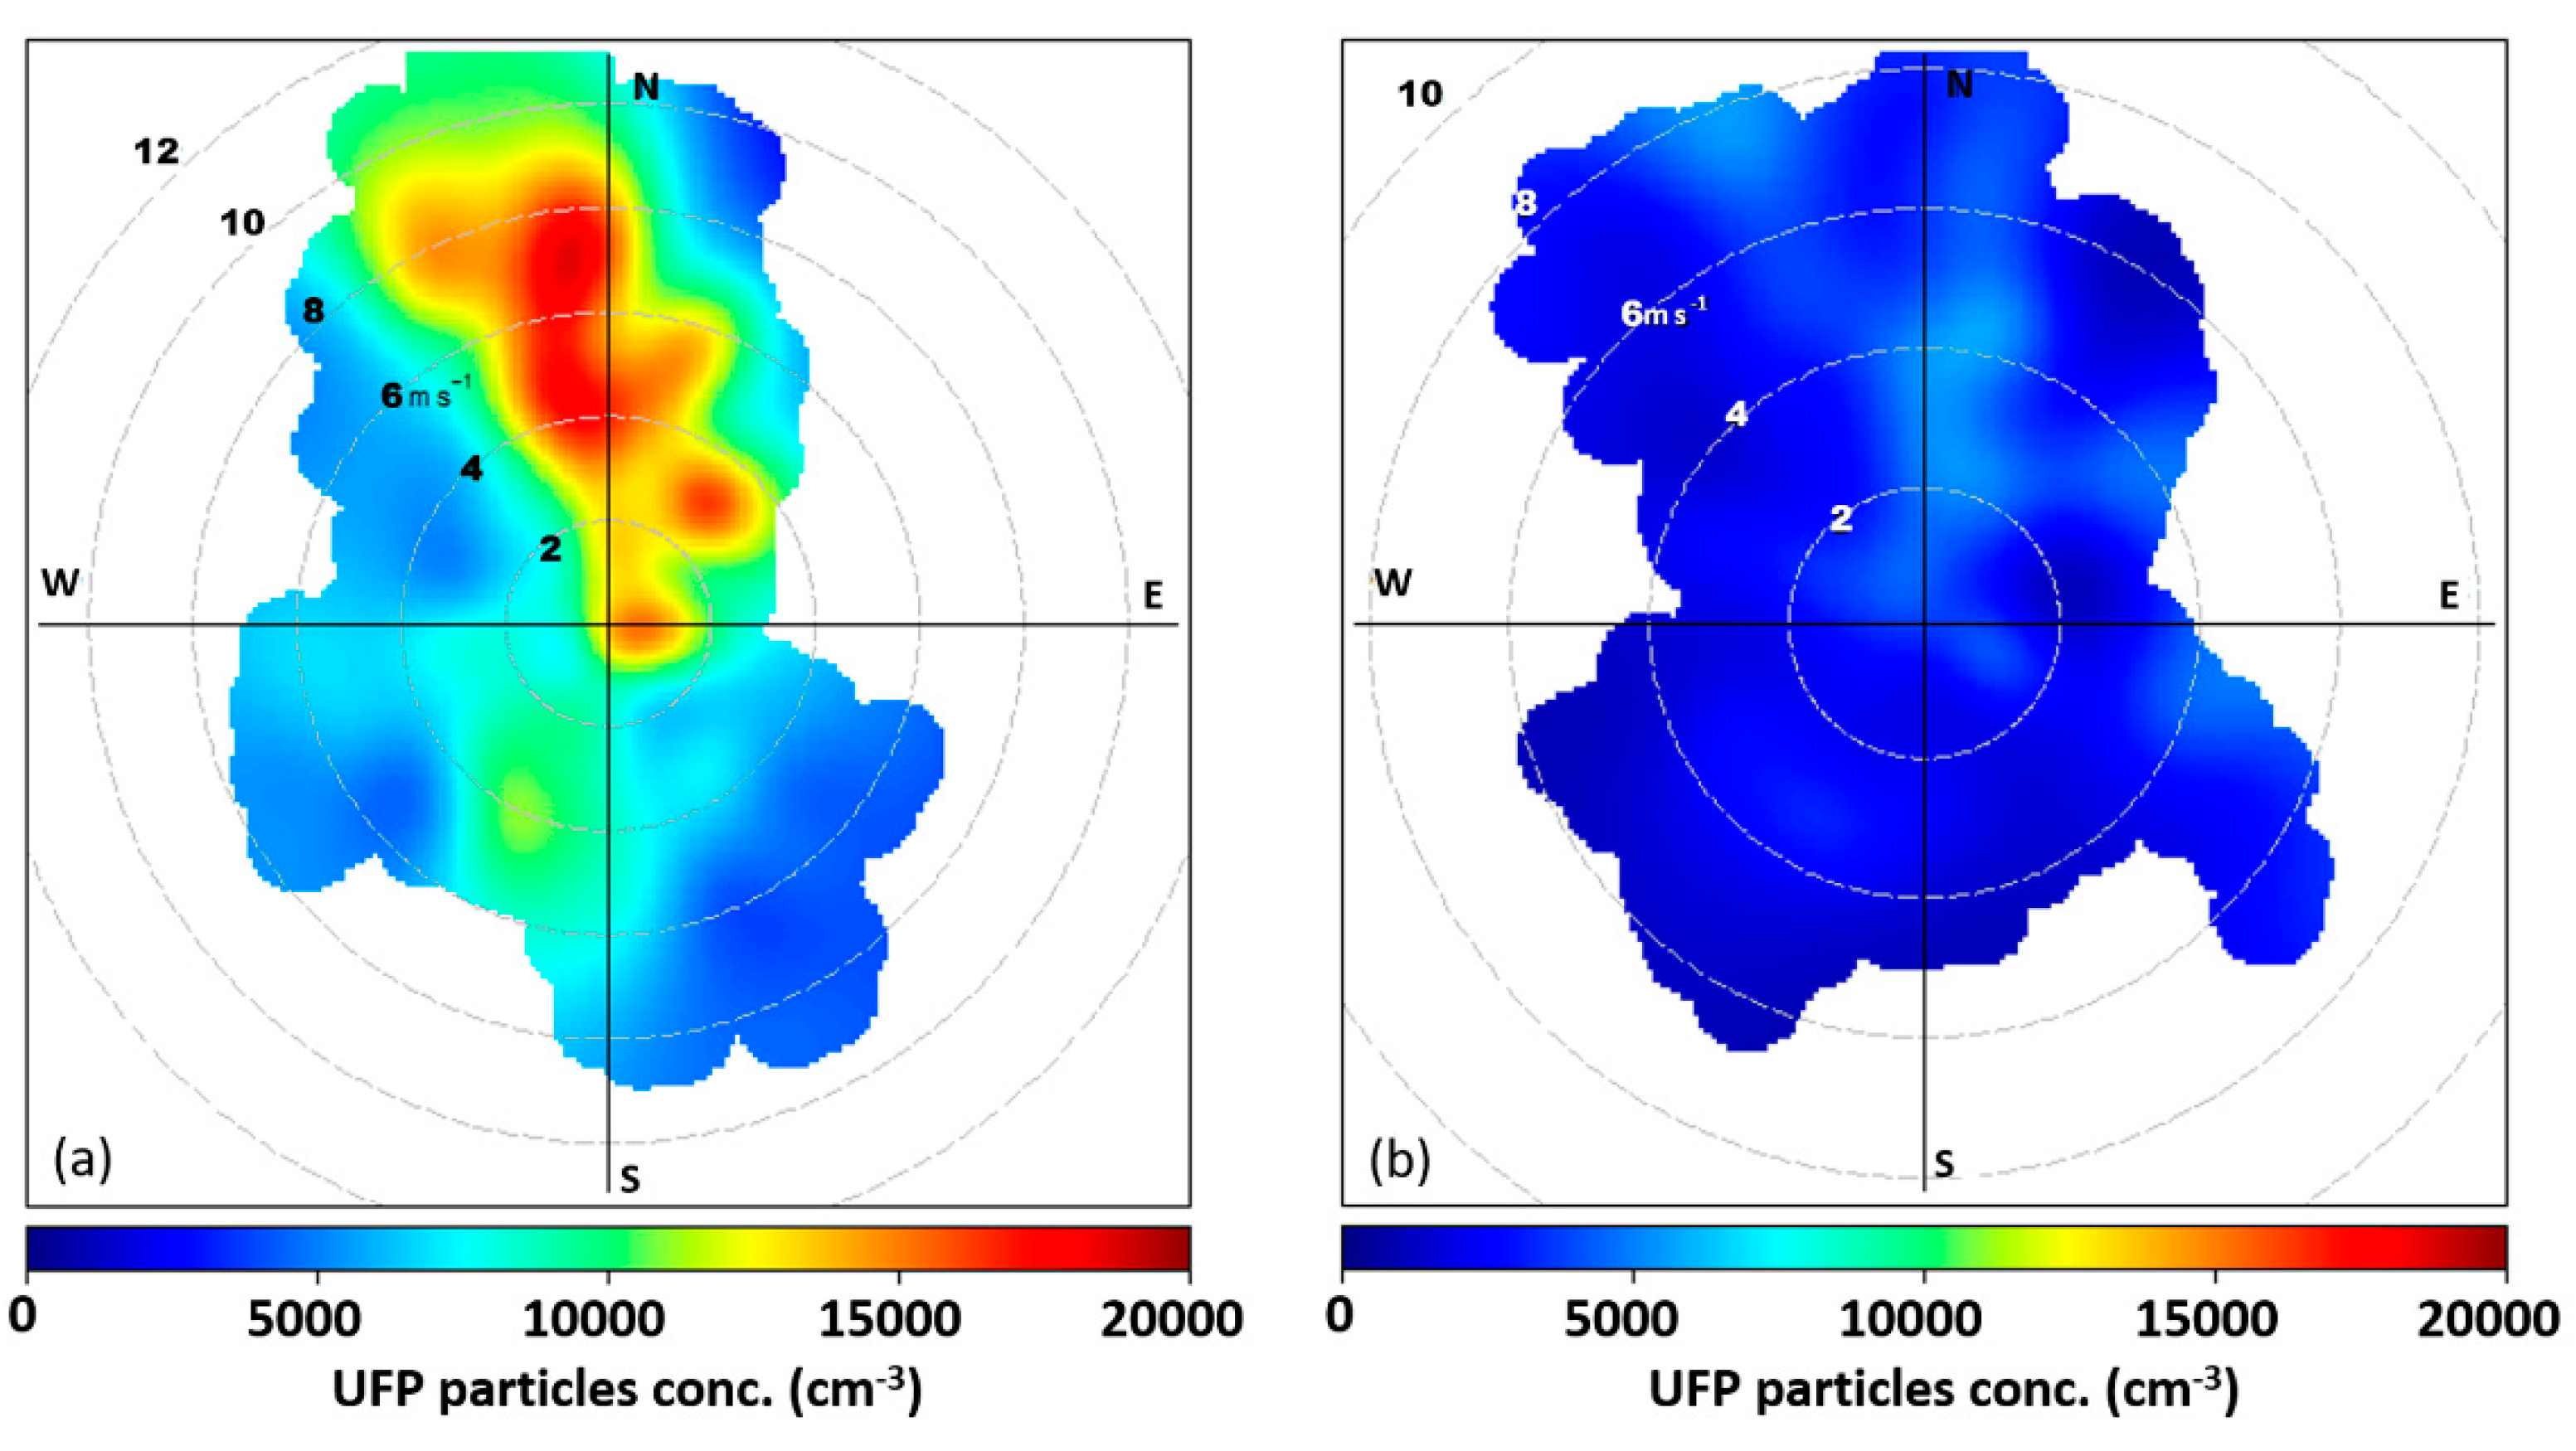
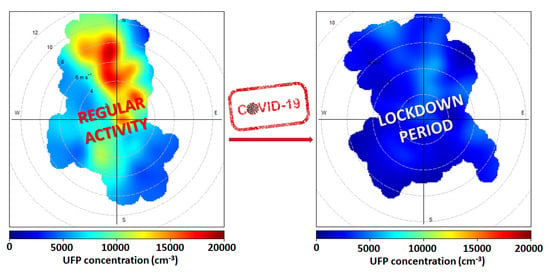
In this measurement data set, the correlations of the concentration with the wind field were studied. For this purpose, bivariate polar plots (pollution roses) [51] of UFP concentration were evaluated in each considered period (lockdown and the mirror) (Figure 6).
In the plots, the average concentration is reported as a color scale, the distance from the center is proportional to the wind velocity, and the radial position represents the wind direction. The results indicate that for UFPs in the mirror period (2016–2019), the highest concentrations are associated with a wind direction from N and NW and are essentially concentrated in a wind velocity range from 2 m s−1 to 10 m s−1 (Figure 6a). Further, a spot in UFPs can be observed in the N-NE sector for lower wind velocity (from 2 m s−1 to 4 m s−1). This observed pattern suggests the influence of a local, ground-level source with large concentrations of wind velocities between 2 m s−1 and 10 m s−1. On the other hand, the concentration was reduced during the lockdown period, for all wind velocities and in almost every direction (Figure 6b). With respect to the previous time interval, all the UFP sources in the N-NW sector that usually impacted the observation site disappeared or were substantially reduced.

3.3. Meteorology

An accurate analysis of meteorological parameters has been performed in order to exclude the impact of the meteorological forcing on the UFP number concentration and turbulent fluxes in this particular period. The site’s meteorology was characterized by the typical Mediterranean climate with mild autumn-winter seasons and a warm spring [52]. Winds blowing from the N-NW sector are the strongest (3.1 m s−1) compared to that coming from the SE sector (2.3 m s−1). The cold/wet season (from October to February) is characterized by significant rainfall (80% of the mean annual total). Lower temperatures reaching a minimum value of 9 ± 3 °C in January and high relative humidity conditions (up to 83 ± 9%) prevail in this period. The warm/dry season (from March to August) is generally characterized by high temperature (up to 40 °C in August). In this period, the total mean monthly rainfall decreases (down to 110 mm), as well as the relative humidity (53 ± 9% in July). Meteorological conditions can have a significant influence on the concentration of pollutants. A change from unfavorable to favorable conditions for the dispersion of pollutants normally occurs when a weather system reaches a region, making the atmosphere unstable. Precipitation also has a considerable influence, especially on the mass concentration, by its scavenging process. The following statistical analysis is carried out to show the influence of temperature, relative humidity, wind speed, and rain on pollutant concentrations. The temperature within the lockdown period ranged from 9.3 °C to 17.9 °C and the relative humidity from 48% to 82%. Precipitation occurred at the end of March and the beginning of April (with an accumulated precipitation peak of 15 mm). Then, rain occurred at the end of April at a greater intensity with an accumulated precipitation peak of 23 mm and a four-day duration. Wind velocity range in this period from 1 to 3.2 m s−1, with a prevalent direction in the N-NW sector.
From a comparison between this meteorological framework and the mirror period’s framework, no particular differences can be observed among meteorological variables (Table 1). Indeed, the mean temperature for the lockdown period is slightly lower (13.6 °C) with respect to the previous years, whereas relative humidity (67%) is essentially in the previous range, from minimum to maximum. Wind velocity is the minimum value (2.07 m s−1) with respect to mirror days. Thus, the reduction of UFP number or mass concentration cannot be considered due to the influence of temperature, relative humidity, and wind. Finally, a total of 10 rainy days (for accumulated rain >1mm) are recorded, with an accumulated precipitation amount of 101 mm. The number of rainy days and relative accumulated precipitation is greater with respect to the 2016–2018 interval, even if it is lower than that of 2019. In particular, a reduction of about 60% is observed on the mass (PM10 and PM2.5) and UFP number concentrations during intensely rainy days with accumulated precipitation greater than 15 mm. Indeed, the reduction is enhanced through extended continuous rainy periods (2–3 days), while no significant impacts can be observed during light rainy days. (Figure 7). In order to exclude any effects on the concentration decrease (both in mass and UFP number), rainy periods with accumulated precipitation greater than 15 mm and an extension in time greater than 2 continuous days is excluded from the analysis for lockdown and the corresponding mirror period (Section 3.1 and Section 3.2).
Specifically, throughout the entire lockdown phase, a further reduction of 1% was observed for mass and number concentration. It seems that the rain’s contribution to this contraction is negligible. Overall, meteorological forcing did not influence the reduction of UFP number or mass concentration. The effects of meteorological parameters show that air pollutants were improved at a higher rate through the restrictions when compared to changes in meteorological parameters. Therefore, the effect of the restrictions was more important in improving air quality than the effects of meteorology.

3.4. Turbulent UFP Fluxes

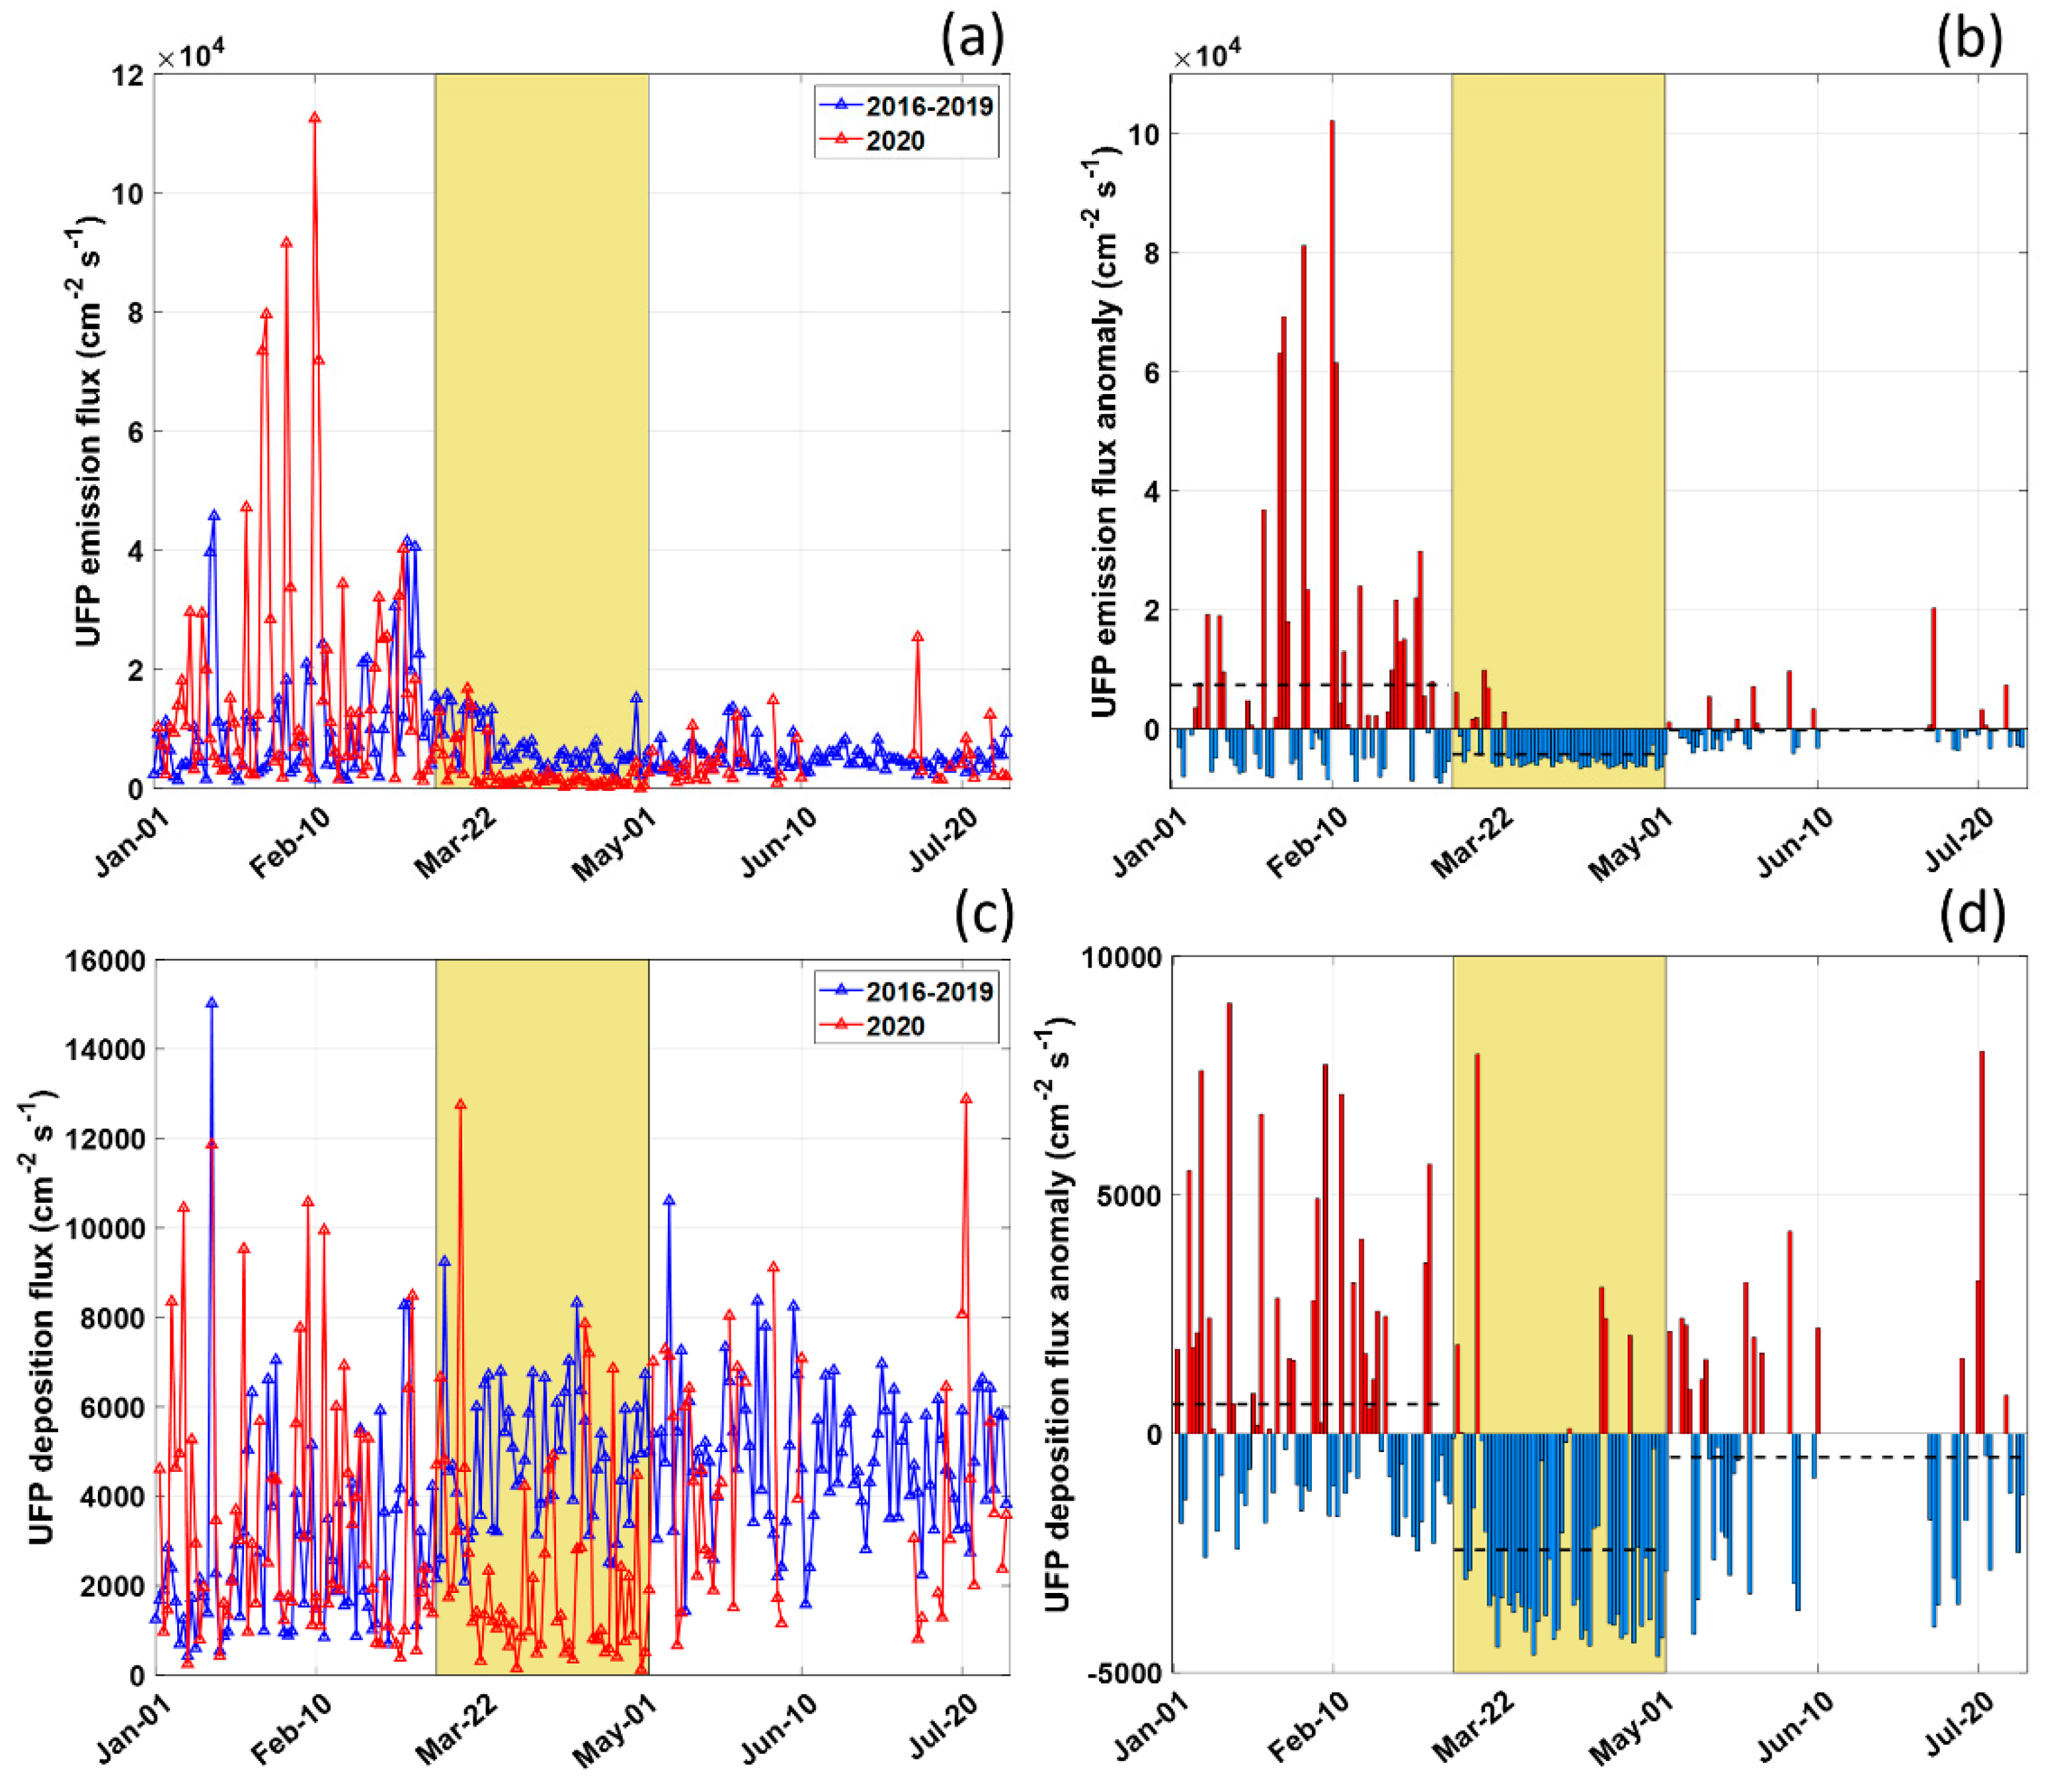
The measurement site is generally characterized by a series of sources emitting ultrafine particles. In other works [33,53,54], this site was described as essentially influenced by emissions of ultrafine particles. Our dataset from 2016 to 2019 shows a time series for particle number fluxes that is primarily positive, indicating emission of UFPs from the surface around the site. In this data set, 61.9% of fluxes are positive (emission processes) and 31.1% of fluxes are negative (deposition processes). The yearly average is 6729 (±199) particles cm−2 s−1 in positive fluxes, while −5202 (±124) particles cm−2 s−1 in negative fluxes. Thus, as previously stated, the area behaves as a source of UFPs, due essentially to traffic activities, domestic heating, and other spurious sources related to human activity. Figure 8 indicates a clear trend in the positive-flux time series during the lockdown phase. In this phase, a decrease in positive fluxes of 61% can be observed with respect to the same days in 2016–2019, with a decrement from 6960 (±440) particles cm−2 s−1 to 2695 (±492) particles cm−2 s−1. At the same time, negative fluxes decrease from −5915 (±323) particles cm−2 s−1 to −2430 (±358) particles cm−2 s−1 with respect to the same period (59%). However, this decrement is lower with respect to emission fluxes. As was conducted for UFP concentration, a mean daily anomaly was calculated for emission and deposition fluxes with respect to the mean value of the phase considered in the mirror period (Figure 8b,d). It is possible to deduce from this analysis a prevalence of negative anomalies for the lockdown period. A mean daily anomaly of −4223 particles cm−2 s−1 for positive fluxes is calculated, whereas a mean anomaly of −2432 particles cm−2 s−1 for negative fluxes. In the pre-lockdown phase, the anomalies were on average positive (7388 particles cm−2 s−1 for emission and 620 particles cm−2 s−1 for negative fluxes). These anomalies became negative (−210 particles cm−2 s−1 and −490 particles cm−2 s−1 on average) in the post-lockdown phase, for both emission and deposition fluxes. Thus, during the lockdown phase in 2020, our observation site behaved as a sink of UFPs, essentially registering a greater contraction in positive (emission) fluxes than negative (deposition) fluxes. From this behavior, we can conclude that the principal UFP sources during the lockdown were far away from the measurement site, probably due to long-range transport pollution. At the same time, many local UFP sources (above all vehicular traffic) were switched off due to the pandemic restriction measures. Additionally, in the turbulent flux analysis, rainy periods with accumulated precipitation greater than 15 mm days were excluded. Substantially, no change in reduction percentage can be observed.

4. Conclusions

In this paper, the effect of lockdown on ultrafine particle (UFP) number concentration and the relative exchange fluxes in a suburban site in the south of Italy were assessed. In addition, the impact of the lockdown period on the PM mass concentration was studied. The severe restriction on people’s movements following the lockdown measures resulted in a significant reduction of pollutant concentrations (especially UFP), mainly due to vehicular traffic. However, COVID-19 restrictions did not significantly reduce anthropogenic-related PM10 and PM2.5 levels, with a contraction of about 14%. According to the reduction of the concentrations, the ratio of PM2.5:PM10 does not show a significant change, remaining constant (0.54). During the post-lockdown period, a larger reduction can be noted: PM10 exhibits a 28% reduction, while PM2.5 decreased by 42%. The decrease observed post-lockdown is due to the general restriction in societal activities in the extension of safe pandemic measures (such as home working, mobility restriction, and curfew). Furthermore, excluding a Saharan dust transport event from the reduction analysis of PM10 and PM2.5 mass concentrations, the decrease during the lockdown period can be established as 11% in PM10 and 12% in PM2.5. The reductions in PM10 and PM2.5 mass concentrations are not as significant as that in UFP number concentration in our suburban site, where vehicular traffic represents the primary source of these emissions. Particle number concentration during the lockdown period decreased by 64% in our measurement area. Additionally, the number size distribution showed a reduction that was on average 30% lower than the same days in 2016–2019, which is probably correlated with lower traffic activity during this phase. Secondary sources could also have played an important role in particle number distribution. In particular, the percentage variation observed at midday in the diurnal cycles could be related to the reduction of new particulate formation events, occurring when climatic conditions and high concentrations of precursor species create suitable conditions to trigger the process. During the lockdown, the simultaneous reduction in the concentrations of pollutant compounds such as SO2 and volatile organic compounds, which act as precursors to the formation of secondary aerosols, could then explain the reduction of UFP number concentration observed in this period.
An analysis of meteorological parameters has been performed in order to exclude the impact on this particular period of the atmospheric forcing on the contraction of concentration levels. From a comparison between the lockdown meteorological framework and the mirror period framework, no particular differences occur among meteorological variables. Thus, air pollutants were improved at a higher rate throughout the restriction period when compared to changes in meteorological parameters; this means that the effect of the restriction measures and, consequently, the reduction of vehicle traffic, was more important in improving air quality than the effects of meteorology. The observation area behaves as a source of UFP, essentially due to traffic activities, domestic heating, and other spurious sources related to human activity. During the lockdown phase, a decrease in positive fluxes of 61% can be observed with respect to the same days in 2016–2019. At the same time, negative fluxes decreased by 59%. However, this decrement is lower with respect to emission fluxes. Therefore, during the lockdown phase in 2020, our observation site behaved as a sink of UFP particles. From this behavior, we can conclude that the principal UFP sources during the lockdown were far away from the measurement site, probably due to long-range transport pollution. At the same time, many local UFP sources (above all vehicular traffic) were switched off due to the pandemic restriction measures.

Author Contributions

Conceptualization, A.D. (Antonio Donateo) and G.P.; methodology, A.D. (Antonio Donateo) and G.P.; validation, A.D. (Antonio Donateo), A.D. (Adelaide Dinoi), and G.P.; formal analysis, A.D. (Antonio Donateo), A.D. (Adelaide Dinoi), and G.P.; investigation, A.D. (Antonio Donateo) and G.P.; data curation, A.D. (Antonio Donateo) and A.D. (Adelaide Dinoi); writing—original draft preparation, A.D. (Antonio Donateo), A.D. (Adelaide Dinoi), and G.P.; writing—review and editing, A.D. (Antonio Donateo), A.D. (Adelaide Dinoi), and G.P.; visualization, A.D. (Antonio Donateo) and G.P.; supervision, A.D. (Antonio Donateo). All authors have read and agreed to the published version of the manuscript.

Funding

This research was funded by I-AMICA (Infrastructure of High Technology for Environmental and Climate Monitoring—PONa3_00363), a project of structural improvement financed under the National Operational Program (NOP) for “Research and Competitiveness 2007–2013” co-funded with European Regional Development Fund (ERDF) and National resources.

Institutional Review Board Statement

Not applicable.

Informed Consent Statement

Not applicable.

Data Availability Statement

Data available on request.

Acknowledgments

Authors wish to thank Fabio Massimo Grasso (ISAC-CNR) for his help in collecting experimental data.

Conflicts of Interest

The authors declare no conflict of interest.

References

  1. Lu, H.; Stratton, C.W.; Tang, Y.W. Outbreak of pneumonia of unknown etiology in Wuhan, China: The mystery and the miracle. J. Med. Virol. 2020, 92, 401–402. [Google Scholar] [CrossRef] [Green Version]
  2. Raibhandari, B.; Phuyal, N.; Shrestha, B.; Thapa, M. Air medical evacuation of Nepalese citizen during epidemic of COVID-19 from wuhan to Nepal. J. Nepal Med. Assoc. 2020, 58, 125–133. [Google Scholar] [CrossRef]
  3. Aletta, F.; Brinchi, S.; Carrese, S.; Gemma, A.; Guattari, C.; Mannini, L.; Patella, S.M. Analysing urban traffic volumes and mapping noise emissions in Rome (Italy) in the context of containment measures for the COVID-19 disease. Noise Mapp. 2020, 7, 114–122. [Google Scholar] [CrossRef]
  4. Fuzzi, S.; Baltensperger, U.; Carslaw, K.; Decesari, S.; van der Gon, H.D.; Facchini, M.C.; Gilardoni, S. Particulate matter, air quality and climate: Lessons learned and future needs. Atmos. Chem. Phys. 2015, 15, 8217–8299. [Google Scholar] [CrossRef] [Green Version]
  5. Martinelli, N.; Olivieri, O.; Girelli, D. Air particulate matter and cardiovascular disease: A narrative review. Eur. J. Intern. Med. 2013, 24, 295–302. [Google Scholar] [CrossRef]
  6. Brook, R.; Rajagopalan, S.; Pope, C.; Brook, J.; Bhatnagar, A.; Diez-Roux, A.; Holguin, F.; Hong, Y.; Luepker, R.; Mittleman, M.; et al. Particulate matter air pollution and cardiovascular disease an update to the scientific statement from the American Heart Association. Circulation 2010, 121, 2331–2378. [Google Scholar] [CrossRef] [PubMed] [Green Version]
  7. Anderson, G.; Krall, J.; Peng, R.; Bell, M. Is the relation between ozone and mortality confounded by chemical components of particulate matter? Analysis of 7 components in 57 US communities. Am. J. Epidemiol. 2012, 176, 726–732. [Google Scholar] [CrossRef] [PubMed] [Green Version]
  8. Cohen, A.J.; Brauer, M.; Burnett, R.; Anderson, H.R.; Frostad, J.; Estep, K.; Balakrishnan, K.; Brunekreef, B.; Dandona, L.; Dandona, R.; et al. Estimates and 25-year trends of the global burden of disease attributable to ambient air pollution: An analysis of data from the Global Burden of Diseases Study 2015. Lancet 2017, 389, 1907–1918. [Google Scholar] [CrossRef] [Green Version]
  9. Cachon, B.F.; Firmin, S.; Verdin, A.; Ayi-Fanou, L.; Billet, S.; Cazier, F.; Martin, P.J.; Aissi, F.; Courcot, D.; Sanni, A.; et al. Pro inflammatory effects and oxidative stress within human bronchial epithelial cells exposed to atmospheric particulate matter (PM2.5 and PM > 2.5) collected from Cotonou, Benin. Environ. Pollut. 2014, 185, 340–351. [Google Scholar] [CrossRef] [PubMed]
  10. Gu, X.; Chu, X.; Zeng, X.L.; Bao, H.R.; Liu, X.J. Effects of PM2.5 exposure on the Notch signaling pathway and immune imbalance in chronic obstructive pulmonary disease. Environ. Pollut. 2017, 226, 163–173. [Google Scholar] [CrossRef]
  11. Ng, C.F.S.; Hashizume, M.; Obase, Y.; Doi, M.; Tamura, K.; Tomari, S.; Kawano, T.; Fukushima, C.; Matsuse, H.; Chung, Y.; et al. Associations of chemical composition and sources of PM2.5 with lung function of severe asthmatic adults in a low air pollution environment of urban Nagasaki, Japan. Environ. Pollut. 2019, 252, 599–606. [Google Scholar] [CrossRef]
  12. Collivignarelli, M.C.; Abbà, A.; Bertanza, G.; Pedrazzani, R.; Ricciardi, P.; Miino, M.C. Lockdown for CoViD-2019 in Milan: What are the effects on air quality? Sci. Total Environ. 2020, 732, 139–280. [Google Scholar] [CrossRef]
  13. Kerimray, A.; Baimatova, N.; Ibragimova, O.P.; Bukenov, B.; Kenessov, B.; Plotitsyn, P.; Karaca, F. Assessing air quality changes in large cities during COVID-19 lockdowns: The impacts of traffic-free urban conditions in Almaty, Kazakhstan. Sci. Total Environ. 2020, 730, 139179. [Google Scholar] [CrossRef]
  14. Chauhan, A.; Singh, R.P. Decline in PM2.5 concentrations over major cities around the world associated with COVID-19. Environ. Res. 2020, 187, 109634. [Google Scholar] [CrossRef] [PubMed]
  15. Mahato, S.; Pal, S.; Ghosh, K.G. Effect of lockdown amid COVID-19 pandemic on air quality of the megacity Delhi, India. Sci. Total Environ. 2020, 730, 139086. [Google Scholar] [CrossRef]
  16. Rodríguez-Urrego, D.; Rodríguez-Urrego, L. Air quality during the COVID-19: PM2.5 analysis in the 50 most polluted capital cities in the world. Environ. Pollut. 2020, 266, 115042. [Google Scholar] [CrossRef] [PubMed]
  17. Sharma, S.; Zhang, M.; Gao, J.; Zhang, H.; Kota, S.H. Effect of restricted emissions during COVID-19 on air quality in India. Sci. Total Environ. 2020, 728, 138878. [Google Scholar] [CrossRef]
  18. Tobías, A.; Carnerero, C.; Reche, C.; Massagué, J.; Via, M.; Minguillón, M.C.; Alastuey, A.; Querol, X. Changes in air quality during the lockdown in Barcelona (Spain) one month into the SARS-CoV-2 epidemic. Sci. Total Environ. 2020, 726, 138540. [Google Scholar] [CrossRef] [PubMed]
  19. Agarwal, A.; Kaushik, A.; Kumar, S.; Mishra, R.K. Comparative study on air quality status in Indian and Chinese cities before and during the COVID-19 lockdown period. Air Qual. Atmos. Health 2020, 13, 1167–1178. [Google Scholar] [CrossRef] [PubMed]
  20. Chen, L.W.A.; Chien, L.C.; Li, Y.; Lin, G. Non uniform impacts of COVID-19 lockdown on air quality over the United States. Sci. Total Environ. 2020, 745, 141105. [Google Scholar] [CrossRef]
  21. Connerton, P.; De Assunção, J.V.; De Miranda, R.M.; Slovic, A.D.; Pérez-Martínez, P.J.; Ribeiro, H. Air quality during COVID-19 in Four Megacities: Lessons and Challenges for public health. Int. J. Environ. Res. Public Health 2020, 17, 5067. [Google Scholar] [CrossRef] [PubMed]
  22. Sicard, P.; De Marco, A.; Agathokleous, E.; Feng, Z.; Xu, X.; Paoletti, E.; Diéguez Rodriguez, J.J.; Calatayud, V. Amplified ozone pollution in cities during the COVID-19 lockdown. Sci. Total Environ. 2020, 735, 139542. [Google Scholar] [CrossRef] [PubMed]
  23. Wang, Q.; Su, M. A preliminary assessment of the impact of COVID-19 on environment—A case study of China. Sci. Total Environ. 2020, 728, 138915. [Google Scholar] [CrossRef] [PubMed]
  24. Hudda, N.; Matthew, C.; Patton, S.A.P.; Durant, J.L. Reductions in traffic-related black carbon and ultrafine particle number concentrations in an urban neighborhood during the COVID-19 pandemic. Sci. Total Environ. 2020, 742, 140931. [Google Scholar] [CrossRef]
  25. Dai, Q.; Ding, J.; Song, C.; Liu, B.; Bi, X.; Wu, J.; Zhang, Y.; Feng, Y.; Hopke, P.K. Changes in source contributions to particle number concentrations after the COVID-19 outbreak: Insights from a dispersion normalized PMF. Sci. Total Environ. 2021, 759, 143548. [Google Scholar] [CrossRef]
  26. Shen, X.; Sun, J.; Yu, F.; Zhang, X.; Zhong, J.; Zhang, Y.; Hu, X.; Xia, C.; Zhang, S. Enhancement of nanoparticle formation and growth during the COVID-19 lockdown period in urban Beijing. Atmos. Chem. Phys. Discuss. 2020, in press. [Google Scholar] [CrossRef]
  27. Cristofanelli, P.; Busetto, M.; Calzolari, F.; Ammoscato, I.; Gullì, D.; Dinoi, A.; Calidonna, C.R.; Contini, D.; Sferlazzo, D.; Di Iorio, T.; et al. Investigation of reactive gases and methane variability in the coastal boundary layer of the central Mediterranean basin. Elem. Sci. Anthr. 2017, 5, 12. [Google Scholar] [CrossRef] [Green Version]
  28. Donateo, A.; Lo Feudo, T.; Marinoni, A.; Calidonna, C.R.; Contini, D.; Bonasoni, P. Long-term observations of aerosol optical properties at three GAW regional sites in the Central Mediterranean. Atmos. Res. 2020, 241, 104976. [Google Scholar] [CrossRef]
  29. Cesari, D.; De Benedetto, G.E.; Bonasoni, P.; Busetto, M.; Dinoi, A.; Merico, E.; Chirizzi, D.; Cristofanelli, P.; Donateo, A.; Grasso, F.M.; et al. Seasonal variability of PM2.5 and PM10 composition and sources in an urban background site in Southern Italy. Sci. Total Environ. 2018, 612, 202–213. [Google Scholar] [CrossRef]
  30. Hermann, M.; Wehner, B.; Bischof, O.; Han, H.S.; Krinke, T.; Liu, W.; Zerrath, A.; Wiedensohler, A. Particle counting efficiencies of new TSI condensation particle counters. Aerosol Sci. 2007, 38, 674–682. [Google Scholar] [CrossRef]
  31. Asbach, C.; Schmitz, A.; Schmidt, F.; Monz, C.; Todea, A.M. Intercomparison of a personal CPC and different conventional CPCs. Aerosol Air Qual. Res. 2017, 17, 1132–1141. [Google Scholar] [CrossRef] [Green Version]
  32. Takegawa, N.; Iida, K.; Sakurai, H. Modification and laboratory evaluation of a TSI ultrafine condensation particle counter (Model 3776) for airborne measurements. Aerosol Sci. Technol. 2017, 51, 235–245. [Google Scholar] [CrossRef] [Green Version]
  33. Donateo, A.; Conte, M.; Grasso, F.M.; Contini, D. Seasonal and diurnal behaviour of size segregated particles fluxes in a suburban area. Atmos. Environ. 2019, 219, 117052. [Google Scholar] [CrossRef]
  34. Dinoi, A.; Cesari, D.; Marinoni, A.; Bonasoni, P.; Riccio, A.; Chianese, E.; Tirimberio, G.; Naccarato, A.; Sprovieri, F.; Andreoli, V.; et al. Inter-comparison of carbon content in PM2.5 and PM10 collected at five measurement sites in southern Italy. Atmosphere 2017, 8, 243. [Google Scholar] [CrossRef] [Green Version]
  35. Dinoi, A.; Weinhold, K.; Wiedensohler, A.; Contini, D. Study of new particle formation events in southern Italy. Atmos. Environ. 2021, 244, 117920. [Google Scholar] [CrossRef]
  36. Kaimal, J.C.; Finnigan, J.J. Atmospheric Boundary Layer Flows: Their Structure and Measurement; Oxford University Press: New York, NY, USA, 1994; pp. 33–39. [Google Scholar]
  37. McMillen, R.T. An eddy-correlation technique with extended applicability to non simple terrain. Bound. Layer Meteorol. 1988, 43, 231–245. [Google Scholar] [CrossRef]
  38. Businger, J.A. Evaluation of the accuracy with which dry deposition can be measured with current micrometeorological techniques. J. Clim. Appl. Meteorol. 1986, 25, 1100–1124. [Google Scholar] [CrossRef] [Green Version]
  39. Rannik, U.; Vesala, T. Autoregressive filtering versus linear detrending in estimation of fluxes by the eddy covariance method. Bound. Layer Meteorol. 1999, 91, 259–280. [Google Scholar] [CrossRef]
  40. Donateo, D.; Cava, D.; Contini, D. A case study of the performance of different detrending methods in turbulent-flux estimation. Bound. Layer Meteorol. 2017, 164, 19–37. [Google Scholar] [CrossRef]
  41. Ahlm, L.; Nilsson, E.D.; Krejci, R.; Martensson, E.M.; Vogt, M.; Artaxo, P. A comparison of dry and wet season aerosol number fluxes over the Amazon rain forest. Atmos. Chem. Phys. 2010, 10, 3063–3079. [Google Scholar] [CrossRef] [Green Version]
  42. Mahrt, L. Flux sampling errors for aircraft and towers. J. Atmos. Ocean Technol. 1998, 15, 416–429. [Google Scholar] [CrossRef]
  43. Cava, D.; Donateo, A.; Contini, D. Combined stationarity index for the estimation of turbulent fluxes of scalars and particles in the atmospheric surface layer. Agric. For. Meteorol. 2014, 194, 88–103. [Google Scholar] [CrossRef]
  44. Horst, T.W. A simple formula for attenuation of eddy fluxes measured with first-order-response scalar sensor. Bound. Layer Meteorol. 1997, 82, 219–233. [Google Scholar] [CrossRef]
  45. Fairall, C.W. Interpretation of eddy correlation measurements of particulate deposition and aerosol flux. Atmos. Environ. 1984, 18, 1329–1337. [Google Scholar] [CrossRef]
  46. Schmid, H.P. Source areas for scalars and scalar fluxes. Bound. Layer Meteorol. 1994, 67, 293–318. [Google Scholar] [CrossRef]
  47. Singh, R.P.; Chauhan, A. Impact of lockdown on air quality in India during COVID-19 pandemic. Air Qual. Atmos. Health 2020, 13, 921–928. [Google Scholar] [CrossRef]
  48. Shakoor, A.; Chen, X.; Farooq, T.H.; Shahzad, U.; Ashraf, F.; Rehman, A.; Sahar, N.E.; Yan, W. Fluctuations in environmental pollutants and air quality during the lockdown in the USA and China: Two sides of COVID-19 pandemic. Air Qual. Atmos. Health 2020, 13, 1–8. [Google Scholar] [CrossRef] [PubMed]
  49. Shrestha, A.M.; Shrestha, U.B.; Sharma, R.; Bhattarai, S.; Tran, H.N.T.; Rupakheti, M. Lockdown caused by COVID-19 pandemic reduces air pollution in cities worldwide. Down Earth 2020. [Google Scholar] [CrossRef]
  50. Gibbons, J.D.; Chakraborti, S. Nonparametric Statistical Inference, 5th ed.; Chapman & Hall/CRC Press, Taylor & Francis Group: Boca Raton, FL, USA, 2021. [Google Scholar]
  51. Carslaw, D.C.; Ropkins, K. Openair—An R package for air quality data analysis. Environ. Model. Softw. 2012, 27, 52–61. [Google Scholar] [CrossRef]
  52. Martano, P.; Elefante, C.; Grasso, F.M. Ten years water and energy surface balance from the CNR-ISAC micrometeorological station in Salento peninsula (southern Italy). Adv. Sci. Res. 2015, 12, 121–125. [Google Scholar] [CrossRef] [Green Version]
  53. Conte, M.; Donateo, A.; Dinoi, A.; Belosi, F.; Contini, D. Case study of particle number fluxes and size distributions during nucleation events in southeastern Italy in the summer. Atmosphere 2015, 6, 942–959. [Google Scholar] [CrossRef] [Green Version]
  54. Dinoi, A.; Conte, M.; Grasso, F.M.; Contini, D. Long-Term Characterization of Submicron Atmospheric Particles in an Urban Background Site in Southern Italy. Atmosphere 2020, 11, 334. [Google Scholar] [CrossRef] [Green Version]
Figure 1. (a) A map of the measurement area and the indication of the observation site (red circle). (b) Timeline of the significant milestones of 2020, including the starting and closing of the confinement measures taken in Italy during the first six months of the year to prevent infection by COVID-19.
Atmosphere 12 00407 g001
Figure 2. Time series of daily (a) PM10 and (c) PM2.5 concentrations for the measurement period from January to July 2020 and the corresponding period in the years 2016–2019. Anomalies for each day are calculated from the difference with a baseline value (mean concentration level for each phase of the period 2016–2019) for (b) PM10 and (d) PM2.5. The lockdown period is evidenced by a yellow band.
Atmosphere 12 00407 g002
Figure 3. (a) Time series of daily ultrafine particle (UFP) concentration for the measurement period from January to July 2020 and the corresponding period in the years 2016–2019. (b) Anomalies for each day were calculated from the difference with a baseline value (mean concentration level for each phase of the period 2016–2019). The lockdown period is evidenced by a yellow band.
Atmosphere 12 00407 g003
Figure 4. Size distribution for UFPs separated into three different phases (pre-lockdown, lockdown, and post-lockdown). The graphs show a comparison with the mirror period of 2016–2019.
Atmosphere 12 00407 g004
Figure 5. Diurnal cycle for ultrafine particle number concentration separated into three different phases (a) pre-lockdown, (b) lockdown, and (c) post-lockdown. The graphs show a comparison with the mirror period of 2016–2019. Circles in the graphs indicate the median values. On the right axis (dashed line) the relative percentage ratio between 2020 and the relative period for the three different phases is represented.
Atmosphere 12 00407 g005
Figure 6. Pollution roses (bivariate polar plots) for UFP number concentrations during (a) the mirror period (2016–2019) and (b) lockdown phase. Wind speed and wind direction are represented by the concentric circles and the colored shape, respectively. The color bar is the average value of mean particle number concentration.
Atmosphere 12 00407 g006
Figure 7. Time series of UFP number concentration (in 10−2), PM10, and PM2.5 in a comparison with the daily accumulated rainfall during the lockdown in 2020.
Atmosphere 12 00407 g007
Figure 8. Time series of daily UFP (a) positive (emission) and (c) negative (deposition) fluxes for the measurement period from January to July 2020 and the corresponding period in the years 2016–2019. Anomalies for each day are calculated from the difference with a baseline value (mean positive/negative flux level for each phase of the period 2016–2019) for (b) emission and (d) deposition fluxes. The lockdown period is evidenced by a yellow band.
Atmosphere 12 00407 g008
Table 1. Mean average meteorological variables for the lockdown period in 2020 and the same days in 2016–2019.
T (°C)RH (%)Wind (m s−1)Rain (mm)
201614.8 ± 0.468 ± 12.1 ± 0.185 (13 days)
201714.1 ± 0.364 ± 12.2 ± 0.130 (4 days)
201815.6 ± 0.567 ± 12.1 ± 0.166 (9 days)
201914.2 ± 0.367 ± 12.8 ± 0.1128 (12 days)
202013.6 ± 0.467 ± 12.1 ± 0.1101 (10 days)
Publisher’s Note: MDPI stays neutral with regard to jurisdictional claims in published maps and institutional affiliations.