
Measured Solid State and Sub-Cooled Liquid Vapour Pressures of Benzaldehydes Using Knudsen Effusion Mass Spectrometry

 , ,
, ,  ,
,
Abstract
1. Introduction
2. Experimental
2.1. The Knudsen Effusion Mass Spectrometry System (KEMS)
2.2. Differential Scanning Calorimetry (DSC)
2.3. MOPAC2016
3. Theory
3.1. Sub-Cooled Correction
3.2. Vapour Pressure Predictive Techniques
4. Results and Discussion
4.1. Solid State Vapour Pressure
4.2. Sub-Cooled Liquid Vapour Pressure
4.2.1. H-Bonding Compounds
4.2.2. Non H-Bonding Compounds
4.2.3. Comparisons between H-Bonding and non H-Bonding Compounds
4.3. Comparisons with Estimations from GCMs
5. Conclusions
Supplementary Materials
Author Contributions
Funding
Institutional Review Board Statement
Informed Consent Statement
Data Availability Statement
Conflicts of Interest
References
- Seinfeld, J.H.; Pandis, S.N. Atmospheric Chemistry and Physics: From Air Pollution to Climate Change, 3rd ed.; John Wiley & Sons, Incorporated: New York, NY, USA, 2016. [Google Scholar]
- Kanakidou, M.; Seinfeld, J.H.; Pandis, S.N.; Barnes, I.; Dentener, F.J.; Facchini, M.C.; van Dingenen, R.; Ervens, B.; Nenes, A.; Nielsen, C.J.; et al. Organic aerosol and global climate modelling: A review. Atmos. Chem. Phys. 2005, 5, 1053–1123. [Google Scholar] [CrossRef]
- Bilde, M.; Barsanti, K.; Booth, M.; Cappa, C.D.; Donahue, N.M.; Emanuelsson, E.U.; McFiggans, G.; Krieger, U.K.; Marcolli, C.; Topping, D.; et al. Saturation Vapor Pressures and Transition Enthalpies of Low-Volatility Organic Molecules of Atmospheric Relevance: From Dicarboxylic Acids to Complex Mixtures. Chem. Rev. 2015, 115, 4115–4156. [Google Scholar] [CrossRef] [PubMed]
- Booth, A.M.; Barley, M.H.; Topping, D.O.; Mcfiggans, G.; Garforth, A.; Percival, C.J. Solid state and sub-cooled liquid vapour pressures of substituted dicarboxylic acids using Knudsen Effusion Mass Spectrometry (KEMS) and Differential Scanning Calorimetry. Atmos. Chem. Phys. 2010, 10, 4879–4892. [Google Scholar] [CrossRef]
- Hallquist, M.; Wenger, J.C.; Baltensperger, U.; Rudich, Y.; Simpson, D.; Claeys, M.; Dommen, J.; Donahue, N.M.; George, C.; Goldstein, A.H.; et al. The formation, properties and impact of secondary organic aerosol: Current and emerging issues. Atmos. Chem. Phys. Atmos. Chem. Phys. 2009, 9, 5155–5236. [Google Scholar] [CrossRef]
- Nannoolal, Y.; Rarey, J.; Ramjugernath, D. Fluid Phase Equilibria Estimation of pure component properties Part 3. Estimation of the vapor pressure of non-electrolyte organic compounds via group contributions and group interactions. Fluid Phase Equilib. 2008, 269, 117–133. [Google Scholar] [CrossRef]
- Myrdal, P.B.; Yalkowsky, S.H. Estimating Pure Component Vapor Pressures of Complex Organic Molecules. Ind. Eng. Chem. Res. 1997, 36, 2494–2499. [Google Scholar] [CrossRef]
- Pankow, J.F.; Asher, W.E. SIMPOL.1: A simple group contribution method for predicting vapor pressures and enthalpies of vaporization of multifunctional organic compounds. Atmos. Chem. Phys. 2008, 8, 2773–2796. [Google Scholar] [CrossRef]
- Compernolle, S.; Ceulemans, K.; Müller, J.F. Evaporation: A new vapour pressure estimation methodfor organic molecules including non-additivity and intramolecular interactions. Atmos. Chem. Phys. 2011, 11, 9431–9450. [Google Scholar] [CrossRef]
- Barley, M.H.; McFiggans, G. The critical assessment of vapour pressure estimation methods for use in modelling the formation of atmospheric organic aerosol. Atmos. Chem. Phys 2010, 10, 749–767. [Google Scholar] [CrossRef]
- O’Meara, S.; Booth, A.M.; Barley, M.H.; Topping, D.; Mcfiggans, G. An assessment of vapour pressure estimation methods. Phys. Chem. Chem. Phys. 2014, 16, 19453–19469. [Google Scholar] [CrossRef] [PubMed]
- Booth, A.M.; Bannan, T.; McGillen, M.R.; Barley, M.H.; Topping, D.O.; McFiggans, G.; Percival, C.J. The role of ortho, meta, para isomerism in measured solid state and derived sub-cooled liquid vapour pressures of substituted benzoic acids. RSC Adv. 2012, 2, 4430. [Google Scholar] [CrossRef]
- Dang, C.; Bannan, T.; Shelley, P.; Priestley, M.; Worrall, S.D.; Waters, J.; Coe, H.; Percival, C.J.; Topping, D. The effect of structure and isomerism on the vapour pressures of organic molecules and its potential atmospheric relevance. Aerosol. Sci. Technol. 2019, 53, 1–32. [Google Scholar] [CrossRef]
- Shelley, P.D.; Bannan, T.J.; Worrall, S.D.; Alfarra, M.R.; Krieger, U.K.; Percival, C.J.; Garforth, A.; Topping, D. Measured solid state and subcooled liquid vapour pressures of nitroaromatics using Knudsen effusion mass spectrometry. Atmos. Chem. Phys. 2020, 20, 8293–8314. [Google Scholar] [CrossRef]
- Caralp, F.; Foucher, V.; Lesclaux, R.; Wallington, T.J.; Michael Hurley, B.D. Atmospheric chemistry of benzaldehyde: UV absorption spectrum and reaction kinetics and mechanisms of the radical C6H5C(O)O2. Phys. Chem. Chem. Phys. 1999, 1, 3509–3517. [Google Scholar] [CrossRef]
- Baghi, R.; Helmig, D.; Guenther, A.; Duhl, T.; Daly, R. Contribution of flowering trees to urban atmospheric biogenic volatile organic compound emissions. Biogeosciences 2012, 9, 3777–3785. [Google Scholar] [CrossRef]
- Thiault, G.; Mellouki, A.; Le Bras, G.; Chakir, A.; Sokolowski-Gomez, N.; Daumont, D. UV-absorption cross sections of benzaldehyde, ortho-, meta-, and para-tolualdehyde. J. Photochem. Photobiol. A Chem. 2004, 162, 273–281. [Google Scholar] [CrossRef]
- Dubtsov, S.N.; Dultseva, G.G.; Dultsev, E.N.; Skubnevskaya, G.I. Investigation of aerosol formation during benzaldehyde photolysis. J. Phys. Chem. B 2006, 110, 645–649. [Google Scholar] [CrossRef] [PubMed]
- Peng, C.-Y.; Yang, H.-H.; Lan, C.-H.; Chien, S.-M. Effects of the biodiesel blend fuel on aldehyde emissions from diesel engine exhaust. Atmos. Environ. 2008, 42, 906–915. [Google Scholar] [CrossRef]
- Magnusson, R.; Nilsson, C.; Andersson, B. Emissions of Aldehydes and Ketones from a Two-Stroke Engine Using Ethanol and Ethanol-Blended Gasoline as Fuel. Environ. Sci. Technol. 2002, 36, 1656–1664. [Google Scholar] [CrossRef]
- Hamilton, J.F.; Webb, P.J.; Lewis, A.C.; Reviejo, M.M. Quantifying small molecules in secondary organic aerosol formed during the photo-oxidation of toluene with hydroxyl radicals. Atmos. Environ. 2005, 39, 7263–7275. [Google Scholar] [CrossRef]
- Jenkin, M.E.; Saunders, S.M.; Wagner, V.; Pilling, M.J. Protocol for the development of the Master Chemical Mechanism, MCM v3 (Part B): Tropospheric degradation of aromatic volatile organic compounds. Atmos. Chem. Phys. 2003, 3, 181–193. [Google Scholar] [CrossRef]
- Bloss, C.; Wagner, V.; Jenkin, M.E.; Volkamer, R.; Bloss, W.J.; Lee, J.D.; Heard, D.E.; Wirtz, K.; Martin-Reviejo, M.; Rea, G.; et al. Development of a Detailed Chemical Mechanism (MCMv3.1) for the Atmospheric Oxidation of Aromatic Hydrocarbons. Atmos. Chem. Phys. 2005, 5, 641–644. [Google Scholar] [CrossRef]
- Bannan, T.J.; Booth, A.M.; Jones, B.T.; O’meara, S.; Barley, M.H.; Riipinen, I.; Percival, C.J.; Topping, D. Measured Saturation Vapor Pressures of Phenolic and Nitro-aromatic Compounds. Environ. Sci. Technol. 2017, 51, 3922–3928. [Google Scholar] [CrossRef] [PubMed]
- Booth, A.M.; Markus, T.; Mcfiggans, G.; Percival, C.J.; Mcgillen, M.R.; Topping, D.O. Design and construction of a simple Knudsen Effusion Mass Spectrometer (KEMS) system for vapour pressure measurements of low volatility organics. Atmos. Meas. Tech. 2009, 2, 355–361. [Google Scholar] [CrossRef]
- Krieger, U.K.; Siegrist, F.; Marcolli, C.; Emanuelsson, E.U.; Gøbel, F.M.; Bilde, M.; Marsh, A.; Reid, J.P.; Huisman, A.J.; Riipinen, I.; et al. A reference data set for validating vapor pressure measurement techniques: Homologous series of polyethylene glycols. Atmos. Meas. Tech. 2018, 11, 49–63. [Google Scholar] [CrossRef]
- Booth, A.M.; Bannan, T.J.; Benyezzar, M.; Bacak, A.; Alfarra, M.R.; Topping, D.; Percival, C.J. Development of lithium attachment mass spectrometry—Knudsen effusion and chemical ionisation mass spectrometry (KEMS, CIMS). Analyst 2017, 142, 3666–3673. [Google Scholar] [CrossRef] [PubMed]
- Bannan, T.J.; Le Breton, M.; Priestley, M.; Worrall, S.D.; Bacak, A.; Marsden, N.A.; Mehra, A.; Hammes, J.; Hallquist, M.; Alfarra, M.R.; et al. A method for extracting calibrated volatility information from the FIGAERO-HR-ToF-CIMS and its experimental application. Atmos. Meas. Tech. 2019, 12, 1429–1439. [Google Scholar] [CrossRef]
- Hilpert, K. Potential of mass spectrometry for the analysis of inorganic high-temperature vapors. In Proceedings of the Fresenius’ Journal of Analytical Chemistry; Springer: Berlin/Heidelberg, Germany, 2001; Volume 370, pp. 471–478. [Google Scholar]
- Atomic Total Energies: Atomic Reference Data for Electronic Structure Calculations. Available online: https://physics.nist.gov/PhysRefData/Ionization/atom_index.html (accessed on 11 March 2021).
- Mauger, J.W.; Paruta, A.N.; Gerraughty, R.J. Solubilities of Sulfadiazine, Sulfisomidine, and Sulfadimethoxine in Several Normal Alcohols. J. Pharm. Sci. 1972, 61, 94–97. [Google Scholar] [CrossRef]
- Grant, D.J.W.; Mehdizadeh, M.; Chow, A.H.-L.; Fairbrother, J.E. Non-linear van’t Hoff solubility-temperature plots and their pharmaceutical interpretation. Int. J. Pharm. 1984, 18, 25–38. [Google Scholar] [CrossRef]
- Stewart, J.J. MOPAC2016; Stewart Computational Chemistry: Colorado Springs, CO, USA, 2016. [Google Scholar]
- Dewar, M.J.S.; Thiel, W. A semiempirical model for the two-center repulsion integrals in the NDDO approximation. Theor. Chim. Acta 1977, 46, 89–104. [Google Scholar] [CrossRef]
- Prausnitz, J.; Lichtenthaler, R.; de Azevedo, E. Molecular Thermodynamics of Fluid-Phase Equilibria; Pearson Education: Upper Saddle River, NJ, USA, 1998. [Google Scholar]
- Nannoolal, Y.; Rarey, J.; Ramjugernath, D.; Cordes, W. Estimation of pure component properties Part 1. Estimation of the normal boiling point of non-electrolyte organic compounds via group contributions and group interactions. Fluid Phase Equilib. 2004, 226, 45–63. [Google Scholar] [CrossRef]
- Joback, K.G.; Reid, R.C.; Reid, C. Estimation of pure-component properties from group-contributions. Chem. Eng. Commun. 1987, 157, 233–243. [Google Scholar] [CrossRef]
- Stein, S.E.; Brown, R.L. Estimation of Normal Boiling Points from Group Contributions. J. Chem. Inf. Comput. Sci. 1994, 34, 581–587. [Google Scholar] [CrossRef]
- Shelley, P.D.; Bannan, T.J.; Worrall, S.D.; Alfarra, M.R.; Percival, C.J.; Garforth, A.; Topping, D. PetrocShelley/Measured_Solid_State_and_Sub_Cooled_Liquid_Vapour_Pressures_of_Benzaldehydes_Using_KEMS_Data_Set: Pre Release; Zenodo: Genève, Switzerland, 2020. [Google Scholar] [CrossRef]
- Staikova, M.; Wania, F.; Donaldson, D.J. Molecular polarizability as a single-parameter predictor of vapour pressures and octanol–air partitioning coefficients of non-polar compounds: A priori approach and results. Atmos. Environ. 2004, 38, 213–225. [Google Scholar] [CrossRef]
- Staikova, M.; Messih, P.; Lei, Y.D.; Wania, F.; Donaldson, J.D. Prediction of Subcooled Vapor Pressures of Nonpolar Organic Compounds Using a One-Parameter QSPR. J. Chem. Eng. Data 2005, 50, 438–443. [Google Scholar] [CrossRef]
- Liang, C.; Gallagher, D.A. QSPR Prediction of Vapor Pressure from Solely Theoretically-Derived Descriptors. J. Chem. Inf. Comput. Sci. 1998, 38, 321–324. [Google Scholar] [CrossRef]
- Schwarzenbach, R.P.; Gschwend, P.M.; Imboden, D.M. Environmental Organic Chemistry; John Wiley & Sons, Incorporated: Hoboken, NJ, USA, 2016; ISBN 9781118767238. [Google Scholar]
- Remko, M.; Polcin, J. Theoretical study of the hydrogen bonding ability of phenol and its ortho, meta and para substituted derivatives. Adv. Mol. Relax. Interact. Process. 1977, 11, 249–254. [Google Scholar] [CrossRef]
- Stymne, B.; Stymne, H.; Wettermark, G. Substituent Effects in the Thermodynamics of Hydrogen Bonding as Obtained by Infrared Spectrometry. J. Am. Chem. Soc. 1973, 95, 3490–3494. [Google Scholar] [CrossRef]
- Daubert, T.E.; Danner, R.P. Physical and Thermodynamic Properties of Pure Chemicals: Data Compilation; Hemisphere Pub. Corp.: New York, NY, USA, 1989. [Google Scholar]
- Yaws, C.L. Handbook of Vapor Pressure; Gulf Pub. Co.: Houston, TX, USA, 1994. [Google Scholar]


| Compound | Structure | CAS | Supplier |
|---|---|---|---|
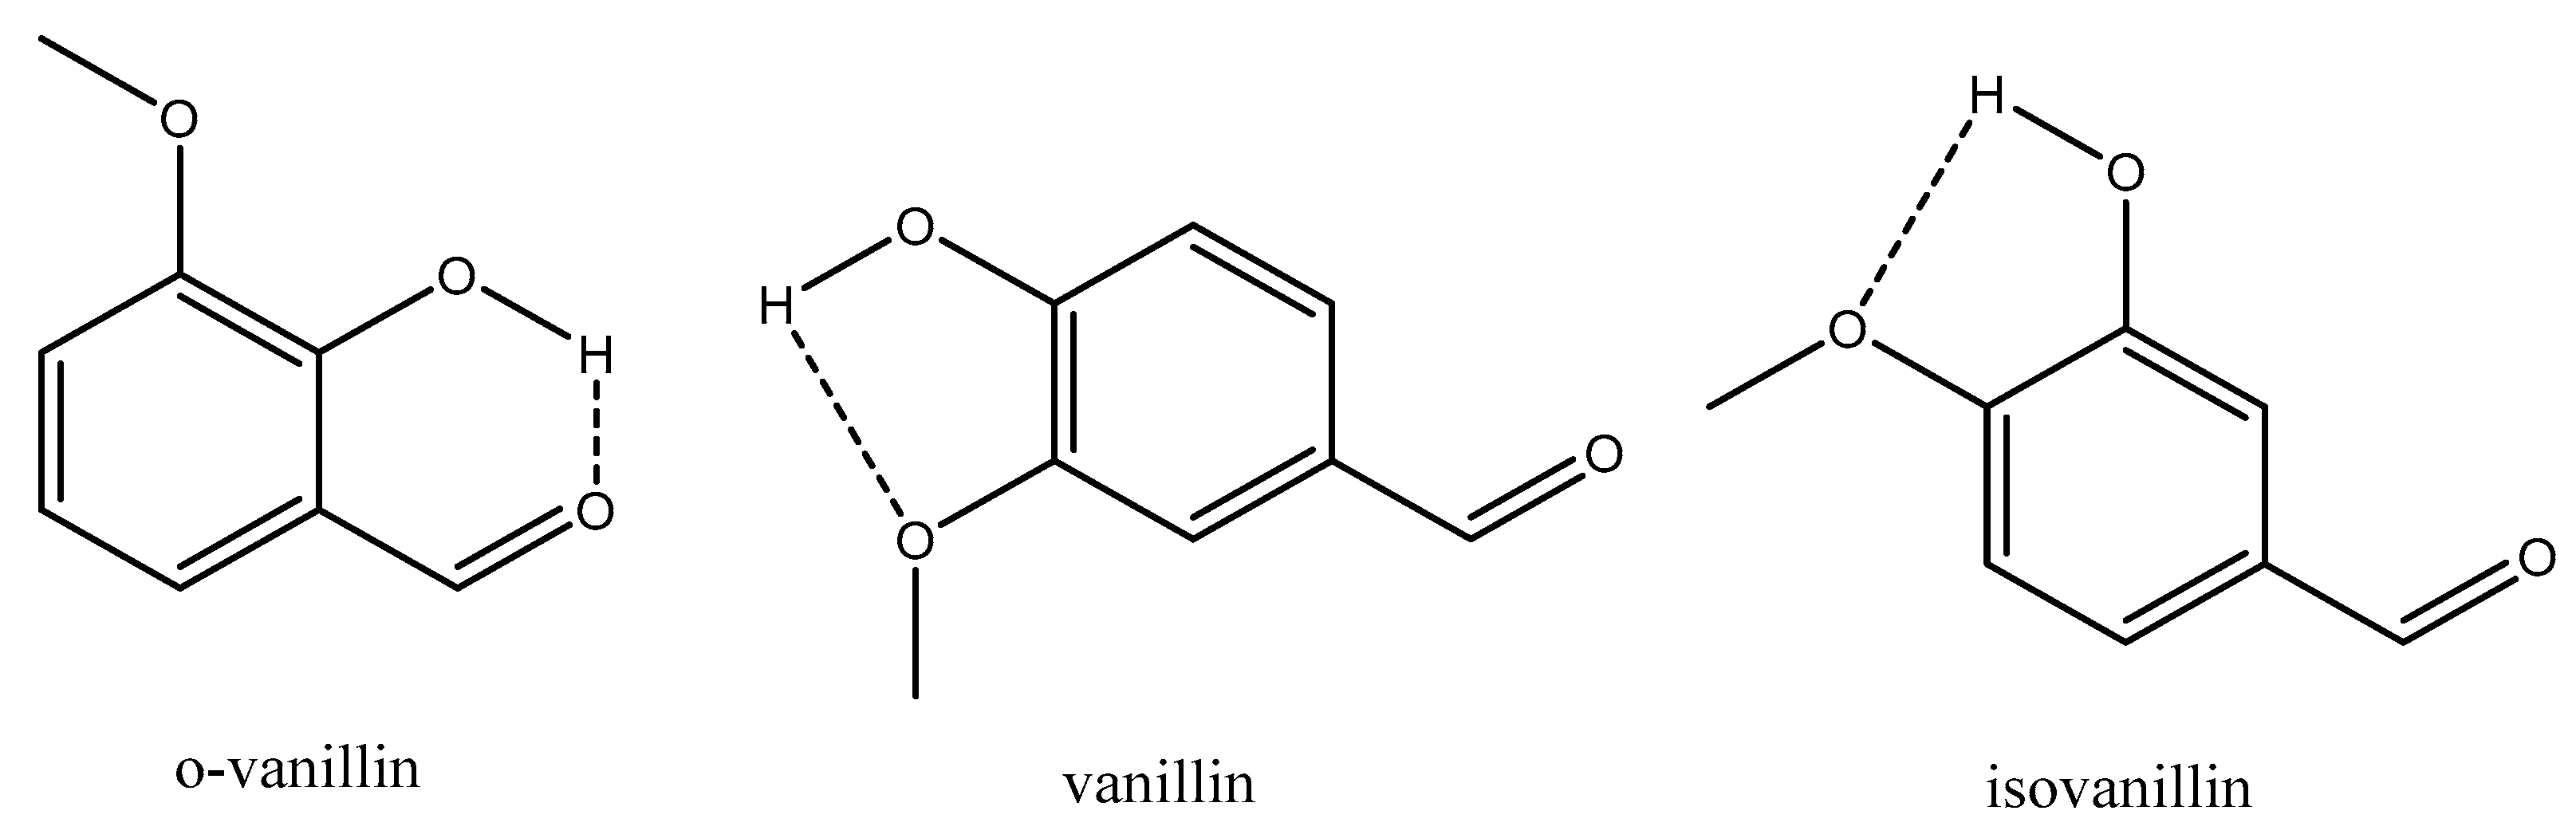
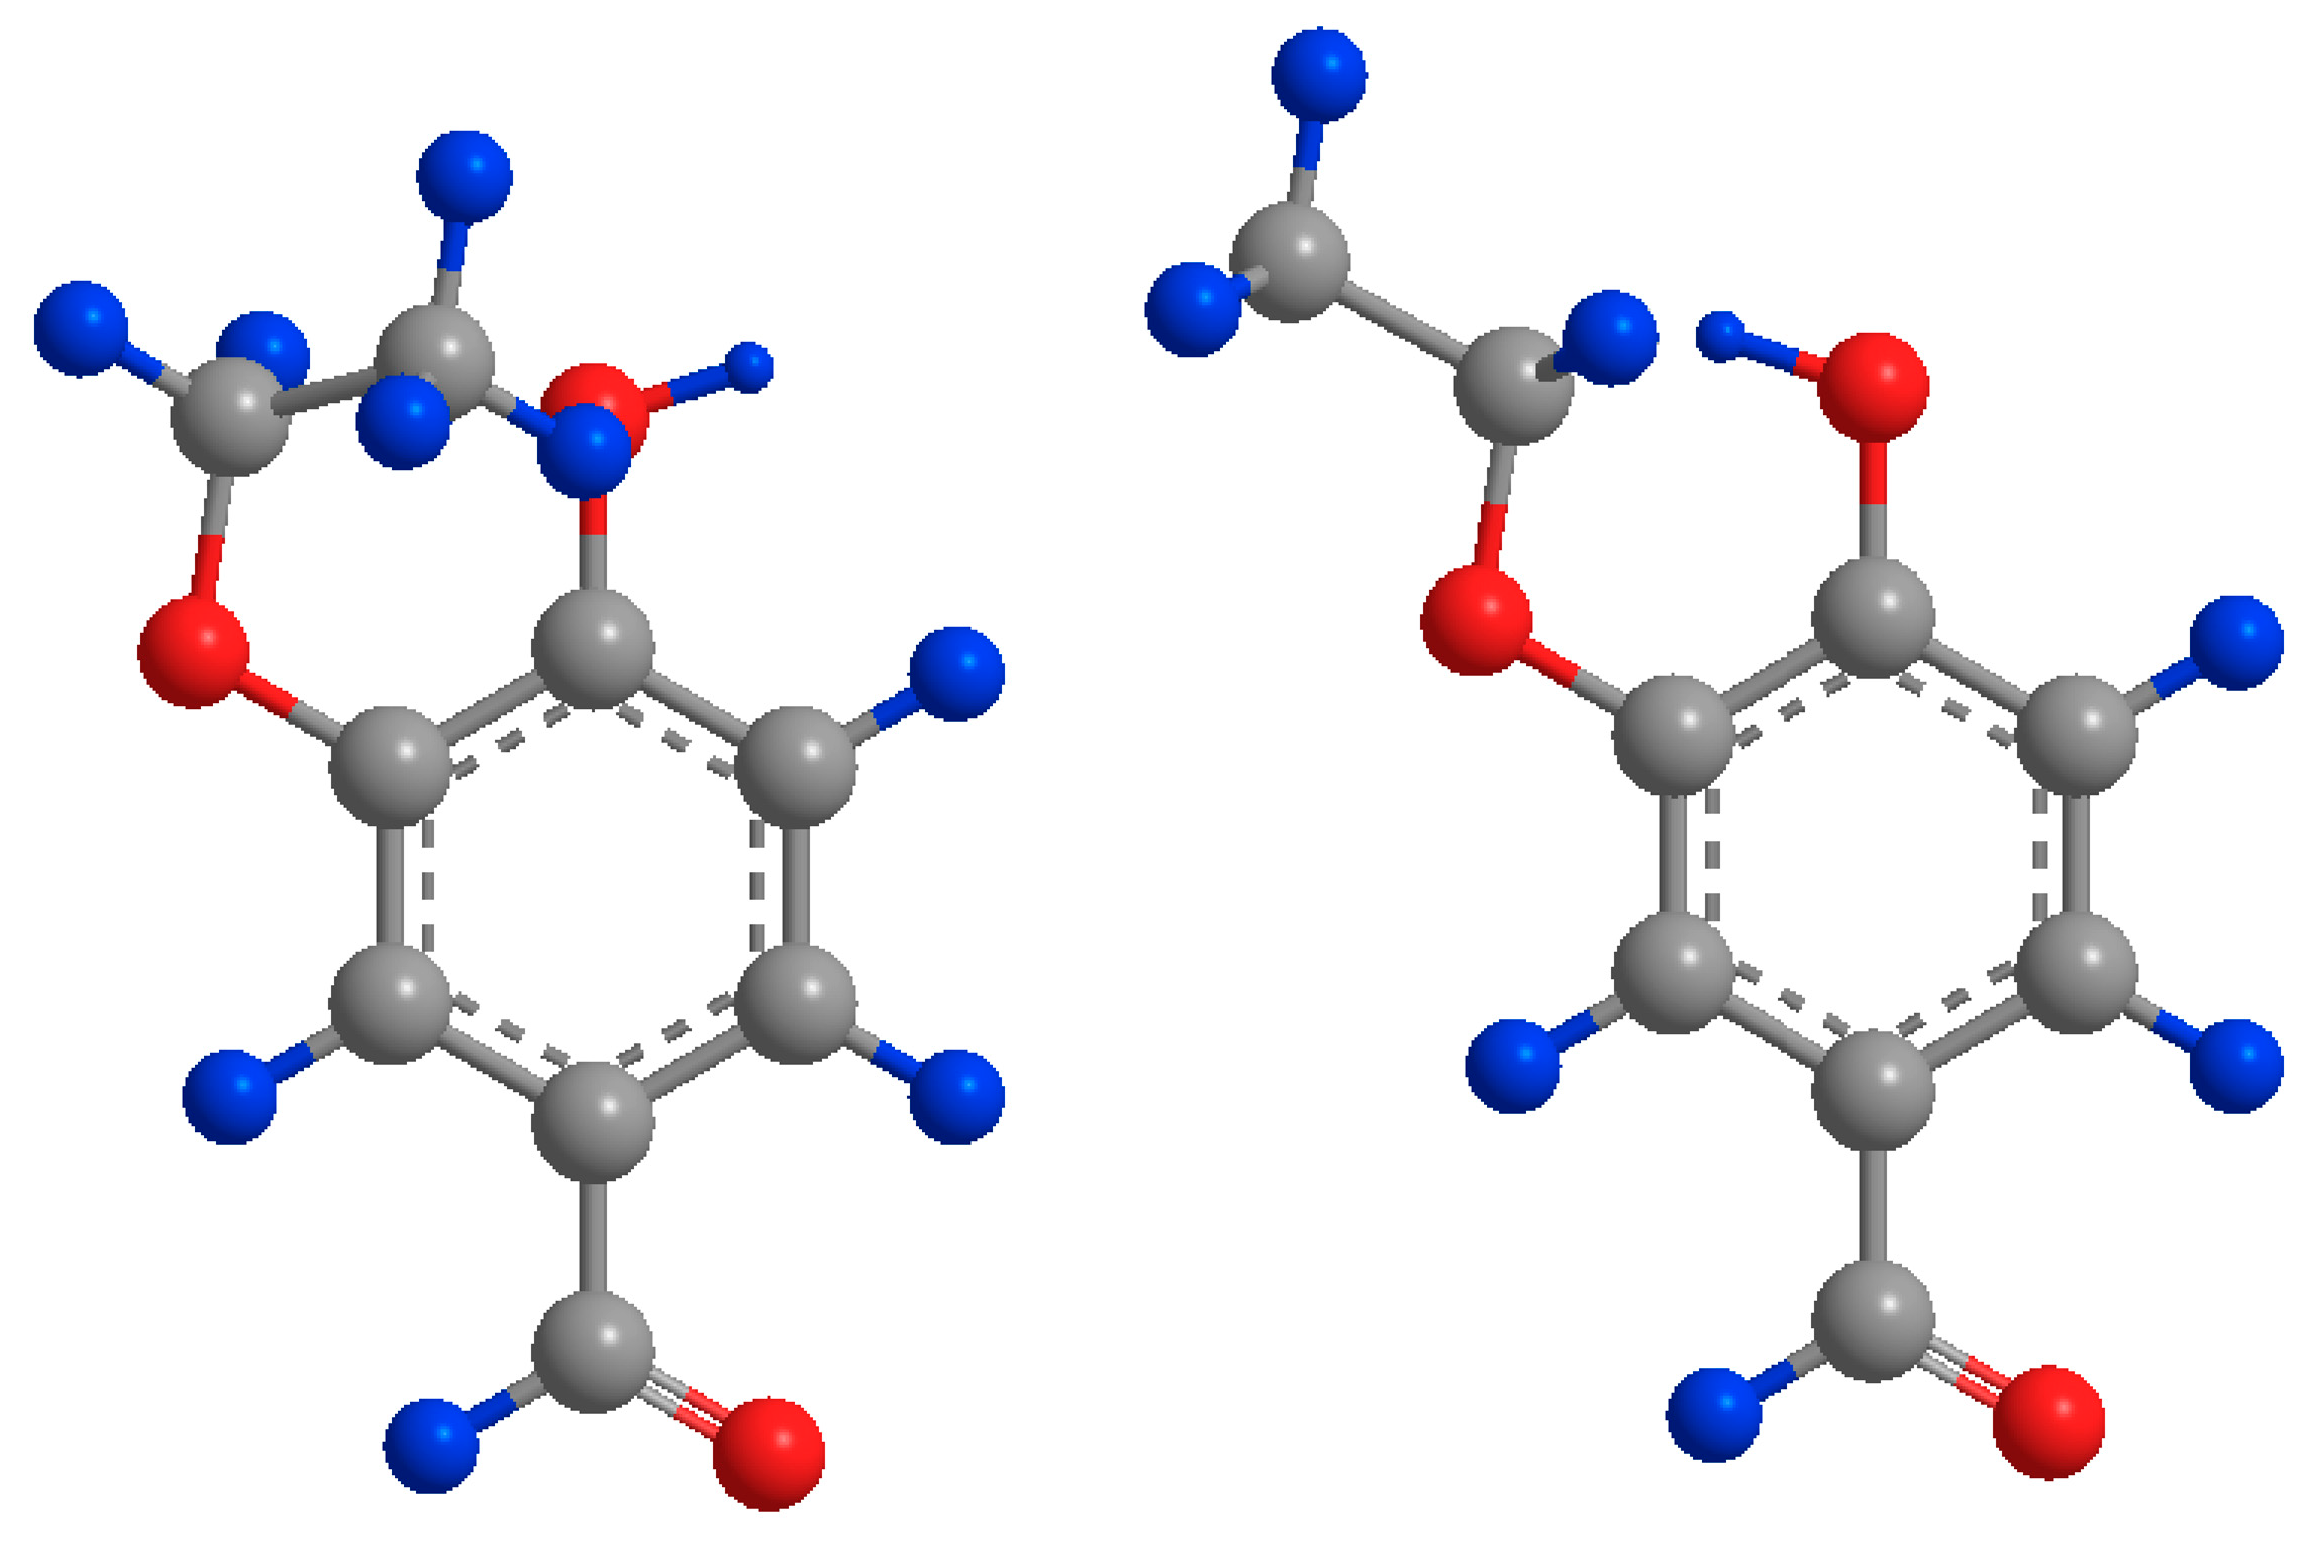
| Vanillin (4-hydroxy-3-methoxybenzaldehyde) |  | 121-33-5 | Sigma Aldrich |
| Isovanillin (3-hydroxy-4-methoxybenzaldehyde) |  | 621-59-0 | Sigma Aldrich |
| o-vanillin (2-hydroxy-3-methoxybenzaldehyde) |  | 148-53-8 | Fisher Scientific |
| 3-hydroxybenzaldehyde |  | 100-83-4 | Sigma Aldrich |
| 4-hydroxybenzaldehyde |  | 123-08-0 | Fisher Scientific |
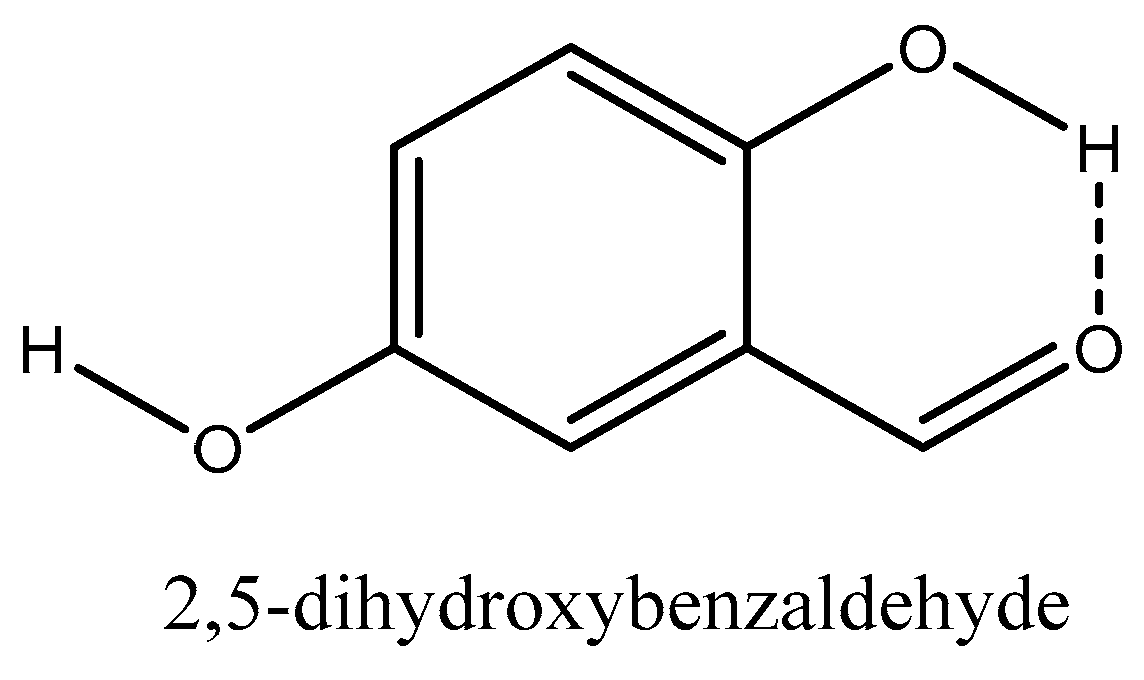
| 2,5-dihydroxybenzaldehyde |  | 1194-98-5 | Fisher Scientific |
| 3-ethoxy-4-hydroxybenzaldehyde |  | 121-32-4 | Sigma Aldrich |
| 2-formylbenzoic acid |  | 119-67-5 | Fisher Scientific |
| 4-dimethylaminobenzaldehyde |  | 100-10-7 | Fisher Scientific |
| 4-diethylaminobenzaldehyde |  | 120-21-8 | Sigma Aldrich |
| methyl-4-formylbenzoate |  | 1571-08-0 | Sigma Aldrich |
| terephthalaldehyde |  | 623-27-8 | Sigma Aldrich |
| 3,4-dimethoxybenzaldehyde |  | 120-14-9 | Sigma Aldrich |
| 2,6-dimethoxybenzaldehyde |  | 3392-97-0 | Alfa Aesar |
| 3-ethoxy-4-methoxybenzaldehyde |  | 1131-52-8 | Sigma Aldrich |
| 2,4-dimethoxy-3-methylbenzaldehyde |  | 7149-92-0 | Sigma Aldrich |
| 2,3,4-trimethoxybenzaldehyde |  | 2103-57-3 | Sigma Aldrich |
| Compound | P298 (Pa) | ΔHsub (kJ mol−1) | ΔSsub (J mol−1 K−1) |
|---|---|---|---|
| Methyl 4-formylbenzoate | 3.97 × 10⁻¹ | 75.98 | 247.24 |
| terephthalaldehyde | 2.34 × 10⁻¹ | 76.66 | 245.10 |
| 2,3,4-trimethoxybenzaldehyde | 1.11 × 10⁻¹ | 87.51 | 275.35 |
| 2,4-dimethoxy-3-methylbenzaldehyde | 1.09 × 10⁻¹ | 79.02 | 246.18 |
| 3,4-dimethoxybenzaldehyde | 6.64 × 10⁻² | 91.58 | 284.67 |
| 3-ethoxy-4-methoxybenzaldehyde | 5.72 × 10⁻² | 94.49 | 293.23 |
| 4-dimethylaminobenzaldehyde | 5.19 × 10⁻² | 95.42 | 295.11 |
| 4-diethylaminobenzaldehyde | 4.44 × 10⁻² | 92.28 | 283.70 |
| 2,6-dimethoxybenzaldehyde | 7.29 × 10⁻³ | 118.09 | 355.16 |
| o-vanillin | 3.88 × 10⁻¹ | 67.75 | 219.30 |
| 3-ethoxy-4-hydroxybenzaldehyde | 3.14 × 10⁻² | 100.35 | 307.95 |
| Vanillin | 2.14 × 10⁻² | 108.16 | 330.77 |
| 2,5-dihydroxybenzaldehyde | 1.63 × 10⁻² | 102.50 | 309.66 |
| 3-hydroxybenzaldehyde | 1.58 × 10⁻² | 109.90 | 334.17 |
| 4-hydroxybenzaldehyde | 5.86 × 10⁻³ | 107.76 | 318.80 |
| Isovanillin | 3.43 × 10⁻³ | 119.00 | 352.12 |
| 2-formylbenzoic acid | 1.11 × 10⁻³ | 114.82 | 328.51 |
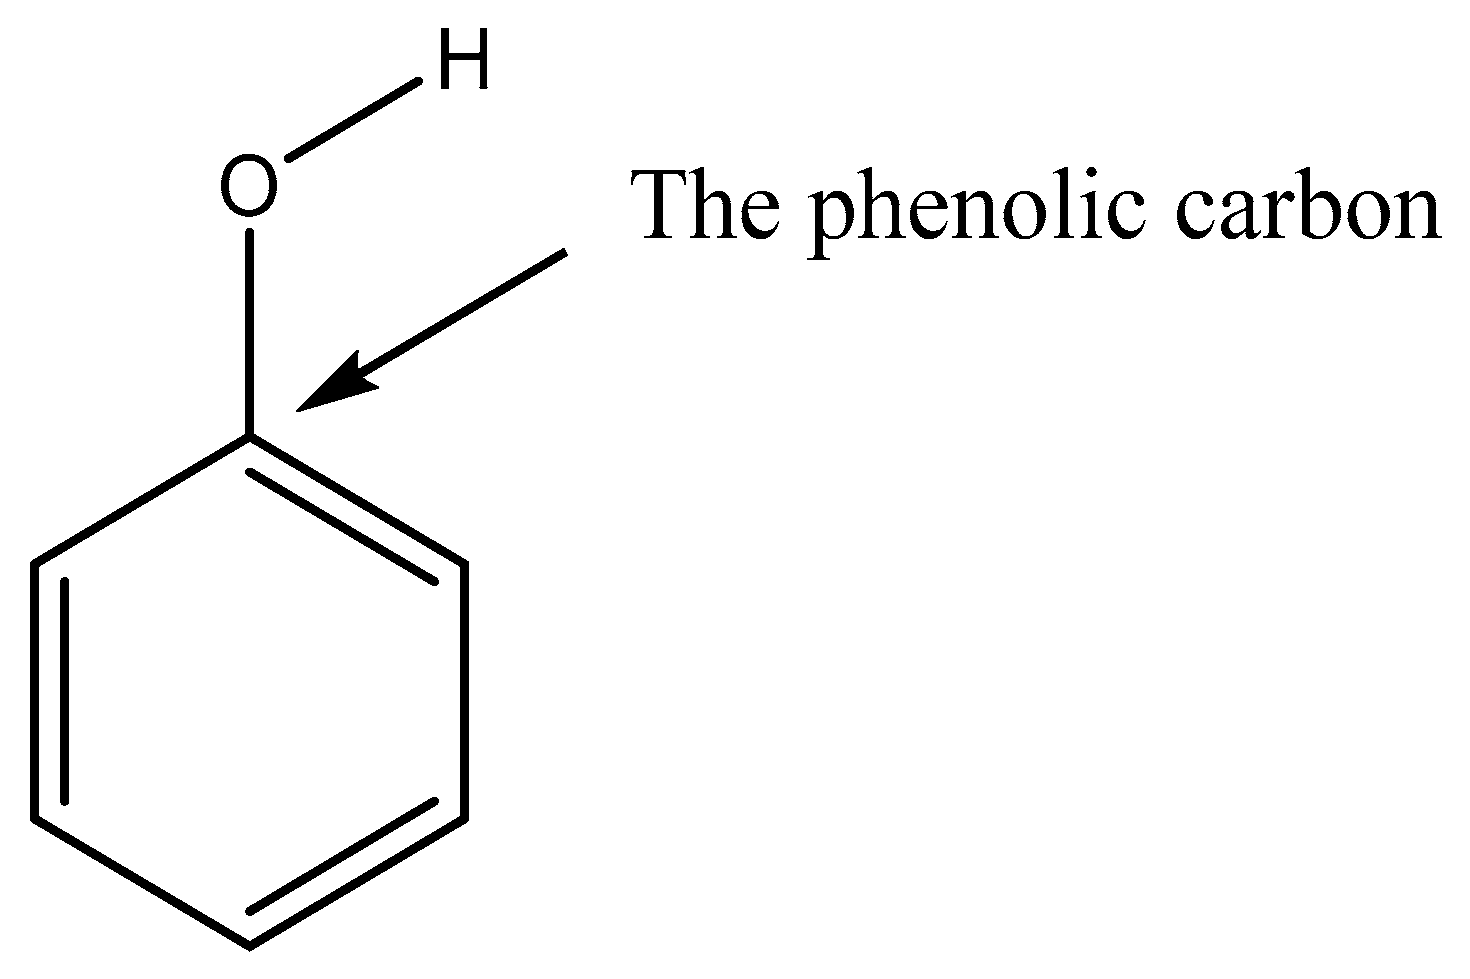
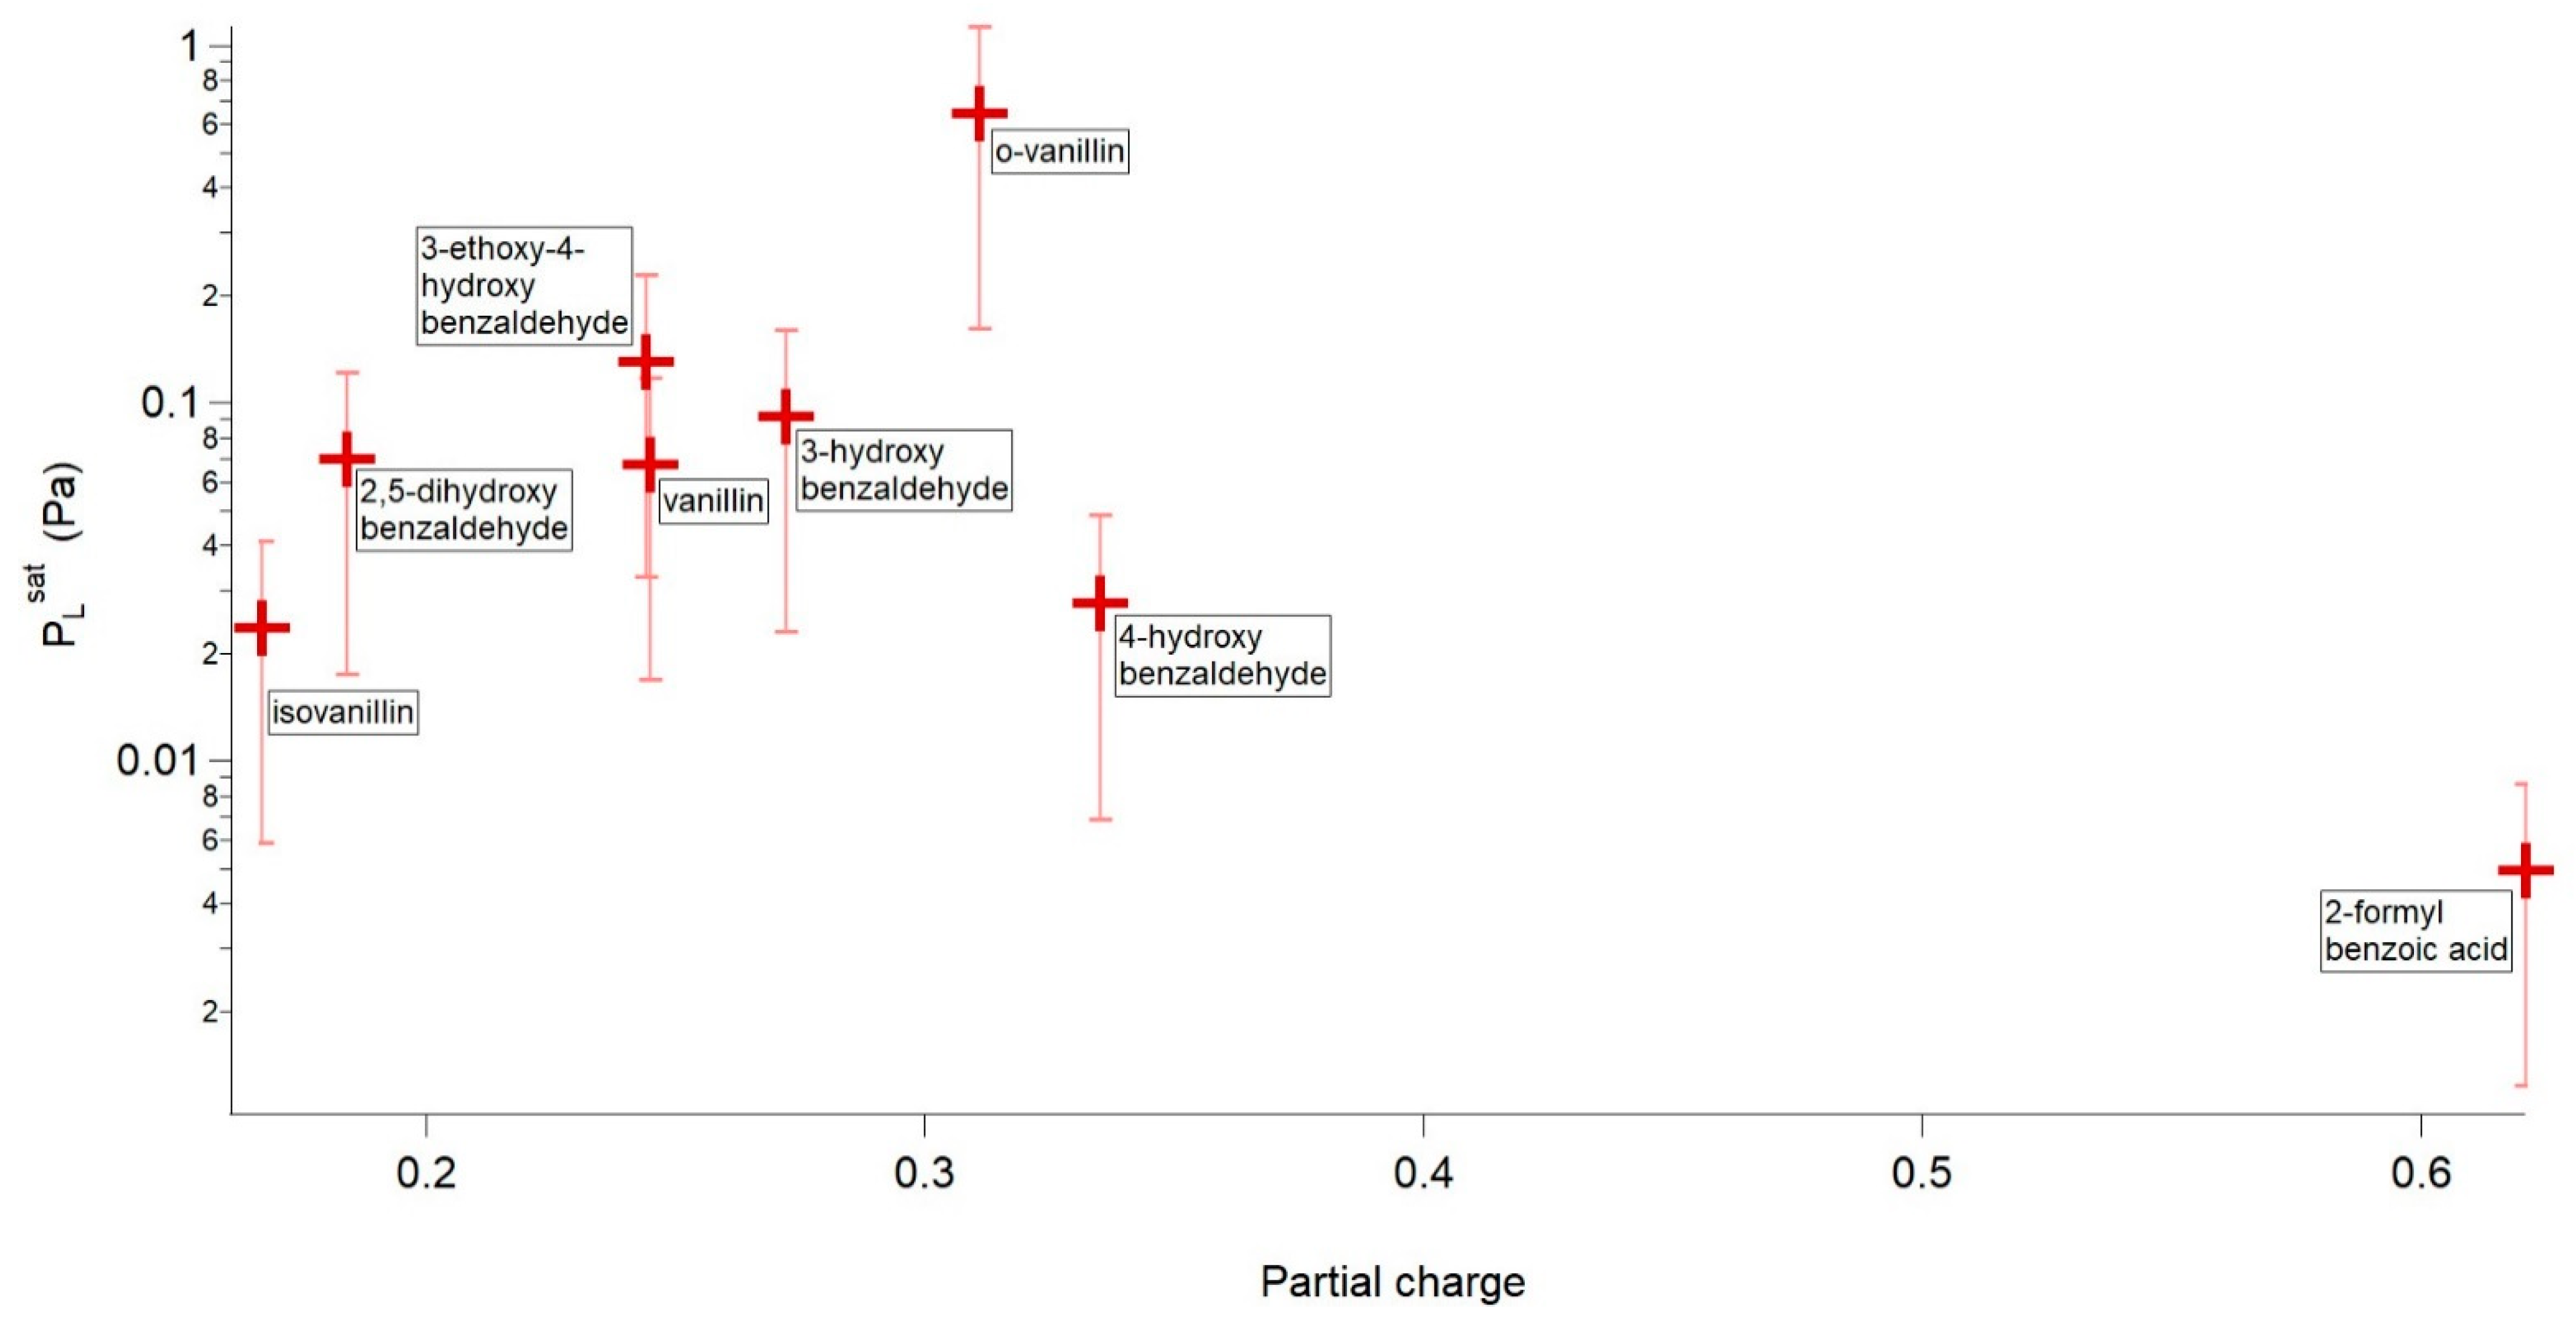
| Compound | P298 (Pa) | Tm (K) | ΔHfus (kJ mol−1) | ΔSfus (J mol−1 K−1) | Partial Charge of the Phenolic/Carboxylic Carbon |
|---|---|---|---|---|---|
| o-vanillin | 6.44 × 10⁻¹ | 320.09 | 19.06 | 59.55 | 0.311 |
| 3-ethoxy-4-hydroxybenzaldehyde | 1.31 × 10⁻¹ | 351.70 | 25.27 | 71.85 | 0.244 |
| 3-hydroxybenzaldehyde | 9.21 × 10⁻² | 378.98 | 23.19 | 61.20 | 0.272 |
| 2,5-dihydroxybenzaldehyde | 7.02 × 10⁻² | 373.15 | 20.16 | 54.02 | 0.329 (intra) 0.184 (inter) |
| Vanillin | 6.73 × 10⁻² | 356.82 | 18.88 | 52.90 | 0.245 |
| 4-hydroxybenzaldehyde | 2.78 × 10⁻² | 391.40 | 18.60 | 47.53 | 0.335 |
| Isovanillin | 2.36 × 10⁻² | 390.34 | 23.20 | 59.44 | 0.167 |
| 2-formylbenzoic acid | 4.96 × 10⁻³ | 375.12 | 20.36 | 54.28 | 0.621 |
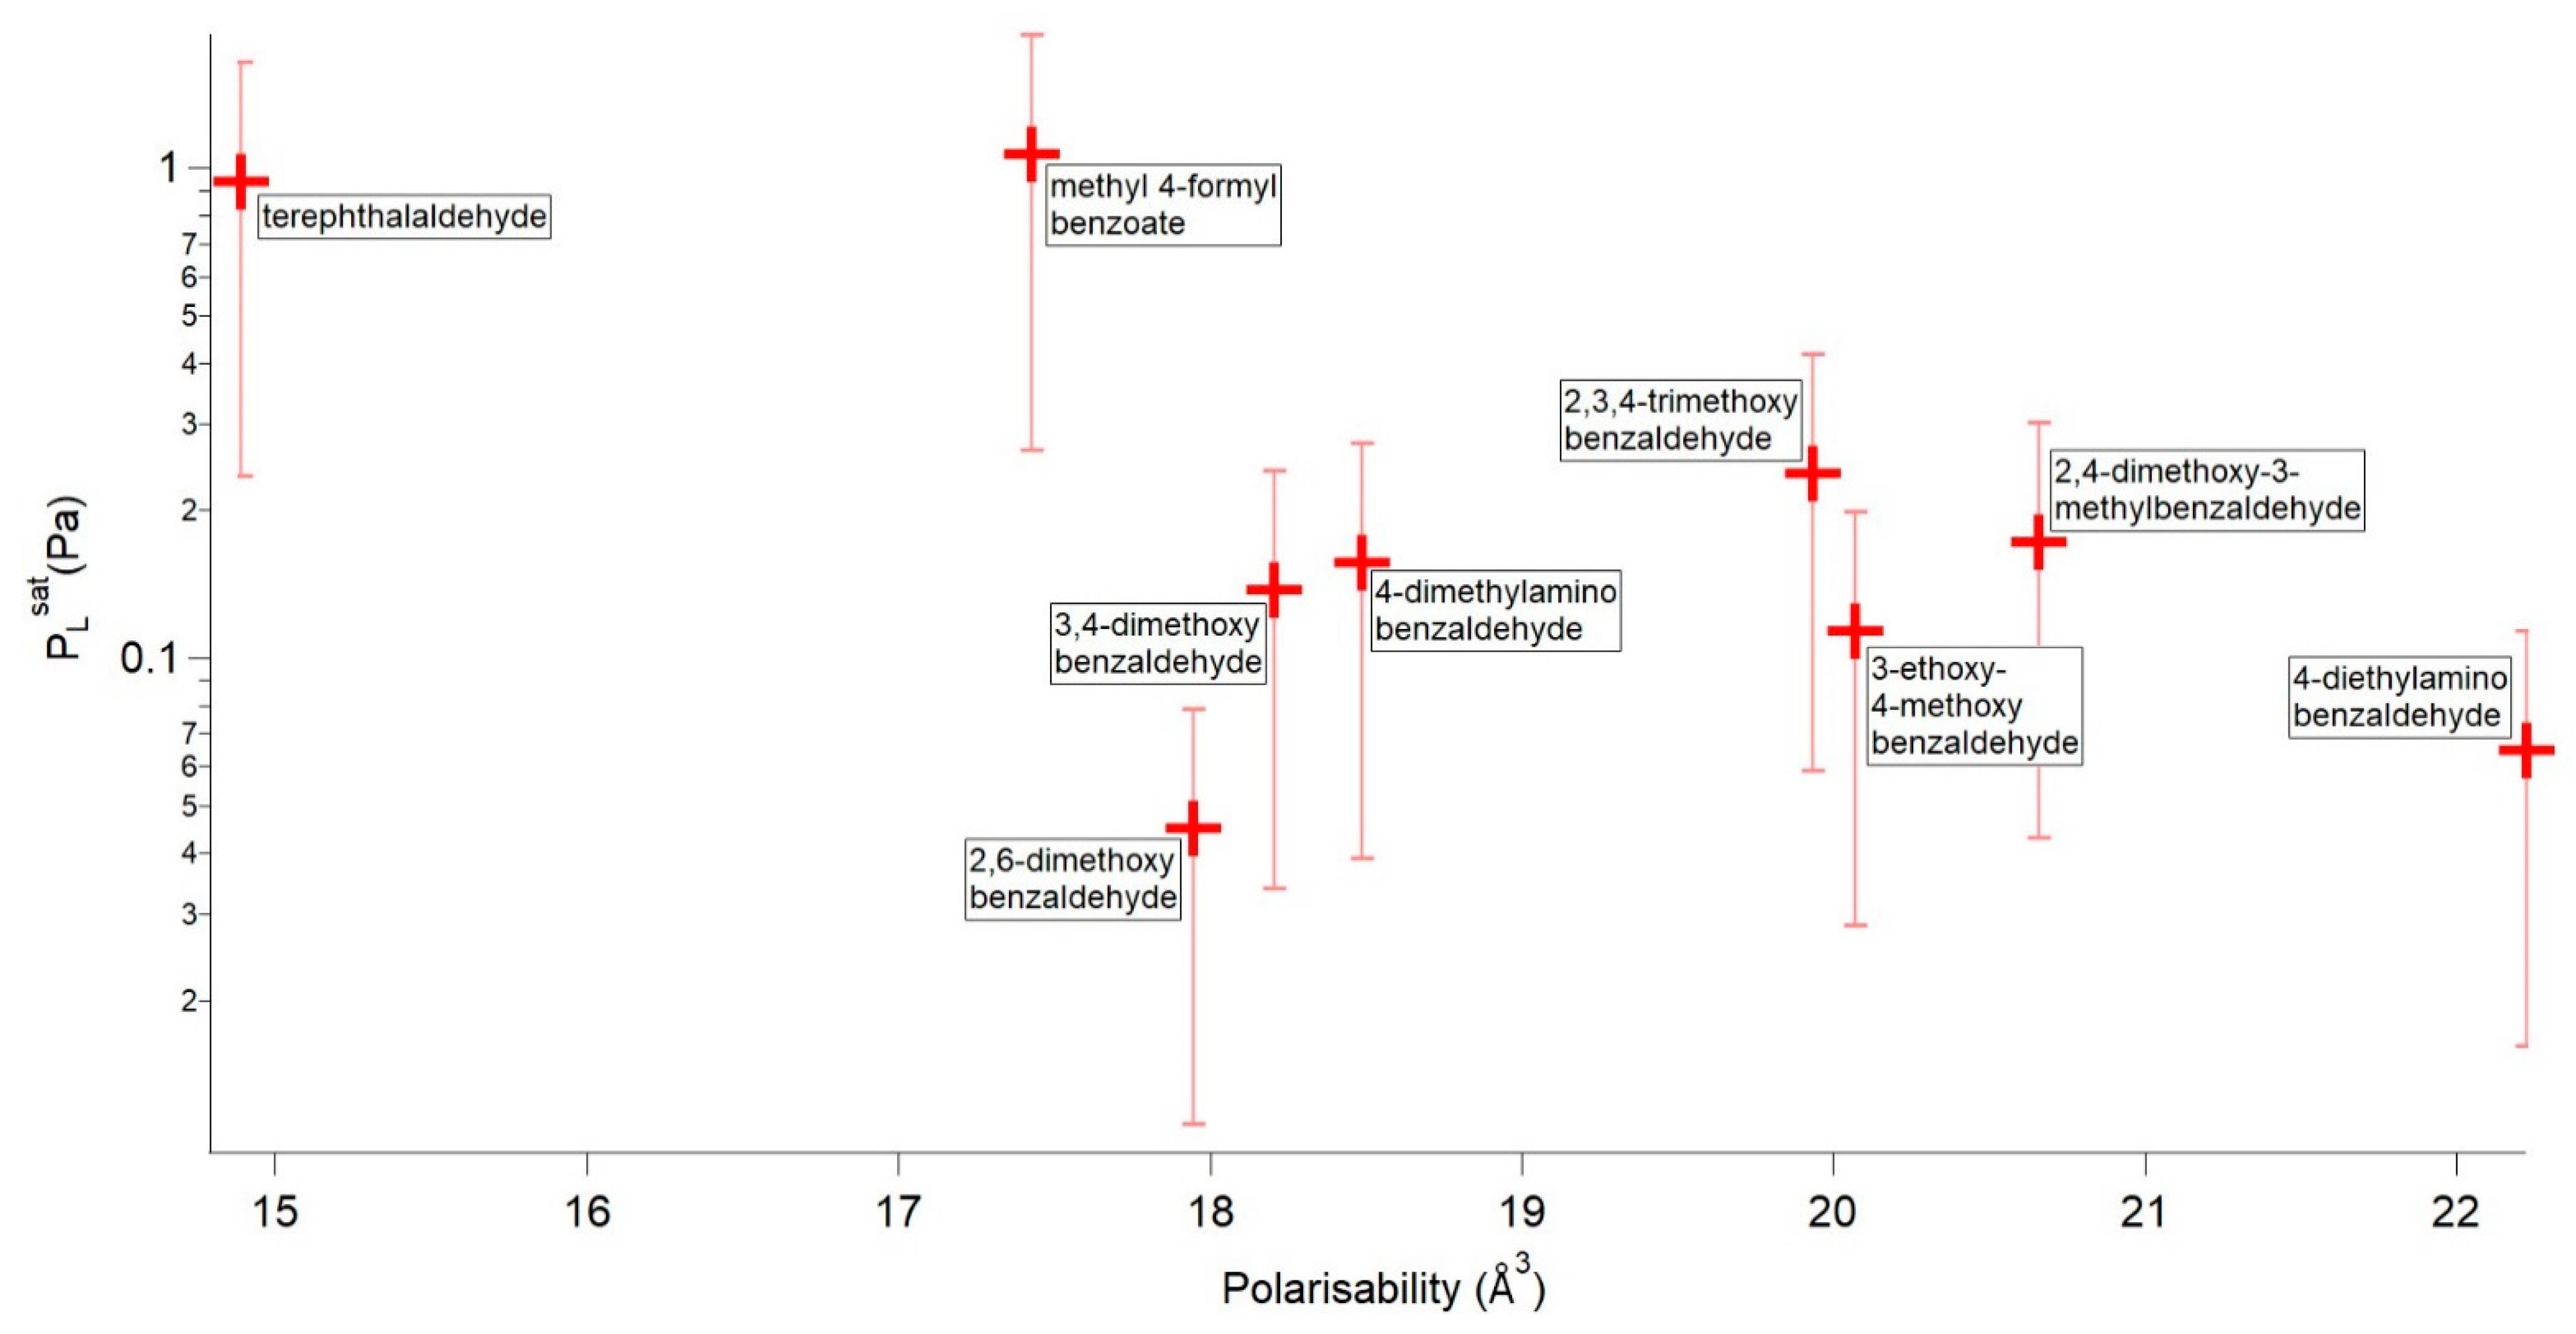
| Compound | P298 (Pa) | Tm (K) | ΔHfus (kJ mol−1) | ΔSfus (J mol−1 K−1) | αm (Å3) |
|---|---|---|---|---|---|
| methyl 4-formylbenzoate | 1.07 × 100 | 337.21 | 22.48 | 66.66 | 17.424 |
| terephthalaldehyde | 9.43 × 10⁻¹ | 390.06 | 16.82 | 43.11 | 14.888 |
| 2,4-dimethoxy-3-methylbenzaldehyde | 2.38 × 10⁻¹ | 327.43 | 22.81 | 69.66 | 19.931 |
| 2,3,4-trimethoxybenzaldehyde | 1.73 × 10⁻¹ | 313.63 | 22.64 | 72.17 | 20.658 |
| 4-dimethylaminobenzaldehyde | 1.57 × 10⁻¹ | 349.37 | 20.24 | 57.93 | 18.488 |
| 3,4-dimethoxybenzaldehyde | 1.38 × 10⁻¹ | 321.53 | 20.77 | 64.61 | 18.206 |
| 3-ethoxy-4-methoxybenzaldehyde | 1.14 × 10⁻¹ | 324.96 | 21.67 | 66.67 | 20.071 |
| 4-diethylaminobenzaldehyde | 6.49 × 10⁻² | 314.53 | 18.59 | 59.11 | 22.224 |
| 2,6-dimethoxybenzaldehyde | 4.50 × 10⁻² | 373.19 | 25.16 | 67.43 | 17.944 |
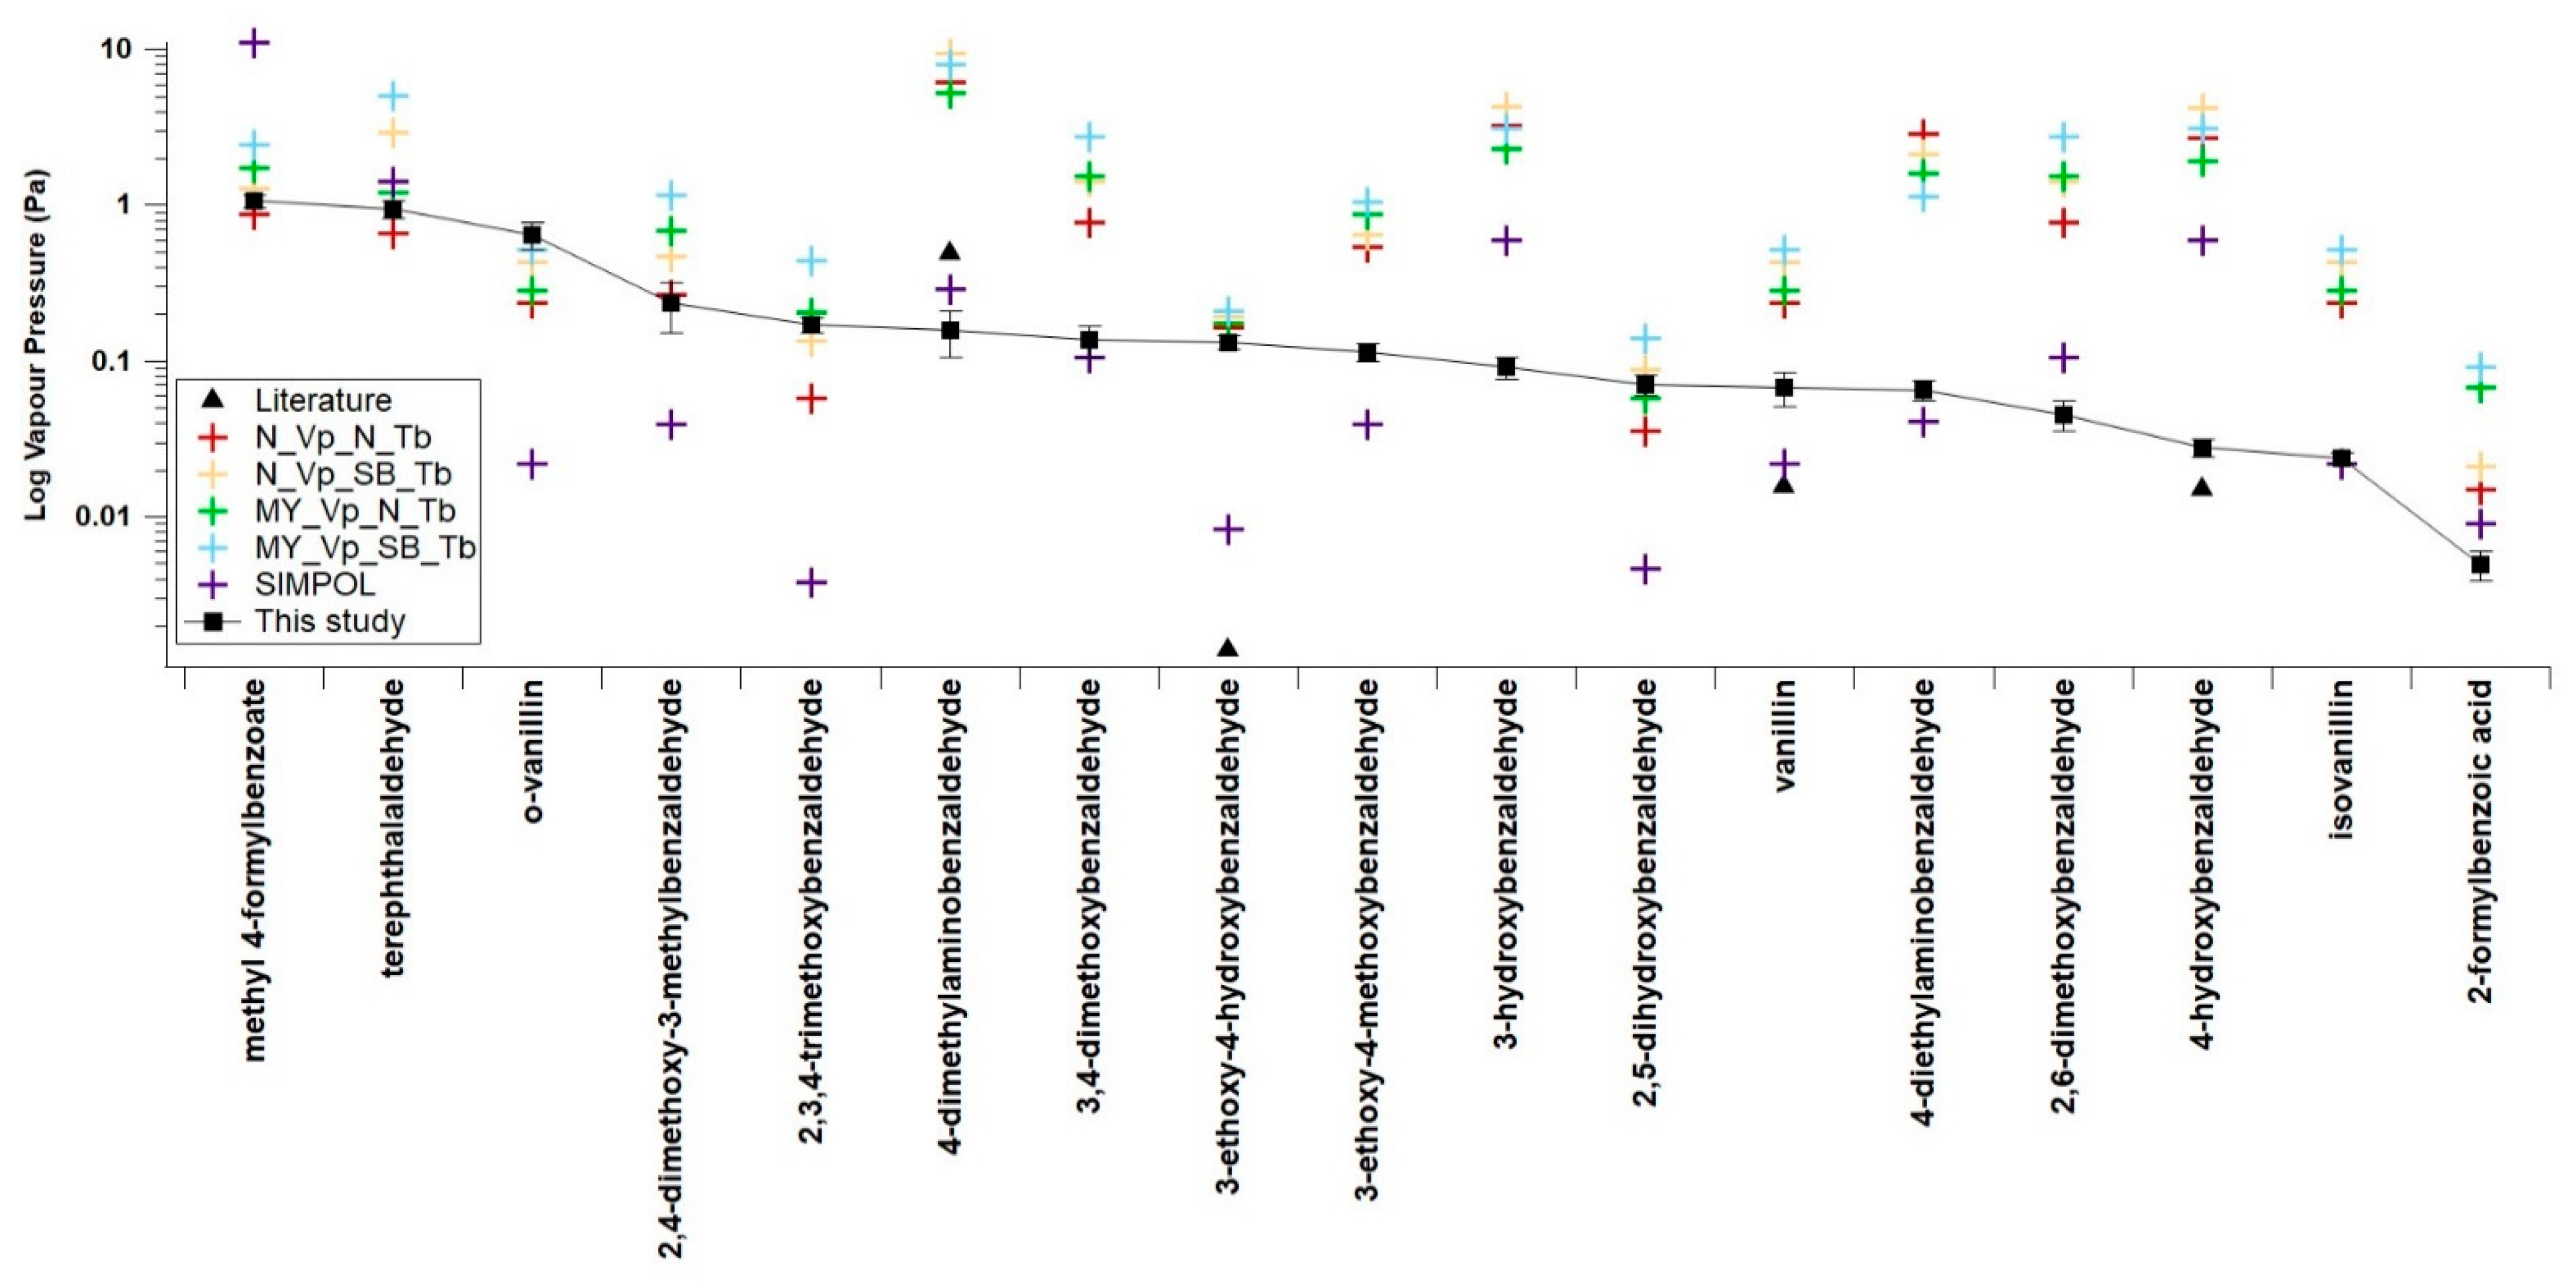
| N_VP_N_Tb | N_VP_SB_Tb | MY_VP_N_Tb | MY_VP_SB_Tb | SIMPOL | |
|---|---|---|---|---|---|
| Average difference (orders of magnitude) | 0.60 | 0.82 | 0.77 | 0.98 | −0.20 |
| Compounds | N_VP_N_Tb | N_VP_SB_Tb | MY_VP_N_Tb | MY_VP_SB_Tb | SIMPOL |
|---|---|---|---|---|---|
| This study | 0.60 | 0.82 | 0.77 | 0.98 | −0.20 |
| Non H-bonding—this study | 0.58 | 0.81 | 0.80 | 1.02 | −0.15 |
| H-Bonding—this study | 0.61 | 0.83 | 0.72 | 0.93 | −0.24 |
| Nitrobenzaldehyde from Shelley et al. (2020) [14] | 3.18 | 2.50 | 3.17 | 2.46 | 0.29 |
Publisher’s Note: MDPI stays neutral with regard to jurisdictional claims in published maps and institutional affiliations. |
© 2021 by the authors. Licensee MDPI, Basel, Switzerland. This article is an open access article distributed under the terms and conditions of the Creative Commons Attribution (CC BY) license (http://creativecommons.org/licenses/by/4.0/).
Share and Cite
Shelley, P.; Bannan, T.J.; Worrall, S.D.; Alfarra, M.R.; Percival, C.J.; Garforth, A.; Topping, D. Measured Solid State and Sub-Cooled Liquid Vapour Pressures of Benzaldehydes Using Knudsen Effusion Mass Spectrometry. Atmosphere 2021, 12, 397. https://doi.org/10.3390/atmos12030397
Shelley P, Bannan TJ, Worrall SD, Alfarra MR, Percival CJ, Garforth A, Topping D. Measured Solid State and Sub-Cooled Liquid Vapour Pressures of Benzaldehydes Using Knudsen Effusion Mass Spectrometry. Atmosphere. 2021; 12(3):397. https://doi.org/10.3390/atmos12030397
Chicago/Turabian StyleShelley, Petroc, Thomas J. Bannan, Stephen D. Worrall, M. Rami Alfarra, Carl J. Percival, Arthur Garforth, and David Topping. 2021. "Measured Solid State and Sub-Cooled Liquid Vapour Pressures of Benzaldehydes Using Knudsen Effusion Mass Spectrometry" Atmosphere 12, no. 3: 397. https://doi.org/10.3390/atmos12030397
APA StyleShelley, P., Bannan, T. J., Worrall, S. D., Alfarra, M. R., Percival, C. J., Garforth, A., & Topping, D. (2021). Measured Solid State and Sub-Cooled Liquid Vapour Pressures of Benzaldehydes Using Knudsen Effusion Mass Spectrometry. Atmosphere, 12(3), 397. https://doi.org/10.3390/atmos12030397