Article

Testing the Drop-Size Distribution-Based Separation of Stratiform and Convective Rain Using Radar and Disdrometer Data from a Mid-Latitude Coastal Region

1
Department of Electrical and Computer Engineering, Colorado State University, Fort Collins, CO 80523, USA
2
NASA GSFC Wallops Flight Facility, Wallops Island, VA 23337, USA
3
Science Systems and Applications, Inc., Lanham, MD 20706, USA
*
Author to whom correspondence should be addressed.
Atmosphere 2021, 12(3), 392; https://doi.org/10.3390/atmos12030392
Submission received: 29 January 2021 / Revised: 13 March 2021 / Accepted: 15 March 2021 / Published: 17 March 2021

Abstract

:
Stratiform and convective rain are associated with different microphysical processes and generally produce drop-size distributions (DSDs) with different characteristics. Previous studies using data from (a) a tropical coastal location, (b) a mid-latitude continental location with semi-arid climate, and (c) a sub-tropical continental location, found that the two rain types could be separated in the NW–Dm space, where Dm is the mass-weighted mean diameter and NW is the normalized intercept parameter. In this paper, we investigate the same separation technique using data and observations from a mid-latitude coastal region. Three-minute DSDs from disdrometer measurements are used for the NW- versus Dm-based classification and are compared with simultaneous observations from an S-band polarimetric radar 38 km away from the disdrometer site. Specifically, RHI (range-height indicator) scans over the disdrometer were used for confirmation. Results show that there was no need to modify the separation criteria from previous studies. Three-minute DSDs from the same location were used as input to scattering calculations to derive retrieval equations for NW and Dm for the S-band radar using an improved technique and applied to the RHI scans to identify convective and stratiform rain regions. Two events are shown as illustrative examples.

1. Introduction

The importance of classification of rain types as convective and stratiform is related to the very different microphysical and kinematic processes that go into the formation of their respective drop-size distributions (DSD). It is well-known (e.g., from three-dimensional (3D) radar data [1]) that stratiform rain is defined by large areas of weak vertical air motion, with the dominant feature being the reflectivity bright band where snow aggregates (falling slowly, ~1 m/s) melt to form rain, whereas convective rain forms from melting graupel and hail in compact reflectivity “cells” within strong downdrafts. The seminal article [1] used texture-related (peakedness and intensity) algorithms based on reflectivity to detect convective rain, and by their definition, the remaining areas are stratiform. This leads to different methods of estimating rain rates for hydrology as well as calculating the latent heating (vertical) profiles in the stratiform and convective rain areas [2]. Houze [3] has clearly shown the impact of the latent heating profiles on the evolution of mesoscale convective systems (MCS). Furthermore, while the stratiform rain rates are typically <10 mm/h, their large areal extent and long duration (e.g., MCS, outer rain bands of hurricanes) relative to convective rain make the classification and areal rainfall an important topic of study.
Differences in drop-size distributions (DSDs) between stratiform and convective rain have also been examined in the past by several researchers, e.g., References [4,5,6], who used ground-based disdrometer data, as well as References [7,8,9,10], who used aircraft data (from particle imaging probes). More recently, Bukovcic et al. [11] used DSD data from a two-dimensional (2D) video disdrometer (2DVD, [12,13]) in central Oklahoma to separate stratiform and convective rain by applying a multi-variable Bayesian classification algorithm, whereas Bringi et al. [14] used dual-polarized radar, dual-frequency profilers, and ground-based Joss-Waldvogel disdrometer data to investigate the use of two main parameters governing the DSD characteristics for the separation. Specifically, they found that the two rain types could be separated in the NW–Dm space, where Dm is the mass-weighted mean diameter and NW is the normalized intercept parameter. The data used in that study (see also Reference [15]) were obtained from Darwin, Australia, which is a tropical coastal location. Many studies related to precipitation classification, radar rainfall algorithms, etc., have been conducted in the Darwin area due, in part, to the availability of a long record of the C-band Polarimetric (C-POL) radar data (~15 years, Keenan et al. [16]) in addition to a well-maintained fairly dense rain gage network. For example, Penide et al. [17] compared the DSD-based classification methodology in References [14,15] with the reflectivity texture-based method of Steiner et al. [1] over a much larger period (than in References [14,15]) encompassing two wet seasons in Darwin. They found that the DSD-based classification was superior to the texture-based method for convective rain types (i.e., the texture method searches for areas of convective rain and if any area does not satisfy the necessary condition of convective then it is classified as stratiform). Penide et al. [17] had access to superior data quality of the upgraded C-POL polarimetric radar and accurate methods of correction of rain attenuation. They proposed a modification of the texture criteria by adjusting the intensity and peakedness in Reference [1] to match the detection statistics of convective and stratiform rain with References [14,15]. In retrospect, it is remarkable that two completely different algorithms and their built-in assumptions could produce reasonably similar statistics. However, Penide et al. [17] also indicated that the DSD-based method was potentially more stable and robust with respect to rainfall in the mid-latitudes, for example, relative to the texture-based method, but this had to be shown in other climatologies. Later on, the DSD-based separation technique was tested using data and observations from Huntsville, AL, USA [18], a sub-tropical continental location, as well as Greeley, CO, USA [19], a mid-latitude continental location with semi-arid climate. For the Huntsville events, 2DVD data were used for the separation method and validation was provided by simultaneous observations from an ultra-high frequency (UHF) Doppler profiler collocated with the 2DVD. For the Greeley events, composited DSD data from 2DVD and an optical array probe called the Meteorological Particle Spectrometer (MPS, [20,21,22]) were used and validation was provided by range-height indicator (RHI) scans from an S-band polarimetric radar (named CSU-CHILL radar, [23]) over the ground-based instruments.
In this paper, we investigate the same separation technique using data and observations from a mid-latitude coastal region, situated in the Delmarva peninsula in Virginia, USA. As with the Greeley events, measurements from a 2DVD and an MPS were used to construct the full DSD spectra, and the NW- versus Dm-based separation is compared with simultaneous observations from an S-band polarimetric radar located 38 km away from the disdrometer site. Three-minute DSDs are used for the classification, and RHI radar scans over the disdrometer are used for testing. Three very different rain events are considered.

2. Instrumentation and Observations

2.1. DSD

The instrumentation location belongs to the NASA Wallops Flight Facility (WFF) and is part of the ground validation activities in support of the Global Precipitation Measurement (GPM) Mission [24] as well as studies on precipitation microphysics, e.g., Reference [25]. The ground instruments include many different types of disdrometers and rain gauges, including an MPS, several 2DVDs, and a Pluvio rain gauge [26], all collocated at the same coastal site. The available data record for instrumentation varies from a period of months (for the case of MPS) to years (for the 2DVDs). The MPS and one of the 2DVD units is installed within a 2/3 scaled double-wind fence (DFIR, [27]) to reduce the effects of high winds on the measurements of small drops. The MPS is used for relatively accurate measurements of drop concentration of small drops (<1 mm drop diameter), and the 2DVD provided more accurate measurements for the larger diameters, i.e., >1 mm. The composite or the full DSD is then constructed using the MPS and the 2DVD measurements over, a 3-min time interval. The overlap region in the DSD measurements has been investigated before [28], and the study found that the best agreement between the two instruments was obtained in the diameter range of 0.75–1 mm.

2.2. Radar Observations

The polarimetric radar used for validation in this study is the NASA Polarimetric (NPOL) radar [29] located NNE of the disdrometer site, as shown in Figure 1. NPOL is NASA’s premier S-band dual-polarization weather radar and is operated near NASA Wallops Flight Facility in Newark, MD, USA. NPOL has operated for most weather events at this location since field deployment in 2015. Basic attributes of NPOL are wavelength of 10.65 cm, operating frequency of 2700–2900 MHz, and variable pulse repetition frequency (PRF) with a 0.95-degree beam width. NPOL can operate with horizontal and vertical polarization in both simultaneous and alternating modes. For the data represented in this study, NPOL operated in simultaneous transmit and receive (STAR) mode, with 0.8 µs pulse width and PRF of 1100 Hz. The radar has a prime-focus parabolic reflector that is 8.5 m in diameter. The azimuth of the disdrometers (shown in orange) from the radar is 197 degrees. The radar scan strategy included volume scans, RHI scans with azimuths of 195, 197, and 199 degrees, and for Zdr calibration, 90-degree elevation ‘birdbath’ scans. This sequence was repeated regularly, every 7 min and 15 s. RHI scans along the 197-degree azimuth were chosen for classifying stratiform or convective rain in this study. Specifically, vertical profiles of reflectivity (Zh), differential reflectivity (Zdr), and co-polar correlation coefficient (ρhv) were extracted over the disdrometer site to establish whether the melting layer can be clearly distinguished well above the ground level.

2.3. Rain Events

We consider three events here: (i) a category-1 Hurricane event (Dorian), whose outer rainbands passed over the WFF site on 06 September 2019 [30,31], (ii) a squall-like event with an ‘ill-defined’ line convection which occurred on 14 October 2019, and (iii) a more widespread event with small embedded convective cells on 16 October 2019.
For all events, the NPOL radar had performed the regular routine scans. Figure 2 shows two examples of RHI scans over the disdrometer, one on 16 October (Zh in panel (a) and Zdr in panel (b)) and the other on 14 October 2019 (Zh in panel (c) and Zdr in panel (d)). The top two panels show stratiform rain over the disdrometer site (which is marked with black lines), indicated by the clear presence of a radar bright band due to the melting layer between 3 and 3.5 km height above ground level (a.g.l.). The melting layer is visible in both Zh and Zdr. By contrast, panels (c) and (d) in Figure 2 do not show any radar bright band in the entire RHI scan, thus it can be classified as convective rain. Panels (e) and (f) show the 1 min composite DSDs measured by the disdrometers at the same times as panels (a)/(b) and (c)/(d), respectively. For the latter, larger drops can be seen, with maximum recorded diameter (equi-volume drop diameter, Deq) of nearly 4 mm, whereas for the former, it is just over 3 mm.
Two further examples are given in Figure 3, where panels (a) and (b) correspond to the Dorian outer rain bands on 6 September 2019, showing a very clear bright band between 4 and 4.5 km a.g.l., and panels (c) and (d) show another convective rain example that occurred on 14 October 2019. Once again, the black lines indicate the location of and over the disdrometers. Vertical profiles of Zh and ρhv over the disdrometer site for the stratiform rain case (panels (a)/(b) are shown in panels (e) and (f), and those for the convective rain case (panels (c)/(d)) are shown in panels (g) and (h)). In both cases, vertical profiles were extracted from all radar pixels over a 37 to 39 km range interval, i.e., the column size is ±1 km along the x-axis and 0 to 6 km along the y-axis. Clear differences are seen: (i) the Zh profile for the stratiform rain shows a very clear peak at around 4 km height, unlike the convective rain, where the Zh profiles do not show any clearly defined features. In this particular example, the narrow convective towers are shallow, with echo tops barely reaching 5 km a.g.l., but the reflectivity is high, exceeding 40 dBZ in the convection. A cloud deck with Zh around 10–20 dBZ is possibly ‘seeding’ the convective tower, with small crystals which form embryos leading to rapid intensification. It is tempting to infer that warm rain processes are dominating without any deep melting layer leading to vertical profiles of Zh seen in panel (g). The ρhv profiles in panel (f) show a ‘dip’ just below the melting layer in panel (e) for the stratiform rain due to an increase in variance of particle shapes and dielectric constant. Whereas the convective rain profiles in panel (h) show almost constant ρhv of 0.99 throughout the tower and this, in fact, supports the inference of warm rain processes dominating the tower (the ρhv can be approximated by Equation (7.42) on page 404 of Reference [32], as 0.992 if the variance in axis ratio is ≈0.01 and the Z-weighted mean axis ratio ≈ 0.8).

3. NW Versus Dm Variations

The 1 min DSDs for the four cases in Figure 2 and Figure 3 were used to derive the DSD moments from which the parameters Nw and Dm are estimated using well-established formulas, e.g., References [28,30], but for convenience are given here. If we denote the nth moment by Mn, i.e.,
M n =   0 D max D m   N ( D )   dD
where D is the drop diameter (often in mm), N(D) is the drop concentration (often in units of mm−1 m−3), and Dmax is the maximum drop diameter for integration, then
D m = ( M 4 M 3 )
and NW is given by:
N W =   ( 4 4 6 )   M 3 D m 4
The calculated values of NW versus Dm are shown as ‘+’ points in Figure 4 and marked with the Figure number corresponding to the four events. For the stratiform rain events, 3 min DSDs were used, and for convective rain events, 1 min DSDs were used (note that the choice of time interval will largely depend on the decorrelation time of the DSD parameters, which in turn will depend on the scale of the precipitation cell and its advection speed). The red dashed line represents the stratiform–convective rain separation line from the previous studies [14,15,18]. The points for Figure 2a and Figure 3a lie below the separation line (hence categorized as stratiform rain) and those for Figure 2c and Figure 3c lie above the separation line (thus categorized as convective rain). These are indeed consistent with the radar observations for all four events, but it is also evident that the points are quite close to the separation line in spite of their obvious differences in their radar signatures. Thus, the index defined below does not necessarily correlate with the strength or weakness of the radar signatures of stratiform and convective rain. Also, in our previous studies [14,15,18], a simple ‘index’ parameter, i (empirically-derived), was used to indicate whether the NW versus Dm lie above or below the separation line. Value of i in each case is given by:
i = log 10 ( N W est )   log 10 ( N W sep )
where
log 10 ( N W sep )   = c 1 D m +   c 2
and N W est is the estimated NW from the measured DSDs (say over 1 or 3 min). Values of c1 and c2 may vary somewhat depending on the location, but to be consistent with previous studies, they were set to −1.682 and 6.541, respectively. Stratiform rain is indicated when i is negative and convective rain is indicated when i is positive.
The index values (derived from 3 min DSD-based NW–Dm) for 14 October 2019 are shown in Figure 5 for the whole duration of the event. The separation line (i.e., i = 0) is also included. As seen, there are several ‘points’ (i.e., time periods) where i was positive or close to 0. These are numbered from (i) through to (vii) and highlighted in yellow. The corresponding RHI scans from NPOL are given in Figure 6. For all seven instances, the arrows point to the precipitation structure above the disdrometers.
The RHI scan for case (i) (top-most panel in Figure 6) shows a relatively thick bright band, and from Figure 5, we see that the index values approach zero. By comparison, in Reference [18], DSD and profiler data during a ‘cold-rain’ event in Ontario, Canada, showed that the index i became closer to zero when the bright-band peak had higher values. Given that thicker bright bands have higher dBZ peaks, case (i) in Figure 6 (with ~44 dBZ peak) appears to be consistent with the results from the Ontario event, i.e., classified as stratiform. Note that above the top of the melting layer in the RHI scan at around the disdrometer site (37 km) at heights of 10–12 km a.g.l., weak updrafts can be inferred by the streamers of Zh, which may indicate active riming aloft.
Cases (ii) through (v) are similar in that echo tops are <5 km a.g.l. (relatively shallow), the convective towers have Zh > 35 to 40 dBZ, almost throughout, and there is an upper cloud deck that could possibly be seeding the convection below, as discussed earlier (towards the end) in Section 2.3 with respect to Figure 3. Clearly, the vertically ‘upright’ reflectivity columns are convective, perhaps with warm rain processes dominating. In Figure 5, the index value for points (ii) and (iii) are very close to 0, whereas points (iv)–(v) have index values well into the convective type.
Case (vi) appears to be a typical example of graupel melting to form rain with maximum Zh of ≈55 dBZ, and individual convective towers are seen at times to rise to 6.5 km a.g.l. The point (vi) in Figure 5 shows significantly positive i values and clearly convective. Case (vii) is a weak warm rain shower with echo tops < 4.5 km a.g.l. An interesting point to note is the thin low reflectivity (<5 dBZ) “string” at 2.75 km a.g.l. extending from the echo top northward by 35 km. From Figure 5, the point (vi) is well in the convective type index values.
Next, we consider the event on 16 October 2019. This too lasted for several hours, and the index values based on 3 min DSDs are shown in Figure 7. They go above the zero threshold only at around 17:00 UTC. Three time periods are marked: (i) with index value well below zero, (ii) index value a little above zero, and (iii) index value is negative but close to zero.
The corresponding NPOL RHI scans are given in Figure 8. Case (i) does not show a clear bright band in dBZ but the Zdr plot shows the enhancement more clearly. The RHI scan for case (ii) appears to indicate shallow warm rain over the disdrometer site, although the Zdr plot shows enhancement beyond 40 km range. One could classify this case as ‘mixed’ type or ‘uncertain’. Case (iii) is a thick bright-band case, with high dBZ peak of >50 dBZ. The index value at this time is on the convective class and very similar to case (i) of the 14 October event shown earlier in Figure 5 and Figure 6.

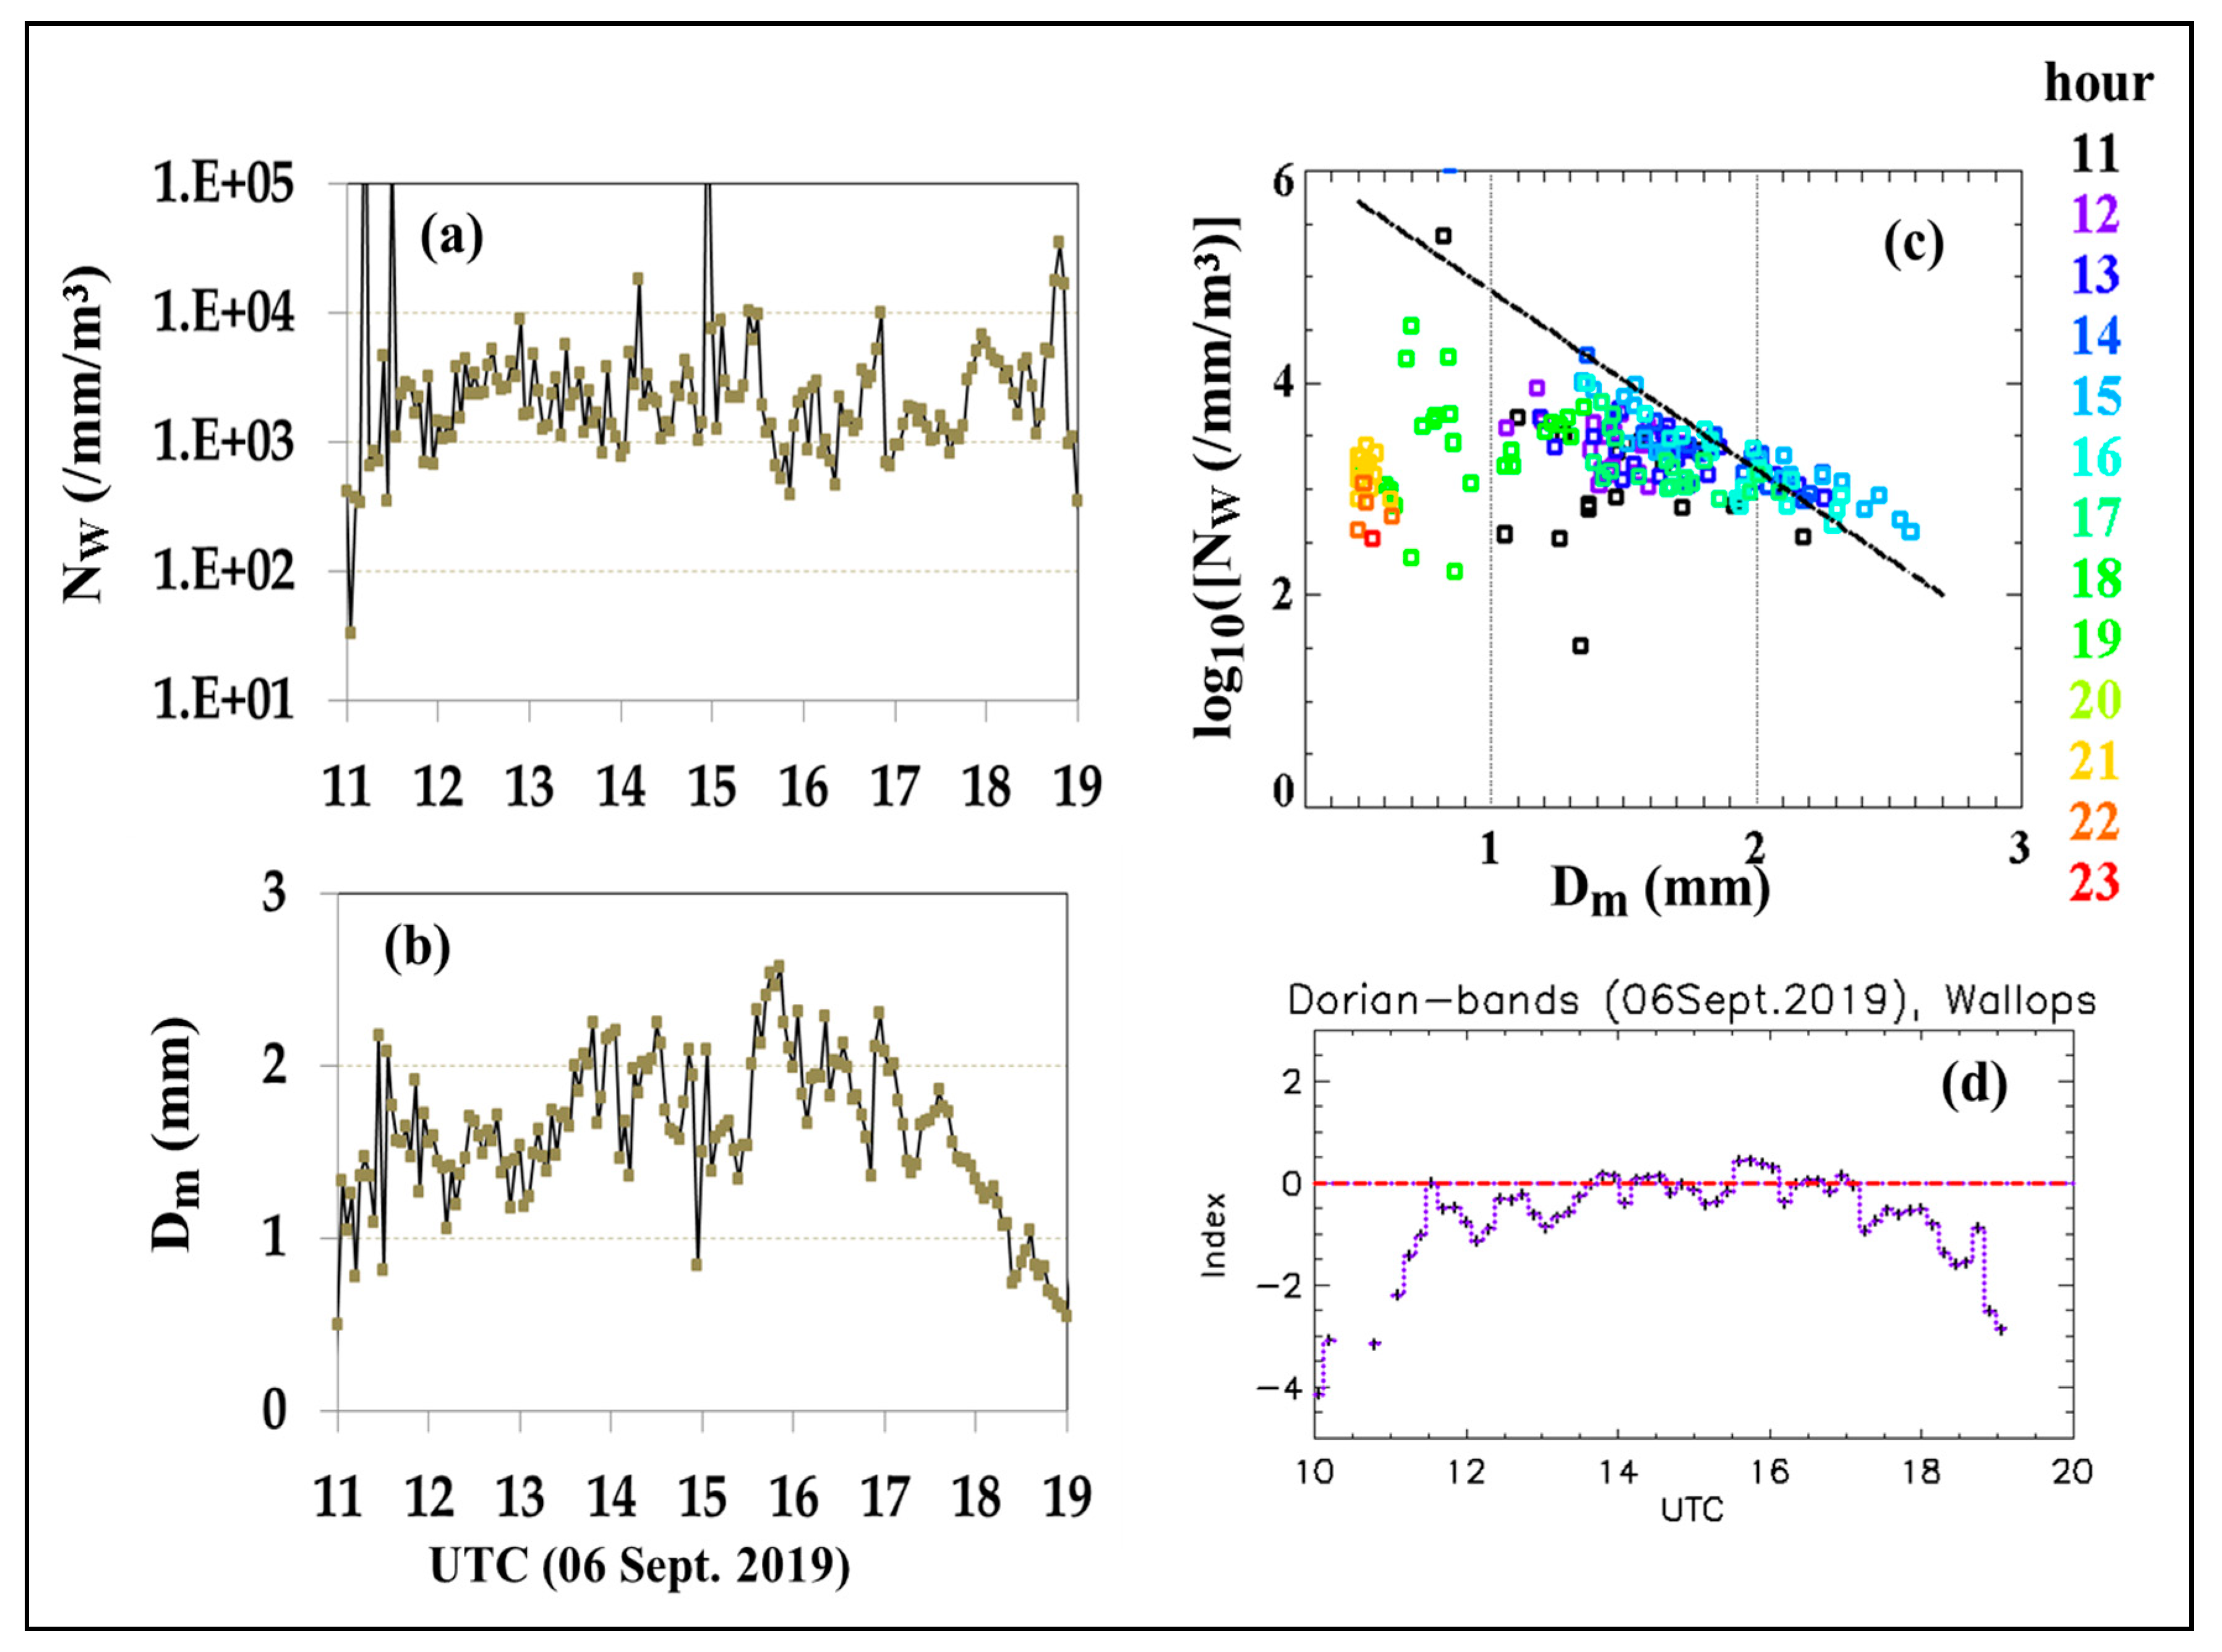
4. Rain Bands of Hurricane Dorian

This event also lasted for many hours over the Wallops site. The NW and Dm derived from the measured 3 min DSDs are shown in Figure 9a,b over an 8 h period, and their variation against one another is shown in panel (c), where the colors represent different hours, as marked. Also shown is the separation line, as a dashed black line.
According to the DSD-based classification, much of this event was stratiform rain. This is in agreement with the regular NPOL RHI scans taken throughout the event (not shown here). There are, however, a few number of points which appear to lie above the black line in panel (c). They are mostly in the 15 to 16 h UTC and have Dm > 2 mm. From panel (b), we see that the points correspond to 15:30 to 16:00 UTC. The index values are shown in panel (d), where slightly positive values can be seen.
During this time period, several large drops were recorded by the 2DVD, including a very large (fully melted) drop with Deq of 8 mm. An RHI scan at 15:41 UTC is shown in panels (a) and (b) of Figure 10. The rain type is certainly stratiform rain with a clearly defined bright band both in Zh and Zdr. Panels (c) and (d) show the vertical profiles of Zh and ρhv over and surrounding the disdrometers. Similar to Figure 3e,f, Zh profiles show a very clear peak (3.2 to 4.2 km for this case) and the ρhv profiles show a corresponding dip in the melting layer. Hence, for this case, i.e., between 15:30 and 16:00 UTC, our DSD-based classification did not correctly identify the rain type. One feature worth noting in the RHI scan is the layer of enhanced Zdr at around 8 km height. This has been attributed to the dendritic growth zone which typically occurs at around −15 °C height [33]. A one-dimensional (1D) super-particle Lagrangian model was also used in Reference [33] to investigate the dominant microphysical processes involved in this case. Model simulations had shown that collisional breakup had played an important role in shaping the rain DSDs even for moderate rain rates (~10 mm/h). Furthermore, above the bright band, strong aggregation was inferred by the slope of Zh of −10 dB/km from 6.5 km height to 4.5 km height a.g.l. This feature as well as the very high maximum bright-band reflectivity (>55 dBZ) and the high depth of the bright band (750 m) are unusual for stratiform rain characteristics.
Moreover, in Reference [18], it was shown, for the DSDs for stratiform rain during a cold rain event (see Figure 2b), that the stratiform-convective rain index value approached the zero threshold as the maximum bright-band reflectivity (BBmax) increased. By extrapolating their figure to >55 dBZ for BBmax, the index can indeed be expected to exceed the 0 threshold.

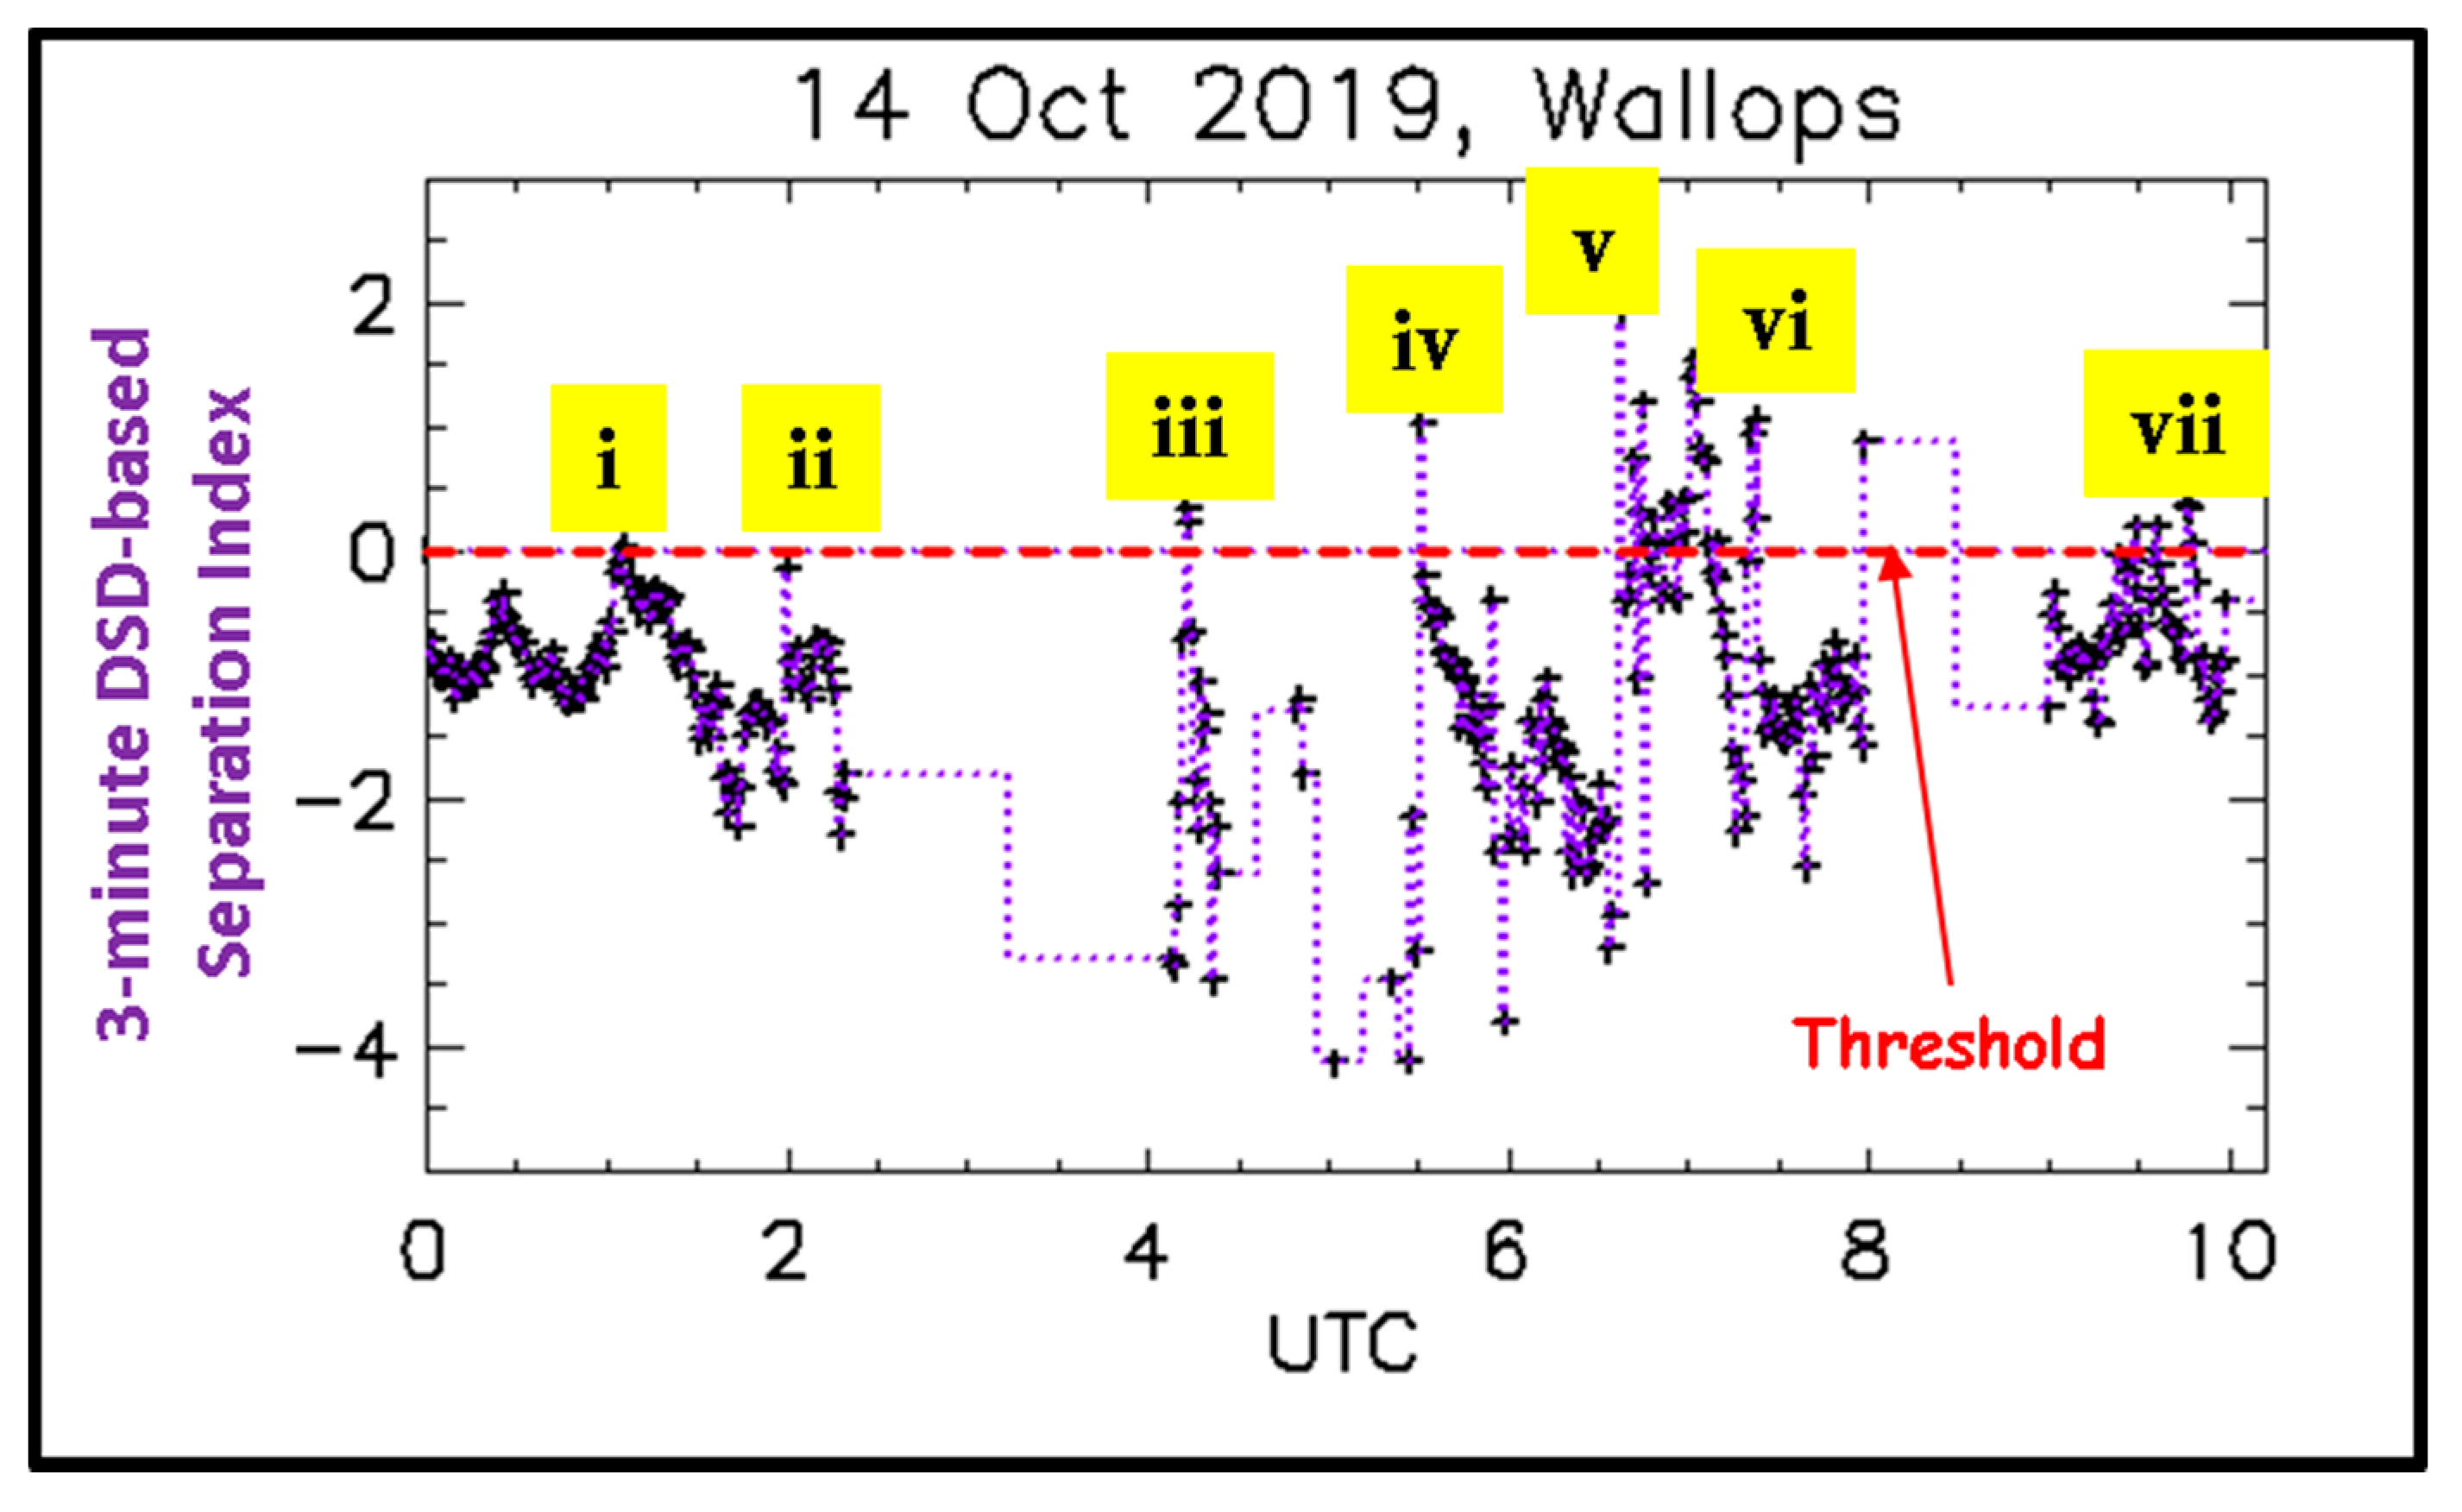
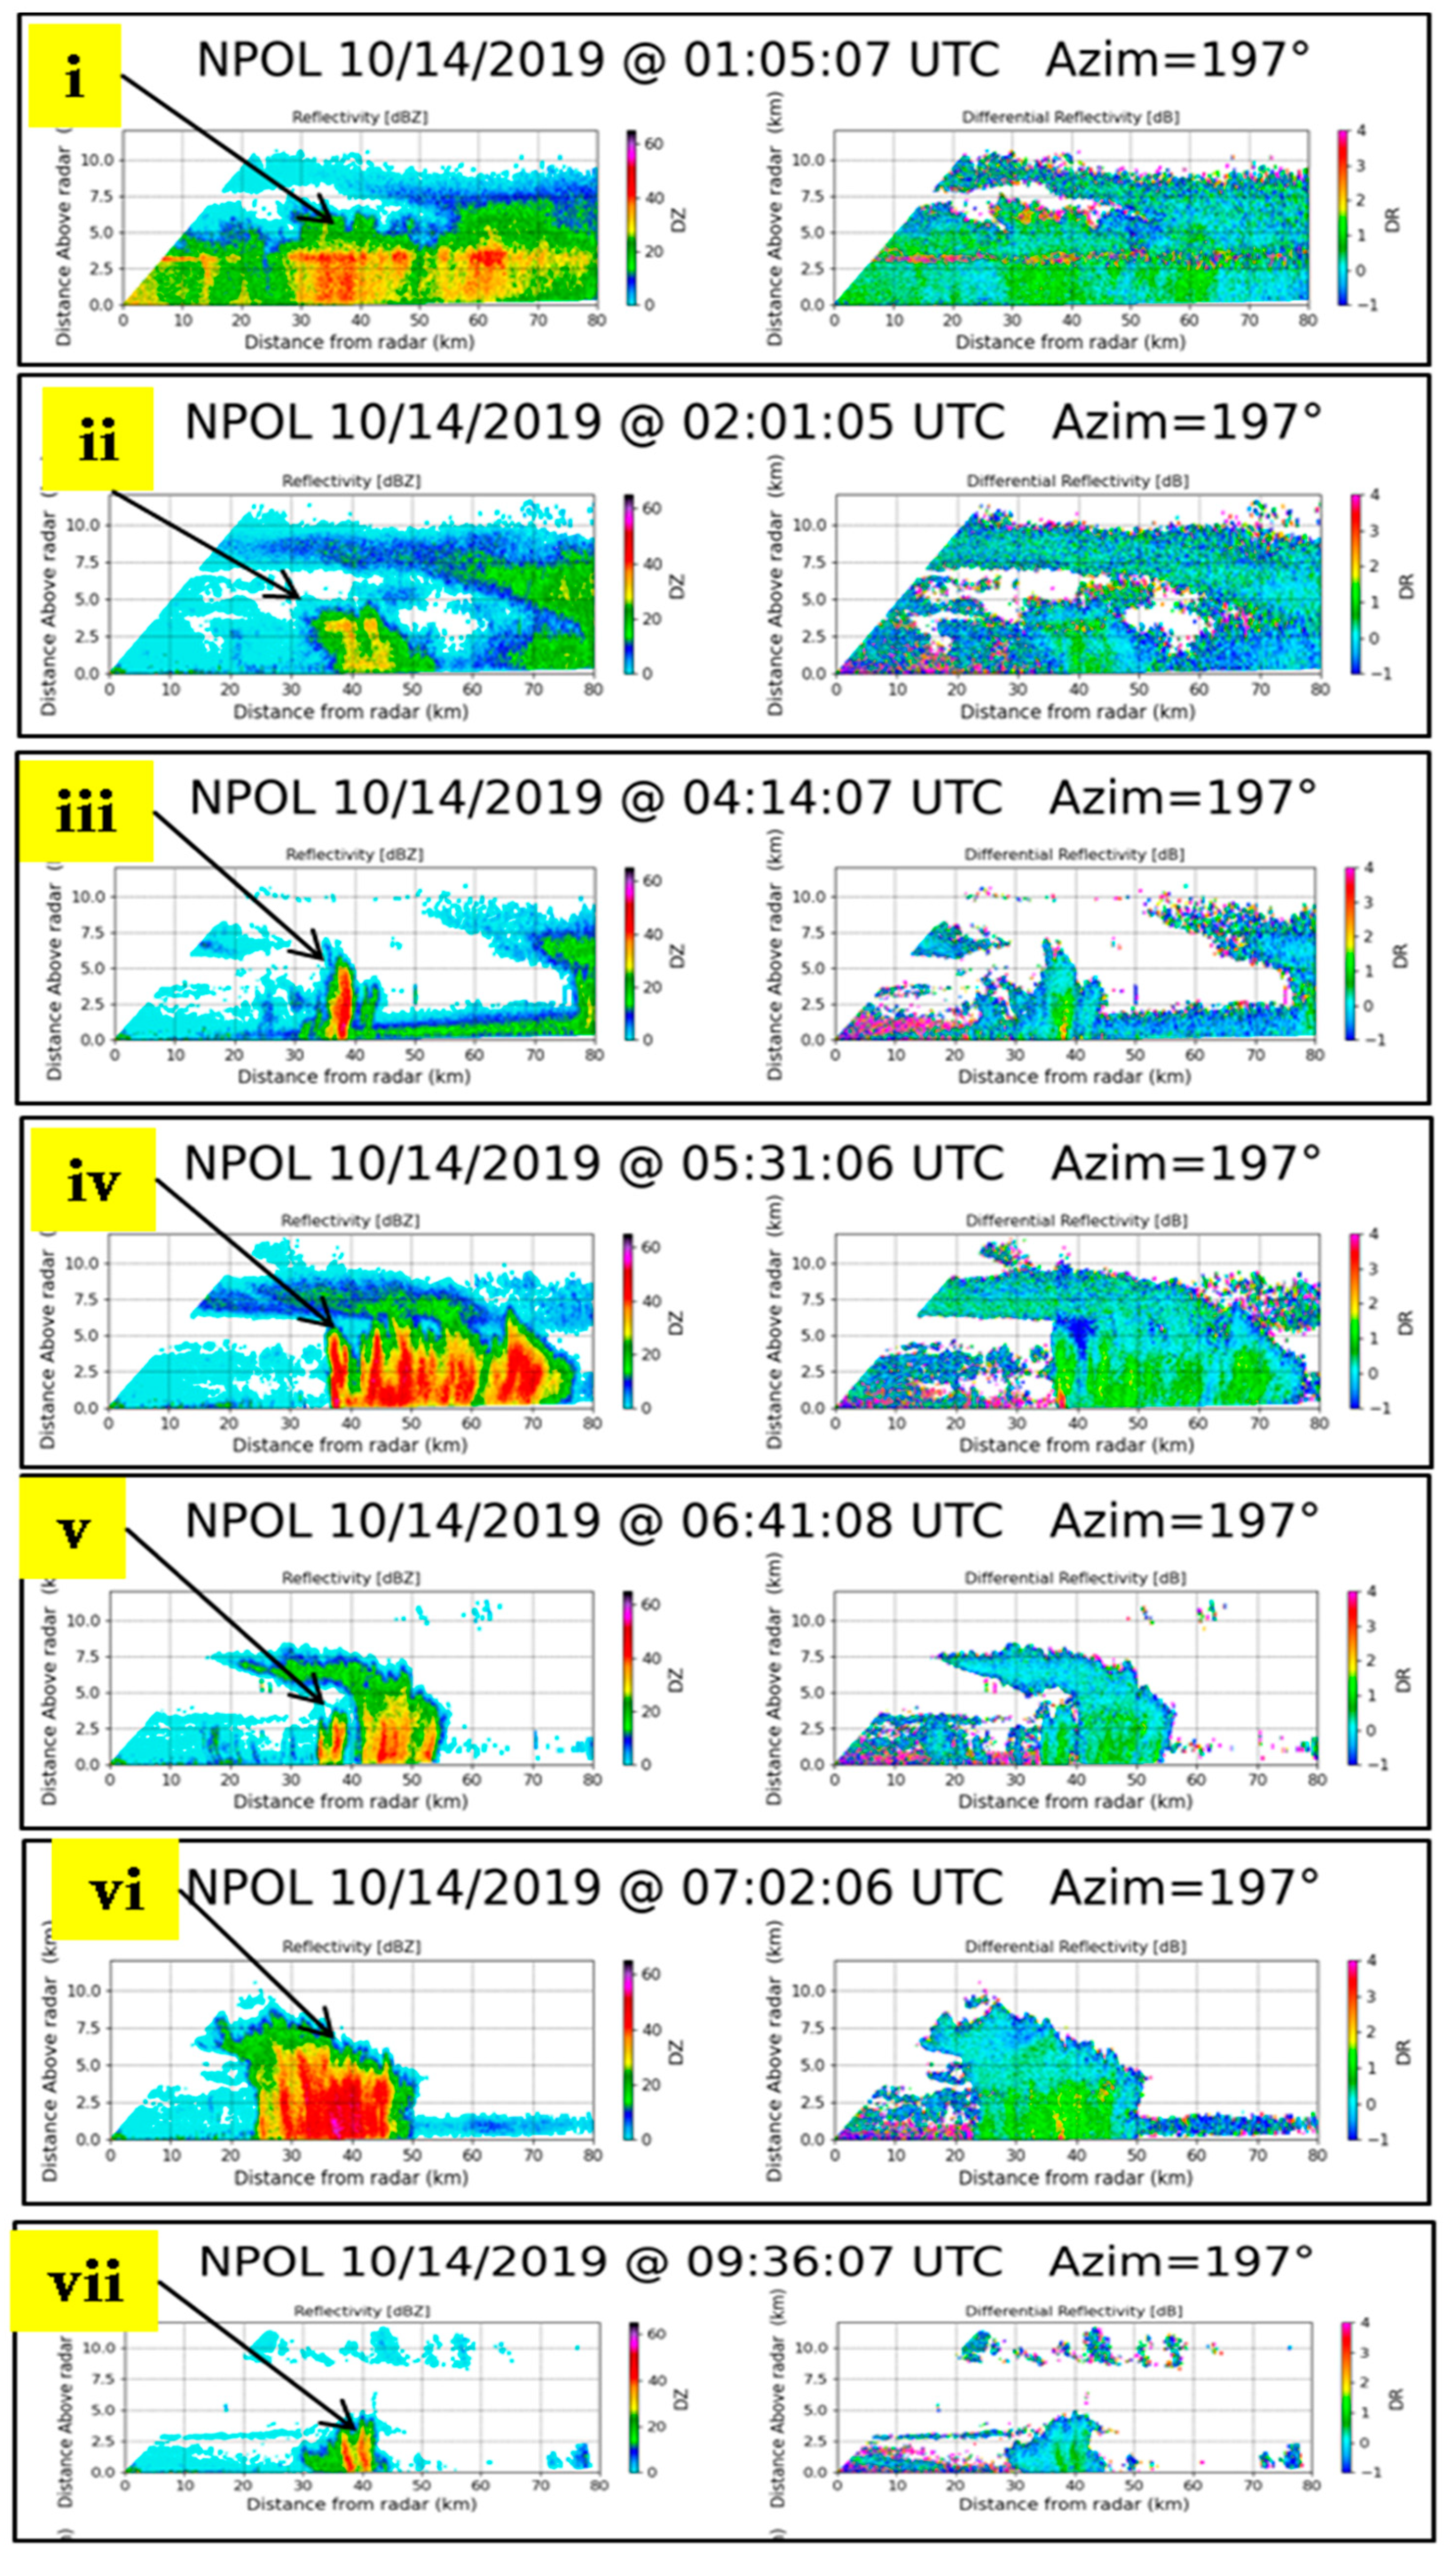
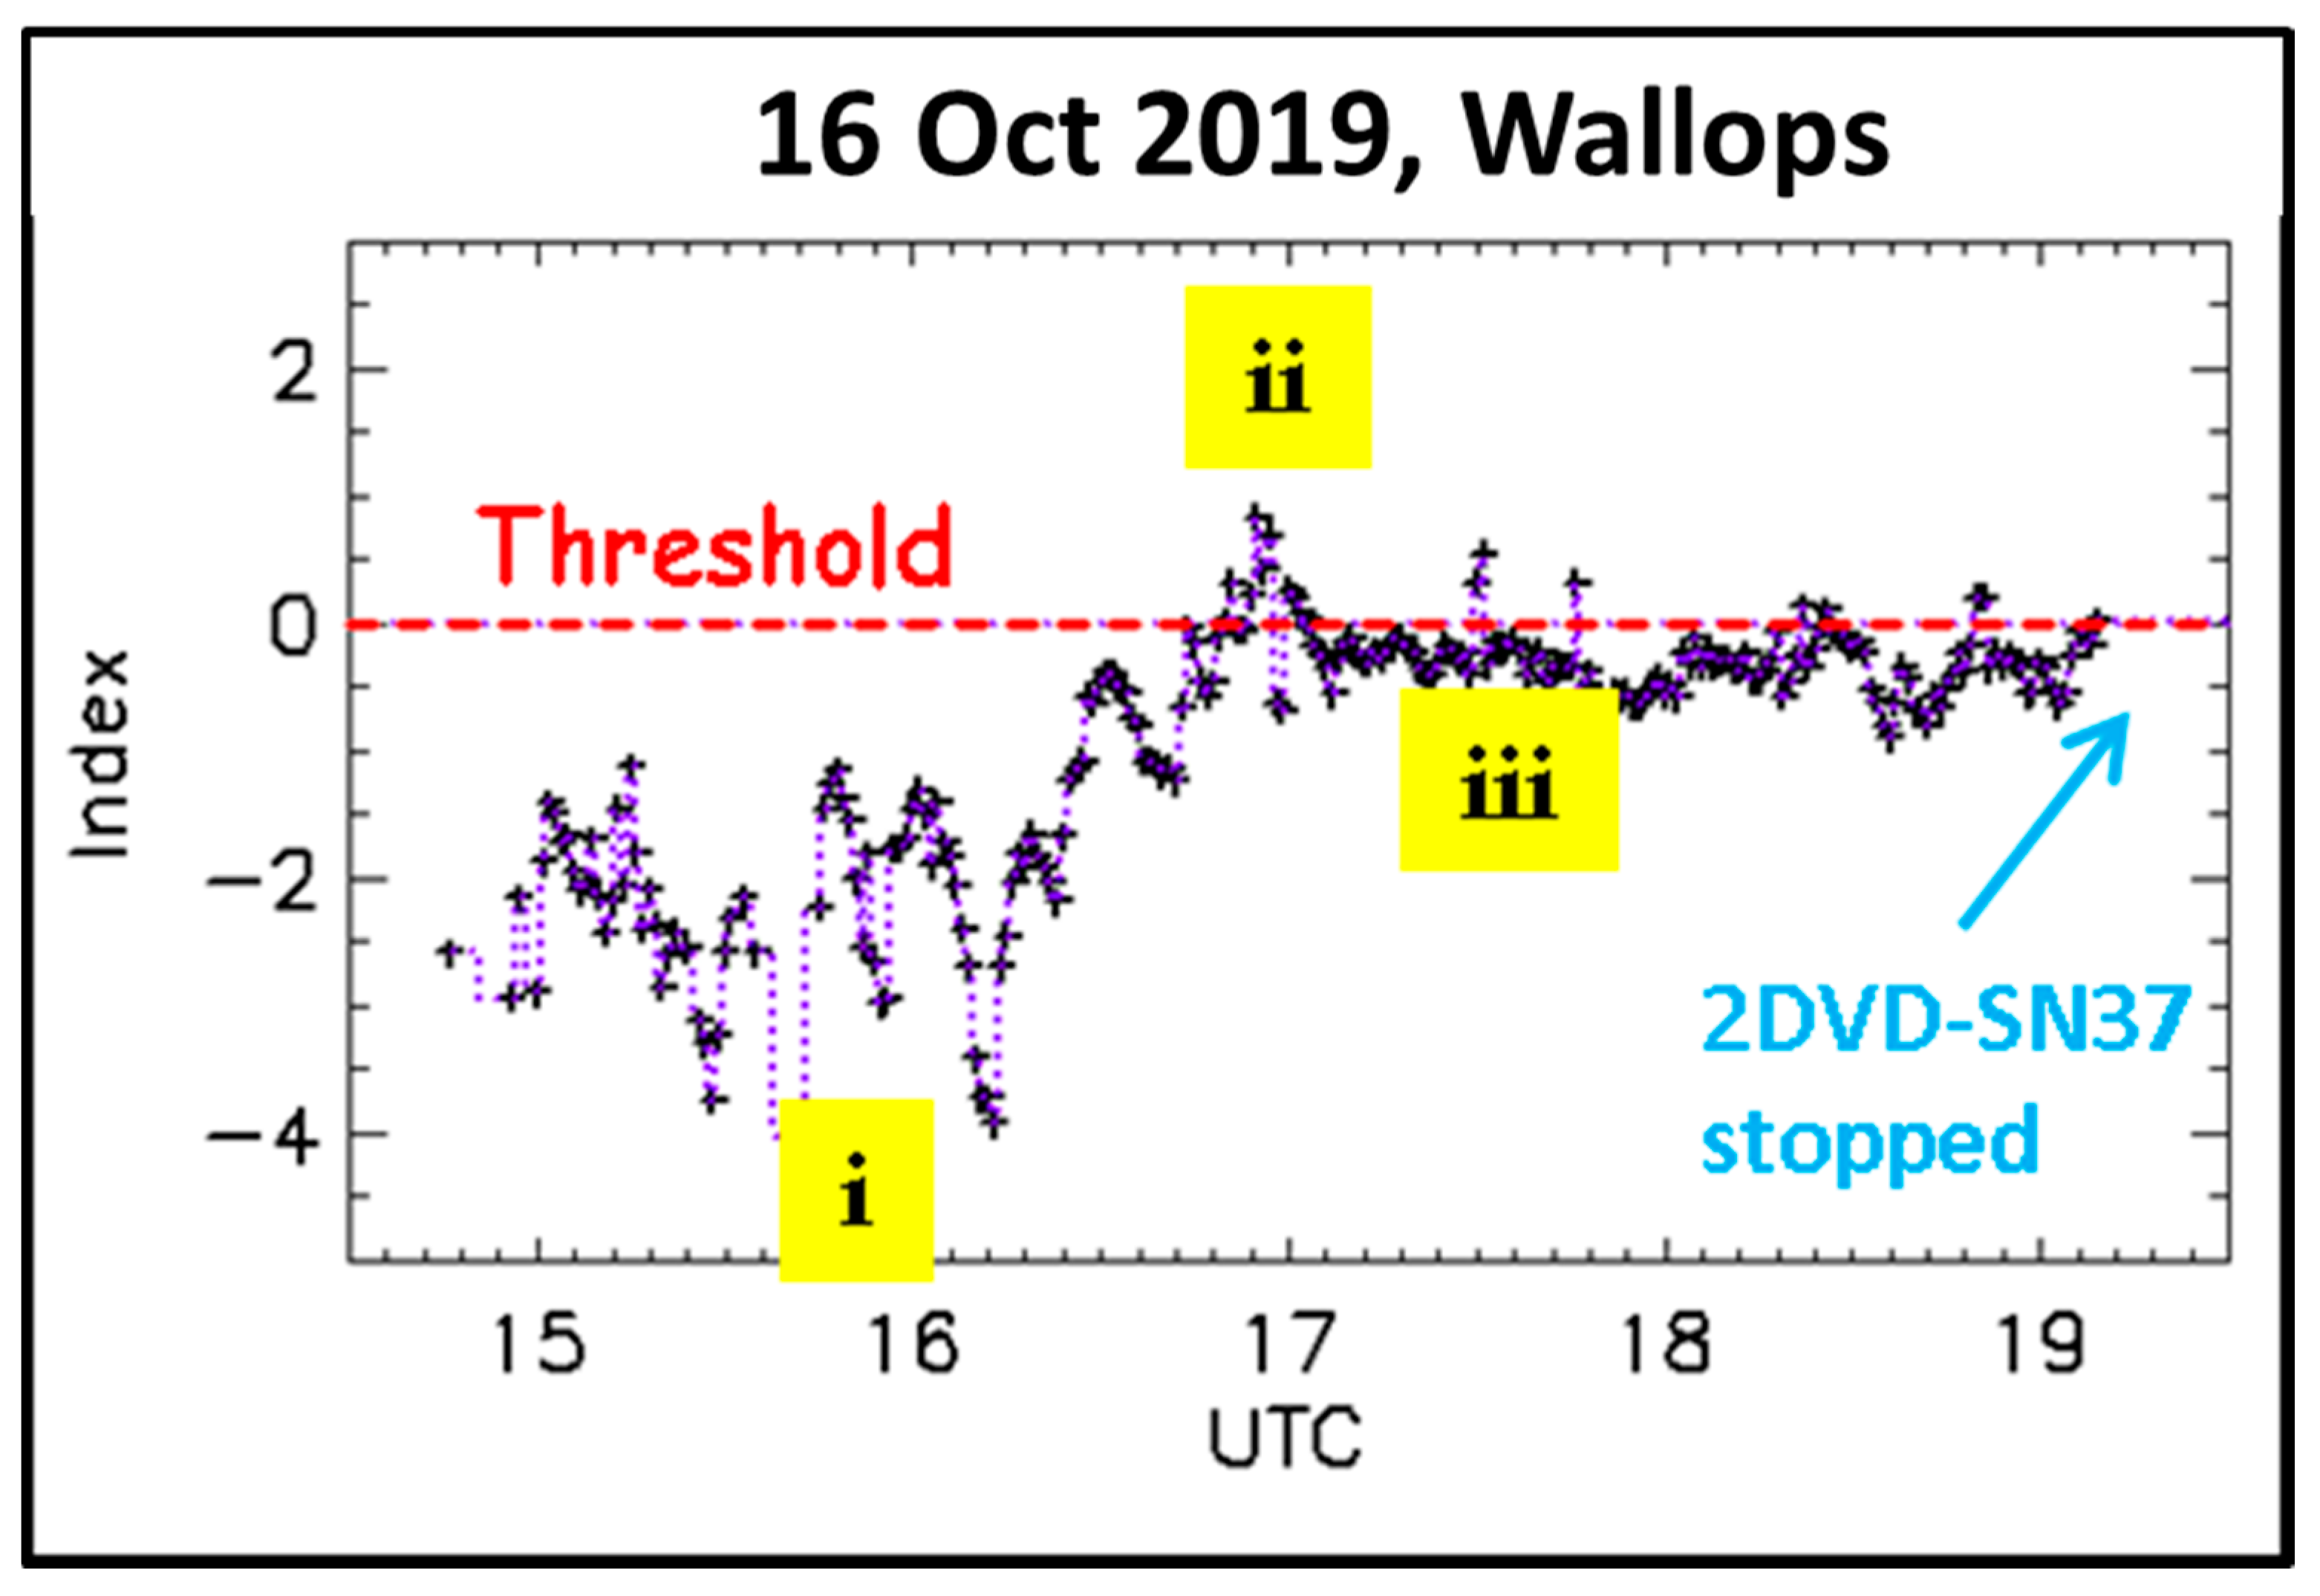
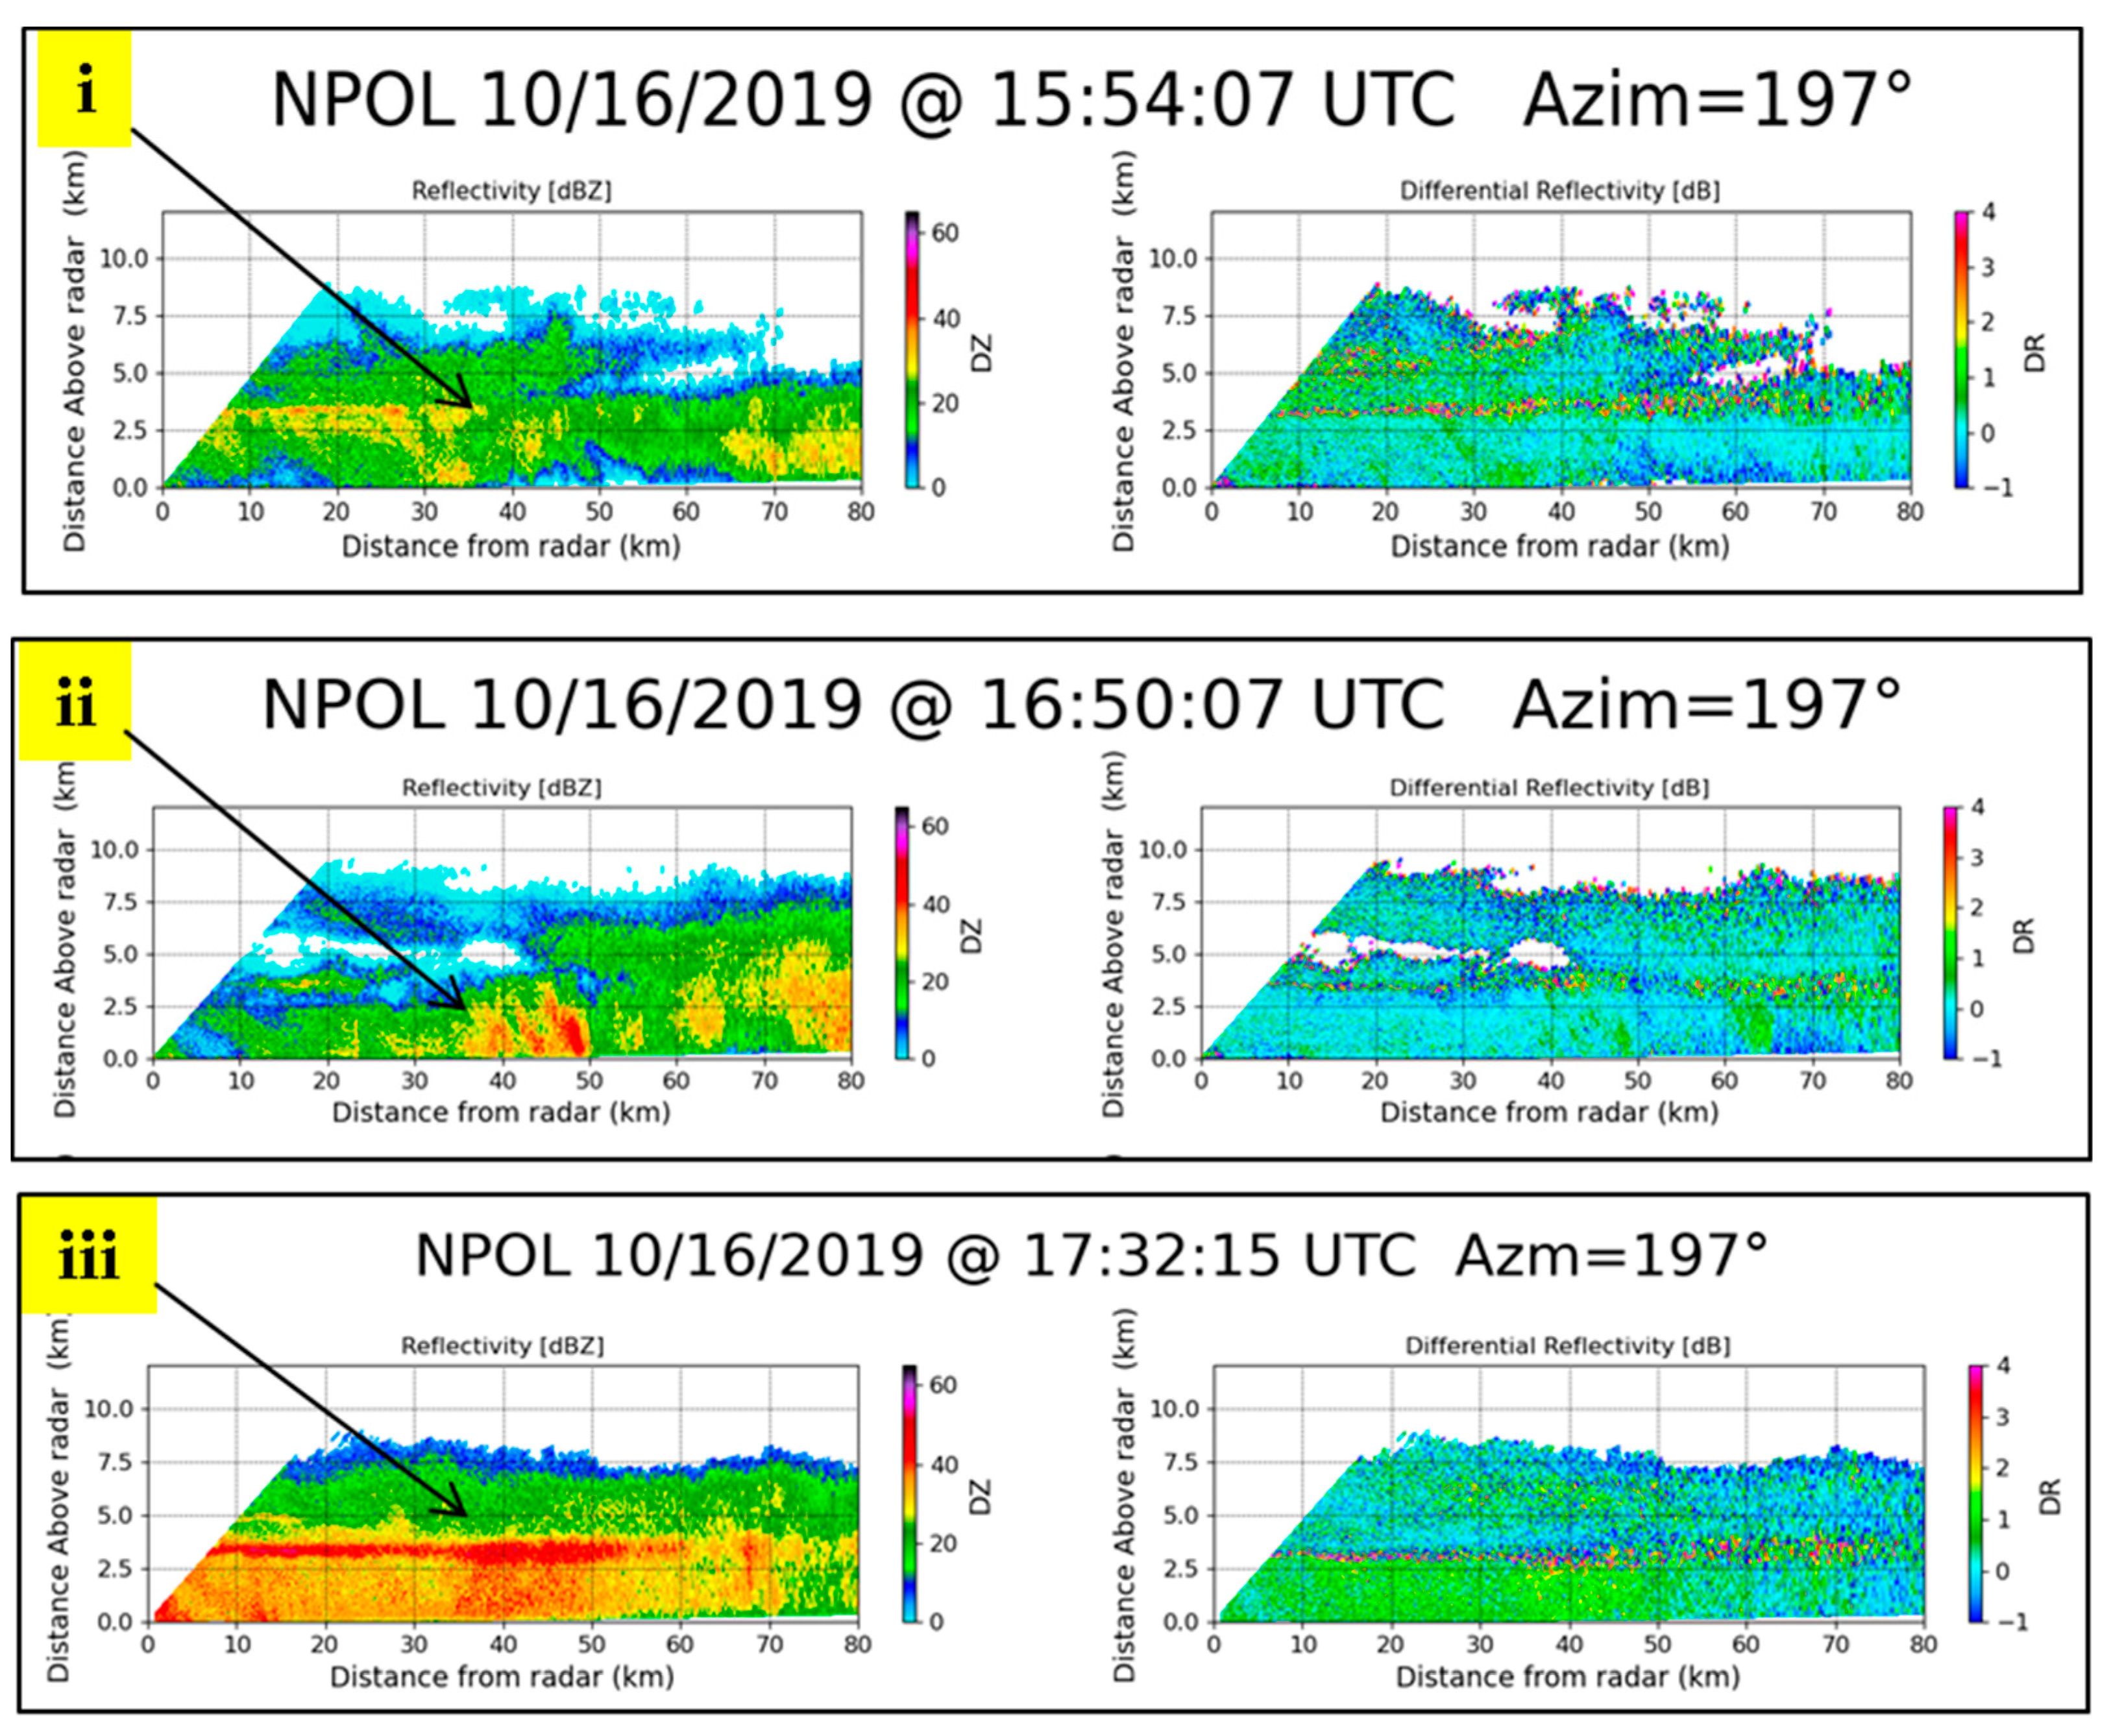
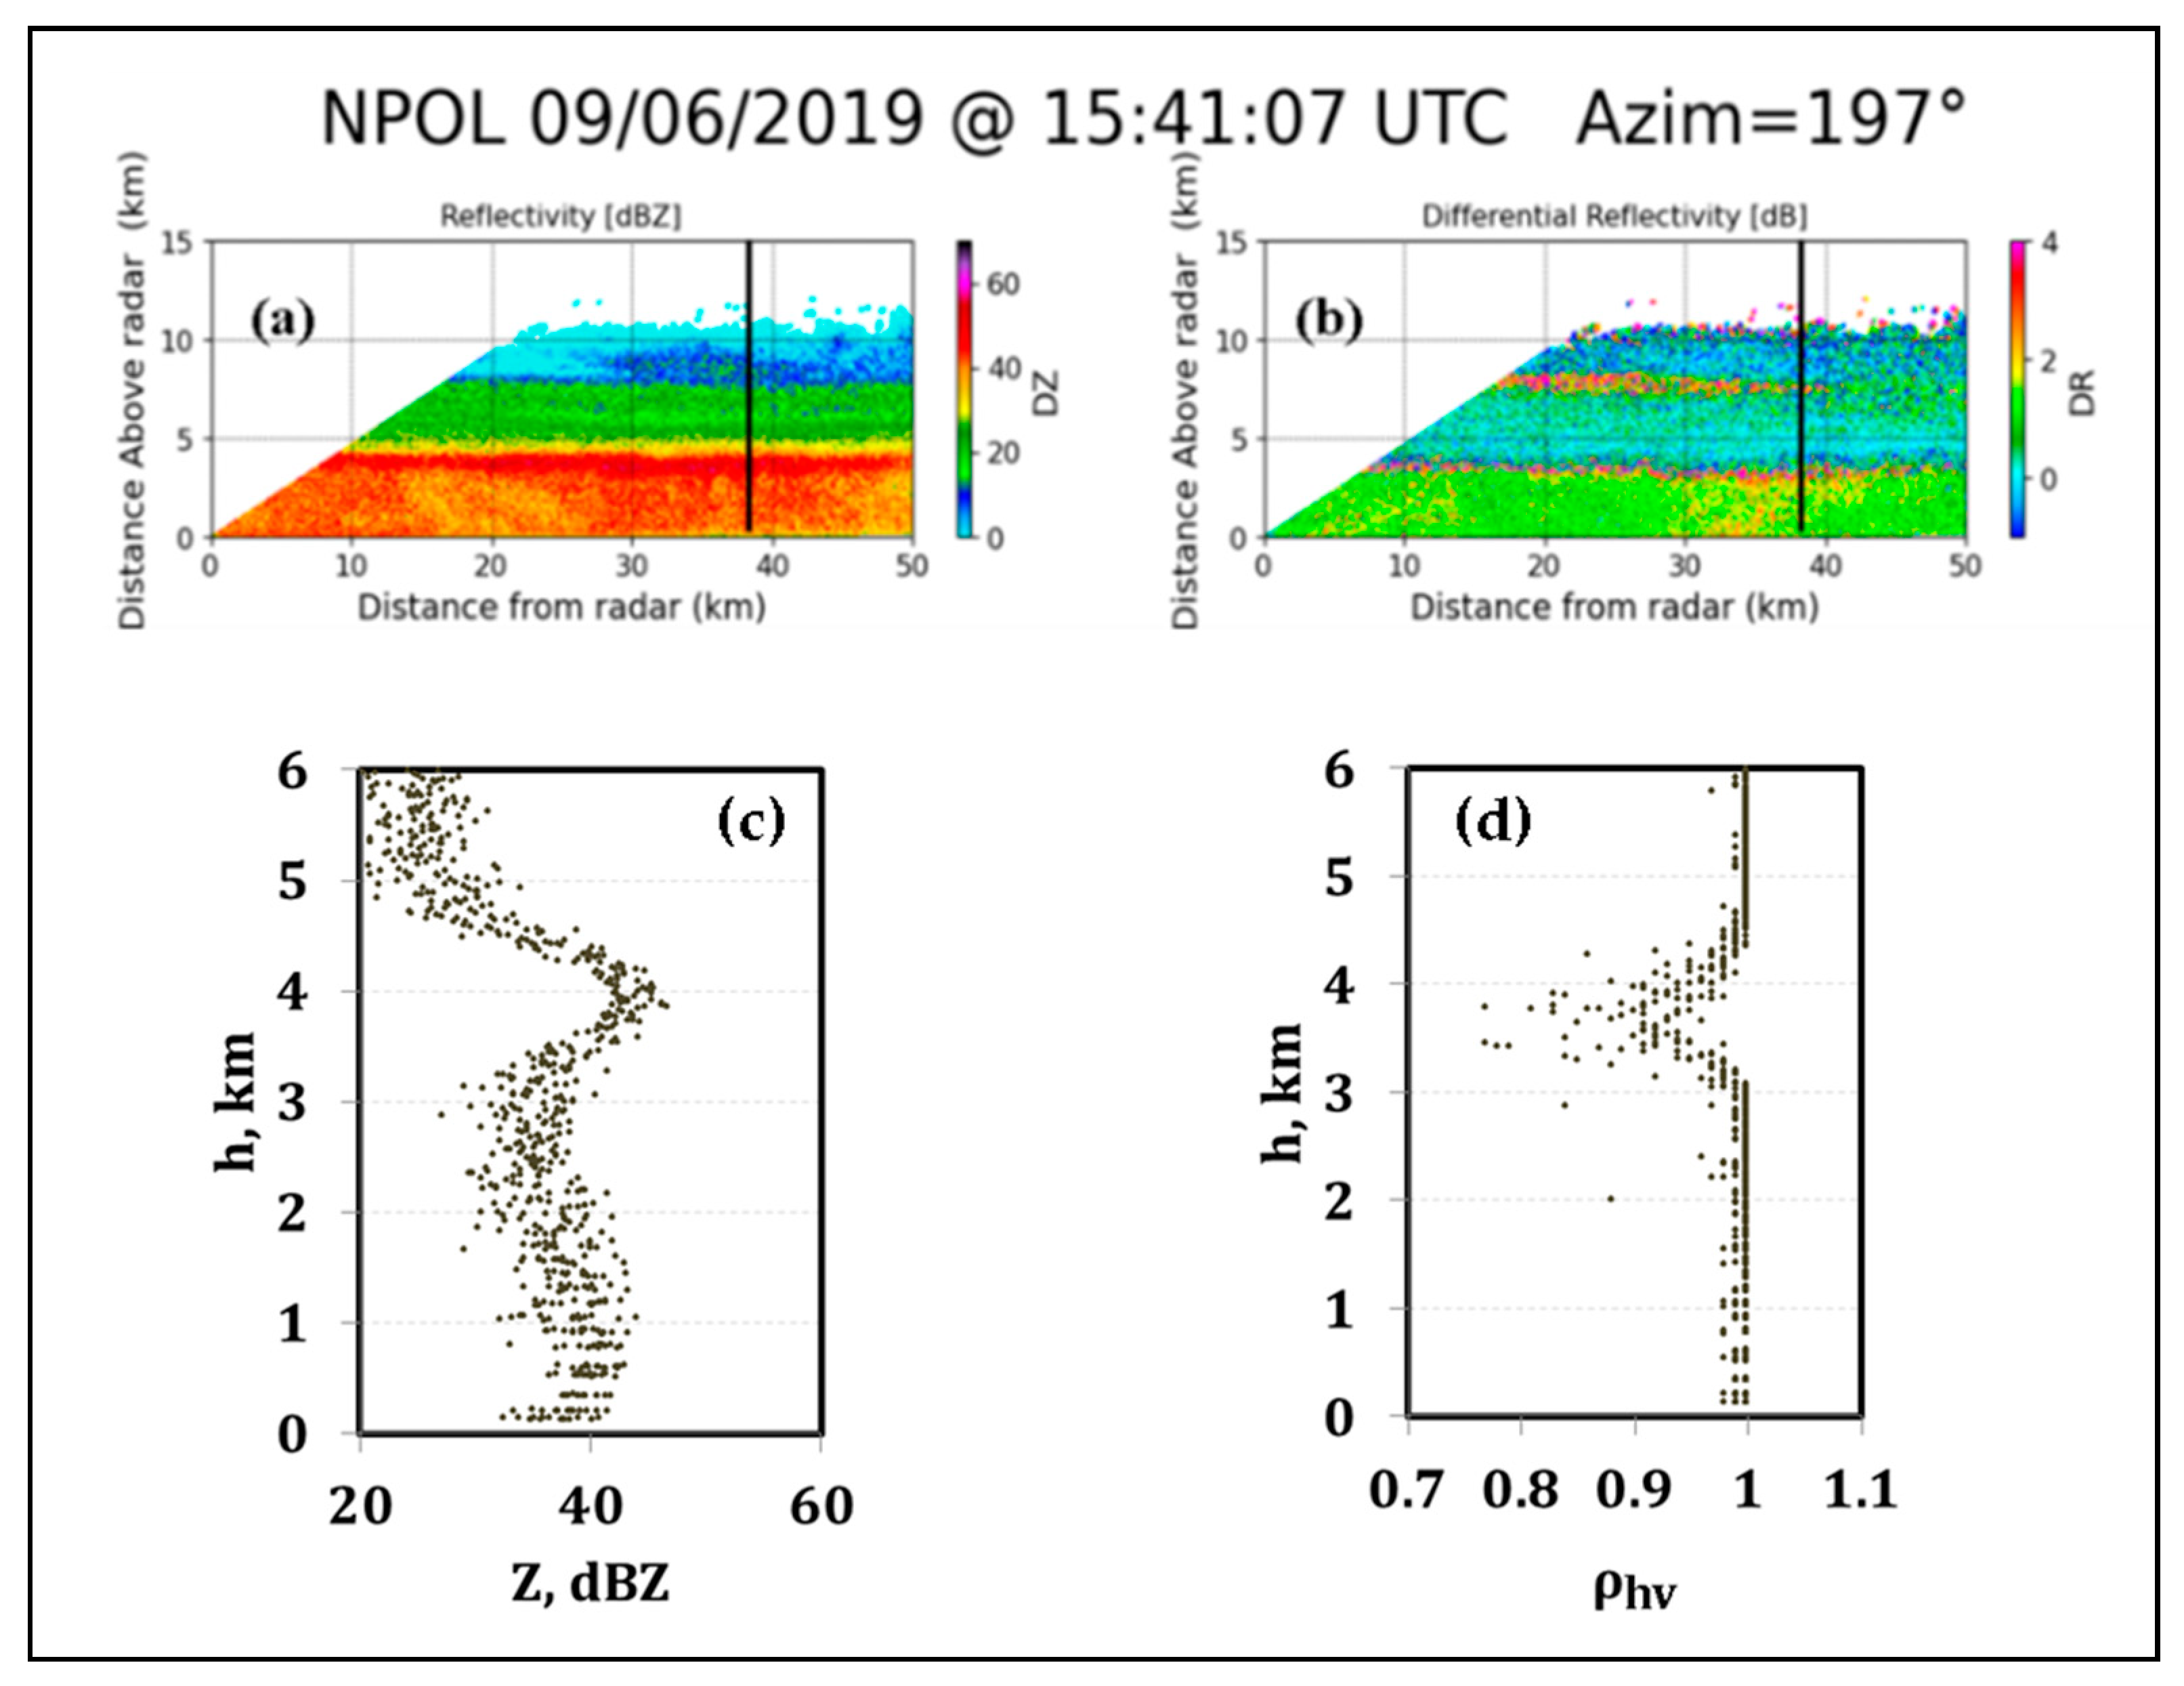
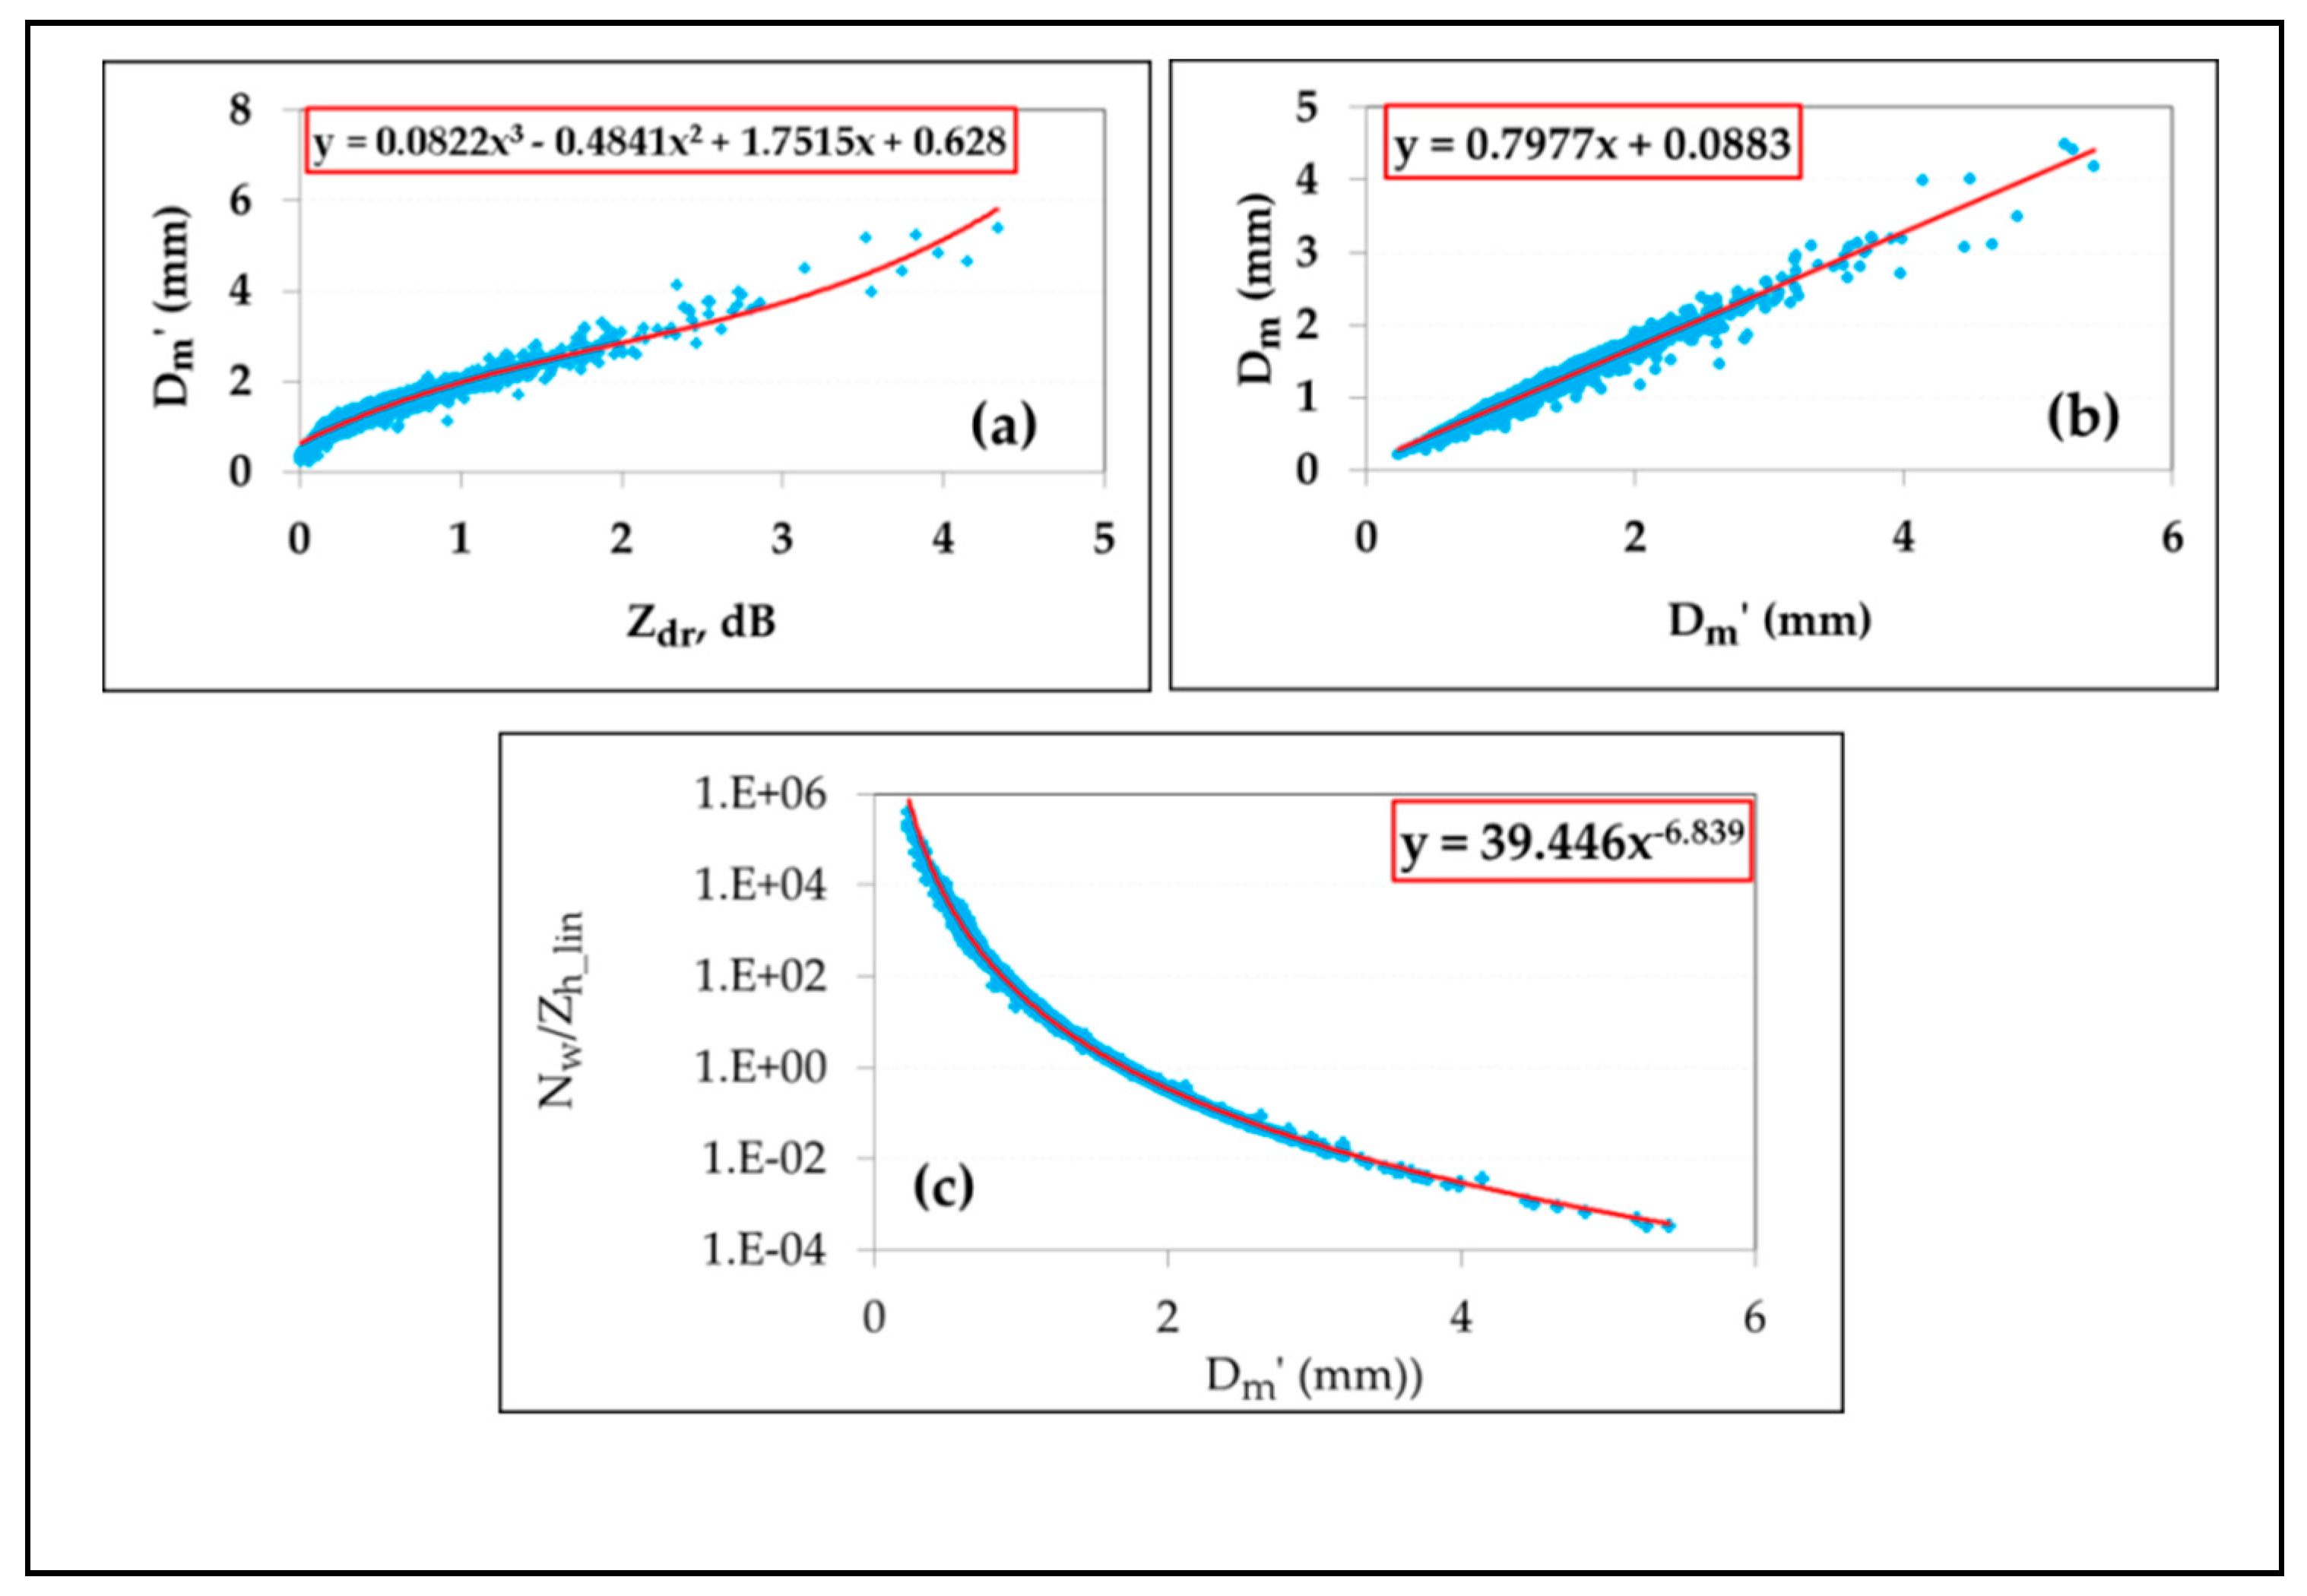
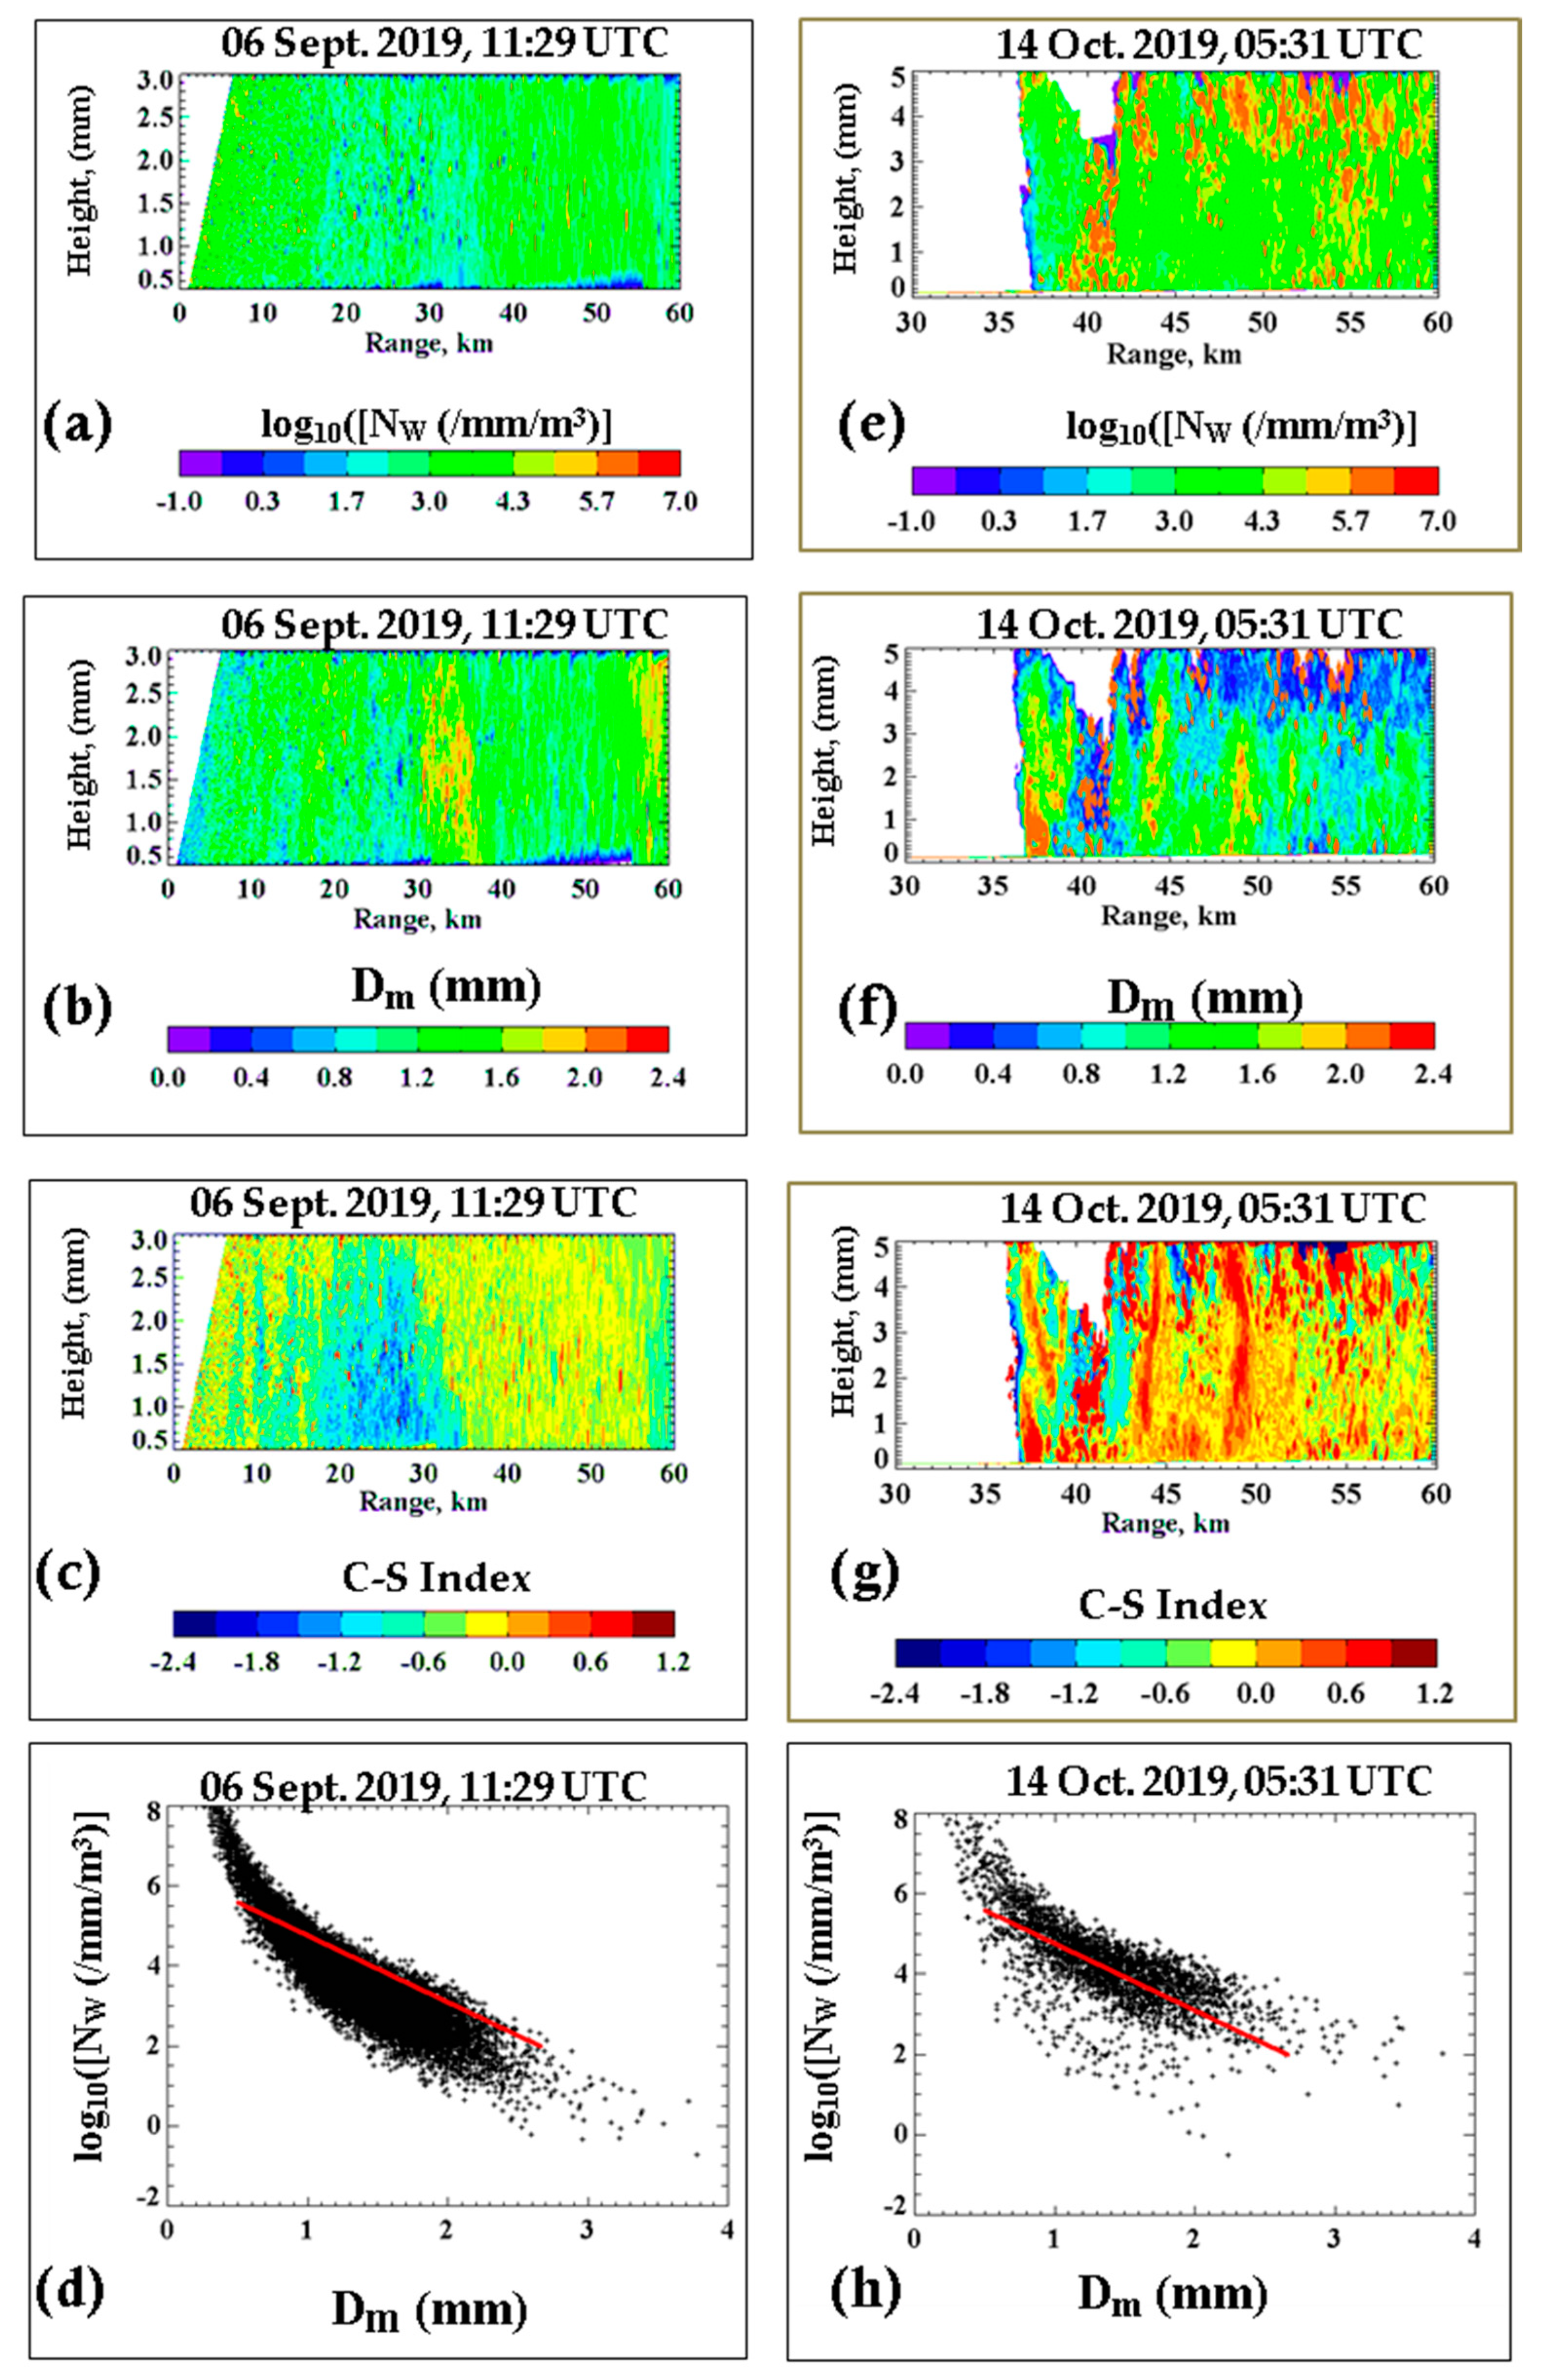
5. Applying the Separation Technique to NPOL Radar Data

The DSD-based separation technique can also be used to identify stratiform and convective rain regions from NPOL radar scans. It entails, as a first step, the estimation of the two DSD parameters needed for the separation, NW and Dm. Initially, the mass-weighted mean diameter, Dm, is estimated using the S-band Zdr via a two-step procedure which involves an intermediate parameter, Dm′, as defined in Reference [34]. Dm′ depends on two (chosen) reference DSD moments. In Reference [35], where X-band polarimetric radar retrievals were successfully carried out, the chosen reference moments were the third and the sixth moments. We use a similar approach here, except the frequency is now S-band.
If i and j represent the two chosen reference moments, then Dm′ is defined as:
D m = ( M j M i ) 1 ( j i )
and NW is given by
N W =   ( 4 4 6 )   N 0
where
N 0 = M i ( j + 1 ) ( j i )   M j ( i + 1 ) ( i j )
and here, we set i = 3 and j = 6.
Next, we use scattering (T-matrix) calculations to derive the retrieval equations for Dm and NW from the S-band radar data. Three minute DSD spectra are used as input for the simulations. Figure 11 shows the variations of (a) Dm′ with Zdr, (b) Dm with Dm′, and (c) NW/Zh (linear) versus Dm′, all at S-band. The fitted curves and the equations for those curves are given in each of the panels.
The fitted equations were applied to the radar scans, and two sets of example results are shown in Figure 12. They correspond to the two cases presented earlier in Figure 3. The radar data processing was carried out using the same set of procedures as outlined in Reference [36], including attenuation correction procedures for all Zh and Zdr range profiles.
Panels (a) to (d) correspond to the Dorian rain bands event on 06 September 2019 at 11:29 UTC (stratiform rain), and panels (e) to (h) correspond to 14 October 2019 at 05:31 UTC (convective rain). For both events, the retrieved NW and Dm are shown in panels (a), (e), (b), and (f) respectively, and the index values are shown in panels (c) and (g). Only the rain region is shown in all cases, up to 3 km above ground level. Note that also for the second event, the radar range goes from 30 to 60 km since there was no precipitation at closer range. The retrieved NW versus Dm from the radar scans, from 0.5 to 3 km a.g.l. for each of the two cases, is shown in panels (d) and (h), respectively. The separation line is over-plotted in red.
The differences between the two events can be clearly observed from Figure 12. NW shows more uniformity for the stratiform rain event and Dm shows significantly higher values (sometimes >2 mm) for some regions in the convective event. The index values are mostly negative for the 6 September 2019 case and mostly positive for the 14 October 2019 case. This not only lends support to the applicability of the separation method but also provides general support to our retrieval method for the DSD parameters from the NPOL radar scans. Note also from panels (d) and (h) that most points lie below the red line for the stratiform rain case, except for very low Dm points (which need to be categorized as light rain event and considered separately), while most points lie above the red line for the convective rain case.
A final point to note is that this separation method has been applied to radar data in previous studies, for example, Reference [15], but there were some subtle variations in the technique used. The separation in Reference [15] was carried out in terms of NW versus the median volume diameter, D0, and further, it assumed a standard gamma model for the DSDs. On the other hand, here, we have used the mass-weighted mean diameter instead of D0. This eliminates the need to have model assumption for representing the DSDs. The main advantage is that unusual DSDs, which, for example, can occur at the beginning of convective cores [37], as well as those with high concentration of small drops (which may need the use of generalized gamma model [34]), can all be included in the radar-based classification. Note also that because NW and Dm are ultimately dependent on two DSD moments, it may be possible to use a ‘moments-based’ separation method optimized for stratiform and convective rain. Future work will address which (two) reference moments are most suitable for such separation. Both disdrometer measurements and radar data will be used for such investigations.

6. Conclusions

Over a total of 20 h of DSD data from three events in the Delmarva peninsula have been tested. The DSD-based classification correctly identified stratiform and convective rain types for all cases throughout all three events, except for a 30 min period during the event relating to Hurricane Dorian rain bands. This 30 min period was unusual in that there were many large drops, including one with a Deq of 8 mm (fully melted) drop, and yet a clear bright band was present around the 0 degree C isotherm height. The bright-band thickness and the dBZ peak (>55 dBZ) were high. Bringi et al. [31] have examined this particular case using 1D Particle Model Simulations.
Data and observations from two other locations, i.e., Huntsville, Alabama, and Greeley, Colorado (as well as Ontario, Canada), USA, have supported the separation line in the NW–Dm space [18,19]. The separation line from the original studies using data and observations from Darwin, Australia [14,15], also used the same technique. All these locations represent very different climate regions, but the method still needs to be tested over open ocean regions where light rain rates (R < 0.5 mm/h) occur frequently, for example as stratocumulus drizzle (warm rain). Shallow clouds over land with no bright-band signature also produce light R. We can also define light R as those DSDs whose Dm < 0.5 mm, as this is the threshold where most disdrometers do not have the sensitivity or resolution to capture the tiny drops. High-resolution “fast” Particle Measuring Systems (PMS)-cloud probe on aircraft flights through stratocumulus drizzle shows that the histogram of Dm is exponential in shape, whereas the histogram of log(NW) is symmetric with mode of NW close to 106 mm−1 m−3 and width covering two orders of magnitude. Thus, light rain is highly variable and difficult to classify as stratiform or convective using NW and Dm alone [38].
The method can not only be applied to DSD measurements from disdrometers but also to polarimetric radar data. Suitable retrieval methods for NW and Dm need to be used. Here, we have used the NPOL radar data to demonstrate the technique for S-band radars.
A final point to note is that because NW and Dm are ultimately dependent on two DSD moments, it may be possible to use a ‘moments-based’ separation method optimized for stratiform and convective rain. Future work will address which (two) reference moments are most suitable for such separation. Both disdrometer measurements and radar data will be used for such investigations. Sources of errors such as those due to disdrometer sampling errors, radar measurement errors, and retrieval algorithm errors will be considered.

Author Contributions

Conceptualization, M.T. and V.B.; Methodology, Investigation, and Formal Analysis, M.T. and V.B.; Data Curation, D.M., D.W., and C.P.; Writing—Original Draft Preparation, M.T.; Writing—Review and Editing, V.B. and D.W.; Supervision, V.B.; Resources, D.W. All authors have read and agreed to the published version of the manuscript.

Funding

M.T. received funding to conduct this research from NASA’s Precipitation Measurement Mission via Grant Award Number 80NSSC19K0676. V.B. was funded by NASA Atmospheric Dynamics program via Grant Award Number 80NSSC20K0893.

Data Availability Statement

Data can be made available upon request to any of the authors.

Acknowledgments

We wish to thank the three anonymous reviewers for their helpful comments.

Conflicts of Interest

The authors declare no conflict of interest. The funders had no role in the design of this study; in the collection, analyses, or interpretation of its data; in the writing of this manuscript, and in the decision to publish these results.

References

  1. Steiner, M.; Houze, R.A.; Yuter, S.E. Climatological Characterization of Three-Dimensional Storm Structure from Operational Radar and Rain Gauge Data. J. Appl. Meteorol. Climatol. 1995, 34, 1978–2007. [Google Scholar] [CrossRef]
  2. Tao, W.; Iguchi, T.; Lang, S. Expanding the Goddard CSH Algorithm for GPM: New Extratropical Retrievals. J. Appl. Meteorol. Climatol. 2019, 58, 921–946. [Google Scholar] [CrossRef]
  3. Houze, R.A., Jr. Cloud Dynamics; Academic Press: Cambridge, MA, USA, 1993; p. 573. [Google Scholar]
  4. Tokay, A.; Short, D.A. Evidence from Tropical Raindrop Spectra of the Origin of Rain from Stratiform versus Convective Clouds. J. Appl. Meteorol. Climatol. 1996, 35, 355–371. [Google Scholar] [CrossRef] [Green Version]
  5. Bringi, V.N.; Chandrasekar, V.; Hubbert, J.; Gorgucci, E.; Randeu, W.L.; Schoenhuber, M. Raindrop Size Distribution in Different Climatic Regimes from Disdrometer and Dual-Polarized Radar Analysis. J. Atmos. Sci. 2003, 60, 354–365. [Google Scholar] [CrossRef]
  6. Thompson, E.J.; Rutledge, S.A.; Dolan, B.; Thurai, M. Drop Size Distributions and Radar Observations of Convective and Stratiform Rain over the Equatorial Indian and West Pacific Oceans. J. Atmos. Sci. 2015, 72, 4091–4125. [Google Scholar] [CrossRef]
  7. Atlas, D.; Ulbrich, C.W.; Marks, F.D., Jr.; Black, R.A.; Amitai, E.; Willis, P.T.; Samsur, C.E. Partitioning tropical oceanic convective and stratiform rains by draft strength. J. Geophys. Res. 2000, 105, 2259–2267. [Google Scholar] [CrossRef]
  8. Testud, J.; Oury, S.; Black, R.A.; Amayenc, P.; Dou, X. The concept of “normalized” distribution to describe raindrop spectra: A tool for cloud physics and cloud remote sensing. J. Appl. Meteorol. 2001, 40, 111–81140. [Google Scholar] [CrossRef]
  9. Ulbrich, C.W.; Atlas, D. On the separation of tropical convective and stratiform rains. J. Appl. Meteorol. 2002, 41, 188–195. [Google Scholar] [CrossRef]
  10. Yuter, S.E.; Houze, R.A., Jr. Measurements of raindrop size distributions over the Pacific warm pool and implications for Z–R relations. J. Appl. Meteorol. 1997, 36, 847–867. [Google Scholar] [CrossRef] [Green Version]
  11. Bukovcic, P.; Zrnic, D.; Zhang, G. Convective–stratiform separation using video disdrometer observations in central Oklahoma–the Bayesian approach. Atmos. Res. 2009, 155, 176–191. [Google Scholar] [CrossRef]
  12. Schoenhuber, M.; Lammer, G.; Randeu, W.L. One decade of imaging precipitation measurement by 2D-video-distrometer. Adv. Geosci. 2007, 10, 85–90. [Google Scholar] [CrossRef] [Green Version]
  13. Schönhuber, M.; Lammer, G.; Randeu, W.L. The 2D-Video-Distrometer. In Precipitation: Advances in Measurement, Estimation and Prediction; Michaelides, S., Ed.; Springer: Berlin/Heidelberg, Germany, 2008; pp. 3–31. ISBN 978-3-540-77654-3. [Google Scholar]
  14. Bringi, V.N.; Williams, C.R.; Thurai, M.; May, P.T. Using dual-polarized radar and dual-frequency profiler for DSD characterization: A case study from Darwin, Australia. J. Atmos. Ocean. Technol. 2009, 26, 2107–2122. [Google Scholar] [CrossRef]
  15. Thurai, M.; Bringi, V.N.; May, P.T. CPOL radar-derived drop size distribution statistics of stratiform and convective rain for two regimes in Darwin, Australia. J. Atmos. Ocean. Technol. 2010, 27, 932–942. [Google Scholar] [CrossRef]
  16. Keenan, T.; Glasson, K.; Cummings, F.; Bird, T.S.; Keeler, J.; Lutz, J. The BMRC/NCAR C-Band Polarimetric (C-POL) Radar System. J. Atmos. Ocean. Technol. 1998, 15, 871–886. [Google Scholar] [CrossRef]
  17. Penide, G.; Kumar, V.; Protat, A.; May, P.T. Statistics of drop size distribution parameters and rain rates for stratiform and convective precipitation during the north Australian wet season. Mon. Weather Rev. 2013, 141, 3222–3237. [Google Scholar] [CrossRef]
  18. Thurai, M.; Gatlin, P.N.; Bringi, V.N. Separating stratiform and convective rain types based on the drop size distribution characteristics using 2D video disdrometer data. Atmos. Res. 2016, 169, 416–423. [Google Scholar] [CrossRef]
  19. Thurai, M.; Kennedy, P.; Dolan, B.; Bringi, V.N. Testing the DSD-Based Stratiform-Convective Rain Separation for Ten Events in Greeley, Colorado. In Proceedings of the 38th Conference on Radar Meteorology, poster 24, Chicago, IL, USA, 28 August–1 September 2017. [Google Scholar]
  20. Knollenberg, R. The optical array: An alternative to scattering or extinction for airborne particle size determination. J. Appl. Meteorol. 1970, 9, 86–103. [Google Scholar] [CrossRef]
  21. Baumgardner, D.; Kok, G.; Dawson, W.; O’Connor, D.; Newton, R. A new ground-based precipitation spectrometer: The Meteorological Particle Sensor (MPS). In Proceedings of the 11th Conference on Cloud Physics, Ogden, UT, USA, 3–7 June 2002. [Google Scholar]
  22. Bringi, V.N.; Thurai, M.; Baumgardner, D. Raindrop fall velocities from an optical array probe and 2-D video disdrometer. Atmos. Meas. Technol. 2018, 11, 1377–1384. [Google Scholar] [CrossRef] [Green Version]
  23. Bringi, V.N.; Hoferer, R.; Brunkow, D.A.; Schwerdtfeger, R.; Chandrasekar, V.; Rutledge, S.A.; George, J.; Kennedy, P.C. Design and Performance Characteristics of the New 8.5-m Dual-Offset Gregorian Antenna for the CSU–CHILL Radar. J. Atmos. Ocean. Technol. 2011, 28, 907–920. [Google Scholar] [CrossRef] [Green Version]
  24. Skofronick-Jackson, G.; Petersen, W.A.; Berg, W.; Kidd, C.; Stocker, E.F.; Kirschbaum, D.B.; Kakar, R.; Braun, S.A.; Huffman, G.J.; Iguchi, T.; et al. The Global Precipitation Measurement (GPM) Mission for science and society. Bull. Am. Meteorol. Soc. 2016, 98, 1679–1696. [Google Scholar] [CrossRef]
  25. Tokay, A.; Bashor, P.G.; McDowell, V.L. Comparison of Rain Gauge Measurements in the Mid-Atlantic Region. J. Hydrometeor. 2010, 11, 553–565. [Google Scholar] [CrossRef]
  26. OTT Hydromet GmbH. Operating Instructions: OTT Pluvio2 Precipitation Gauge. OTT Hydromet. 2010. Available online: http://www.ott.com/en-us/products/download/operating-instructions-precipitation-gauge-ott-pluvio2/ (accessed on 15 March 2021).
  27. Rasmussen, R.; Baker, B.; Kochendorfer, J.; Meyers, T.; Landolt, S.; Fischer, A.P.; Black, J.; Thériault, J.M.; Kucera, P.; Gochis, D.; et al. How Well Are We Measuring Snow: The NOAA/FAA/NCAR Winter Precipitation Test Bed. Bull. Am. Meteorol. Soc. 2012, 93, 811–829. [Google Scholar] [CrossRef] [Green Version]
  28. Raupach, T.H.; Thurai, M.; Bringi, V.N.; Berne, A. Reconstructing the Drizzle Mode of the Raindrop Size Distribution Using Double-Moment Normalization. J. Appl. Meteorol. Climatol. 2019, 58, 145–164. [Google Scholar] [CrossRef]
  29. Wolff, D.B.; Marks, D.A.; Petersen, W.A. General Application of the Relative Calibration Adjustment (RCA) Technique for Monitoring and Correcting Radar Reflectivity Calibration. J. Atmos. Ocean. Technol. 2015, 32, 496–506. [Google Scholar] [CrossRef]
  30. Thurai, M.; Bringi, V.N.; Wolff, D.B.; Marks, D.A.; Pabla, C.S. Drop Size Distribution Measurements in Outer Rainbands of Hurricane Dorian at the NASA Wallops Precipitation-Research Facility. Atmosphere 2020, 11, 578. [Google Scholar] [CrossRef]
  31. Bringi, V.; Seifert, A.; Wu, W.; Thurai, M.; Huang, G.-J.; Siewert, C. Hurricane Dorian Outer Rain Band Observations and 1D Particle Model Simulations: A Case Study. Atmosphere 2020, 11, 879. [Google Scholar] [CrossRef]
  32. Bringi, V.N.; Chandrasekar, V. Polarimetric Doppler Weather Radar: Principles and Applications; Cambridge University Press: Cambridge, UK, 2001. [Google Scholar]
  33. Kennedy, P.C.; Rutledge, S.A. S-Band Dual-Polarization Radar Observations of Winter Storms. J. Appl. Meteorol. Climatol. 2011, 50, 844–858. [Google Scholar] [CrossRef]
  34. Lee, G.; Zawadzki, I.; Szyrmer, W.; Sempere-Torres, D.; Uijlenhoet, R. A General Approach to Double-Moment Normalization of Drop Size Distributions. J. Appl. Meteorol. 2004, 43, 264–281. [Google Scholar] [CrossRef] [Green Version]
  35. Bringi, V.N.; Mishra, K.V.; Thurai, M.; Kennedy, P.C.; Raupach, T.H. Retrieval of lower-order moments of the drop size distribution using CSU-CHILL X-band polarimetric radar: A case study. Atmos. Meas. Technol. 2020, 13, 4727–4750. [Google Scholar] [CrossRef]
  36. Bringi, V.N.; Thurai, M.; Petersen, W.A.; Gatlin, P.N. Using a network of 2D video disdrometers for external radar calibration of NASA’s S-band polarimetric radar. In Proceedings of the 36th Conference on Radar Meteorology, Breckenridge, CO, USA, 16–20 September 2013; Available online: https://ams.confex.com/ams/36Radar/webprogram/Paper228161.html (accessed on 15 March 2021).
  37. Schuur, T.J.; Ryzhkov, A.V.; Zrnić, D.S.; Schönhuber, M. Drop Size Distributions Measured by a 2D Video Disdrometer: Comparison with Dual-Polarization Radar Data. J. Appl. Meteorol. 2001, 40, 1019–1034. [Google Scholar] [CrossRef]
  38. Bringi, V.N.; Grecu, M.; Thurai, M.; Protat, A. Using Observed Drop Size Distributions in Light Rainfall: Application to the Combined DPR-GMI Algorithm. In AGU Fall Meeting; American Geophysical Union: Washington, DC, USA, 2020. [Google Scholar]
Figure 1. NASA Polarimetric (NPOL) radar and the disdrometer location.
Atmosphere 12 00392 g001
Figure 2. (a) RHI (range-height indicator) scan of Zh and (b) Zdr during a stratiform rain event on 16 October 2019. (c,d) RHI scans of Zh and Zdr during a convective rain event on 14 October 2019. (e) 1 min composite drop-size distributions (DSD) from disdrometers for the stratiform event in case (a), and (f) 1 min DSD for convective rain in case (c). The vertical black lines in the RHI scan correspond to the range of (and height above) the disdrometers.
Atmosphere 12 00392 g002
Figure 3. (a) RHI scan of Zh and (b) Zdr during a stratiform rain event on 6 September 2019 (Rain bands of Dorian storm). (c,d) RHI scans of Zh and Zdr during another convective rain event on 14 October 2019. (e,f) Vertical profiles of Zh and ρhv respectively, over the disdrometers for the stratiform rain in case (a), and (g,h) vertical profiles of Zh and ρhv respectively, over the disdrometers for the convective event in case (c).
Atmosphere 12 00392 g003
Figure 4. NW versus Dm from 1 or 3 min DSDs corresponding to Figure 2a,c and Figure 3a,c, as marked. For stratiform rain (more steady), 3 min DSDs were used, and for convective rain (faster variability), 1 min DSDs were used.
Atmosphere 12 00392 g004
Figure 5. Variation of the ‘index’ parameter with time for the 14 October 2019 event. Cases (i) to (vii) are marked where the index reaches close to or above 0 threshold.
Atmosphere 12 00392 g005
Figure 6. NPOL RHI scans of Zh and Zdr corresponding to cases (ivii) in Figure 5. The arrows point to the vertical profiles above the location of the disdrometers.
Atmosphere 12 00392 g006
Figure 7. Variation of the ‘index’ parameter with time for the 16 October 2019 event. Cases (i), (ii), and (iii) are marked where the index indicated stratiform, convective, and ‘mixed’ or ‘uncertain’ rain, respectively.
Atmosphere 12 00392 g007
Figure 8. NPOL RHI scans of Zh and Zdr corresponding to cases (i)–(iii) in Figure 7. The arrows point to the vertical profiles above the location of the disdrometers.
Atmosphere 12 00392 g008
Figure 9. (a) NW and (b) Dm variation with time from the 3 min composite DSDs, (c) log10 (Nw) versus Dm from the 3 min DSDs for each hour (color-coded), and (d) variation of the convective-stratiform rain index with time.
Atmosphere 12 00392 g009
Figure 10. (a) RHI scan of Zh, (b) Zdr during a stratiform rain event (with a thick bright band) on 6 September 2019, i.e., rain bands of Dorian storm, and (c,d) vertical profiles of Zh and ρhv respectively, over the disdrometers (black lines in panels (a,b)).
Atmosphere 12 00392 g010
Figure 11. S-band simulation results of (a) Dm′ versus Zdr, (b) Dm with Dm′, and (c) NW/Zh (linear) versus Dm′.
Atmosphere 12 00392 g011
Figure 12. Retrievals from NPOL-RHI scans from the 6 September 2019 event (left panels) and from the 14 October 2019 event (right panels). (a,e) Show the retrieved NW, (b,f) show the retrieved Dm, (c,g) show the convective-stratform (C-S) rain index values, and (d,h) show the NW versus Dm for the two cases, for height range from 0.5 to 3 km.
Atmosphere 12 00392 g012
Publisher’s Note: MDPI stays neutral with regard to jurisdictional claims in published maps and institutional affiliations.

