Article

Evaluation of ENSO Prediction Skill Changes since 2000 Based on Multimodel Hindcasts

1
National Marine Environmental Forecasting Center, State Oceanic Administration, Beijing 100081, China
2
Institute of Marine Science and Technology, Shandong University, Qingdao 266237, China
3
Southern Marine Science and Engineering Guangdong Laboratory (Zhuhai), Zhuhai 519080, China
4
State Key Laboratory of Remote Sensing Science, Aerospace Information Research Institute, Chinese Academy of Sciences, Beijing 100101, China
*
Author to whom correspondence should be addressed.
Atmosphere 2021, 12(3), 365; https://doi.org/10.3390/atmos12030365
Submission received: 1 February 2021 / Revised: 26 February 2021 / Accepted: 9 March 2021 / Published: 10 March 2021
(This article belongs to the Special Issue ENSO Prediction)

Abstract

:
In this study, forecast skill over four different periods of global climate change (1982–1999, 1984–1996, 2000–2018, and 2000–2014) is examined using the hindcasts of five models in the North American Multimodel Ensemble. The deterministic evaluation shows that the forecasting skills of the Niño3.4 and Niño3 indexes are much lower during 2000–2018 than during 1982–1999, indicating that the previously reported decline in forecasting skill continues through 2018. The decreases in skill are most significant for the target months from May to August, especially for medium to long lead times, showing that the forecasts suffer more from the effect of the spring predictability barrier (SPB) post-2000. Relationships between the extratropical Pacific signal and the El Niño-Southern Oscillation (ENSO) weakened after 2000, contributing to a reduction in inherent predictability and skills of ENSO, which may be connected with the forecasting skills decline for medium to long lead times. It is a great challenge to predict ENSO using the memory of the local ocean itself because of the weakening intensity of the warm water volume (WWV) and its relationship with ENSO. These changes lead to a significant decrease in the autocorrelation coefficient of the persistence forecast for short to medium lead months. Moreover, for both the Niño3.4 and Niño3 indexes, after 2000, the models tend to further underestimate the sea surface temperature anomalies (SSTAs) in the El Niño developing year but overestimate them in the decaying year. For the probabilistic forecast, the skills post-2000 are also generally lower than pre-2000 in the tropical Pacific, and in particular, they decayed east of 120° W after 2000. Thus, the advantages of different methods, such as dynamic modeling, statistical methods, and machine learning methods, should be integrated to obtain the best applicability to ENSO forecasts and to deal with the current low forecasting skill phenomenon.

1. Introduction

The El Niño-Southern Oscillation (ENSO), the leading mode of interannual variability in the tropical Pacific Ocean, is a naturally occurring fluctuation in the coupled ocean-atmosphere system. ENSO events not only cause substantial anomalies in the tropics, but also have significant effects on global weather and climate [1,2]. It is of profound scientific and social importance to understand the variations and forecasting of ENSO. In this respect, significant progress has been achieved in operational ENSO predictions in the past few decades, with more than 20 models offering real-time forecasting of ENSO from 6 months to 1 year in advance [3].
Given the research efforts of the scientific community, we could reasonably expect our ability to predict ENSO to have improved in the last few decades. This is mainly because of the improved observational systems that have been developed (especially the Argo float profiling program after 2000 [4]), which have led to a better analysis of the ocean state, but it is also due to the ongoing improvements made to seasonal forecast models and our improved basic scientific understanding of ENSO. Nevertheless, there is growing evidence that the skill of ENSO predictions has declined since 2000, relative to what was achieved pre-2000 by using both dynamic and statistical models [5,6,7]. The interannual variability in the tropical Pacific Ocean was significantly weaker in 2000–2011 compared with 1979–1999, which is also demonstrated by the coherent reduction in the variability of the subsurface ocean temperature and the weakening of the atmosphere–ocean coupling throughout the tropical Pacific Ocean [6,8,9]. The breakdown of the relationship between the warm water volume (WWV, defined as an average of 20 °C isotherm between 5° S–5° N, 120°E–80° W and is a measurement of integrated equatorial ocean heat recharge and discharge processes) integrated along the equatorial Pacific Ocean and ENSO sea surface temperature anomalies (SSTAs) has been offered as another explanation for the reduced skill of ENSO forecasting. For instance, it was reported that the WWV was used to lead ENSO SSTAs by 7–9 months during 1979–1999 and was often a good predictor for ENSO seasonal forecasting [10]. However, during 2000–2016, the WWV variations decreased and the lead times decreased to 3–4 months, with a weaker correlation [9,11,12]. This decline also coincided with more frequent occurrences of Central Pacific El Niño (CP-ENSO) events [13,14], in which the SST warming is not only related to the thermocline feedback, but also some other extratropical processes. Thus, it reduces the usefulness of thermocline feedback as a predictor for ENSO, and therefore the thermocline variation was no longer a good predictor of ENSO after 1999 [15,16]. Moreover, more CP-ENSO events also means greater challenges in forecasting since the onset and evolution of the CP-ENSO are mainly governed by local zonal advection feedback. In particular, the onset is subject to atmospheric stochastic zonal wind forcing [17,18]. However, the limits of the predictability of westerly wind bursts are still ambiguous, thus limiting the skill of CP-ENSO predictions. Since ENSO has shifted into a higher-frequency and weaker-intensity regime since 2000 [19], the reduced amplitude of the SSTAs poses an inherent challenge in model predictions because the signal to be predicted is small while the noise remains relatively large [20]. Moreover, the relationship between the development of ENSO and the extratropical Pacific meridional mode (PMM) has been discussed extensively in observations and certain coupled climate models in the past two decades [21,22,23,24]. The PMM was used to project onto the Pacific SST via alterations of the trade wind easterlies, which, in turn, affect latent heat fluxes [21]. This SST footprint in North Pacific and South Pacific are termed the Victoria mode [25,26] and South Pacific quadrapole mode (SPQ, [27,28]). Chang et al. [22] found that over 70% of El Niño events occurring between 1958 and 2000 are preceded by PMM events in observational datasets. Larson and Kirtman [23] found not only the PMM variability can be captured well by the multimodel ensemble mean, but it also appears as a precursor to ENSO events with more skills in the forecast of eastern Pacific El Niño events than CP El Niño events in the North American Multimodel Ensemble (NMME) because of the regime-specific precursor relationship found between PMM and ENSO indexes. Since the extratropical Pacific modes have been shown to influence the onset of ENSO, there is still a need to learn more about the changes of this relationship before and after 2000.
Three extreme super El Niño events have occurred in the tropical Pacific since 1980: in 1982/1983, 1997/1998, and 2015/2016. Previous studies have compared the variability of the first decade of the 21st century with the variability before 2000, thus excluding the 2015/2016 event. The smaller variability of the recent period investigated in these studies is likely related to the lack of extreme strong events, such as the 1982/1983 and 1997/1998 events. The 2015/2016 El Niño event, which peaked in the Niño3.4 region, was slightly different from the other two events. The interannual variability of SST in the tropical Pacific has weakened significantly since 2000, and is obviously reflected in the atmosphere and ocean. Under this background, there are still many problems to be understood and overcome. Since previous studies have mostly focused on the forecasting skills in all seasons, insufficient research has been conducted on how the forecasting skills changed with the targeted months after 2000. Affected by the change in the SSTA variability in the tropical Pacific, it is still unknown how the corresponding persistence forecasting skills changed after 2000. The main reasons for the changes in the forecasting skills of models and persistence forecast also remain unknown. In addition, there is no clear result concerning the SSTA bias difference during the evolution of El Niño events before and after 2000. Furthermore, most previous studies have focused solely on deterministic predictions. However, climate forecasts are known to be associated with uncertainties that can be quantified in terms of probabilities, and one focus of this study is to investigate the changes in the probabilistic forecasting skills after 2000.
Based on the above considerations, four periods were selected (1982–1999, 1984–1996, 2000–2018, and 2000–2014) to compare the forecasting skills during each period in order to reduce the uncertainty caused by the selection of a single time period. Five of the models used in the North American Multimodel Ensemble (NMME) [29] seasonal prediction experiment were selected for use in our study. The details of these models are described in Section 2, along with the observational data and methods used to evaluate the deterministic and probabilistic forecasts. The changes in the forecasting skills of the multimodel ensemble (MME) hindcasts over the four selected periods from deterministic and probabilistic points of view are described in Section 3, as well as the changes in the persistence forecasting skills, and the bias changes during the evolution of El Niño events. The main conclusions of our study are presented in Section 4.

2. Materials and Methods

The NMME is a multimodel forecasting system consisting of a series of coupled climate models from U.S. modeling centers, including NCEP, GFDL, NASA, NCAR, and the Canadian Meteorological Centre. In this study, we selected five models: the Canadian Centre for Climate Modelling and Analysis (CCCma) Third and Fourth Generation Canadian Coupled Global Climate Model (CanCM3 and CanCM4, respectively [30]); CanCM4i, which was upgraded from CanCM4 with improved initialization; GEO-Nucleus for European Modelling of the Ocean (NEMO), which was developed at the Recherche en Prévision Numérique (RPN), is a fully global atmosphere-ocean-sea ice coupled model, with the atmospheric component of GEM [31] and the ocean component of Nucleus for European Modelling of the Ocean (NEMO, http://www.nemo-ocean.eu accessed on 10 March 2021); and the Forecast-Oriented Low Ocean Resolution version of GFDL CM2.5 (GFDL-CM2p5-FLOR-B01, hereafter simply referred to as GFDL).
Our deterministic analysis is based on the target months, and all of the models in the NMME that can provide continuous hindcasts from 1981 to 2018 were selected in order to include the 1982/1983 El Niño event. It is worth noting that our final results do not fully represent the performance of the NMME. Our main purpose was to explore the consistency of the model predictions before and after 2000 by looking for the commonalities among the selected models. All of the NMME data used in this paper are available on the IRI data server: http://iridl.ldeo.columbia.edu/SOURCES/.Models/.NMME/ accessed on 10 March 2021.
The study period includes both hindcasts and real-time predictions from 1981 to 2018 (hereinafter, we collectively refer to them as hindcasts for simplicity), which includes three extremely strong El Niño events. Following convention, a 1-month lead prediction was treated as predictions initialized from a previous month, and the 1-month lead forecast was then the mean of the first month of the forecast run. For example, for the 1-month lead predictions for January, the predictions of the monthly means were based on the initial conditions in December of the previous year. These five models all provide predictions with maximum lead times of up to 12 months, and the members are 10, except for the GFDL which has 12. All of the forecasts were conveniently regridded on the same 1° grid.
For verification, the SST data used in this study are the optimum interpolation (OI), version 2, monthly mean SST [32]. They were constructed by combining observations from different platforms (satellites, ships, and buoys) on a regular global grid. To perform a quantitative comparison with the model forecasts, the OISST data were remapped to the same 1° grid as the model forecasts.
The monthly SSTAs for each member of each model and the observations were defined with respect to the climatological periods of the four periods (1982–1999, 1984–1996, 2000–2018, and 2000–2014). By using the anomalies, the mean forecast biases for each model could more or less be removed. We avoided using one common climatological period to eliminate the influence of the mean state on the SSTA calculations. The monthly mean Niño3.4 and Niño3 used in this paper are the average SSTAs over (5° S–5° N, 150°–90° W) and (5° S–5° N, 170°–120° W), respectively, for both the OISST and NMME forecasts. Following Ding et al. [26], the second principal component (PC2) of the monthly SSTAs (with trends removed) over the North Pacific (20°–60° N, 120° E–100° W) for the period 1982–2019 was defined as the Victoria mode index (VMI) and, correspondingly, the PC2 of the monthly SSTAs (with trends removed) over the South Pacific (20°–60° S, 120° E–100° W) for the same period was defined as the South Pacific quadrupole index (SPQI, [28]).
The predictive verification approaches examined here address the quality of the deterministic and probabilistic SST predictions. The deterministic evaluation, which is focused on the predictions defined by the multimodel ensemble (MME) mean SSTA prediction (representing the forecast signal and ignoring the uncertainty) for the five models, was mainly based on the temporal anomaly correlation between the predictions and observations. The deterministic predictive skills in terms of correlation as a function of targeted months and lead time are highlighted. Moreover, for the probabilistic evaluation, all of the SSTA members for CanCM3, CanCM4, CanCM4i, and GEM-NEMO and the first 10 members for GFDL were used in order to ensure that the same weights were assigned to each participating model. To assess the skill of the forecasts against the climatological forecasts in each equi-probable category (i.e., 0.33 for each of the tercile category, the COLD, NEUTRAL, and WARM categorical events), we used the Brier skill score method (BSS; a detailed description is given by Wilks in [33]). The BSS reveals the relative accuracy of the probabilistic forecast over that of the observed climatology by predicting whether or not an event occurred. A BSS of 1 indicates a perfect forecasting system.

3. Results

3.1. Changes in the Deterministic and Persistence Predictability

The temporal anomaly correlation results between the MME forecasts and the observations of the monthly Niño3.4 and Niño3 indexes for the four periods are shown in Figure 1a,b, respectively. Basically, the skills of the Niño3.4 index are larger than those of the Niño3 index, regardless of the lead times. For the skills over the four periods, for both the Niño3.4 and Niño3 indexes, the highest correlation coefficients are for all of the lead times for 1982–1999, exceeding 0.8 even with a 9-month lead time. In contrast, the lowest correlations are for 2000–2014, especially for short to medium lead times. For example, the level of forecasting skill achieved for an 11-month lead time during 1982–1999 was only as accurate as the 6-month and 5-month lead times for the Niño3.4 and Niño3 indexes during 2000–2014, respectively. The forecasting skills were lower during 1984–1996 than during 1982–1999 for all of the lead times, but the skills were higher than for 2000–2018 for almost all of the lead times despite the exclusion of two super El Niño events, especially for long lead times, for which the differences reached 30–50%. It should be noted that the forecasting skills of the Niño3.4 and Niño3 indexes during the two periods in the late 20th century were much higher than for the other two post-2000 periods, indicating that the previously reported decline in forecasting skill continues through 2018. The advantages offered by the MME over the individual model predictions are also shown in Figure 1, as the MME has a better performance than the most skillful individual model for almost all of the lead times, except in a few cases such as during 1984–1996 for long lead times for the Niño3.4 and Niño3 indexes and for short leads for the Niño3 index. Since the advantage of the MME has also been found in many other multimodel studies [29,34,35], the advantage of using the MME is the consistently better performance when considering all aspects of the predictions [36,37,38].
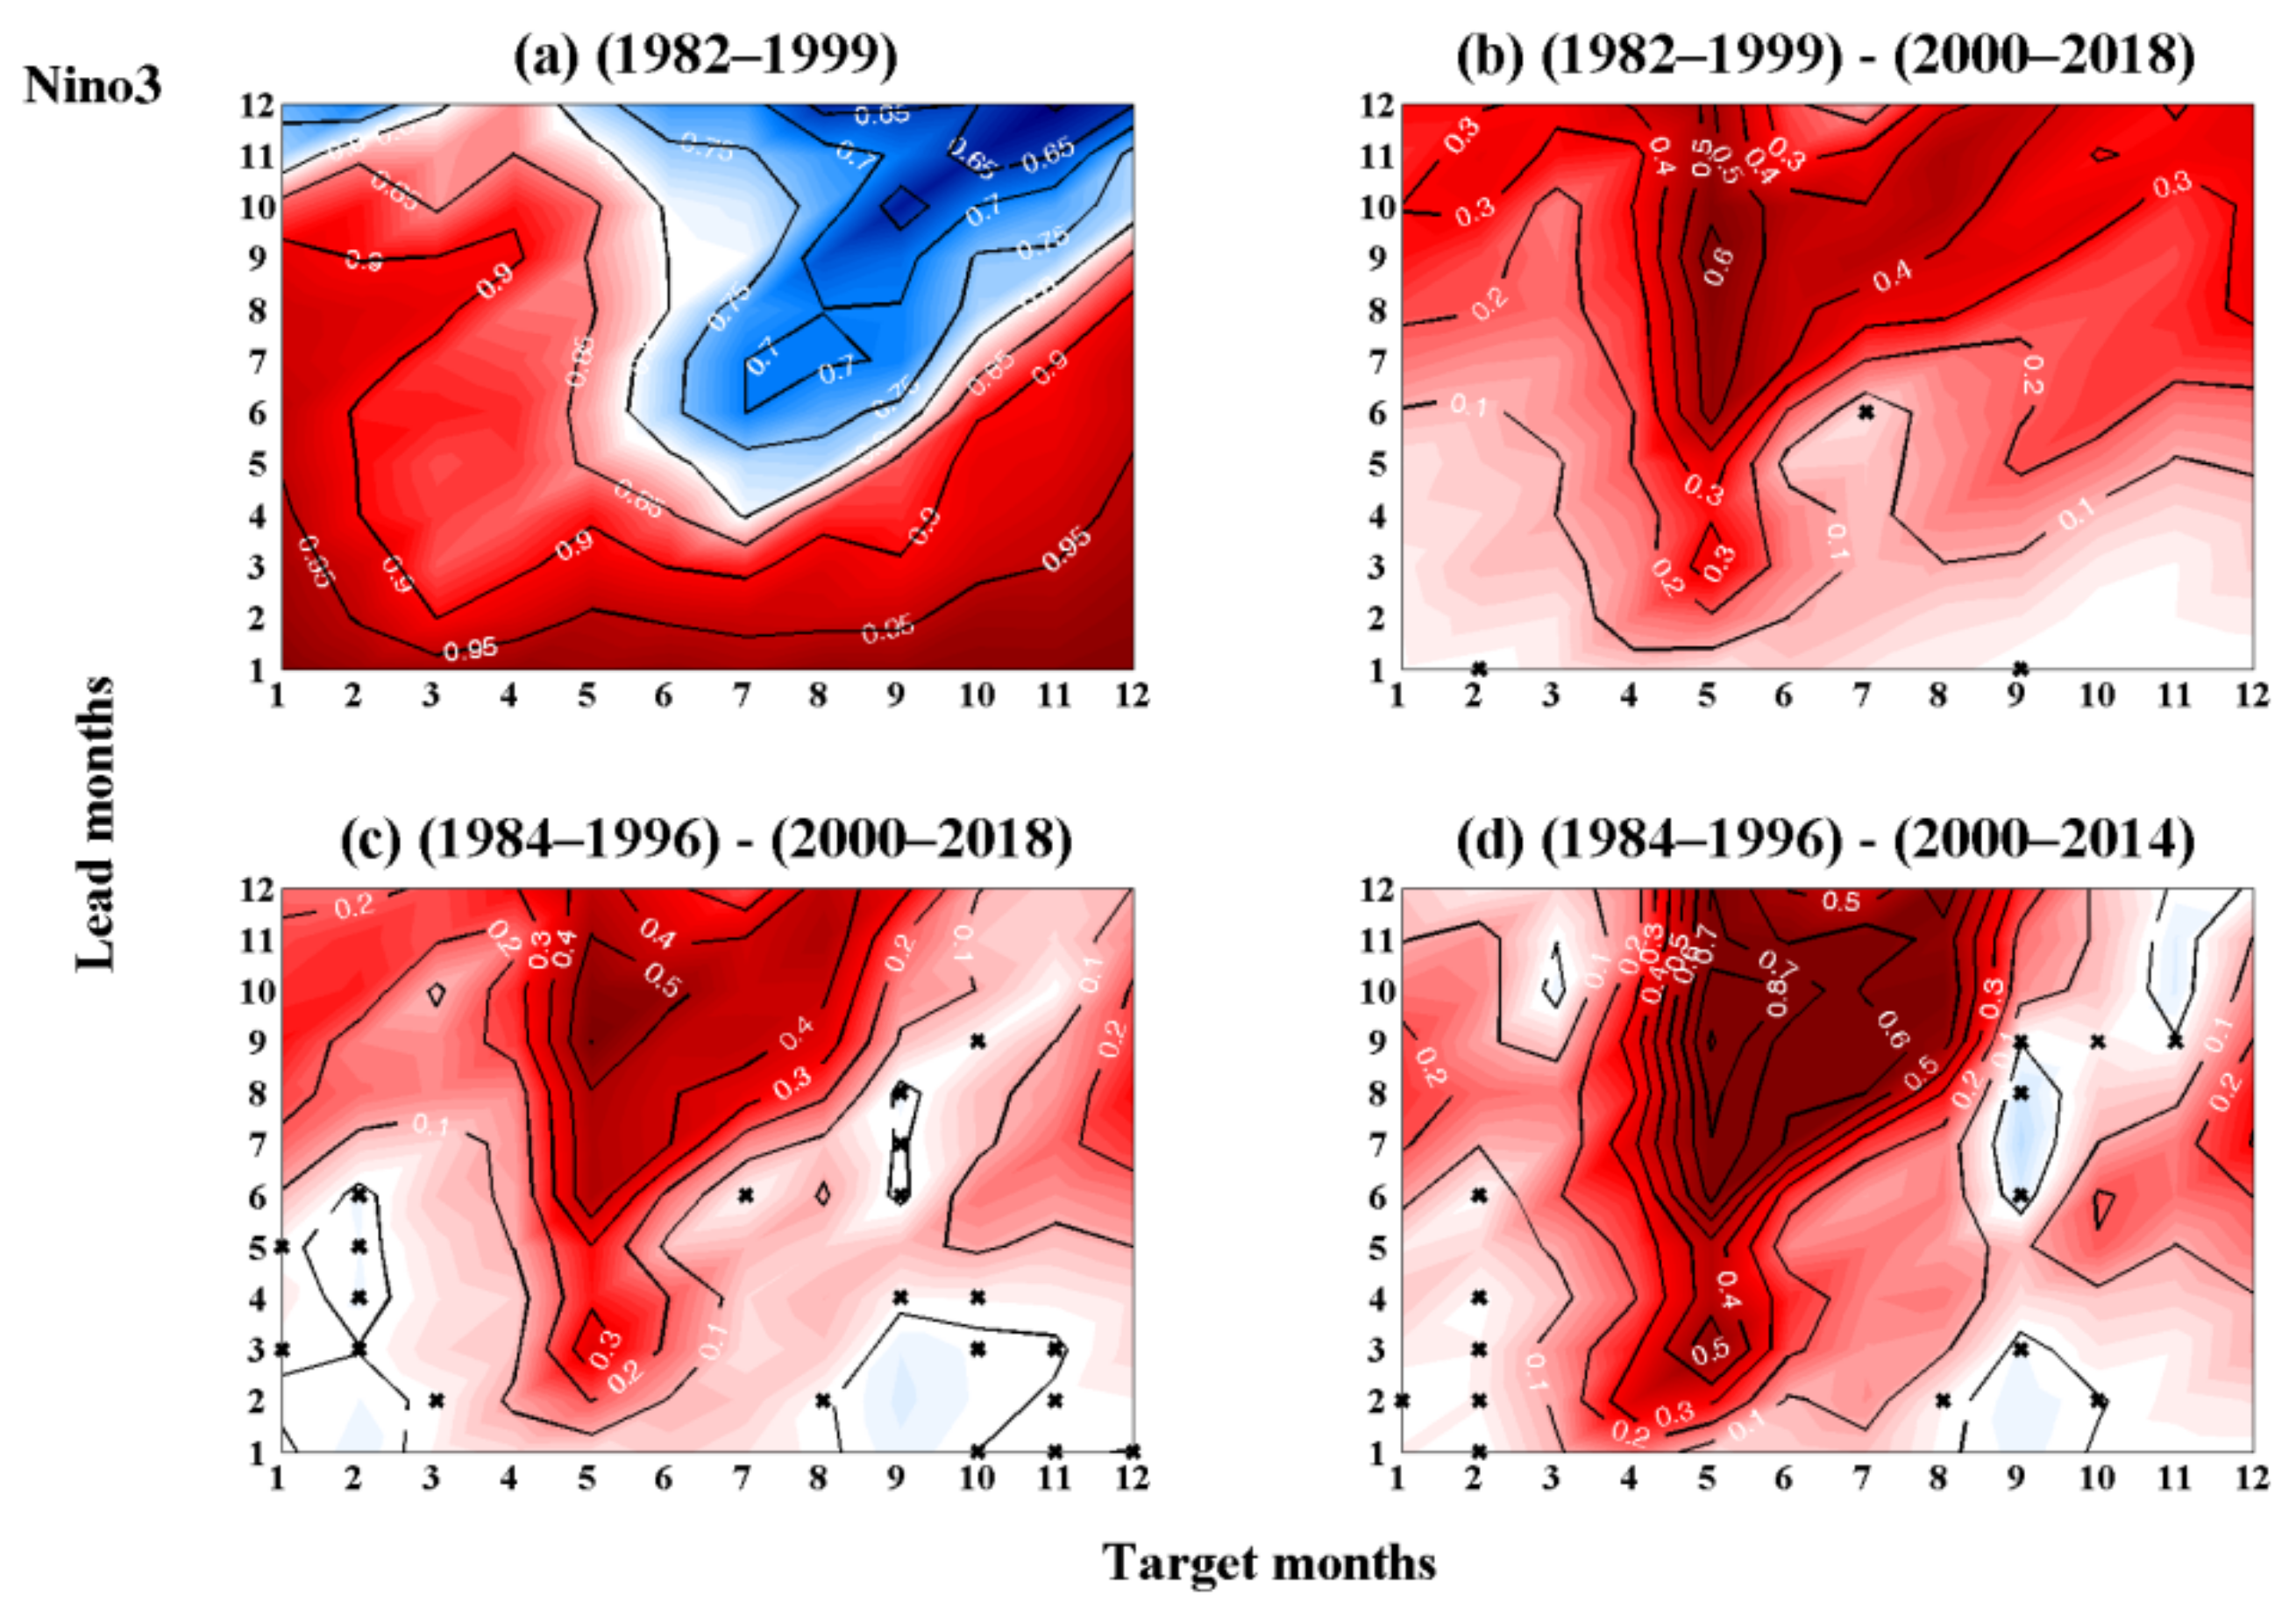
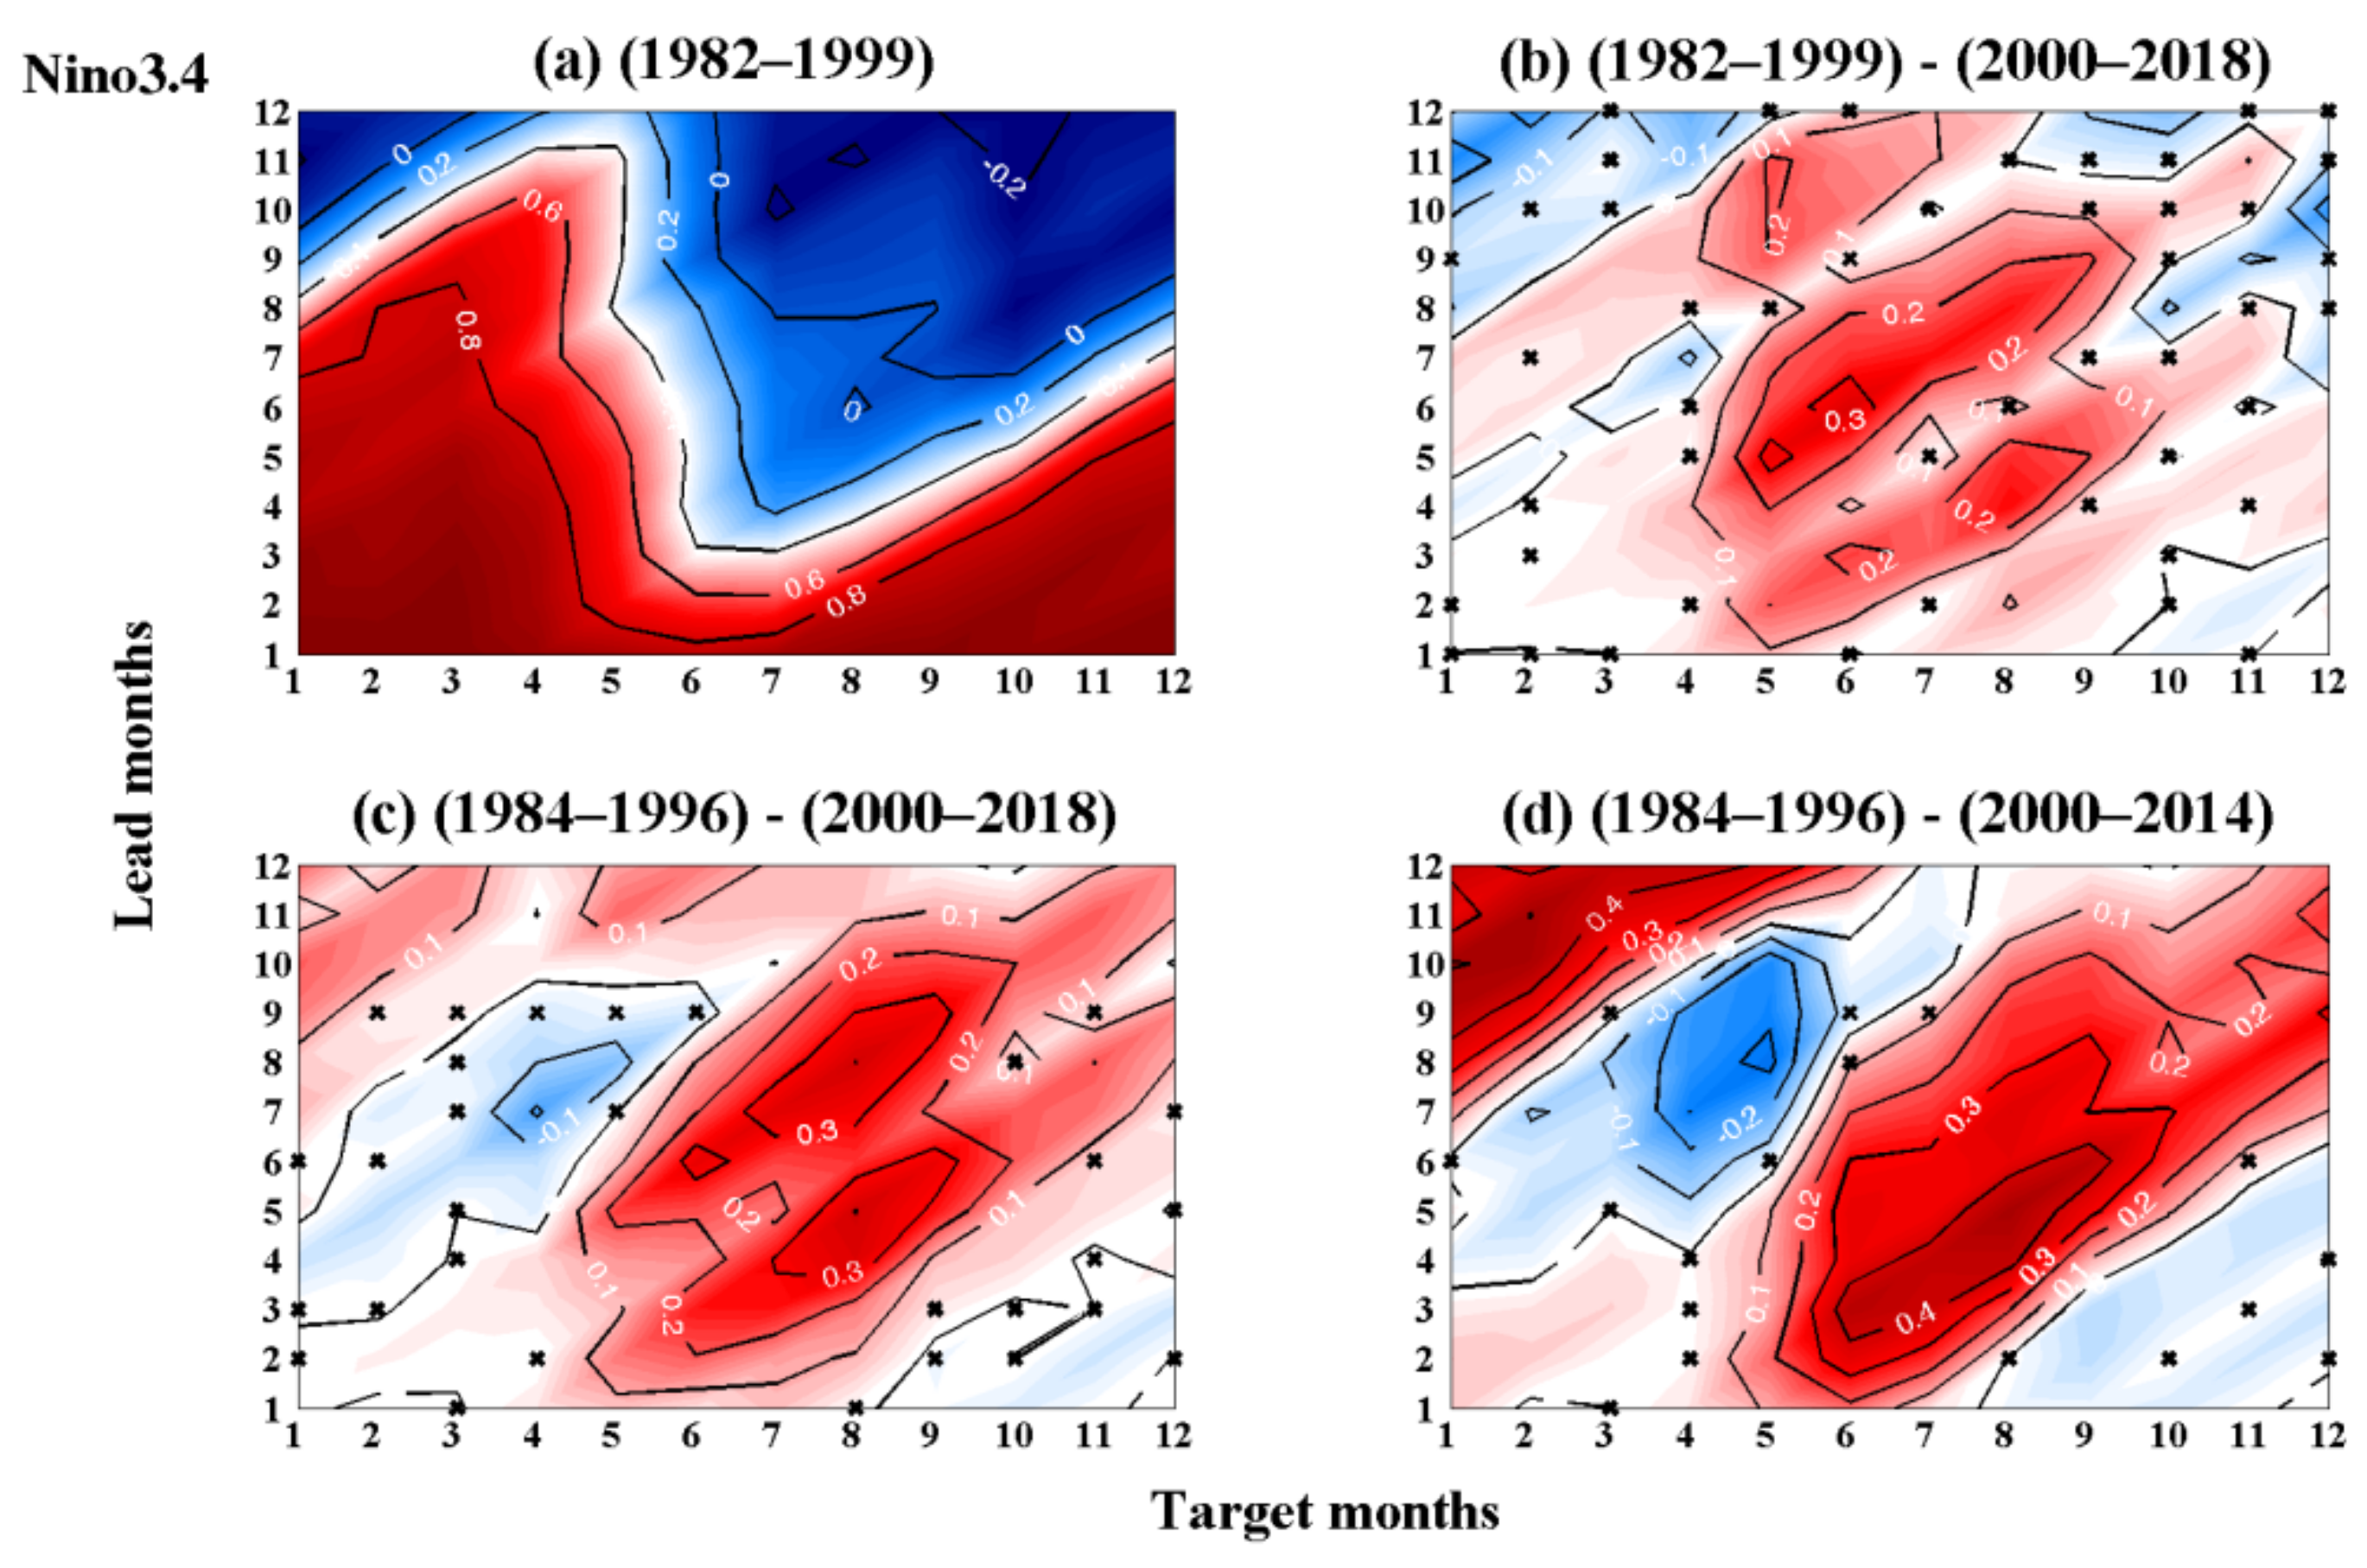
The annual cycles of the MME Niño3.4 SSTA forecasting skills in terms of correlation as a function of all 12 target months and lead times of 1–12 months are shown in Figure 2a. The correlation pattern indicates encouragingly high forecasting skills for the MME predictions, but the most severe forecasting errors associated with the spring predictability barrier (SPB) can also be seen [39,40], with relative decreases in skill beginning in the boreal summer and continuing into the later months for longer lead times. The correlation differences between the different periods tend to be larger at medium to long lead times (Figure 2b–d), which is consistent with the features shown in Figure 1. Compared with post-2000, the skills pre-2000 were much larger, especially from May to August for medium to long lead times, which could account for the skill differences between pre-2000 and post-2000 for all of the months combined (Figure 1a). The skill differences can exceed 0.4 at long lead times, especially in the boreal summer. This is predominantly due to the SPB effect, which degrades the skills post-2000. In addition, only slightly negative skill differences are seen in Figure 2c,d from January to April and September for short to medium lead times, indicating limited improvement in skills for post-2000 compared to 1984–1996. The occurrence of the 1982/1983 and 1997/1998 El Niño events increased the forecasting skills from August to December at medium to long lead times, which can be seen by comparing Figure 2b,c. Furthermore, for the 2015/2016 El Niño event, it helped to improve the correlation skills from February to August (seen from a comparison of Figure 2c,d), which is different from the 1982/1983 and 1997/1998 El Niño events. Correlation patterns and their differences similar to those of the Niño3.4 index are seen for the Niño3 index. In contrast, the Niño3 index has relative lower skills than the Niño3.4 index for almost all of the lead times and target months during 1982–1999 (Figure 3a). However, the skill differences between pre-2000 and post-2000 are larger from April to August, indicating significantly degraded skills due to the SPB, and the originally significant differences at medium to long lead times for the Niño3.4 index expand to all of the lead times for the Niño3 index (Figure 3b–d). Furthermore, contrary to the skill differences between 1984–1996 and post-2000 for the Niño3.4 index, there are no negative skill differences for the Niño3 index, which indicates that the skills were reduced as a whole post-2000.
Figure 4 shows the persistence forecast skills for the observed Niño3.4 index represented by an autocorrelation. Its distribution as a function of the target months and lead times is similar to the results of the models, and they all show obvious SPB phenomena. The skill of the persistence forecast is comparable to that of the model forecast for short lead months, but for medium to long lead times, the skill of the persistence forecast is significantly lower than that of the model forecast. In the different periods, the most remarkable feature is that the persistence forecast exhibits higher skills pre-2000 than post-2000, especially for the target months of May to September for short to medium lead times. The persistence forecast skills of the Niño3 index and the skill differences before and after 2000 are consistent with the results for the Niño3.4 index (Figure 5). This also shows that the forecasting skills for the target months of May to September are larger pre-2000 than post-2000, and there are larger skills differences compared with the Niño3.4 index.

3.2. Main Causes of the Changes in the Deterministic and Persistence Predictability

Based on the analysis in Section 3.1, the decrease in the persistence forecast skills for the Niño3.4 and Niño3 indexes after 2000 are most significant for short to medium lead times, which may be caused by the change in the local SSTA variability in the tropical Pacific, because the persistence predictions are mainly based on the local memory of the local SSTA. This decrease may be due to the weakening of the WWV variability and its relationship with ENSO, with WWV led Niño3.4 by 7–9 months pre-2000 but only 3–4 months after 2000, which means that such precursors became less effective for ENSO forecasting after 2000. Neske and McGregor [41] point out that the contribution of instantaneous wind responses (unpredictable) increased and the contribution of adjusted wind responses (predictable) decreased in association with the weakened relationship between WWV and Niño3.4 after 2000. Despite the decline, the recharge-discharge process still controlled ENSO evolution to some extent [41,42], and still serves as a necessary precondition for the evolution of ENSO [43,44].
Previous studies have shown that the second mode of the SSTA in the North Pacific and South Pacific could both affect the occurrence of ENSO—the former through a seasonal footprint mechanism and the latter through the trade-wind charge mechanism. [21,26,45]. The importance of extratropical processes to ENSO prediction makes it a current research hotspot. In this study, the observational relationships between the VMI, SPQI, and ENSO in different periods are studied. The results show that the correlation coefficient between VMI and the Niño3.4 index decreases significantly after 2000, and the relationship between them is most significant when the VMI leads the Niño3.4 index by 10–11 months (Figure 6a). The results obtained using a 10-year sliding-window correlation analysis indicate that although there was a significant decreasing trend for the correlation coefficient between the VMI and Niño3.4 index with the VMI leading 10 months before 2000, the mean correlation coefficient before 2000 was still significantly larger than that after 2000 (Figure 6b). The SPQI has the largest correlation coefficient with the Niño3.4 index when for an 8-month lead time. A 10-year sliding-window correlation analysis was also used to explore the interannual variation in the relationship between the SPQI and the Niño3.4 index with SPQI leads of 8 months. It revealed that their relationship weakens rapidly after 2000, and it is also slightly larger before 2000 than after 2000 (Figure 6c,d). Thus, it has been proven that the relationships for both VMI and SPQI with the Niño3.4 index become weaker after 2000. This contributes to a reduction in inherent predictability and skills of ENSO. In the previous section, we found that the forecasting skills of the Niño3.4 and Niño3 indexes weakened significantly after 2000, especially for medium to long lead times in models. Interestingly, the timescale of the lead months with most declined skills after 2000 are consistent with the months when the VMI and SPQI showed the maximum relationship with the Niño3.4 index. Since the observational results are the basics of dynamical and statistical models, we can have a better understanding of the changes of the relationships between the extratropical indices and ENSO by observations and then speculate on the possible connections between the observational relationship changes and the forecasting skill changes in models. The ENSO statistical models’ forecasting skills can be improved by including the extratropical processes, especially reflected in the forecasts with medium to long lead times [46]. Thus, it is reasonable that the forecasting skill in statistical models declines when the relationship between the extratropical processes and ENSO weakened after 2000. By evaluating the dynamical models’ ability in predicting the extratropical processes and their relationship with ENSO in NMME, Larson and Kirtman [23] found that the forecasting systems can not only predict the variability of PMM well, but also can be used as a precursor of ENSO. Thus, it shows that the significant regime-specific precursor relationship between PMM and ENSO is also well reflected in the forecast system. What is more, they also pointed out that forecast models have higher forecast skills in eastern Pacific El Niño events than central Pacific El Niño events. These results are consistent with the fact that the forecasting skills are reduced after 2000 under the background of frequent occurrence and low amplitude (signal) of central Pacific El Niño events.

3.3. Changes in the Forecasting of the SSTA Bias during El Niño Events

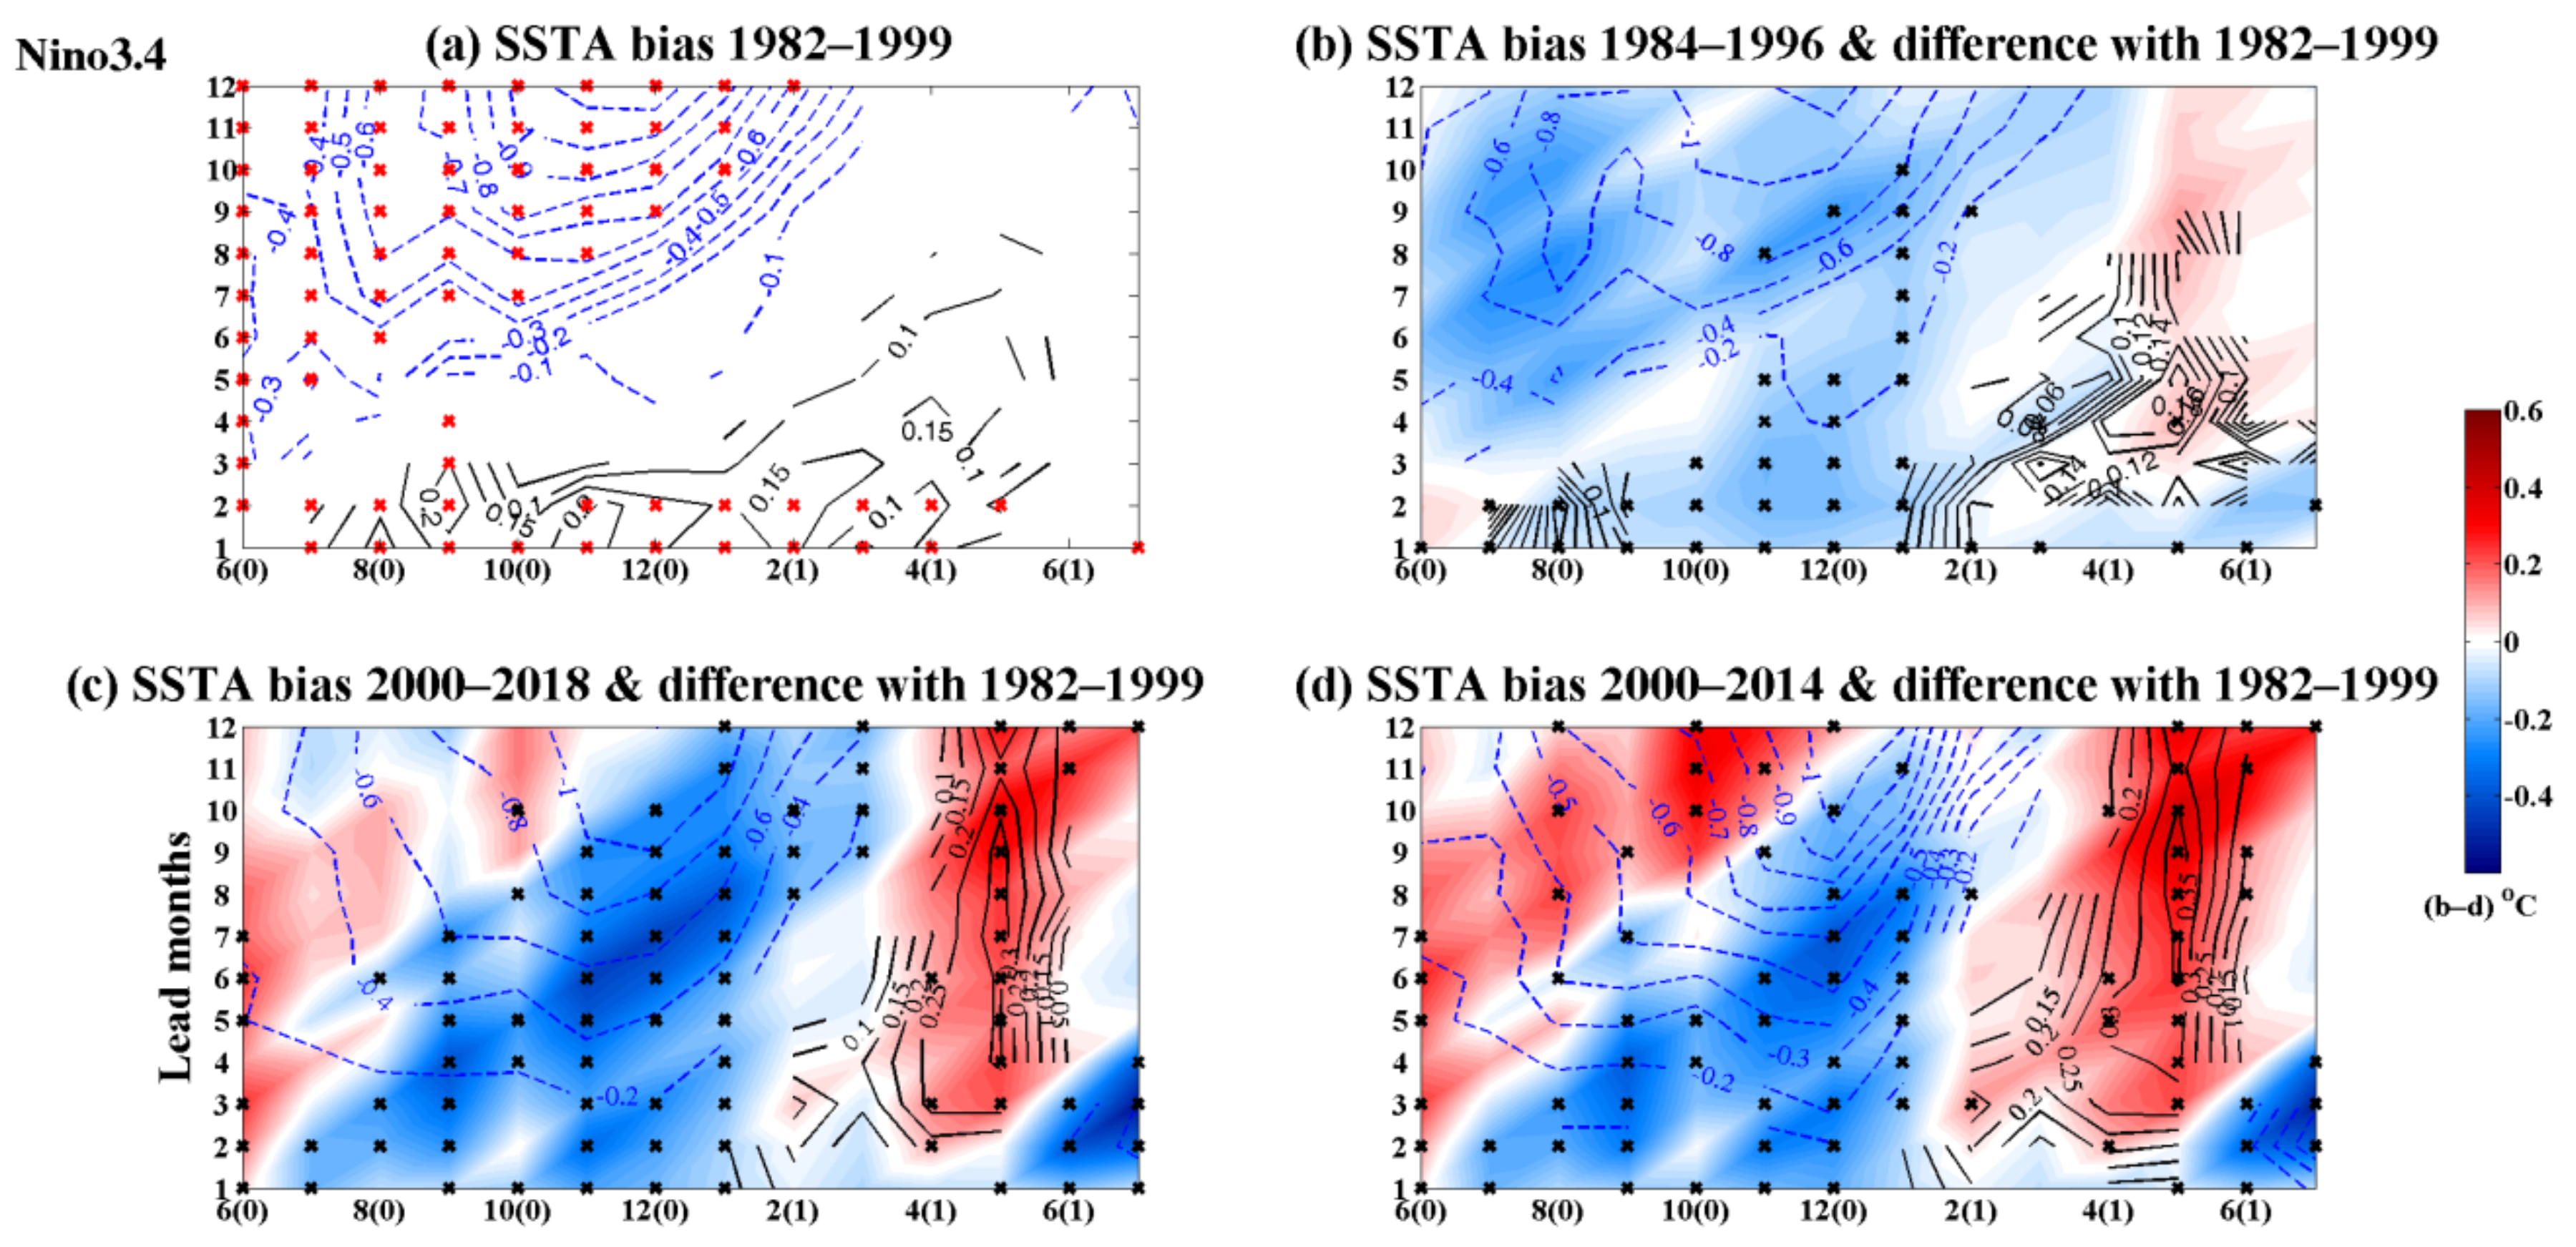
To further examine the overall ability of the MME to predict the El Niño events corresponding to different periods, the changes in the composite SSTA bias for the Niño3.4 index of the El Niño evolution during each period were calculated (Figure 7). In addition, in order to take into consideration the forecasting SSTA bias of all of the models, only the targets months with lead months when the signs of the SSTA bias were the same between the MME and the five individual models were marked with crosses.
An El Niño year is defined as when the 5-month running mean of the Niño3.4 index exceeds 0.4 °C for at least six months [47]. It can be seen that the models tend to underestimate the SSTA, especially for long lead times during the El Niño developing year, but they overestimate the SSTA for short to medium lead times during the El Niño decaying year. This means the models are inclined to underestimate the amplitudes of El Niño events, particularly when forecasting with a long lead time. Moreover, when initiated around the peak of an El Niño event, the models are deficient in forecasting the rapidly decaying characteristics of El Niño events, thus leading to the overestimation of the amplitudes of El Niño events for short to medium lead times. Compared with pre-2000, the negative (positive) SSTA bias between the models and observations post-2000 tends to be larger during the El Niño developing (decaying) year, especially for medium to long lead times (Figure 7b–d).
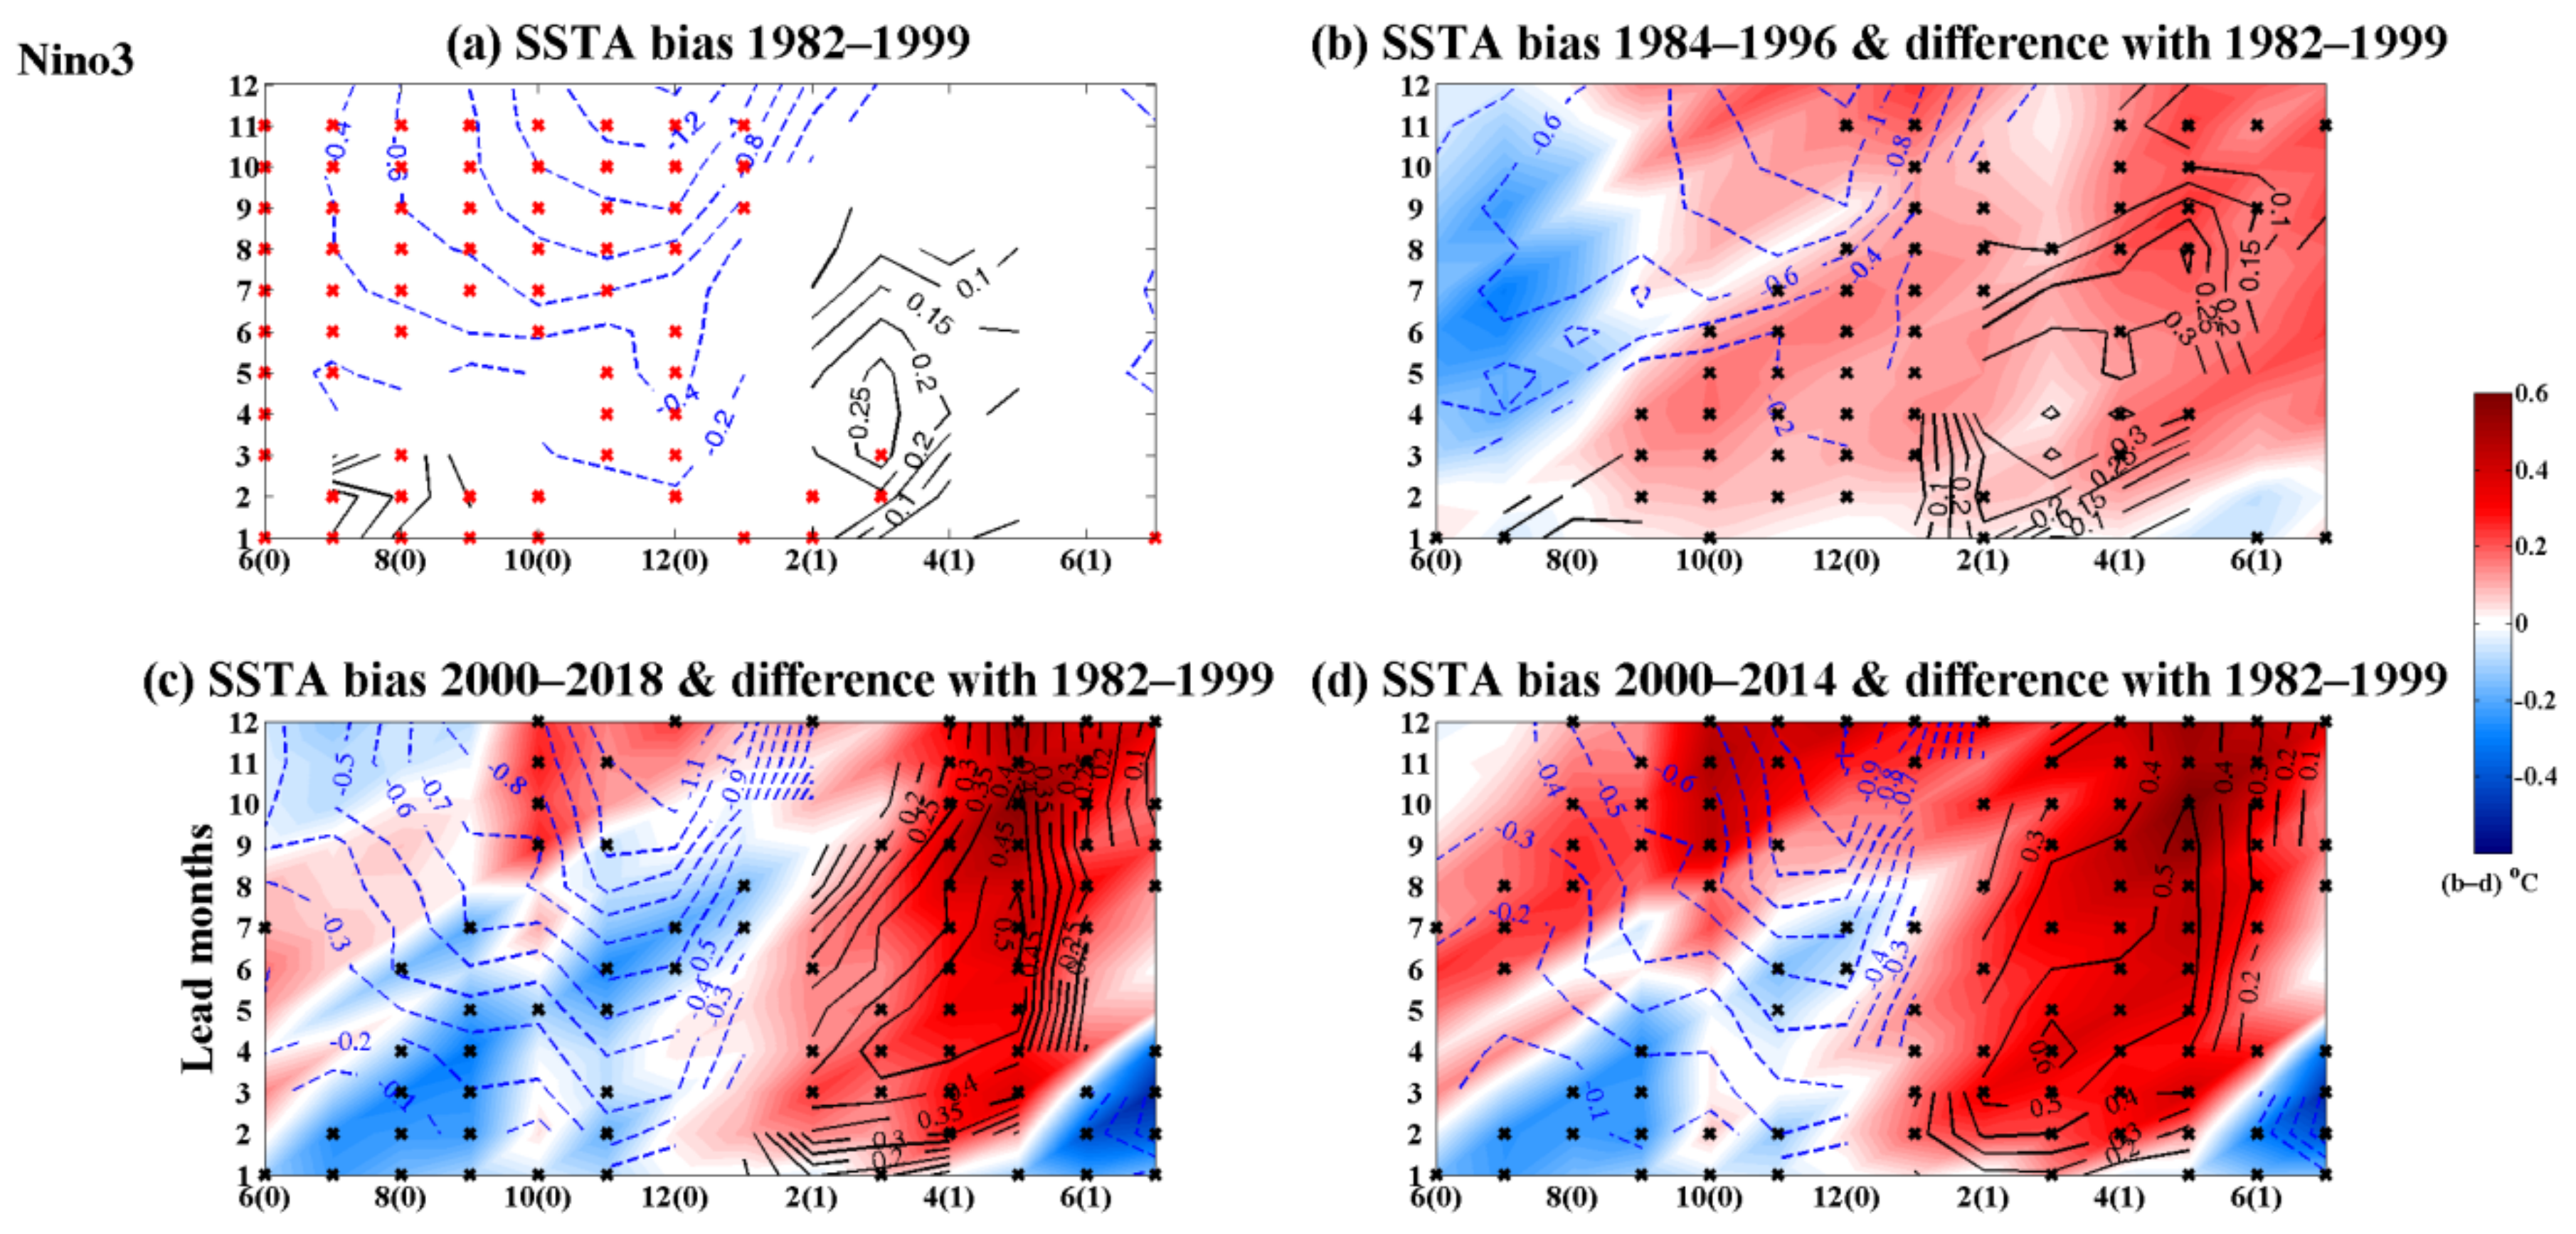
The models show similar SSTA bias for the Niño3 index during El Niño events, that is, they underestimate the amplitudes in the El Niño developing year and overestimate them in the decaying year (Figure 8).Compared with the changes in the SSTA bias for the Niño3.4 index shown in Figure 7, the SSTA bias for the Niño3 index is much larger in the El Niño decaying year for all of the lead times, but they become slightly weaker in the El Niño developing year, especially for short to medium lead times after 2000.
In conclusion, compared with the forecasts before 2000, the models tend to further underestimate the SSTA in the El Niño developing year, but they overestimate them in the decaying year for both the Niño3.4 and Niño3 indexes after 2000.

3.4. Changes in the Probabilistic Predictability

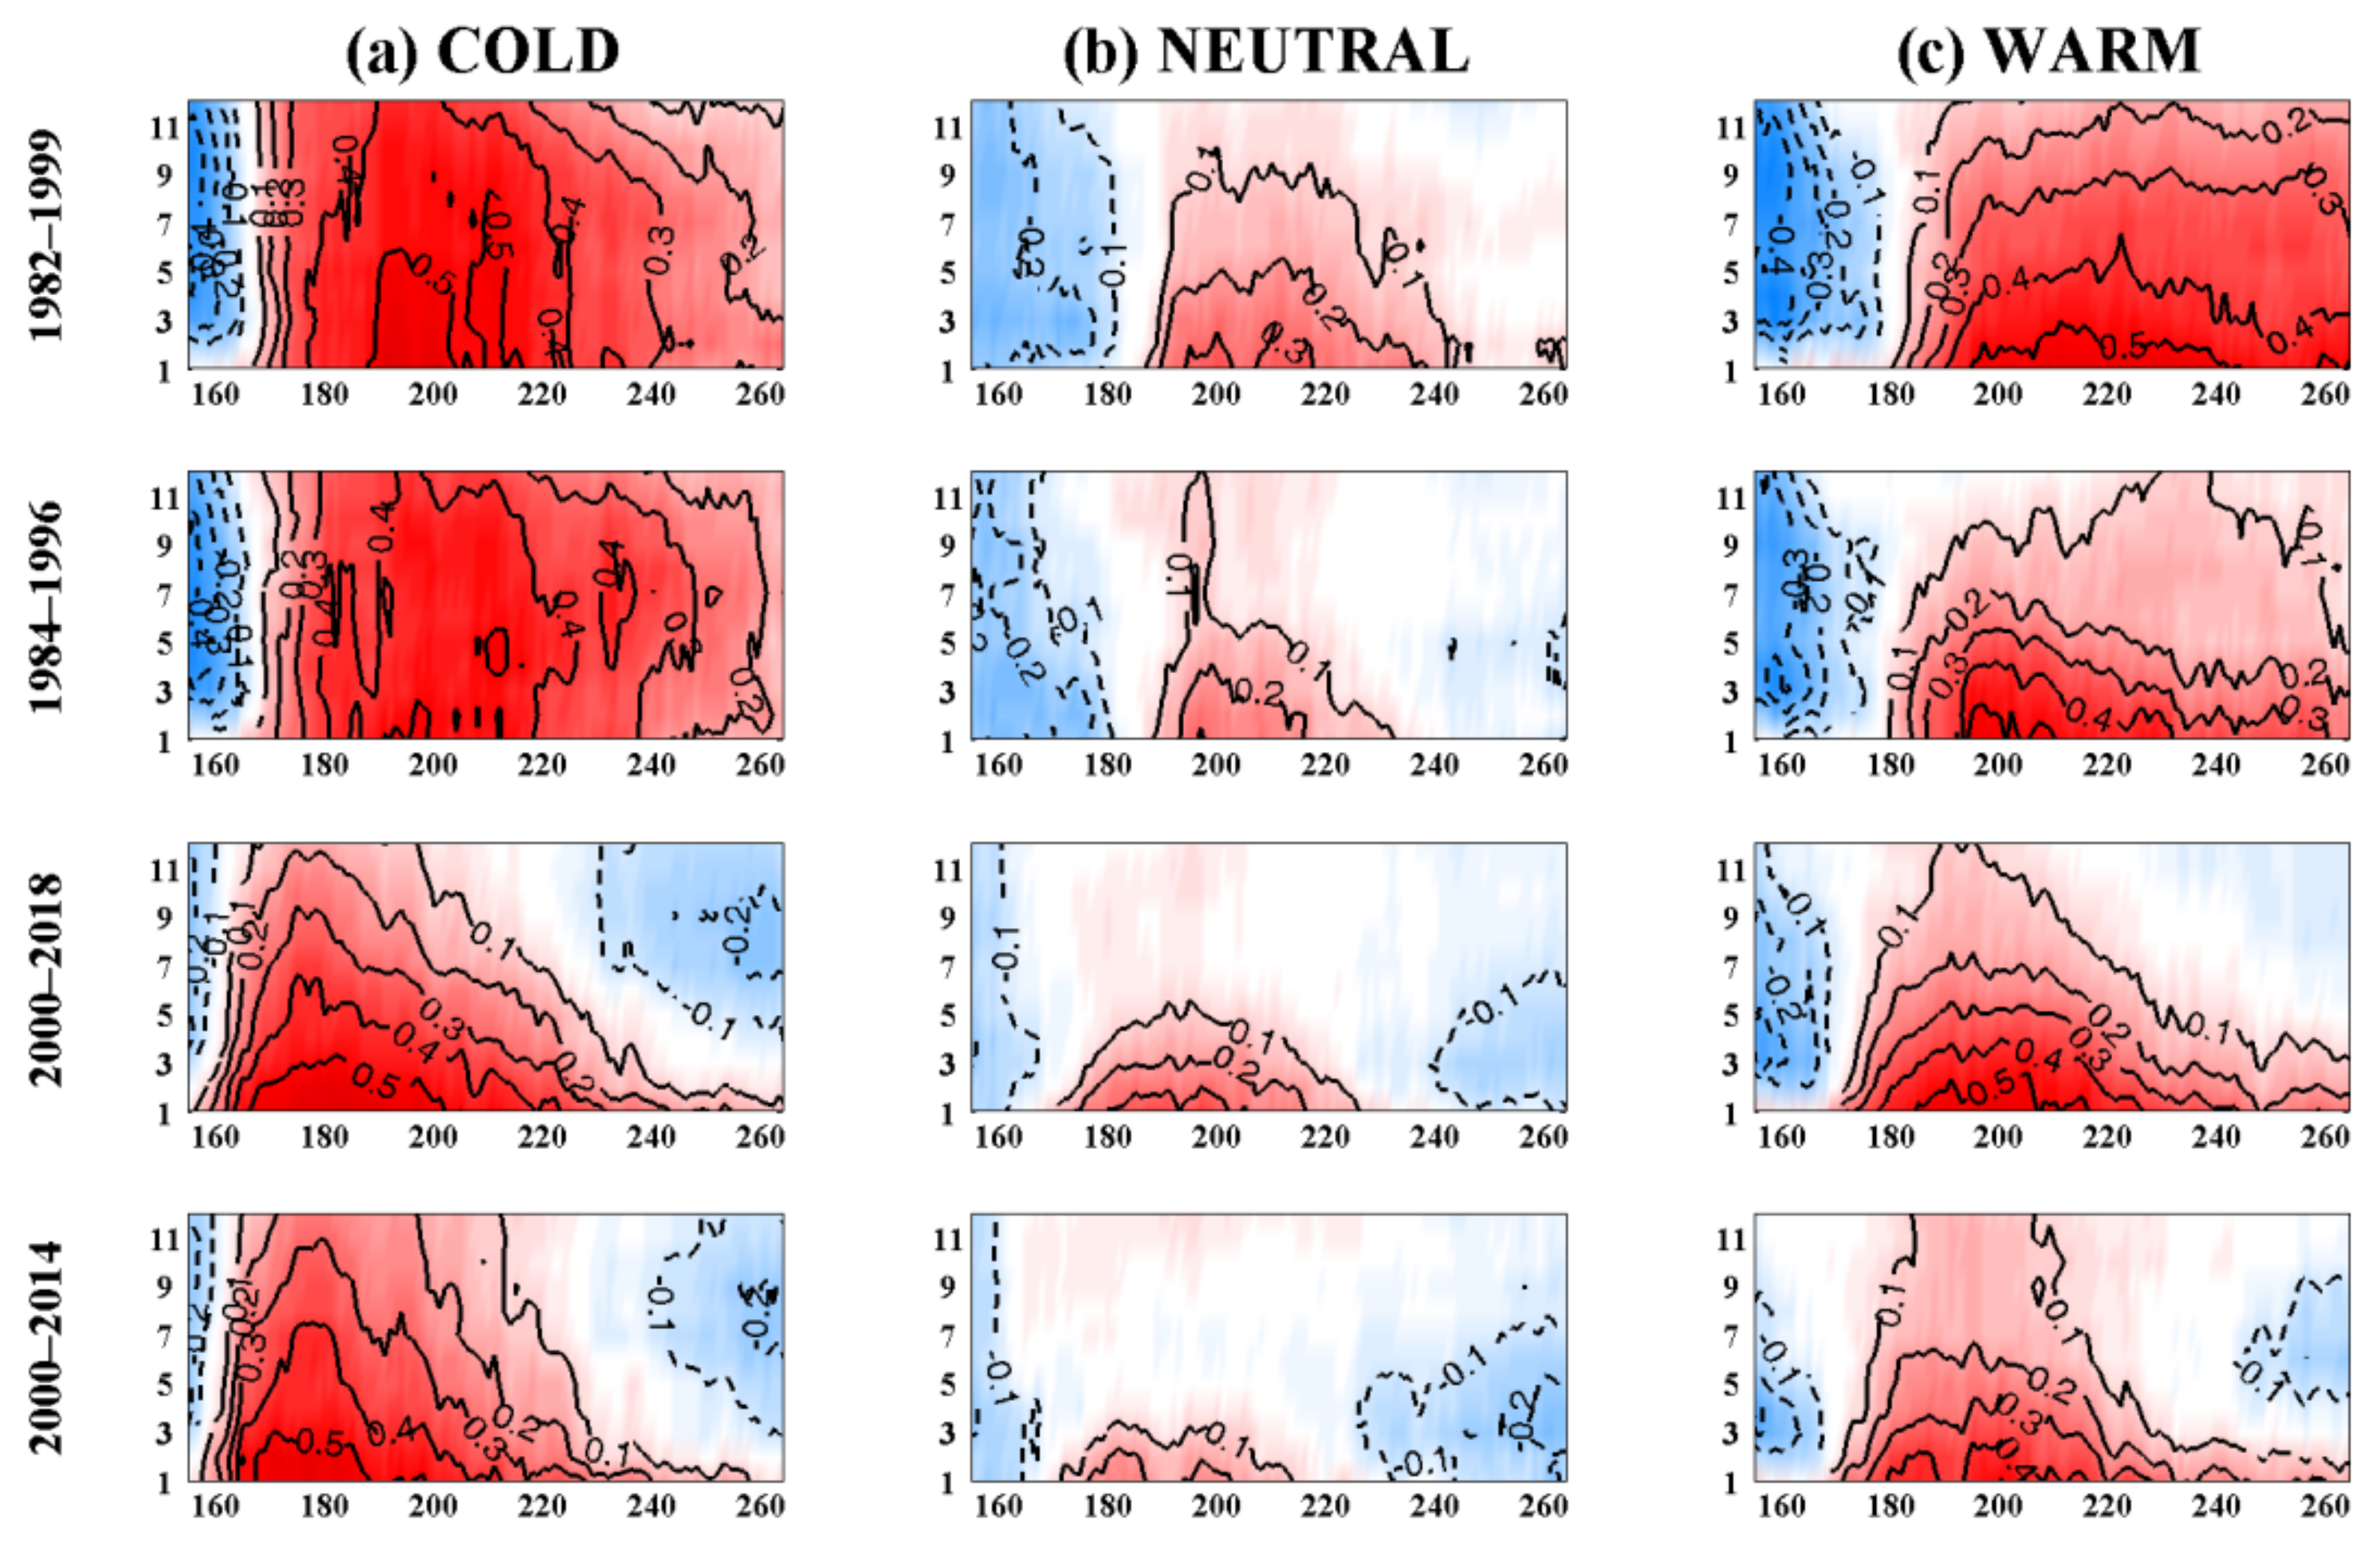
Since seasonal forecasting models usually have many prediction members that represent a probability distribution of outcomes, next we probabilistically evaluated the changes in ENSO prediction skill for the four periods based on the BSS results. Figure 9 shows the BSS distributions of the equatorial Pacific for three equally probable SSTA categories as functions of longitude and lead time. It is apparent that, in general, the BSS is negative west of 160° E and positive between 170° E to 120° W, regardless of the periods and the categories. For the entire tropical Pacific, the best probabilistic forecasts are for COLD events, followed by WARM events, and lastly for NEUTRAL events. The BSS skills pre-2000 are generally higher than those post-2000, especially for the equatorial eastern Pacific. The BSS decays east of 120° W post-2000 for all three categories, which also coincides with the lesser occurrence of eastern El Niño events after 2000, confirming the fact that most of the seasonal forecasting skill was from ENSO variability. It should be noted that west of 160° E, much poorer probabilistic forecasts are shown pre-2000 compared with post-2000, although they all have insignificant forecasting skills.
Figure 10 shows the BSS of the Niño3.4 and Niño3 indexes as a function of lead time in the four periods. Basically, both the COLD and WARM events have higher values than the NEUTRAL events for all of the periods. For the COLD events, the BSS values are larger pre-2000 than post-2000. The BSS values are even larger during 1984–1996 than during 1982–1999, especially for a 3–7 month lead time for the Niño3 index. However, the BSS values are always largest for the WARM events during 1982–1999 for both indexes and all lead times, exhibiting significant differences compared with other periods, which is mainly due to the occurrence of the two extreme El Niño events in this period. Generally, the Niño3.4 index has a relatively higher skill than the Niño3 index post-2000 for all three categories. For the Niño3 index, the small forecasting skills are limited to a 2-month lead time for the COLD and WARM events during 2000–2014, and there are no forecasting skills for the NEUTRAL events post-2000, whereas, for the Niño3.4 index, the forecasting skills are significantly improved for the COLD and WARM events post-2000 and for the NEUTRAL events during 2000–2018. However, for the NEUTRAL events during 2000–2014, the forecasting skills are still limited. Altogether, this demonstrates the overall higher probabilistic forecasting skills of the Niño3.4 and Niño3 indexes pre-2000 compared to post-2000 for all three SSTA categories. These results are consistent with the deterministic evaluation results, indicating that the changes in the SSTA in the Pacific Ocean also have a significant influence on the probabilistic ENSO forecasting skills.

4. Discussion and Conclusions

Based on the hindcasts of five seasonal forecasting models that were used in the NMME, the purpose of this study was to examine the changes in the forecasting skills after 2000 due to the changes in the SSTA variability of the Pacific. We conducted a deterministic evaluation based on MME SSTA forecasts, and ten members from each model were selected, for a total of 50 members, to assess the probabilistic performance. It should be noted that all of the results illustrated by the MME SSTA forecasts and the probabilistic features of the 50 members can also be repeated by each individual model’s SSTA forecasts, demonstrating the inherent features of the seasonal forecasting models.
It has been well documented that, due to the decreased occurrence and amplitude of eastern Pacific El Niño events after 2000, the SSTA variability became much weaker in the tropical eastern Pacific but slightly stronger in the central Pacific. This coincides with the higher skills of the Niño3.4 and Niño3 indexes pre-2000 compared to post-2000, and the previously reported decline in forecasting skill continues through to 2018. The MME predictions have shown encouragingly high forecasting skills, but they also exhibit the effects of the SPB. The temporal correlation differences in the Niño3.4 and Niño3 indexes over the different periods as a function of the target months and lead times were also calculated. The results indicate that models have higher skills for the Niño3.4 index pre-2000 compared to post-2000, and this is most significant for the target months of May to August for medium to long lead times. The skill differences for the Niño3 index between pre-2000 and post-2000 are significant for same calendar months and expand to all of the lead times. The forecasts suffer more from the effect of the SPB post-2000. We also found that the occurrence of the 1982/1983 and 1997/1998 El Niño events improved the forecasting skills of the two indexes from August to December for medium to long lead times. Moreover, the 2015/2016 El Niño event helped improve their correlation skills for February to August, which is slightly different from the effects of the 1982/1983 and 1997/1998 El Niño events. We also calculated the persistence forecasting skills. The results show that the persistence forecast is more affected by the SPB, and the skills of both the Niño3.4 and Niño3 indexes are much weaker after 2000 for the target months of May to September, especially for short to medium lead times.
The decrease in the SSTA persistence prediction skill may relate to the changes in the local SSTA characteristics since the persistence prediction is mainly based on the local memory of the local SSTA. This is manifested in the weakening of the WWV itself and its relationship with ENSO, while for the extratropical process it can serve as an indispensable role in improving ENSO forecasting skills especially in the forecasts with medium to long lead times. The timescale of the lead months with most declined skills after 2000 in models is consistent with the months when the VMI and SPQI have the maximum relationship with the Niño3.4 index. Since the relationships between VMI or SPQI and Niño3.4 both weakened after 2000, a reduction in inherent predictability and skills of ENSO occurred, which may connect with the forecasting skills decline of dynamical models.
We subsequently compared the SSTA forecasting of the MME forecasts with the observations for the Niño3.4 and Niño3 indexes of the El Niño evolution during each period. It was found that the models are inclined to underestimate the amplitudes of the El Niño events, especially for long lead times. Moreover, they fail to forecast the rapidly decaying characteristics of El Niño events, thus leading to overestimates of the amplitudes of the El Niño events for short to medium lead times. In comparison to pre-2000, the models tend to further underestimate the SSTA in the El Niño developing year but to overestimate them in the decaying year for both the Niño3.4 and Niño3 indexes post-2000.
We also studied the probabilistic performance of the SSTA based on the four periods. Basically, the skills are generally higher for pre-2000 than for post-2000. The BSS decays east of 120° W post-2000 for all three categories, which coincides with the lower occurrence of eastern El Niño events after 2000. The probabilistic forecasting skills were higher pre-2000 than post-2000 for all three SSTA categories for the Niño3.4 and Niño3 indexes.
Therefore, it has been demonstrated that the Niño3.4 and Niño3 indexes have overall higher forecast skills pre-2000 than post-2000 from both the deterministic and probabilistic points of view, and these superiorities extend through 2018. This demonstrates that the changes in the SSTA variability in the tropical Pacific have a significant influence on ENSO forecasting skills. Since the mean states in the tropical Pacific changed around 2000, it remains unclear how long the current climate state will last, and the decrease in forecasting skills is very likely to continue. Under such conditions, there are still great uncertainties in understanding and simulating ENSO diversities, so it is urgent to further study the dynamic and physical processes associated with ENSO onset and evolution and to improve the models’ abilities to simulate ENSO. Currently, statistical models based on tropical dynamics and extratropical precursors can significantly enhance ENSO prediction skills [46,48,49,50], demonstrating that this is an effective way to remedy the current low forecasting skills. Furthermore, machine learning approaches are increasingly being used to extract information from geospatial data, and they have been demonstrated to be powerful tools for the prediction of ENSO events [40]. Thus, for ENSO forecasting in the future, the advantages of the different methods, i.e., dynamic modeling, statistical methods, and machine learning approaches, should be used to obtain the most applicable ENSO forecast.

Author Contributions

S.Z. and H.J. conceived and designed the overall project and wrote most of sections of the manuscript. W.M. performed methodology and part of the analysis. H.W. supplied suggestions and comments for the manuscript. All authors have read and agreed to the published version of the manuscript.

Funding

This research was supported by the National Key R&D Program of China (Grant Nos. 2020YFA0608804, 2017YFA0604203, 2019YFA0606703, and 2016YFB0500204).

Institutional Review Board Statement

Not applicable.

Informed Consent Statement

Not applicable.

Acknowledgments

We acknowledge the agencies that support the NMME-Phase II system, and we thank the climate modeling groups (Environment Canada, NASA, NCAR, NOAA/GFDL, NOAA/NCEP, and the University of Miami) for producing and making their model outputs available.

Conflicts of Interest

The authors declare that there are no conflicts of interest.

References

  1. McPhaden, M.J.; Zebiak, S.E.; Glantz, M.H. ENSO as an intriguing concept in Earth science. Science 2006, 314, 1740–1745. [Google Scholar] [CrossRef] [PubMed] [Green Version]
  2. Zhang, W.; Jin, F.F.; Zhao, J.X.; Qi, L.; Ren, H.L. The possible influence of a nonconventional El Niño on the severe autumn drought of 2009 in southwest China. J. Clim. 2013, 26, 8392–8405. [Google Scholar] [CrossRef]
  3. Tang, Y.M.; Zhang, R.H.; Liu, T.; Duan, W.; Yang, D.; Zheng, F.; Ren, H.; Lian, T.; Gao, C.; Chen, D.; et al. Progress in ENSO prediction and predictability study. Natl. Sci. Rev. 2018, 5, 826–839. [Google Scholar] [CrossRef]
  4. Balmaseda, M.; Anderson, D.; Vidard, A. Impact of Argo on analyses of the global ocean. Geophys. Res. Lett. 2007, 34, L16605. [Google Scholar] [CrossRef]
  5. Barnston, A.G.; Tippett, M.K.; L’Heureux, M.L.; Li, S.; DeWitt, D.G. Skill of real-time seasonal ENSO model predictions during 2002-11: Is our capability increasing? Bull. Am. Meteor. Soc. 2012, 93, 631–651. [Google Scholar] [CrossRef]
  6. Hu, Z.Z.; Kumar, A.; Ren, H.L.; Wang, H.; L’Heureux, M.; Jin, F.F. Weakened interannual variability in the tropical Pacific Ocean since 2000. J. Clim. 2013, 26, 2601–2613. [Google Scholar] [CrossRef]
  7. Kumar, A.; Hu, Z.Z. Interannual and interdecadal variability of ocean temperature along the equatorial Pacific in conjunction with ENSO. Clim. Dyn. 2014, 42, 1243–1258. [Google Scholar] [CrossRef]
  8. Zhao, M.; Hendon, H.H.; Alves, O.; Liu, G.; Wang, G. Weakened Eastern Pacific El Niño Predictability in the Early Twenty-First Century. J. Clim. 2016, 29, 6805–6822. [Google Scholar] [CrossRef]
  9. Hu, Z.Z.; Kumar, A.; Huang, B.; Zhu, J.; Ren, H.L. Interdecadal variations of ENSO around 1999/2000. J. Meteor. Res. 2017, 31, 73–81. [Google Scholar] [CrossRef]
  10. McPhaden, M.J. Tropical Pacific Ocean heat content variations and ENSO persistence barriers. Geophys. Res. Lett. 2003, 30, 1480. [Google Scholar] [CrossRef] [Green Version]
  11. Horii, T.; Ueki, I.; Hanawa, K. Breakdown of ENSO predictors in the 2000s: Decadal changes of recharge/discharge-SST phase relation and atmospheric intraseasonal forcing. Geophys. Res. Lett. 2012, 39, L10707. [Google Scholar] [CrossRef]
  12. McPhaden, M.J. A 21st century shift in the relationship between ENSO SST and warm water volume anomalies. Geophys. Res. Lett. 2012, 39, L09706. [Google Scholar] [CrossRef]
  13. Kao, H.Y.; Yu, J.Y. Contrasting Eastern-Pacific and Central-Pacific Types of ENSO. J. Clim. 2009, 22, 615–632. [Google Scholar] [CrossRef]
  14. Kug, J.S.; Jin, F.F.; An, S.I. Two types of El Niño events: Cold tongue El Niño and warm pool El Niño. J. Clim. 2009, 22, 1499–1515. [Google Scholar] [CrossRef]
  15. Wen, C.; Kumar, A.; Xue, Y.; McPhaden, M.J. Changes in tropical Pacific thermocline depth and their relationship to ENSO after 1999. J. Clim. 2014, 27, 7230–7249. [Google Scholar] [CrossRef]
  16. Lai, A.W.C.; Herzog, M.; Graf, H.F. Two key parameters for the El Niño continuum: Zonal wind anomalies and western Pacific subsurface potential temperature. Clim. Dyn. 2015, 45, 3461–3480. [Google Scholar] [CrossRef]
  17. Fedorov, A.V.; Hu, S.; Lengaigne, M.; Guilyardi, E. The impact of westerly wind bursts and ocean initial state on the development, and diversity of El Niño events. Clim. Dyn. 2015, 44, 1381–1401. [Google Scholar] [CrossRef]
  18. Chen, D.; Lian, T.; Fu, C.B.; Cane, M.A.; Tang, Y.; Murtugudde, R.; Song, X.; Wu, Q.; Zhou, L. Strong influence of westerly wind bursts on El Niño diversity. Nat. Geosci. 2015, 8, 339–345. [Google Scholar] [CrossRef]
  19. Wang, R.; Ren, H.L. The linkage between two ENSO types/modes and the interdecadal changes of ENSO around the year 2000. Atmos. Ocean. Sci. Lett. 2017, 10, 168–174. [Google Scholar] [CrossRef] [Green Version]
  20. Hu, Z.Z.; Kumar, A.; Zhu, J.S.; Peng, P.; Huang, B. On the Challenge for ENSO Cycle Prediction: An Example from NCEP Climate Forecast System, Version 2. J. Clim. 2019, 32, 183–194. [Google Scholar] [CrossRef]
  21. Vimont, D.J.; Wallace, J.M.; Battisti, D.S. The Seasonal Footprinting Mechanism in The Pacific: Implications for ENSO. J. Clim. 2003, 16, 2668–2675. [Google Scholar] [CrossRef] [Green Version]
  22. Chang, P.; Zhang, L.; Saravanan, R.; Vimont, D.J.; Chiang, J.C.H.; Ji, L.; Seidel, H.; Tippett, M.K. Pacific meridional mode and El Niño-Southern Oscillation. Geophys. Res. Lett. 2017, 34, L16608. [Google Scholar] [CrossRef]
  23. Larson, S.M.; Kirtman, B.P. The Pacific meridional mode as an ENSO precursor and predictor in the North American multimodel ensemble. J. Clim. 2014, 27, 7018–7032. [Google Scholar] [CrossRef]
  24. Amaya, D.J. The Pacific Meridional Mode and ENSO: A Review. Curr. Clim. Change Rep. 2019, 5, 296–307. [Google Scholar] [CrossRef]
  25. Bond, N.A.; Overland, J.E.; Spillane, M.; Stabeno, P. Recent shifts in the state of the North Pacific. Geophys. Res. Lett. 2003, 30, 2183. [Google Scholar] [CrossRef] [Green Version]
  26. Ding, R.Q.; Li, J.P.; Tseng, Y.; Sun, C.; Guo, Y. The Victoria Mode in the North Pacific Linking Extratropical Sea Level Pressure Variations to ENSO. J. Geophys. Res. Atmos. 2015, 120, 27–45. [Google Scholar] [CrossRef]
  27. Ballester, J.; Rodríguez-Arias, M.À.; Rodó, X. A new extratropical tracer describing the role of the western Pacific in the onset of El Niño: Implications for ENSO understanding and forecasting. J.Clim. 2011, 24, 1425–1437. [Google Scholar] [CrossRef]
  28. Ding, R.Q.; Li, J.P.; Tseng, Y.H. The Impact of South Pacific Extratropical Forcing on ENSO and Comparisons with the North Pacific. Clim. Dyn. 2014, 44, 2017–2034. [Google Scholar] [CrossRef]
  29. Kirtman, B.P.; Min, D.H.; Infanti, J.M. The North American Multimodel Ensemble: Phase-1 seasonal-to-interannual prediction; phase-2 toward developing intraseasonal prediction. Bull. Am. Meteor. Soc. 2014, 95, 585–601. [Google Scholar] [CrossRef]
  30. Merryfield, W.J.; Lee, W.S.; Boer, G.J.; Kharin, V.V.; Scinocca, J.F.; Flato, G.M.; Ajayamohan, R.S.; Fyfe, J.C.; Tang, Y.; Polavarapu, S. The Canadian seasonal to interannual prediction system. Part I: Models and initialization. Mon. Weather. Rev. 2013, 141, 2910–2945. [Google Scholar] [CrossRef]
  31. Côté, J.; Gravel, S.; Méthot, A.; Patoine, A.; Roch, M.; Staniforth, A. The operational CMC-MRB Global Environmental Multiscale (GEM) model. Part I: Design considerations and formulation. Mon. Wea. Rev. 1998, 126, 1373–1395. [Google Scholar] [CrossRef]
  32. Reynolds, R.W.; Rayner, N.A.; Smith, T.M.; Stokes, D.C.; Wang, W. An improved in situ and satellite SST analysis for climate. J. Clim. 2002, 15, 1609–1625. [Google Scholar] [CrossRef]
  33. Wilks, D.S. Statistical Methods in the Atmospheric Sciences: An Introduction; Academic Press: San Diego, CA, USA, 1995. [Google Scholar]
  34. Peng, P.; Kumar, A.; van den Dool, H.; Barnston, A.G. An analysis of multi-model ensemble predictions for seasonal climate anomalies. J. Geophys. Res. 2002, 107, 4710. [Google Scholar] [CrossRef]
  35. Min, Y.M.; Kryjov, V.N.; Oh, S.M. Skill of real-time operational forecasts with the APCC multi-model ensemble prediction system during the period 2008–2015. Clim. Dyn. 2017, 49, 4141–4156. [Google Scholar] [CrossRef]
  36. Min, Y.M.; Kryjov, V.N.; Oh, S.M. Assessment of APCC multimodel ensemble prediction in seasonal climate forecasting: Retrospective (1983–2003) and real-time forecasts (2008–2013). J. Geophys. Res. Atmos. 2014, 119, 12132–12150. [Google Scholar] [CrossRef]
  37. Rodrigues, L.R.L.; Doblas-Reyes, F.J.; Coelho CA dos, S. Multi-model calibration and combination of tropical seasonal sea surface temperature forecasts. Clim. Dyn. 2014, 42, 597–616. [Google Scholar] [CrossRef]
  38. Yang, D.; Yang, X.Q.; Xie, Q.; Zhang, Y.; Ren, X.; Tang, Y. Probabilistic versus deterministic skill in predicting the western North Pacific-East Asian summer monsoon variability with multimodel ensembles. J. Geophys. Res. Atmos. 2016, 121, 1079–1103. [Google Scholar] [CrossRef] [Green Version]
  39. Tippett, M.K.; Barnston, A.G.; Li, S. Performance of recent multimodel ENSO forecasts. J. Appl. Meteorol. Climatol. 2012, 51, 637–654. [Google Scholar] [CrossRef]
  40. Ham, Y.G.; Kim, J.H.; Luo, J.J. Deep learning for multi-year ENSO forecasts. Nature 2019, 573, 568–572. [Google Scholar] [CrossRef]
  41. Neske, S.; McGregor, S. Understanding the warm water volume precursor of ENSO events and its interdecadal variation. Geophys. Res. Lett. 2018, 45, 1577–1585. [Google Scholar] [CrossRef]
  42. Clarke, A.J.; Zhang, X. On the physics of the warm water volume and El Niño/La Niña predictability. J. Phys. Oceanogr. 2019, 49, 1541–1560. [Google Scholar] [CrossRef]
  43. Chen, H.C.; Sui, C.H.; Tseng, Y.H.; Huang, B. Combined Role of High- and Low-Frequency Processes of Equatorial Zonal Transport in Terminating an ENSO Event. J. Clim. 2018, 31, 5461–5483. [Google Scholar] [CrossRef]
  44. Tseng, Y.H.; Hu, Z.Z.; Ding, R.Q.; Chen, H.C. An ENSO prediction approach based on ocean conditions and ocean-atmosphere coupling. Clim. Dyn. 2017, 48, 2025–2044. [Google Scholar] [CrossRef]
  45. Anderson, B.T.; Perez, R.C.; Karspeck, A. Triggering of El Niño Onset through Trade Wind-induced Charging of the Equatorial Pacific. Geophys. Res. Lett. 2013, 40, 1212–1216. [Google Scholar] [CrossRef]
  46. Chen, H.C.; Tseng, Y.H.; Hu, Z.Z.; Ding, R.Q. Enhancing the ENSO Predictability beyond the spring barrier. Sci. Rep. 2020, 10, 984. [Google Scholar] [CrossRef]
  47. Trenberth, K.E. The definition of El Niño. Bull. Am. Meteor. Soc. 1997, 78, 2771–2777. [Google Scholar] [CrossRef] [Green Version]
  48. Ren, H.L.; Zuo, J.Q.; Deng, Y. Statistical predictability of Niño indices for two types of ENSO. Clim. Dyn. 2019, 52, 5361–5382. [Google Scholar] [CrossRef] [Green Version]
  49. Petrova, D.; Koopman, S.J.; Ballester, J.; Rodó, X. Improving the long-lead predictability of El Niño using a novel forecasting scheme based on a dynamic components model. Clim. Dyn. 2017, 48, 1249–1276. [Google Scholar] [CrossRef] [Green Version]
  50. Petrova, D.; Ballester, J.; Koopman, S.J.; Rodó, X. Multiyear Statistical Prediction of ENSO Enhanced by the Tropical Pacific Observing System. J. Clim. 2020, 33, 163–174. [Google Scholar] [CrossRef] [Green Version]
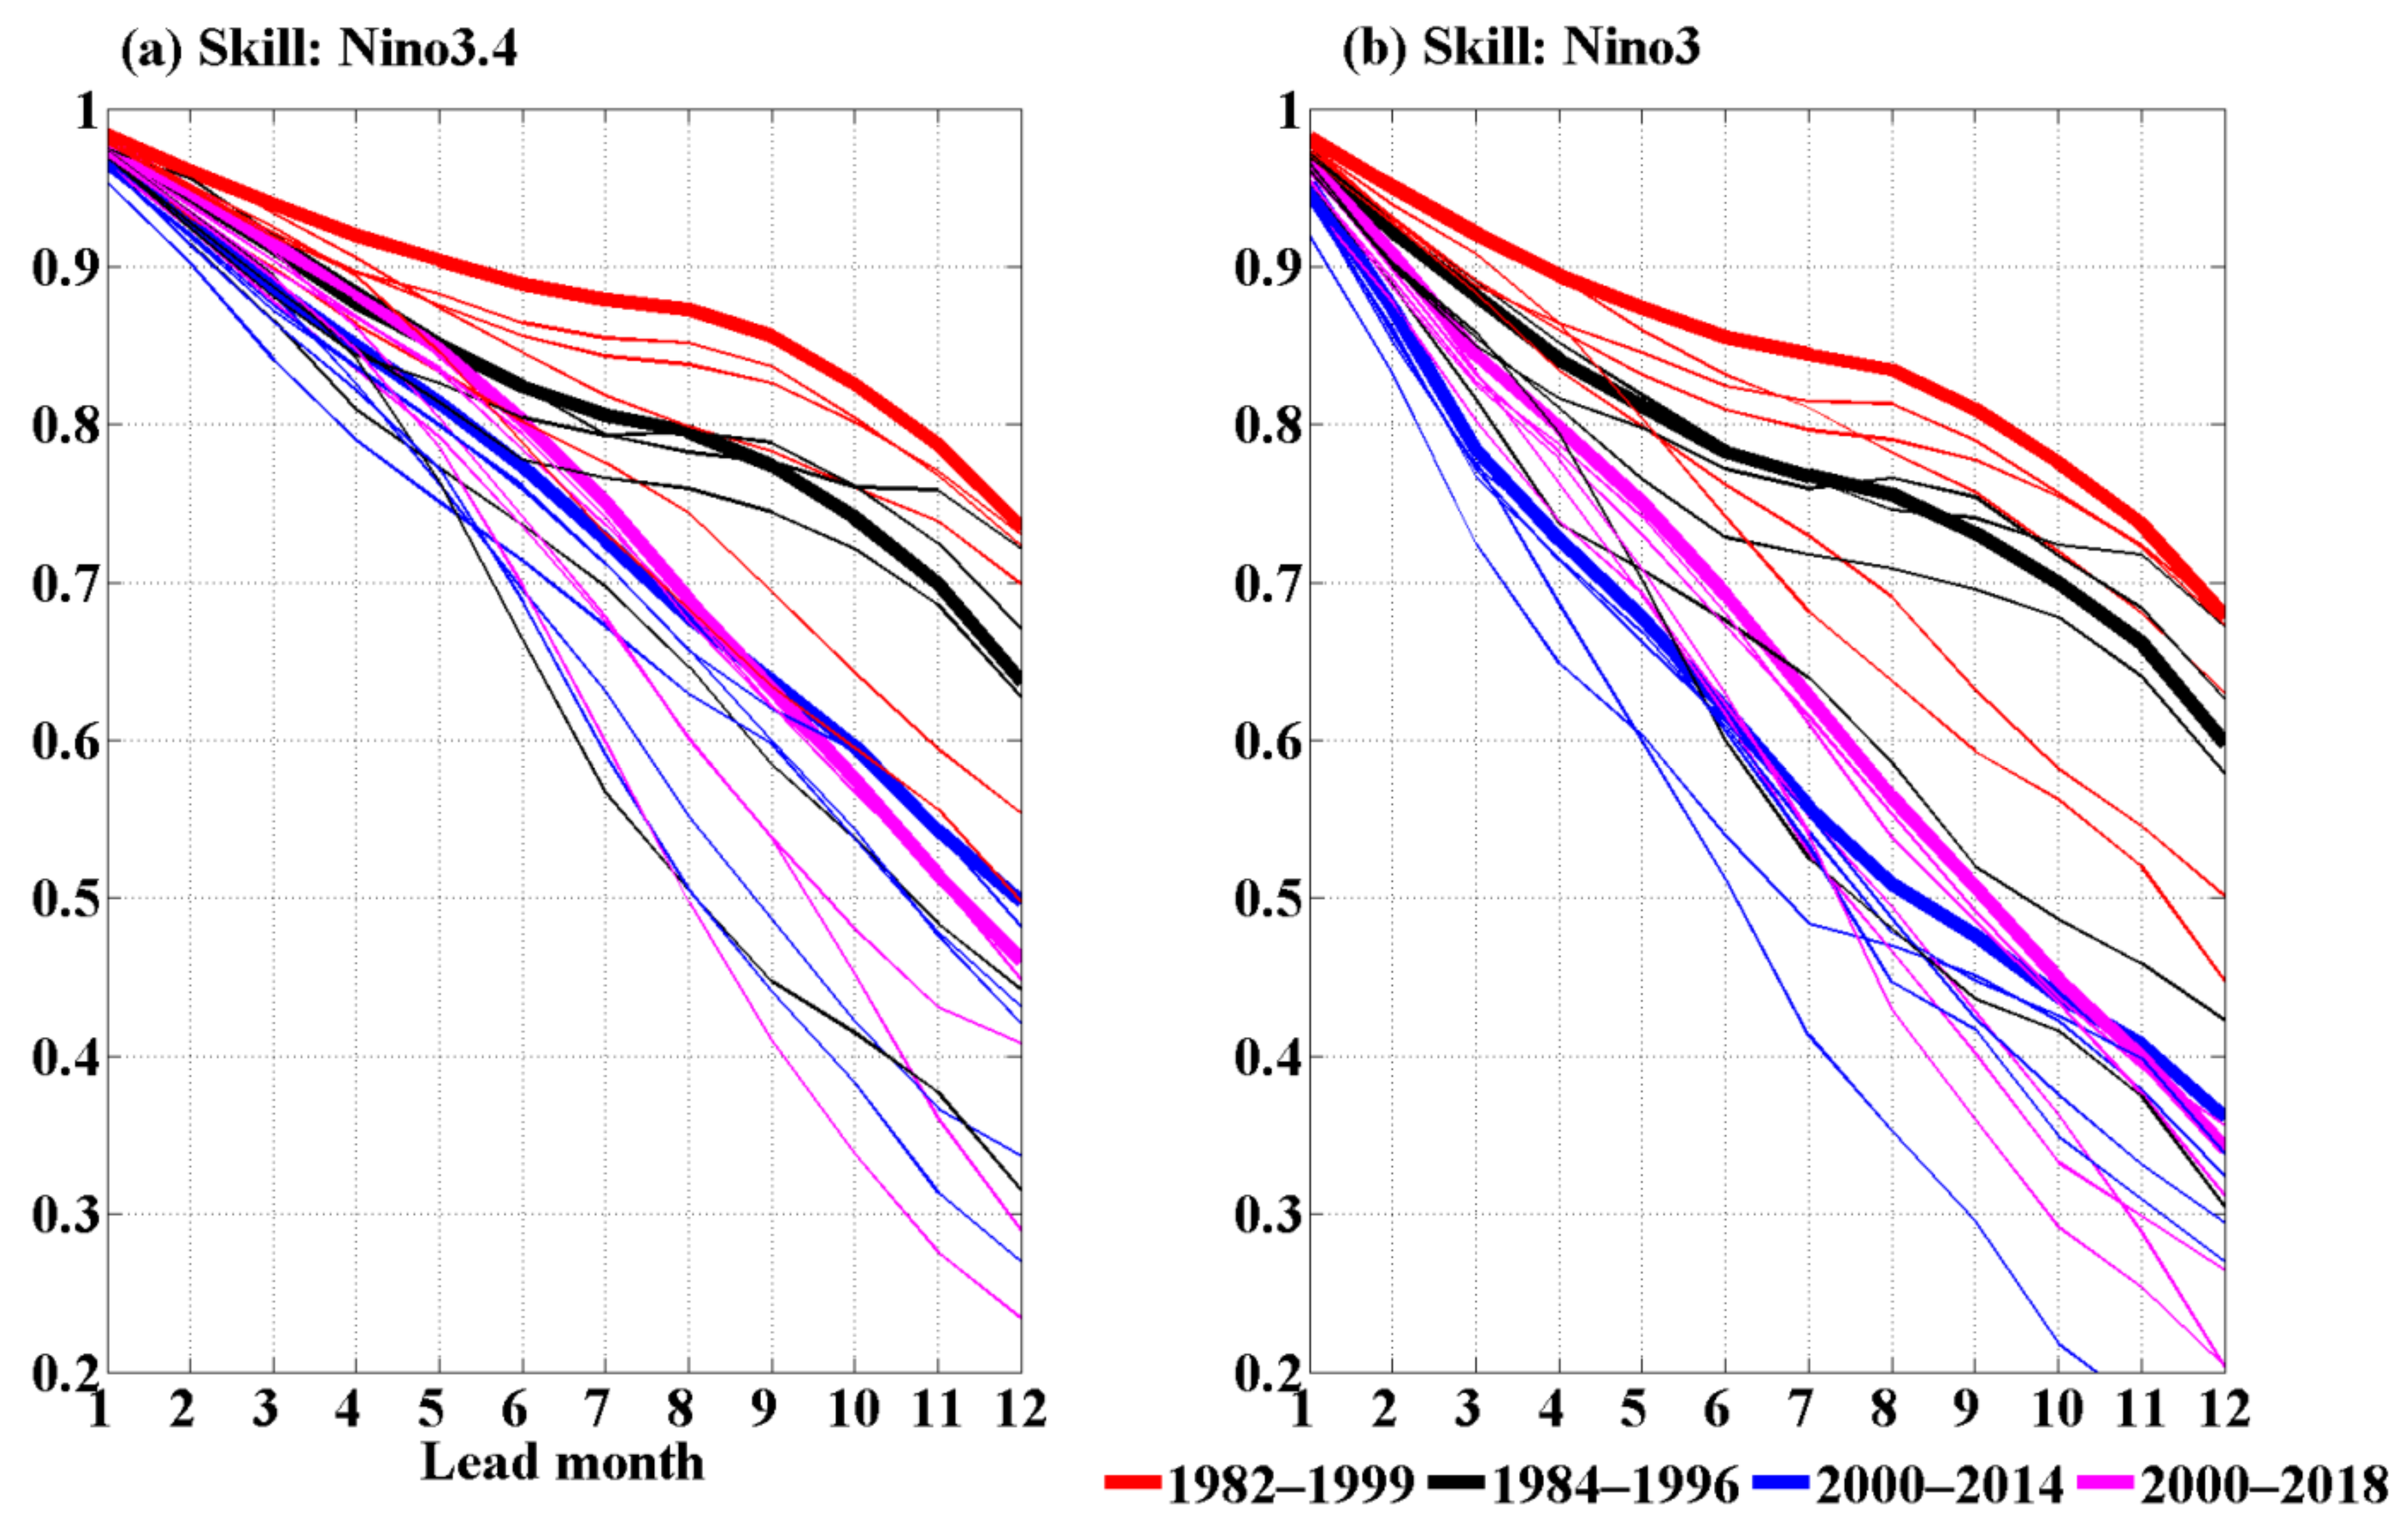
Figure 1. Temporal correlation between the multimodel ensemble (MME) forecasts and the observations for all of the months combined as a function of lead time for (a) the Niño3.4 index and (b) the Niño3 index for the four periods. (The thick solid lines indicate MME results and the thin solid lines indicate the results of the five individual models. The different colors indicate the results for the four periods, as shown in the legend.)
Atmosphere 12 00365 g001
Figure 2. (a) Distributions of the temporal correlation of the MME forecasts and observations during 1982–1999 as a function of target months and lead months for the Niño3.4 index. (bd) Skill differences for the periods shown in each subtitle. Note: the black crosses indicate that the skill differences are not statistically significant at the 5% level based on a Student’s t-test.
Atmosphere 12 00365 g002
Figure 3. As in Figure 2, but for the Niño3 index.
Atmosphere 12 00365 g003
Figure 4. As in Figure 2, but for autocorrelations of the observed Niño3.4 index.
Atmosphere 12 00365 g004
Figure 5. As in Figure 4, but for the observed Niño3 index.
Atmosphere 12 00365 g005
Figure 6. (a) Lead correlation between the Victoria mode index (VMI) with the Niño3.4 index for the four periods. (b) The 10-year sliding-window correlation between the VMI and the Niño3.4 index with a lead time of 10 months. (The red and blue lines show the mean running correlation coefficient corresponding to the underlying periods, and the pink dashed line shows that the correlation coefficients are significant at the 95% confidence level.) (c) As in (a), but for the relationship between the South Pacific quadrupole index (SPQI) and the Niño3.4 index. (d) As in (b), but for the 10-year sliding-window correlation between the SPQI and the Niño3.4 index with a lead time of 8 months.
Atmosphere 12 00365 g006
Figure 7. (a) Composite sea surface temperature anomalies (SSTA) bias in the MME forecasts during 1982–1999 as a function of the target months and lead months for the Niño3.4 index of El Niño evolution (the contour is in units of °C, the blue dashed lines show the negative SSTA bias, and the black solid lines show the positive SSTA bias). (bd) SSTA bias for the periods shown in each subtitle and its difference with 1982–1999 (shading in units of °C, and the contours are the SSTA bias during 1984–1996, 2000–2018, and 2000–2014)). The time abscissa is from June of the El Niño developing year to July of the El Niño decaying year. Note: the crosses indicate that the signs of the MME SSTA bias are the same for all five individual models.
Atmosphere 12 00365 g007
Figure 8. As in Figure 7, but for the Niño3 index.
Atmosphere 12 00365 g008
Figure 9. Brier skill score method (BSS) distribution in the equatorial Pacific for the COLD (a), NEUTRAL (b), and WARM (c) SSTA categories as a function of longitude and lead time (in months) for the four periods.
Atmosphere 12 00365 g009
Figure 10. The BSS of the Niño3 and Niño3.4 indexes as a function of lead time for the COLD (a), NEUTRAL (b), and WARM (c) SSTA categories for the four periods.
Atmosphere 12 00365 g010
Publisher’s Note: MDPI stays neutral with regard to jurisdictional claims in published maps and institutional affiliations.