Abstract
Based on the multiyear measurements in the surface atmospheric layer (from five stations) and regular flights of aircraft laboratory over the background region of Southwestern Siberia, the compositions of mass concentrations of submicron aerosol and absorbing substances (soot and black carbon) are analyzed. The annual average concentrations of submicron aerosol and black carbon were found to be maximal in 1997, 2012, and 2016, when the largest numbers of wildfires occurred across the entire territory of Siberia. No significant, unidirectional trend of interannual variations in the concentration of submicron particles was observed, while the concentration of absorbing substance reliably decreased by 1.5% each year. To estimate the effect of urban pollutants, mass concentrations of aerosol and absorbing substance in the surface layer at the Aerosol Station (in the suburban region of Tomsk) were compared to those at the Fonovaya Observatory (in the background region). It was shown that the largest contribution of anthropogenic sources in the suburban region was observed in the winter season, while minimal difference was observed in the warm period of the year. The seasonal behavior of the concentrations of elemental carbon at three stations in Novosibirsk Oblast almost completely matched the dynamics of the variations in the black carbon concentration in the atmosphere of Tomsk Oblast. Data of aircraft sensing in the troposphere of the background region of Southwestern Siberia (2000–2018) were used to determine the average values of the vertical distribution of the submicron aerosol and black carbon concentrations in the altitude range of 0.5–7 km for each season. It was found that at altitudes of 0.5–7 km, there were no unidirectional trends in submicron aerosol; however, there was an increase of black carbon concentration at all altitudes with a positive trend of 5.3 ± 2.2% per year at an altitude of 1.5 km, significant at a p-value = 0.05.
1. Introduction
Under conditions of rapid changes in the climate system and intensifying anthropogenic effects, the problem of correctly accounting for and predicting the aerosol effect on environmental state, human health, and the formation of Earth’s radiation budget still urgently needs a large amount of data on the properties of atmospheric particles from instrumental observations [1].
The main difficulties when determining the aerosol effect are not only associated with the strong spatiotemporal variations in the concentration of particles and their microstructural and physicochemical characteristics, but also with a complex set an intricate complex of multidirectional processes, in which aerosol plays a leading role.
Anthropogenic aerosol has a negative effect on nature and human health, especially in big megacities; therefore, solutions to this serious problem have attracted the attention of the entire global community (see e.g., [2,3,4,5,6,7,8,9]).
For the state of radiation balance of the troposphere, it is possible to single out the following main processes of both direct radiative forcing and indirect aerosol effects. The direct radiative forcing of particles is directly related to their optical characteristics, where the most important aspect is the relationship between the scattering and absorbing properties. Scattering has a cooling effect, while absorption has a warming effect [10,11]. In the case of indirect aerosol effects, the main roles are played by the concentration, chemical composition, and particle size distribution. Functioning as the condensation nuclei in cloud formation (cooling factor), aerosol particles determine the number of cloud droplets and the microstructure, and, correspondingly, their optical properties and lifetimes in the atmosphere [12,13].
The indirect deferred, cumulative aerosol effect is another indirect aerosol effect, the study of which recently attracted the attention of the scientific community regarding the extremely rapid changes observed in the climate system of the Arctic [14,15,16,17,18,19,20]. This effect is caused by the deposition of absorbing particles on the underlying surface, the accumulation of which leads to a reduction in the surface albedo. The effect of this process is most urgent for the northern territories, where the arrival of absorbing substances in ice and snow cover substantially increases not only the absorption of radiation, but also ice and snow melt.
To solve climatically significant problems, the present-day scientific community has implemented a great number of large-scale international projects worldwide, for which comprehensive research into aerosol properties at different spatial scales has already been carried out for a few decades (e.g., ARM, AERONET, and GAW [21,22,23]).
Obtaining reliable information on the properties of scattering and absorbing particles in the troposphere at a regional scale is one of the most urgent and complex problems [24,25,26]. In this case, studying particles in a submicron size range comes to the forefront. First, submicron particles mainly determine the scattering and absorption of incoming shortwave radiation. This size range also comprises the main mass of strongly absorbing soot particles (black carbon (BC)), the content of which usually does not exceed 10% of the total aerosol mass concentration. However, it is these particles that play an important role in both direct radiative forcing and in indirect aerosol effects [27], and they are the second most important global warming agent after greenhouse gases. Second, submicron particles have the largest lifetimes in the troposphere, and are transported long distances away. Hence, their microphysical composition is gradually transformed and depends on the territory of their origin and the trajectories of air mass motion; therefore, their effect on the properties of atmospheric air is manifested on considerable spatial scales far away from a specific measurement site.
In this work, we discuss the results from multiyear studies of submicron aerosol and black carbon concentrations in the troposphere of Southwestern Siberia. Based only on a separate series of observations, it is unrealistic to identify regularities of interannual, seasonal, and diurnal variations in aerosol characteristics (“aerosol weather” [28]) under the influence of a complex combination of synoptic and meteorological processes. Weather is defined as a physical state of the atmosphere at a certain instant or in a finite period of time, determined by a set of meteorological quantities and atmospheric phenomena. Aerosol is an integral part of the atmosphere and, as such, heavily determines its optical state and should generally be considered as an element of weather.
Satellite observations and measurements of the aerosol optical depth with the application of sun photometers are known to be feasible only under the conditions of clear-sky and low-cloud weather. These data provide information for a limited set of atmospheric situations (as applied to conditions of Southwestern Siberia, there are only 15–20% cases, observed usually in anticyclones and in Arctic air masses). Thus, this problem can only be solved using continuous, multiyear observations in a monitoring mode. Here, we carried out a regional scale analysis to determine the aerosol states correctly using observations at five ground-based stations in the Tomsk and Novosibirsk Oblasts. Data from regular monthly flights of an aircraft laboratory over a background region in Novosibirsk Oblast were employed to estimate the interannual variations in the troposphere of the region.
2. Method and Instruments
Here, we will make just a few important methodic clarifications. The formation of the aerosol composition in the troposphere is known to depend on many processes, namely: on the geographic location of the origin of air mass and, correspondingly, on the strength of the sources and the sinks on the trajectory of the air mass motion to the observation region, i.e., processes with a relatively long impact period (crudely 3–10 days). To exclude the effect of fast-flowing processes of change in the relative air humidity with a pronounced diurnal behavior on the transformation of dry matter of submicron particles, the flow of the analyzed air, taken from the atmosphere before being admitted to the instruments, was artificially dried through heating at 20° from ambient.
Taking into account the main problem being addressed in this work, among the entire set of characteristics observed, we employed measurements of the angular scattering coefficient of the dry aerosol matter, μ (45°), and mass concentrations of black carbon and elemental carbon (EC) for analysis.
Photoelectric aerosol nephelometers (PhANs) measured the angular scattering coefficient of the dry matter of the submicron particles µd (45°) (Mm−1 sr−1) at an angle of 45° with a sensitivity level of molecular scattering of ~1 Mm−1 sr−1. The instruments were calibrated against molecular scattering by pure air and CO2 gas. The angular scattering nephelometer of PhAN-A provided measurements using a lamp as the source of radiation at an effective wavelength of 0.51 µm. The modified PhAN-M nephelometer had a light diode as a source of radiation at a wavelength of 0.53 µm [28,29].
The volume scattering coefficient was estimated using the empirical formula σd = 7.3⋅μd (45°) (Mm−1). For the convenience of our researchers studying the aerosol processes through non-optical means (such as through gravimetry), the mass concentration of the submicron aerosol was estimated according to a one-parameter aerosol optical model MA (μg/m3) = 2.4⋅μd (45°) (for a particle density of 1.5 g/cm3) [29].
The concentration BCeq was measured using a multiwavelength differential aethalometer (MDA) designed at the Institute of Atmospheric Optics, Siberian Branch, Russian Academy of Sciences (IAO SB RAS), with a sensitivity of ~20 ng/m3 when pumping 20 L of air through the device (Table 1). The concentration of BCeq was measured using a multiwavelength differential aethalometer (MDA) designed at IAO SB RAS, with a sensitivity of ~20 ng/m3 when pumping 20 L of air through the device. It is noted that the aethalometer measured the concentration of the absorbing substance in the aerosol in units of equivalent mass concentration BCeq (μg/m3), because the instrument was calibrated with respect to black carbon particles in order to determine the mass on the basis of recording the aerosol absorption.

Table 1.
Locations and characteristics of monitoring stations.
To determine the elemental carbon (EC) in the composition of the surface aerosol, samples were collected on fiberglass (Whatman®, Little Chalfont, UK) filters 47 mm in diameter at a rate of 30 l/min over 24 h. The method of reaction gas chromatography was used to determine the diurnally average concentrations of the EC. This method made it possible to determine the EC content through its high-temperature separation from organic carbon in an inert-oxidizing environment. Each component was oxidized to give CO2, converted to CH4, and was recorded using a flame-ionization detector. Thus, when sample was heated (700 °C) in an inert atmosphere, the organic compounds evaporated and the organic carbon was determined; meanwhile, the elemental carbon was quantified during combustion in the oxidizing atmosphere [30].
3. Measurement Sites
3.1. Aerosol Station
The Aerosol Station at the Institute of Atmospheric Optics, Siberian Branch, Russian Academy of Sciences (AS IAO SB RAS) is located in Akademgorodok, a suburban region of Tomsk (Figure 1); at this site, the measurements of this set of aerosol characteristics has been carried out in monitoring mode since 1997 [31]. The angular scattering coefficient of the submicron particles μ (45°) (Mm−1 sr−1) was determined using a PhAN-A nephelometer. The concentration BCeq was measured using a multiwavelength differential aethalometer (MDA).
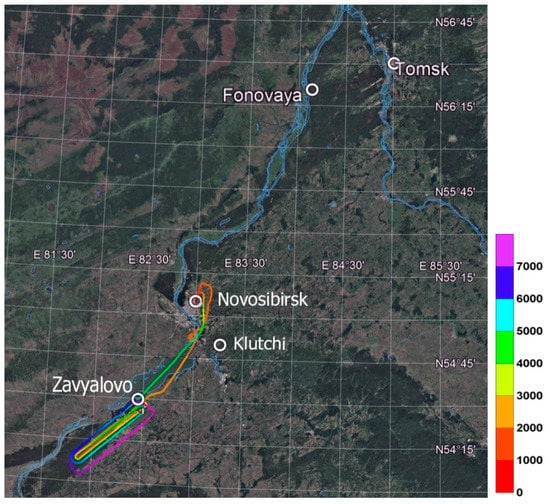
Figure 1.
Geographic positions of the measurement sites and flight paths of the aircraft laboratory (color lines). Google Earth (Image Landsat/Copernicus).
3.2. Fonovaya Observatory
The Fonovaya Observatory is located in a forested zone on the coast of the River Ob, 4 km from the nearest small village, Kireevsk. Tomsk is 60 km east of the measurement site. Given the predominant southwesterly and southerly winds in the region, the main wind direction from Tomsk does not have an effect on this terrain; therefore, this territory experiences much less anthropogenic load and, as such, can be considered as a conventionally background region.
Since November 2013, the PhAN-M nephelometer measurements of the angular scattering coefficient have been carried out at the observatory every hour in a monitoring mode, and the BCeq concentration has been measured using MAAP 5012 aethalometer (Thermo Scientific Fisher Inc., Franklin, TN, USA).
3.3. Novosibirsk
The measurement site is located at the center of Novosibirsk. Its population of approximately 1.5 million people occupies an area of 502 km2. The main local sources of anthropogenic aerosol in this region are motor vehicles (approximately 400,000) and thermal power plants. The distance between Tomsk and Novosibirsk is 205 km. Atmospheric air samples for aerosol analysis were taken from 2000 to 2016 every year, in winter (20 January–19 February), spring (20 April–19 May), summer (20 June–19 July), and autumn (20 September–19 October).
3.4. Klutchi Village
The site is located in Klutchi village, 30 km southeast of Novosibirsk, and is considered rural terrain. Its population of approximately 100 people occupies an area of 11 km2. It is thought that the composition of absorbing substance in aerosol in this area is formed as a result of natural sources slightly contaminated by pollutants of an anthropogenic origin. Here, from 1999 to 2017, samples were collected to determine the EC, at the time intervals as in Novosibirsk.
3.5. Zavyalovo Village
The Zavyalovo sampling site is located in a forested zone, 90 km southeast of Novosibirsk and 15 km from the nearest small Zavyalovo village. In this terrain, there are no local sources of anthropogenic pollution from the atmosphere. Aerosol samples were taken here from 2001 to 2016 in order to determine the concentrations of EC in the summer season, primarily because of the lack of a suitable infrastructure for collecting aerosol samples during the cold seasons.
3.6. Aircraft Laboratory
Mass concentrations of submicron aerosol and BCeq were measured since 2000 on board aircraft laboratory, in the framework of complex studies of atmospheric composition.
The flights of the aircraft laboratory (Optik-E AN-30 from 1999 to 2008, and Optik TU-134 since 2011) were carried out once a month, all year round, during daytime under clear-sky conditions.
The Optik-E AN-30 aircraft laboratory was chosen as a research platform because of several advantages it has. It is a high-wing, two turboprop airplane, which has one more turbojet engine in the right nacelle. It can fly in a wide range of altitudes from 100 to 7000 m with speeds of 70–125 m/s. Another advantage is that this aircraft was specifically designed for airborne mapping; therefore, it has five optical windows in the bottom, which can be used for remote sensing [32].
Because the AN-30 aircraft ended its operational life in 2011, the question about choosing another aircraft for placing the equipment and continuing research arose. The closest in terms of technical characteristics was the TU-134 aircraft—a short-range passenger aircraft with two turbojet engines, which was the basis of the new Optic TU-134 aircraft laboratory.
The studied route passes over a pine forest along the right-hand coast of the Ob Reservoir, near Zavyalovo Village, in the southern region of Novosibirsk oblast (Figure 1). This terrain was chosen as the proving ground for background measurements, because cities and industrial activities, being sources of anthropogenic aerosols, are far away from this territory.
Sensing was carried out according to the following pattern: when approaching the region of measurements, the aircraft climbed to altitude of 7 km, then, circling over a specified area, it gradually descended (on a horizontal flight leg, signals were recorded for 8 min altitudes of 7.0, 5.5, 4.0, 3.0, 2.0, 1.5, 1.0, and 0.5 km). Flights were carried out once a month, each lasting, on the average, for approximately 3 h. A modified nephelometer PhAN-M was used on board the aircraft laboratory to measure the aerosol scattering coefficient, and the MDA was used to measure the BCeq concentration. In total, 142 flights of the aircraft laboratory were carried out over the period of 2000–2018, which were analyzed here.
4. Results and Discussion
Before discussing the results from the analysis of the multiyear measurements, which were required to develop prognostic models, the following points must be noted.
In order for the multiyear time series of surface measurements to be used to determine the characteristic properties of the tropospheric aerosol on a specifically regional scale, the effect of forest fires should be identified first.
Wildfires are an integral component of regional “aerosol weather” in Siberia, the territory of which is mostly covered by forest massifs [13,33,34,35,36,37,38]. This factor ambiguously affects the atmospheric radiation regime, because large amounts of both non-absorbing particles and black carbon are emitted into the atmosphere during biomass burning. Smoke from remote wildfires in the surface atmospheric layer are known to be a cooling factor (direct radiative forcing) [33,34]. It is noteworthy that the absorption of radiation in the upper layers of the smoke mass leads to its warming and lifting of air up to altitudes of cloud formation, which contains a greater concentration of particles, serving mostly as condensation nuclei [19,35,36]. Accordingly, formation of thick low-level clouds intensifies the cooling of lower atmospheric layers (indirect aerosol effects).
The large volume of heated smoke mass and clouds is transported large distances and can penetrate as far as remote regions of the Arctic. Under the influence of processes of dry and wet deposition, absorbing aerosol particles, after being supplied to the underlying surface, decrease the surface reflectivity, leading to longer-term and more serious consequences, and serving as the warming factor (indirect deferred, cumulative aerosol effect) [39,40,41,42]. To estimate the contribution of wildfires to changes in the concentrations of submicron aerosol and black carbon, an analysis was carried out for the entire ensemble of data and for the dataset, in which the events with smoke haze present in the atmosphere over the observation sites were excluded (without fires). The situations with the presence of smokes were selected on the basis of estimates of the parameter P = BCeq/MA, i.e., the BCeq fraction of submicron aerosol, and through an analysis of the satellite information. Based on the multiyear measurements at the Aerosol Station, the stable regularity revealed a lower BCeq fraction in forest fire smoke (1 to 5%) compared with that in the background aerosol, i.e., they were weakly absorbing [29]. The conventionally called P-effect was present in the decrease of the P values in conditions of smoke haze relative to their values in natural conditions. This effect is caused by the dominating contribution of the pyrolysis of wooden combustible materials to the formation of properties of smoke mist particles. The value of the BCeq fraction of the dry matter of submicron aerosol P was determined as the ratio of the mass concentrations of BCeq and aerosol, a with the mean error of about 20–25%. The effect of smoke from forest fires was established using a fire map from [43], composed on the basis of satellite information and an analysis of the meteorological situation.
The second factor, which influences the properties of tropospheric aerosol, analyzed on the basis of a multiyear time series of surface measurements, was the anthropogenic sources, located near the measurement sites. This problem was solved quite easily by comparing synchronous measurements at urban and suburban sites against data obtained by the stations in background regions.
4.1. Seasonal Variations
4.1.1. Surface Measurements
Effect of Forest Fires
Figure 2 presents the multiyear seasonal behavior of mass concentrations of submicron aerosol and black carbon at the Aerosol Station (suburban region). Red boxes denote the total datasets, comprising measurements loaded by the effect of remote forest fires. Green and black boxes show the average mass concentrations of submicron aerosol and black carbon, processed to remove the events loaded by smoke from forest fires. After the datasets of MA and BCeq were processed to eliminate the effect of forest fires, their maximal values in the surface atmospheric layer were observed in a cold period of the year, and minimal values were noted in summer. The reasons for the annual behavior will be discussed below.

Figure 2.
Multiyear seasonal behavior of mass concentrations of (a) submicron aerosol and (b) black carbon (BC)eq at the Aerosol Station (suburban region of Tomsk) in 1997–2018. Red boxes indicate the total dataset. Green and black boxes are for datasets without accounting for the contribution of situations with wildfires. The lower and upper sides of the box show the 25 and 75 percentile concentrations, respectively; the horizontal bars represent the median; and the closed squares give the mean. The whiskers represent the 5th and 95th percentile concentrations.
As seen, the annual behavior of the measured characteristics is affected appreciably by smoke from remote forest fires, occurring from April to October, in the Siberian region.
It should be noted that during the fire-dangerous period, smoke from remote wildfires was observed most often in May and July. The effect of smoke plumes from forest fires over the entire period of observations at the Aerosol Station led to increased average concentrations of aerosol and BC in this month, e.g., by factors of 2 and 1.5, respectively, at the Aerosol Station. Figure 3 presents the interannual variations in the identified fire situations in these months. From 1997 to 2018, there were fewer days in May with smoke haze present, probably owing to the prohibition issued on combustion of the previous year’s vegetation. On the contrary, in July, there were more days with smoke from forest fires. Analogous results were also obtained in the literature [44], based on which, over the period of 2002–2018, a negative trend of aerosol optical depth (AOD) in spring was identified, as well as increasing tendencies for its summertime values. Atmospheric AOD measurements were carried out all year round in the vicinity of Tomsk using a solar photometers [22,45].
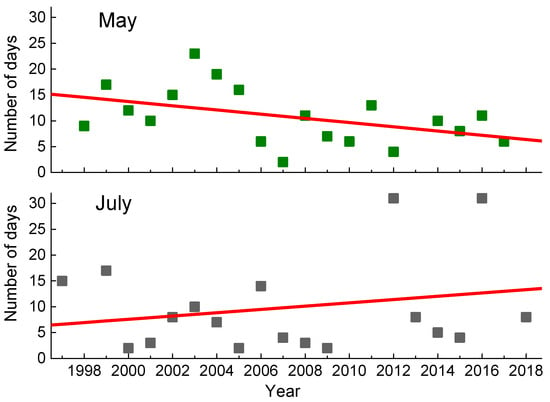
Figure 3.
Time behavior of the number of days in May and July with the effect of smoke from forest fires, based on measurements from the Aerosol Station from 1997–2018. Straight lines show linear regressions.
The longest-term and severest smoke situations were observed in 1997, 2012, and 2016, when Southwestern Siberia was covered by smoke plumes from extensive forest fires for a long time. The maximal daily mass concentrations of submicron aerosol and black carbon were observed at the Aerosol Station on 27 July 2012, when the diurnal mass concentration of submicron aerosol was 1213 μg/m3 and the BCeq concentration was 27 μg/m3. The situation was the same in the EC concentration measurements at three sites in Novosibirsk Oblast, with the strongest smoke pollution of the atmosphere observed in July 2012. The measurements of aerosol characteristics in this period recorded a substantially increased fraction of submicron aerosol and organic carbon (OC) [46]. The EC concentrations in the period of maximal smoke pollution of the atmosphere reached 26 μg/m3 in Novosibirsk, 11 μg/m3 in Klutchi, and 6 μg/m3 in Zavyalovo.
Estimates of the Effect of Urban Aerosol Sources
To estimate the effect of urban aerosol sources, a comparative analysis of the values at ground-based sites was carried out without accounting for situations with the effect of smoke from remote forest fires. It should be noted that the average multiyear seasonal behaviors of MA and BCeq at the suburban station (Aerosol Station) and in the background region (Fonovaya Observatory) were close in shape, being maximal in winter and minimal in the warm period of the year (Figure 4).
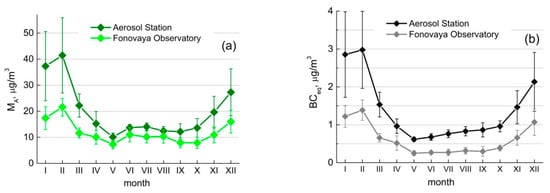
Figure 4.
Annually averaged behaviors of mass concentrations of (a) submicron aerosol, (b) black carbon, and their standard deviations at the Aerosol Station (suburban region) and in the Fonovaya Observatory (background) in 2014–2018.
However, as expected, the concentrations of aerosol and BCeq at the sites, subject to a stronger anthropogenic load, were much higher, and the amplitude of their seasonal behavior was more pronounced.
For the average annual behavior at the Aerosol Station (Tomsk) over the entire period of 1997–2018, the concentration of submicron aerosol MA was maximal (32 ± 9.9 μg/m3) in February and minimal (13.7 ± 2.9 μg/m3) in September (Figure 2a, Table 2). In the atmosphere over the Fonovaya Observatory over the period of 2014–2018 (period of synchronous measurements at two stations), the average aerosol concentration was also maximal (21.6 ± 3.4 μg/m3) in February and minimal (7.3 ± 1.7 μg/m3) in May (Figure 4a). In this same period, at the Aerosol Station, the maximal average concentration, recorded in February, increased to 41.4 ± 14.4 μg/m3, and the minimal concentration, revealed in May, was 10.1 ± 1.5 μg/m3. Thus, the largest contribution of anthropogenic sources in the suburban region over 2014–2018 was observed in winter season: in January and February, the aerosol concentration was, on the average, 20 μg/m3 (a factor of 1.9) larger than for the background conditions. A minimal difference was revealed in August, where the average value was 2.1 μg/m3 (a factor of 1.2) larger at the Aerosol Station than at the Fonovaya Observatory.

Table 2.
Average mass concentrations of submicron aerosol (MA), black carbon (BCeq), elemental carbon (EC) (μg/m3), and their standard deviation (SD).
Analogous tendencies were also observed for the BCeq concentration (Figure 2b and Figure 4b). The average maximal value in annual behavior over 22 years of measurement (2.7 ± 0.8 mg/m3) was revealed in January, and the minimal was found (0.79 ± 0.15 μg/m3) in June. Over the last 5 years, the maximum in seasonal oscillations increased to 3 ± 1 μg/m3 and shifted toward February, and the minimum of 0.62 ± 0.06 μg/m3 shifted toward May. Under the background conditions in this same period, the maximal seasonal variations in the BCeq concentration were detected in these same months, with values of 1.4 ± 0.3 μg/m3 and 0.25 ± 0.07 μg/m3, respectively. Thus, the maximal contribution of black carbon from urban sources over the period of 2014–2018 at the Aerosol Station was recorded in February—the BCeq concentration was 1.6 μg/m3 larger than at the Fonovaya Observatory, with a minimal difference of 0.37 μg/m3 recorded in May.
Figure 5 presents the seasonally averaged concentrations of EC at three sampling sites in Novosibirsk Oblast. Maximal EC concentrations were observed in the winter season in both Novosibirsk (6.9 ± 2.2 μg/m3) and Klutchi village (3.4 ± 1.2 μg/m3). The minimal values in the urban zone (3.8 ± 2.4 μg/m3) were noted in summer. In Klutchi village, the minimum was in autumn (September-October), with EC concentration values of 1.5 ± 0.6 μg/m3. The seasonal behavior of the concentrations of elemental carbon at three stations in Novosibirsk Oblast almost completely repeated the dynamics of the variations in black carbon concentration in the atmosphere of the Tomsk Oblast. The EC concentration in the atmosphere of the background region (Zavyalovo village) at summertime had been 1 ± 0.61 μg/m3, a factor of 1.5 lower than in Klutchi village, and a factor of 3.8 lower than in Novosibirsk.
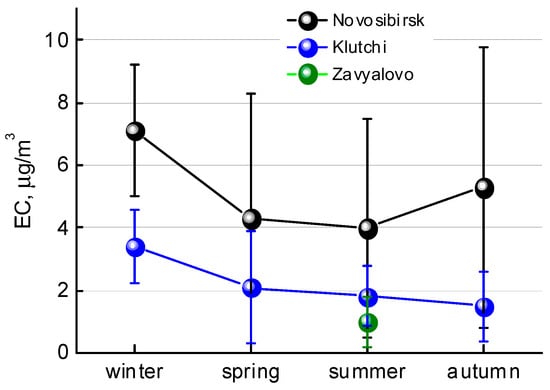
Figure 5.
Annually averaged behavior of EC concentration and its SD in Novosibirsk (urban center), Klutchi village (suburban) and Zavyalovo village (background; 2000–2016).
4.1.2. Aircraft Measurements
We note that processing of data from the aircraft measurements of the vertical distribution of the concentrations of aerosol and absorbing substance over 2000–2018 showed that seasonal variations in these quantities fit well into the variability range of sensing results published previously [47]. High surface concentrations of aerosol particles for winter months can be explained quite readily (Figure 6). Obviously, the increased aerosol content at altitudes of 0.5–3 km in summer (with the maximum in August, in our dataset) was caused by the effect of smoke from forest fires, as well as by the increase in the height of the mixing layer as the surfaces warmed. In autumn, the total content tended to decrease, seemingly because of a larger number of days with precipitation and fog, which favored cleaning of the atmosphere and eliminated the effect of the underlying surface.
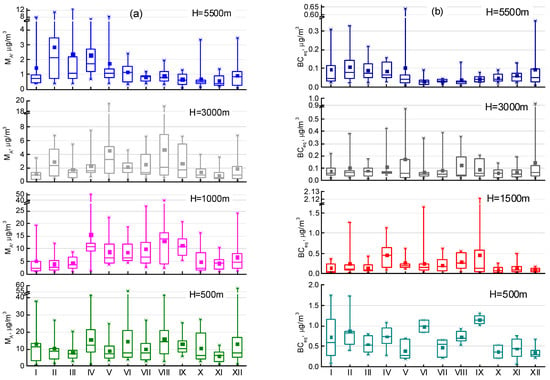
Figure 6.
Seasonal behavior of the mass concentrations of (a) submicron aerosol and (b) BCeq at different altitudes taken from aircraft measurements in 2000–2018 (Zavyalovo village).
The maximal mass concentration of submicron particles at the 0.5-km level (15.8 μg/m3) was observed in August, and the minimal was in November. The higher the altitude, the smaller the aerosol concentration. At an altitude of 5 km, the maximum of seasonal oscillations shifted towards the cold period of the year. In February, the aerosol concentration was 2.8 μg/m3, gradually decreasing until reaching a minimum of 0.57 μg/m3 in November.
Regarding the seasonal variations in the black carbon concentration, it should be noted that increased values at the 0.5-km level were manifested in the warm period of the year (with a maximum of 1.15 μg/m3 in September and a minimum of 0.35 μg/m3 in December). The tendency of an increased BCeq concentration was retained up to an altitude of 3 km in the warm period compared with the cold period of the year. At an altitude of 5 km, the seasonal behavior changed, and the BCeq concentration minimum was observed in summer. The black carbon concentration decreased to 0.03 μg/m3. In the cold period, the BCeq concentration growed at this altitude (the highest value of 0.1 μg/m3 observed in February). It should be noted that separate bursts of submicron particle concentrations were often recorded during the sensing period at different altitudes, with a high content of absorbing substance (Figure 6). Evidently, these particles were anthropogenic in origin [48,49,50,51,52].
To estimate the possible contribution of anthropogenic sources to the state of aerosol in the troposphere, we used the parameter P = BCeq/MA, characterizing the “blackening” degree of the submicron particles. In the classification suggested for “aerosol weather” types, a value P > 0.05 (or 5%) was characteristic for smog situations, caused by anthropogenic pollutants [28].
Our analysis showed that the average BCeq fraction content in aerosol P was in the range of 0.042–0.098 at all altitudes over the entire period of measurements.
Considering that some ambiguity existed in identifying the smog situations at the boundary separating different “aerosol weather” types according to the criterion (P = 5%), for reliability, we selected situations for which the P value exceeded 7%. It was found that increased (>0.07) P values were observed most often at altitudes of 500 m and 3000–5500 m, and that their frequency of occurrence had a pronounced seasonal behavior (Figure 7). At altitudes from 500 to 5500 m, this was observed in 5–5.5% of situations in the cold period; while in summer months, the number of these situations was 1% of the total data.
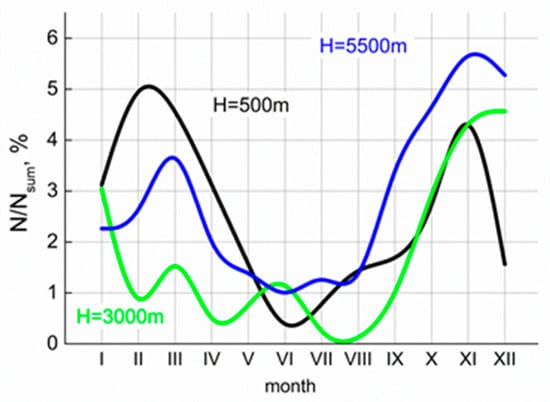
Figure 7.
Seasonal behavior of the frequency of occurrence of increased BCeq fraction in aerosol (P > 0.07) at different altitudes, using aircraft measurements in 2000–2018.
Hence, it can be concluded that, on the whole, the contribution of anthropogenic sources is small, and, when creating prognostic models, the average values of the studied characteristics can be quite successfully used to describe the aerosol characteristics for background conditions of the troposphere in the region of Southwestern Siberia.
4.2. Interannual Variations
In the availability of multiyear observations in the troposphere of Southwestern Siberia, it is important to estimate possible long-term tendencies of variations in the submicron particle and black carbon contents. Taking into account the relatively short lifetime of aerosol particles in the lower troposphere, among the main processes causing their interannual variations, we can single out the following factors: changes in the macroscale and mesoscale atmospheric circulations, determining alternation among air masses of different origins and trajectories of their motion, and a growth or decrease in the contribution of anthropogenic sources, located in immediate vicinity of the observation sites. As was shown for the territory of Siberia, it is also necessary to take into consideration the specific contribution of smoke from wildfires. The frequency of their occurrence is known to be determined heavily by both the changes in weather conditions on the whole on vast territories, and the intensifying role of the human factor.
4.2.1. Surface Measurements
Multiyear Behavior of Submicron Aerosol Concentration
As expected, the largest annually average values of submicron aerosol mass concentration at the Aerosol Station were recorded in 1997, 2012, and 2016, i.e., the years with the most severe fires in duration, covering the greatest territory in the Siberian region (Figure 8a). Accounting for the contributions of situations with smoke from forest fires led to an increase of the annual average aerosol concentration in 2012 by 20 μg/m3. A minimal annual average aerosol concentration was observed in 2010. At the same time, our estimates showed that no reliable trend of interannual MA variations was present (Table 3). The trend values were calculated from linear regression, constructed using the least squares method. It is noteworthy that there was a significant (at p-value = 0.05) decrease of aerosol concentration by 2.3 ± 1.1% per year only in spring season, and a clarification of the causes for this requires a separate study.
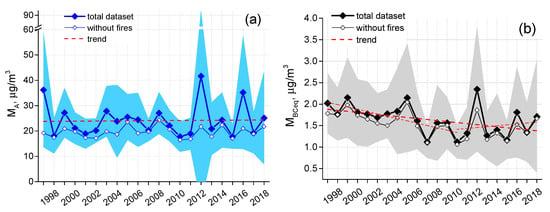
Figure 8.
Multiyear behavior, SD, and trends of annual average mass concentrations of (a) submicron aerosol and (b) black carbon at the Aerosol Station (suburban) in 1997–2018. Blue shadings show SD of total dataset of (a) mass concentrations of submicron aerosol. Gray shadings show SD of total dataset of (b) mass concentrations of black carbon. Open diamonds indicate concentrations without accounting for the contributions from situations with wildfires.

Table 3.
Trends (% per year) of the concentrations MA, BCeq, EC (μg/m3) and their errors and significance (p-value), given in parentheses, at different stations.
It can be clearly seen that increases in the annual average particle concentrations could be discerned in certain periods, likely associated with changes in the circulation processes under the influence of quasibiennial oscillations (QBO) [53,54].
Multiyear Behavior of Black Carbon Concentration
An analysis of the entire multiyear time series revealed a reliable decrease in the concentration of absorbing substance in the composition of submicron fraction of particles by 1.5 ± 0.6% per year, with the strongest reductions in spring and fall, by 3.7 ± 0.6 and 3.3 ± 0.8% per year, respectively (Figure 8b and Table 3). It should be specially noted that the annual average BCeq concentration values were practically at the same level within this time series from 2000 to 2004, followed by a decrease until 2010, then changed to the growth, which was most intense in the winter season [55]. As expected, the maximal annually average BCeq concentrations were characteristic for 2012 data, owing to the anomalously high contribution of wildfires in the summer season. We note that, as in multiyear variations of the total mass concentration of submicron aerosol, in this case, we again discerned quasibiennial oscillations of annual average values.
Multiyear Behavior of Elemental Carbon
Considering the results of observations (1999–2017) of the concentrations of elemental carbon EC in the Novosibirsk oblast, we highlight the main points. The trend of annual average and seasonal mean values was negative over this period at all observation sites (Table 3). Aerosol samples were only collected in summer in Zavyalovo village. There was a decrease in annual average values of EC concentration in Novosibirsk and Klyuchi village, and in summer values in Zavyalovo village until 2007–2008, observed with a reliable trend of −11 ± 2.3% (p-value = 0.002) per year in Novosibirsk (Figure 9). Then the decrease changed to an increase in Novosibirsk, and in Klyuchi and Zavyalovo the decrease slowed down.
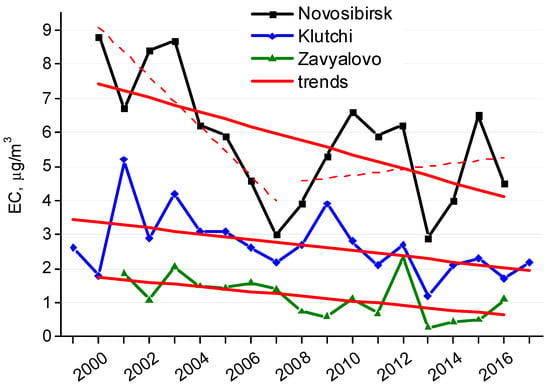
Figure 9.
Multiyear (1999–2017) behavior of annual average EC concentrations and their trends (solid lines) in Novosibirsk (urban center), Klutchi village (suburban), and Zavyalovo village (background). Dashed lines show EC concentration trends in Novosibirsk during 1999–2007 and 2008–2016.
Multiyear Variations in the Contribution of Anthropogenic Sources
To determine long-term variations in the effect of urban sources on the measured aerosol and black carbon concentrations, we will consider the data, obtained in winter and summer periods (the total dataset was processed to remove situations with the effect of smokes from wildfires).
The aerosol and BCeq concentrations increased in the winter season at the Aerosol Station (suburban); at the same time, no interannual trend existed in this period of the year at the Fonovaya Observatory (background; Figure 10). The difference between the average wintertime values of the aerosol in the suburb and under the background conditions increased from 15 μg/m3 in 2014 to 20 μg/m3 in 2018, i.e., by a factor of 1.3. The divergence in black carbon values between the suburban conditions and the background region during winter increased from 0.94 μg/m3 in 2014 to 1.75 μg/m3 in 2018, i.e., by a factor of 1.9. Thus, from a comparison of the measurements, it can be seen that in the winter season, there was a permanent intensification of the anthropogenic effect of the city on the aerosol composition at a suburban station. In the summer period, the aerosol concentration was found to decrease at both stations, while the BCeq concentration decreased much less at both stations. The absolute differences in the monthly average values between the urban and background conditions, averaged over 5 years of measurements, were from 2 mg/m3 in August to 20 μg/m3 in January for aerosol, and from 0.4 μg/m3 in June to 1.6 μg/m3 in January for black carbon. These estimates show that at the Aerosol Station, the BCeq fraction in aerosol increased at a rate of 6 ± 2% per year, corresponding to the absolute increment in the BCeq fraction ΔP~0.004 per year. In turn, no P increase was observed at the Fonovaya Observatory.
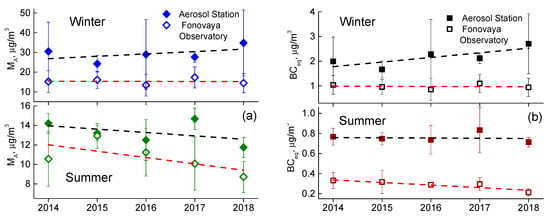
Figure 10.
Multiyear behavior of annually average values and SD of (a) submicron aerosol and (b) BCeq concentrations at the Aerosol Station (suburban) and the Fonovaya Observatory (background) in 2014–2018. Closed diamonds show measurements at the Aerosol Station, open diamonds show measurements at the Fonovaya Observatory. Black dashed lines show trends at the Aerosol Station, and red dashed lines show those at the Fonovaya Observatory.
4.2.2. Aircraft Measurements
From our analysis of the multiyear (2000–2018) measurements in the troposphere, we concluded that no reliable changes were observed in the concentration of submicron particles at all altitudes (Figure 11a and Table 4). Of note is the considerable increase in aerosol concentration at small altitudes in 2012, most likely associated with the effect of severe fires that raged in Siberia in that year.
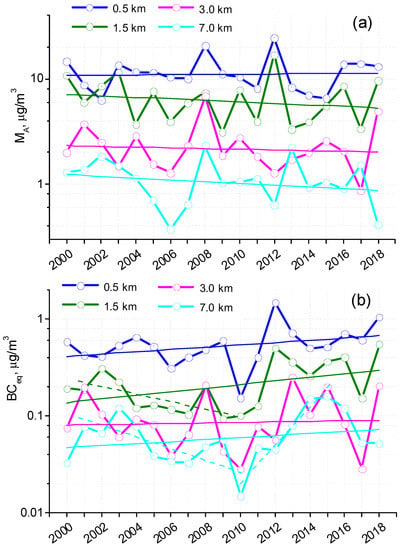
Figure 11.
Multiyear behaviors of annual average concentrations of (a) aerosol and (b) black carbon at different altitudes in clear-sky troposphere (Zavyalovo village) in 2000–2018. Solid lines show trends in 2000–2018, and dashed lines show BCeq trends in 2001–2010 and 2011–2015.

Table 4.
Trend (% per year) concentrations of MA, BCeq, and their errors and significance (p-value), given in parentheses, at different altitudes in 2000–2018.
In the time behavior, of we can clearly discern a minimum value in 2010. In the interannual dynamics of the BCeq concentration in the period until 2010 at all altitudes, there was a decrease in concentration, followed by an increase. As a consequence, black carbon increased at all altitudes over the entire period (2000–2018) of observation. At altitude of 1.5 km over the period of 2000–2010, there was a reliable negative trend of −7.7 ± 3.3% per year at the p-value = 0.04, and then the BCeq concentration started to increase. Over the entire period of 2000–2018, black carbon showed a positive trend of 5.3 ± 2.2% per year at an altitude of 1.5 km, found to be significant at p-value = 0.05 (Figure 11b and Table 4). After 2010, the BCeq concentration growth was especially marked at the altitude of 7 km in the period of 2011–2015.
The most characteristic feature of the seasonal variations in black carbon concentrations was their increase in the summer and fall periods at practically all altitudes, with a maximal growth of 9.7 ± 2.5% per year (p-value = 0.003) observed in summer in the mixing layer at an altitude of 0.5 km.
The data presented here indicate that the lower troposphere of Southwestern Siberia is already beginning to exhibit (still weak) signs of increasing anthropogenic load, probably associated with the developing industry and urban infrastructure.
5. Conclusions
In this work, we analyzed the results from multiyear studies of submicron aerosol mass concentration and black carbon content in the troposphere of Southwestern Siberia. To correctly identify the aerosol states characteristic of the study region, we considered a long observation time series obtained in the surface atmospheric layer at five ground-based stations, as well as the results from regular flights of the aircraft laboratory over background region in Novosibirsk oblast.
The annual average values of the studied parameters were considered in order to estimate the interannual variations. The submicron aerosol and black carbon concentrations in the surface atmospheric layer were found to be maximal in 1997, 2012, and 2016, when the largest number of wildfires occurred in the Siberian region. We revealed that the effect of quasibiennial oscillation of atmospheric circulation manifested in certain periods of their interannual variations. Estimates showed that no reliable trend of interannual variations in MA existed, but a reliable decrease of 1.5 ± 0.6% per year was distinctly manifested in the concentration of the absorbing substance in the composition of the submicron fraction of particles, with the strongest decreases in spring (3.7 ± 0.6% per year) and fall (3.3 ± 0.8% per year).
Synchronous measurements at the Aerosol Station (suburban) and the Fonovaya Observatory (background) over the period of 2014–2018 were compared to estimate the aerosol contribution of the industrial center to the aerosol composition in the surface atmospheric layer. The contribution of anthropogenic sources in the suburban region was shown to be the largest in winter—in January and February, the aerosol concentration in the suburb were on the average 20 μg/m3 larger than under the background conditions. The minimal difference was observed in the warm period of the year: in August, at the Aerosol Station, the average value was 2 μg/m3 larger than at the Fonovaya Observatory. The maximal contribution of the city to the black carbon content was recorded at Aerosol Station in February, when the BCeq concentration was a factor of 1.6 μg/m3 larger than at the Fonovaya Observatory, and the minimal (0.4 μg/m3) was found in May. From a comparison of the measurements, it can be seen that in the winter season, there was a permanent intensification of the anthropogenic effect of the city on the aerosol composition at the suburban station. It should be noted that the seasonal behavior of EC at three stations in Novosibirsk Oblast almost completely matched the dynamics of variations in the BCeq concentration in the atmosphere of Tomsk Oblast. The EC concentration in the atmosphere of the background region (Zavyalovo village) in summertime was a factor of 1.5 lower than in suburban (Klutchi village) and a factor of 3.8 lower than in Novosibirsk.
Analysis of the multiyear (2000–2018) measurements in the troposphere revealed no reliable changes in the concentration of submicron particles at all altitudes. In contrast to the mass concentration of the submicron aerosol, the black carbon content was found to show an increasing tendency. In the multiyear behavior of the BCeq concentration at all altitudes, there was a decrease in concentration in the period until 2010, followed by an increase in black carbon. As a consequence, over the entire period (2000–2018) of observations, BCeq increased at all altitudes. The positive trend of 5.3 ± 2.2% per year at an altitude of 1.5 km was found to be significant at p-value = 0.05.
Summarizing the results of our analysis of multiyear studies as a whole, we note that the obtained quantitative values of the aerosol characteristics, and the resulting seasonal behavior and trends of their interannual variations, are necessary for their use as input parameters for regional-scale prognostic models.
Author Contributions
Conceptualization, M.P.; instrumentation maintenance, V.S.; measurements, D.C., S.P., and E.Y.; calculations: E.Y., D.C., and S.P.; analysis of results, M.P., V.K., V.M., E.Y., D.C., and S.P.; writing original draft, E.Y. and S.P.; writing review and editing, M.P. All authors have read and agreed to the published version of the manuscript.
Funding
The long-term measurements were supported by the Ministry of Science and Higher Education of the Russian Federation (IAO SB RAS). The analysis was carried out in 2020, with the financial support of the Russian Science Foundation (agreement No. 19-77-20092).
Institutional Review Board Statement
Not applicable.
Informed Consent Statement
Not applicable.
Data Availability Statement
Data availability. Data can be obtained from Mikhail Panchenko (pmv@iao.ru) upon request.
Conflicts of Interest
The authors declare no conflict of interest.
References
- IPCC. Managing the Risks of Extreme Events and Disasters to Advance Climate Change Adaptation. A Special Report of Working Groups I and II of the Special Report of the Intergovernmental Panel on Climate Change. Intergovernmental Panel on Climate Change; Field, C.B., Barros, V., Stocker, T.F., Qin, D., Dokken, D.J., Ebi, K.L., Mastrandrea, M.D., Mach, K.J., Plattner, G.-K., Allen, S.K., et al., Eds.; Cambridge University Press: Cambridge, UK; New York, NY, USA, 2012; Available online: https://www.ipcc.ch/report/managing-the-risks-of-extreme-events-and-disasters-to-advance-climate-change-adaptation/ (accessed on 16 January 2021).
- Reche, C.; Querol, X.; Alastuey, A.; Viana, M.; Pey, J.; Moreno, T.; Rodrıguez, S.; Gonzalez, Y.; Fernandez-Camacho, R.; Sanchez de la Campa, A.M.; et al. New consideration for PM, Black carbon and particle number concentration for air quality monitoring across different European cities. Atmos. Chem. Phys. 2011, 13, 6207–6227. [Google Scholar] [CrossRef]
- Gorchakov, G.I.; Isakov, A.A.; Mokhov, I.I.; Sviridenkov, M.A.; Shukurov, K.A.; Karpov, A.V.; Chernokulsky, A.V. Temporal variability of the near-surface aerosol content from daily observations at IAP scientific station near Moscow during 1991–2002. In Proceedings of the 14th Atmospheric Radiation Measurement (ARM) Science Team Meeting, Albuquerque, NM, USA, 22–26 March 2004; Available online: http://www.arm.gov/publications/proceedings/conf14/extended_abs/gorchakov-gi.pdf (accessed on 16 January 2021).
- Man, C.K.; Shin, M.Y. Light scattering and absorption properties of aerosol particles in Hong Kong. J. Aerosol Sci. 2001, 32, 795–804. [Google Scholar] [CrossRef]
- Holler, R.; Tohno, S.; Kasahara, M.; Hitzenberger, R. Long-term characterization of carbonaceous aerosol in Uji, Japan. Atmos. Environ. 2002, 36, 1267–2175. [Google Scholar] [CrossRef]
- Arkouli, M.; Ulke, A.G.; Endlicher, W.; Baumbach, G.; Schultz, E.; Vogt, U.; Müller, M.; Dawidowski, L.; Faggi, A.; Benning, U.W.; et al. Distribution and temporal behavior of particulate matter over the urban area of Buenos Aires. Atmos. Pollut. Res. 2010, 1, 1–8. [Google Scholar] [CrossRef]
- Kuhlbusch, T.A.J.; John, A.C.; Fissan, H. Diurnal variations of aerosol characteristics at a rural measuring site close to the Ruhr-Area, Germany. Atmos. Environ. 2001, 35, 13–21. [Google Scholar] [CrossRef]
- Perez, N.; Pey, J.; Cusack, M.; Reche, C.; Querol, X.; Alastuey, A.; Viana, M. Variability of Particle Number, Black Carbon, and PM10, PM2.5, and PM1 Levels and Speciation: Influence of Road Traffic Emissions on Urban Air Quality. Aerosol Sci. Technol. 2010, 44, 487–499. [Google Scholar] [CrossRef]
- Bhugwant, C.; Bremaud, P. Simultaneous Measurements of Black Carbon, PM10, Ozone and NOx Variability at a Locally Polluted Island in the Southern Tropics. J. Atmos. Chem. 2001, 39, 261–280. [Google Scholar] [CrossRef]
- Haywood, J.M.; Ramaswamy, V. Global sensitivity studies of the direct radiative forcing due to anthropogenic sulphate and black carbon aerosols. J. Geophys. Res. 1998, 103, 6043–6058. [Google Scholar] [CrossRef]
- Balmes, K.; Fu, Q. The diurnally-averaged aerosol direct radiative effect and the use of the daytime-mean and insolation-weighted-mean solar zenith angles. J. Quant. Spectrosc. Radiat. Transf. 2020, 257, 107363. [Google Scholar] [CrossRef]
- Smith, R.N.B. A scheme for predicting layer clouds and their water content in a general circulation model. Q. J. R. Meteorol. Soc. 1990, 116, 435–460. [Google Scholar] [CrossRef]
- Koehler, K.A.; DeMott, P.J.; Kreidenweis, S.M.; Popovicheva, O.B.; Petters, M.D.; Carrico, C.M.; Kireeva, E.D.; Khokhlova, T.D.; Shonija, N.K. Cloud condensation nuclei and ice nucleation activity of hydrophobic and hydrophilic soot particles. Phys. Chem. Chem. Phys. 2009, 11, 7906–7920. [Google Scholar] [CrossRef]
- Arctic Report Card: Update for 2020. Available online: https://arctic.noaa.gov/Report-Card/Report-Card-2020/ArtMID/7975/Article (accessed on 16 January 2021).
- Biskaborn, B.K.; Smith, S.L.; Noetzli, J.; Matthes, H.; Vieira, G.; Streletskiy, D.A.; Schoeneich, P.; Romanovsky, V.E.; Lewkowicz, A.G.; Abramov, A.; et al. Permafrost is warming at a global scale. Nat. Commun. 2019, 10, 264. [Google Scholar] [CrossRef]
- Box, J.; Colgan, W.T.; Christensen, T.R.; Schmidt, N.M.; Lund, M.; Parmentier, F.-J.W.; Brown, R.; Bhatt, U.S.; Euskirchen, E.S.; Romanovsky, V.E.; et al. Key indicators of Arctic climate change: 1971–2017. Environ. Res. Lett. 2019, 14, 045010. [Google Scholar] [CrossRef]
- Cohen, J.; Zhang, X.; Francis, J.; Jung, T.; Kwok, R.; Overland, J.; Ballinger, T.J.; Bhatt, U.S.; Chen, H.W.; Coumou, D.; et al. Divergent consensuses on Arctic amplification influence on midlatitude severe winter weather. Nat. Clim. Chang. 2020, 10, 20–29. [Google Scholar] [CrossRef]
- Hanna, E.; Pattyn, F.; Navarro, F.; Favier, V.; Goelzer, H.; Broeke, M.R.V.D.; Vizcaino, M.; Whitehouse, P.L.; Ritz, C.; Bulthuis, K.; et al. Mass balance of the ice sheets and glaciers—Progress since AR5 and challenges. Earth Sci. Rev. 2020, 201, 102976. [Google Scholar] [CrossRef]
- Myers-Smith, I.H.; Kerby, J.T.; Phoenix, G.K.; Bjerke, J.W.; Epstein, H.E.; Assmann, J.J.; John, C.; Andreu-Hayles, L.; Angers-Blondin, S.; Beck, P.S.A.; et al. Complexity revealed in the greening of the Arctic. Nat. Clim. Chang. 2020, 10, 106–117. [Google Scholar] [CrossRef]
- Overland, J.E.; Wang, M. The 2020 Siberian heat wave. Int. J. Climatol. 2020. [Google Scholar] [CrossRef]
- Available online: https://www.arm.gov/about/management-structure/arm-priorities (accessed on 16 January 2021).
- Holben, B.N.; Eck, T.F.; Slutsker, I.; Tanre, D.; Buis, J.P.; Setzer, A.; Vermote, E.; Reagan, J.A.; Kaufman, Y.J.; Nakadjima, T.; et al. AERONET—A federated instrument network and data archive for aerosol characterization. Rem. Sens. Environ. 1998, 66, 1–16. [Google Scholar] [CrossRef]
- Holben, B.N.; Eck, T.F.; Slutsker, I.; Smirnov, A.; Sinyuk, A.; Schafer, J.; Giles, D.; Dubovik, O. Aeronet’s Version 2.0 quality assurance criteria. Proc. SPIE Remote Sens. Atmos. Clouds 2006, 6408, 64080Q. [Google Scholar] [CrossRef]
- Boucher, O.; Bellassen, V.; Benveniste, H.; Ciais, P.; Criqui, P.; Guivarch, C.; Le Treut, H.; Mathy, S.; Séférian, R. In the wake of Paris Agreement, scientists must embrace new directions for climate change research. Proc. Natl. Acad. Sci. USA 2016, 113, 7287–7290. [Google Scholar] [CrossRef] [PubMed]
- Andrews, E.; Sheridan, P.J.; Ogren, J.A. Seasonal differences in the vertical profiles of aerosol optical properties over rural Oklahoma. Atmos. Chem. Phys. 2011, 11, 10661–10676. [Google Scholar] [CrossRef]
- Bates, T.S.; Anderson, T.L.; Baynard, T.; Bond, T.; Boucher, O.; Carmichael, G.; Clarke, A.; Erlick, C.; Guo, H.; Horowitz, L.; et al. Aerosol direct radiative effects over the northwest Atlantic, northwest Pacific, and North Indian Oceans: Estimates based on in-situ chemical and optical measurements and chemical transport modeling. Atmos. Chem. Phys. 2006, 6, 1657–1732. [Google Scholar] [CrossRef]
- Bond, T.C.; Doherty, S.J.; Fahey, D.W.; Forster, P.M.; Berntsen, T.; Deangelo, B.J.; Flanner, M.G.; Ghan, S.; Kärcher, B.; Koch, D.; et al. Bounding the role of black carbon in the climate system: A scientific assessment. J. Geophys. Res. Atmos. 2013, 118, 5380–5552. [Google Scholar] [CrossRef]
- Panchenko, M.V.; Pol’kin, V.V.; Pol’kin, V.V.; Kozlov, V.S.; Yausheva, E.P.; Shmargunov, V.P. The size distribution of the “dry matter” of particles in the surface air layer in suburbs of Tomsk within the empirical classification of “aerosol weather” types. Atmos. Ocean Opt. 2019, 32, 655–662. [Google Scholar] [CrossRef]
- Kozlov, V.S.; Panchenko, M.V.; Yausheva, E.P. Mass fraction of Black Carbon in submicron aerosol as an indicator of influence of smokes from remote forest fires in Siberia. Atmos. Environ. 2008, 42, 2611–2620. [Google Scholar] [CrossRef]
- Makarov, V.I.; Koutsenogii, K.P.; Koutsenogii, P.K. Daily and seasonal changes of organic and inorganic carbon content in atmospheric aerosol Novosibirsk region. J. Aerosol. Sci. 1999, 30, 255–256. [Google Scholar] [CrossRef]
- Panchenko, M.V.; Kabanov, M.V.; Pkhalagov, Y.A.; Belan, B.D.; Kozlov, V.S.; Sakerin, S.M.; Kabanov, D.M.; Uzhegov, V.N.; Shchelkanov, N.N.; Pol’kin, V.V.; et al. Integrated Studies of Tropospheric Aerosol at the Institute of Atmospheric Optics (Development Stages). Atmos. Ocean Opt. 2020, 33, 27–41. [Google Scholar] [CrossRef]
- Antokhin, P.N.; Arshinov, M.Y.; Belan, B.D.; Davydov, D.K.; Zhidovkin, E.V.; Ivlev, G.A.; Kozlov, A.V.; Kozlov, V.S.; Panchenko, M.V.; Penner, I.E.; et al. Optik-E AN-30 aircraft laboratory for studies of the atmospheric composition. J. Atmos. Ocean. Technol. 2012, 29, 64–75. [Google Scholar] [CrossRef]
- Zhuravleva, T.B.; Panchenko, M.V.; Kozlov, V.S.; Nasrtdinov, I.M.; Pol’kin, V.V.; Terpugova, S.A.; Chernov, D.G. Model Estimates of Dynamics of the Vertical Structure of Solar Absorption and Temperature Effects under Background Conditions and in Extremely Smoke-Laden Atmosphere According to Data of Aircraft Observations. Atmos. Ocean Opt. 2020, 31, 25–30. [Google Scholar] [CrossRef]
- Sitnov, S.A.; Mokhov, I.I.; Gorchakov, G.I. The Link between Smoke Blanketing of European Russia in Summer 2016, Siberian Wildfires and Anomalies of Large-Scale Atmospheric Circulation. Doklady Earth Sci. 2017, 472, 190–195. [Google Scholar] [CrossRef]
- Pruppacher, H.R.; Klett, J.D. Microphysics of Clouds and Precipitation; ch.9; Reidel: Dordrecht, The Netherlands, 1978. [Google Scholar]
- Moehler, O.; Linke, C.; Saathoff, H.; Schnaiter, M.; Wagner, R.; Schurath, U. Ice nucleation on flame soot aerosol of different organic carbon content. Meteorol. Z. 2005, 14, 477–484. [Google Scholar] [CrossRef]
- Semoutnikova, E.G.; Gorchakov, G.I.; Sitnov, S.A.; Kopeikin, V.M.; Karpov, A.V.; Gorchakova, I.A.; Ponomareva, T.Y.; Isakov, A.A.; Gushchin, R.A.; Datsenko, O.I.; et al. Siberian Smoke Haze over European Territory of Russia in July 2016: Atmospheric Pollution and Radiative Effects. Atmos. Ocean Opt. 2018, 31, 171–180. [Google Scholar] [CrossRef]
- Konovalov, I.B.; Lvova, D.А.; Beekmann, M.; Jethva, H.; Mikhailov, E.F.; Paris, J.-D.; Belan, B.D.; Kozlov, V.S.; Ciais, P.; Andreae, M.O. Estimation of black carbon emissions from Siberian fires using satellite observations of absorption and extinction optical depths. Atmos. Chem. Phys. 2018, 18, 14889–14924. [Google Scholar] [CrossRef]
- Vinogradova, A.A.; Titkova, T.B. Atmospheric Black Carbon and Surface Albedo in the Russian Arctic during Spring. Atmos. Ocean. Opt. 2020, 33, 260–266. [Google Scholar] [CrossRef]
- Vinogradova, A.A.; Ponomareva, T.Y. Atmospheric Transport of Anthropogenic Impurities to the Russian Arctic (1986–2010). Atmos. Ocean Opt. 2012, 25, 414–422. [Google Scholar] [CrossRef]
- Vinogradova, A.A.; Maksimenkov, L.O.; Pogarskii, F.A. Changes in the Atmospheric Circulation and Environmental Pollution in Siberia from the Industrial Regions of Norilsk and the Urals in the Early 21st Century. Atmos. Ocean Opt. 2009, 22, 396–404. [Google Scholar] [CrossRef]
- Sakerin, S.M.; Zenkova, P.N.; Kabanov, D.M.; Kalashnikova, D.A.; Lisitzin, A.P.; Makarov, V.I.; Polkin, V.V.; Popova, S.A.; Simonova, G.V.; Chankina, O.V.; et al. Results of Studying Physicochemical Characteristics of Atmospheric Aerosol in the 71st Cruise of RV Akademik Mstislav Keldysh. Atmos. Ocean Opt. 2020, 33, 470–479. [Google Scholar] [CrossRef]
- Available online: http://fires.ru (accessed on 21 October 2020).
- Kabanov, D.M.; Sakerin, S.M.; Turchinovich, Y.S. Interannual and Seasonal Variations in the Atmospheric Aerosol Optical Depth in the Region of Tomsk (1995–2018). Atmos. Ocean Opt. 2019, 32, 663–670. [Google Scholar] [CrossRef]
- Sakerin, S.M.; Kabanov, D.M.; Rostov, A.P.; Turchinovich, S.A.; Knyazev, V.V. Sun Photometers for Measuring Spectral Air Transparency in Stationary and Mobile Conditions. Atmos. Ocean Opt. 2013, 04, 352–356. [Google Scholar] [CrossRef]
- Smolyakov, B.S.; Makarov, V.I.; Shinkorenko, M.P.; Popova, S.A.; Bizin, M.A. Effects of Siberian wildfires on the chemical composition and acidity of atmospheric aerosols of remote urban, rural and background territories. Environ. Pollut. 2014, 188, 8–16. [Google Scholar] [CrossRef]
- Panchenko, M.V.; Terpugova, S.A.; Pol’kin, V.V.; Kozlov, V.S.; Chernov, D.G. Modeling of Aerosol Radiation-Relevant Parameters in the Troposphere of Siberia on the Basis of Empirical Data. Atmosphere 2018, 9, 414. [Google Scholar] [CrossRef]
- Paffrath, D.; Peters, W. Aircraft measurements of various pollution components and meteorological parameters. VI Congr. Mondqualite Air. Paris. 1983, 133–136. [Google Scholar]
- Vinogradova, A.A. Anthropogenic pollutants in the Russian Arctic atmosphere: Sources and sinks in spring and summer. Atmos. Environ. 2000, 34, 5151–5160. [Google Scholar] [CrossRef]
- Huang, K.; Fu, J.S.; Prikhodko, V.Y.; Storey, J.M.; Romanov, A.; Hodson, E.L.; Cresko, J.; Morozova, I.; Ignatieva, Y.; Cabaniss, J. Russian anthropogenic black car-bon: Emission reconstruction and Arctic black carbon simulation. J. Geophys. Res. Atmos. 2015, 120, 11306–11333. [Google Scholar] [CrossRef]
- Hirdman, D.; Sodemann, H.; Eckhardt, S.; Burkhart, J.F.; Jefferson, A.; Mefford, T.; Quinn, P.K.; Sharma, S.; Strom, J.; Stohl, A. Source identification of short-lived air pollutants in the Arctic using statistical analysis of measurement data and particle dispersion model output. Atmos. Chem. Phys. 2010, 10, 669–693. [Google Scholar] [CrossRef]
- Paris, J.-D.; Ciais, P.; Nédélec, P.; Stohl, A.; Belan, B.D.; Arshinov, M.Y.; Carouge, C.; Golitsyn, G.; Granberg, I.G. New insights on the chemical composition of the Siberian air shed from the YAK-AEROSIB aircraft campaigns. Bull. Amer. Meteorol. Soc. 2010, 91, 625–642. [Google Scholar] [CrossRef]
- Baldwin, M.P.; Gray, L.J.; Dunkerton, T.J.; Hamilton, K.; Haynes, P.H.; Randel, W.J.; Holton, J.R.; Alexander, M.J.; Hirota, I.; Horinouchi, T.; et al. The Quasi Biennial Oscillation. Rev. Geophys. 2001, 39, 179–229. [Google Scholar] [CrossRef]
- Haynes, P.H. The latitudinal structure of the quasi-biennial oscillation. Quart. J. R. Meteorol. Soc. 1998, 124, 2645–2670. [Google Scholar] [CrossRef]
- Davydov, D.K.; Belan, B.D.; Antokhin, P.N.; Antokhina, O.Y.; Antonovich, V.V.; Arshinova, V.G.; Arshinov, M.Y.; Akhlestin, A.Y.; Belan, S.B.; Dudorova, N.V.; et al. Monitoring of Atmospheric Parameters: 25 Years of the Tropospheric Ozone Research Station of the Institute of Atmospheric Optics, Siberian Branch, Russian Academy of Sciences. Atmos. Ocean. Opt. 2019, 32, 180–192. [Google Scholar] [CrossRef]
Publisher’s Note: MDPI stays neutral with regard to jurisdictional claims in published maps and institutional affiliations. |
© 2021 by the authors. Licensee MDPI, Basel, Switzerland. This article is an open access article distributed under the terms and conditions of the Creative Commons Attribution (CC BY) license (http://creativecommons.org/licenses/by/4.0/).