
Spatial–Temporal Distribution of Tropospheric Specific Humidity in the Arid Region of Northwest China

Abstract
1. Introduction
2. Data and Methods
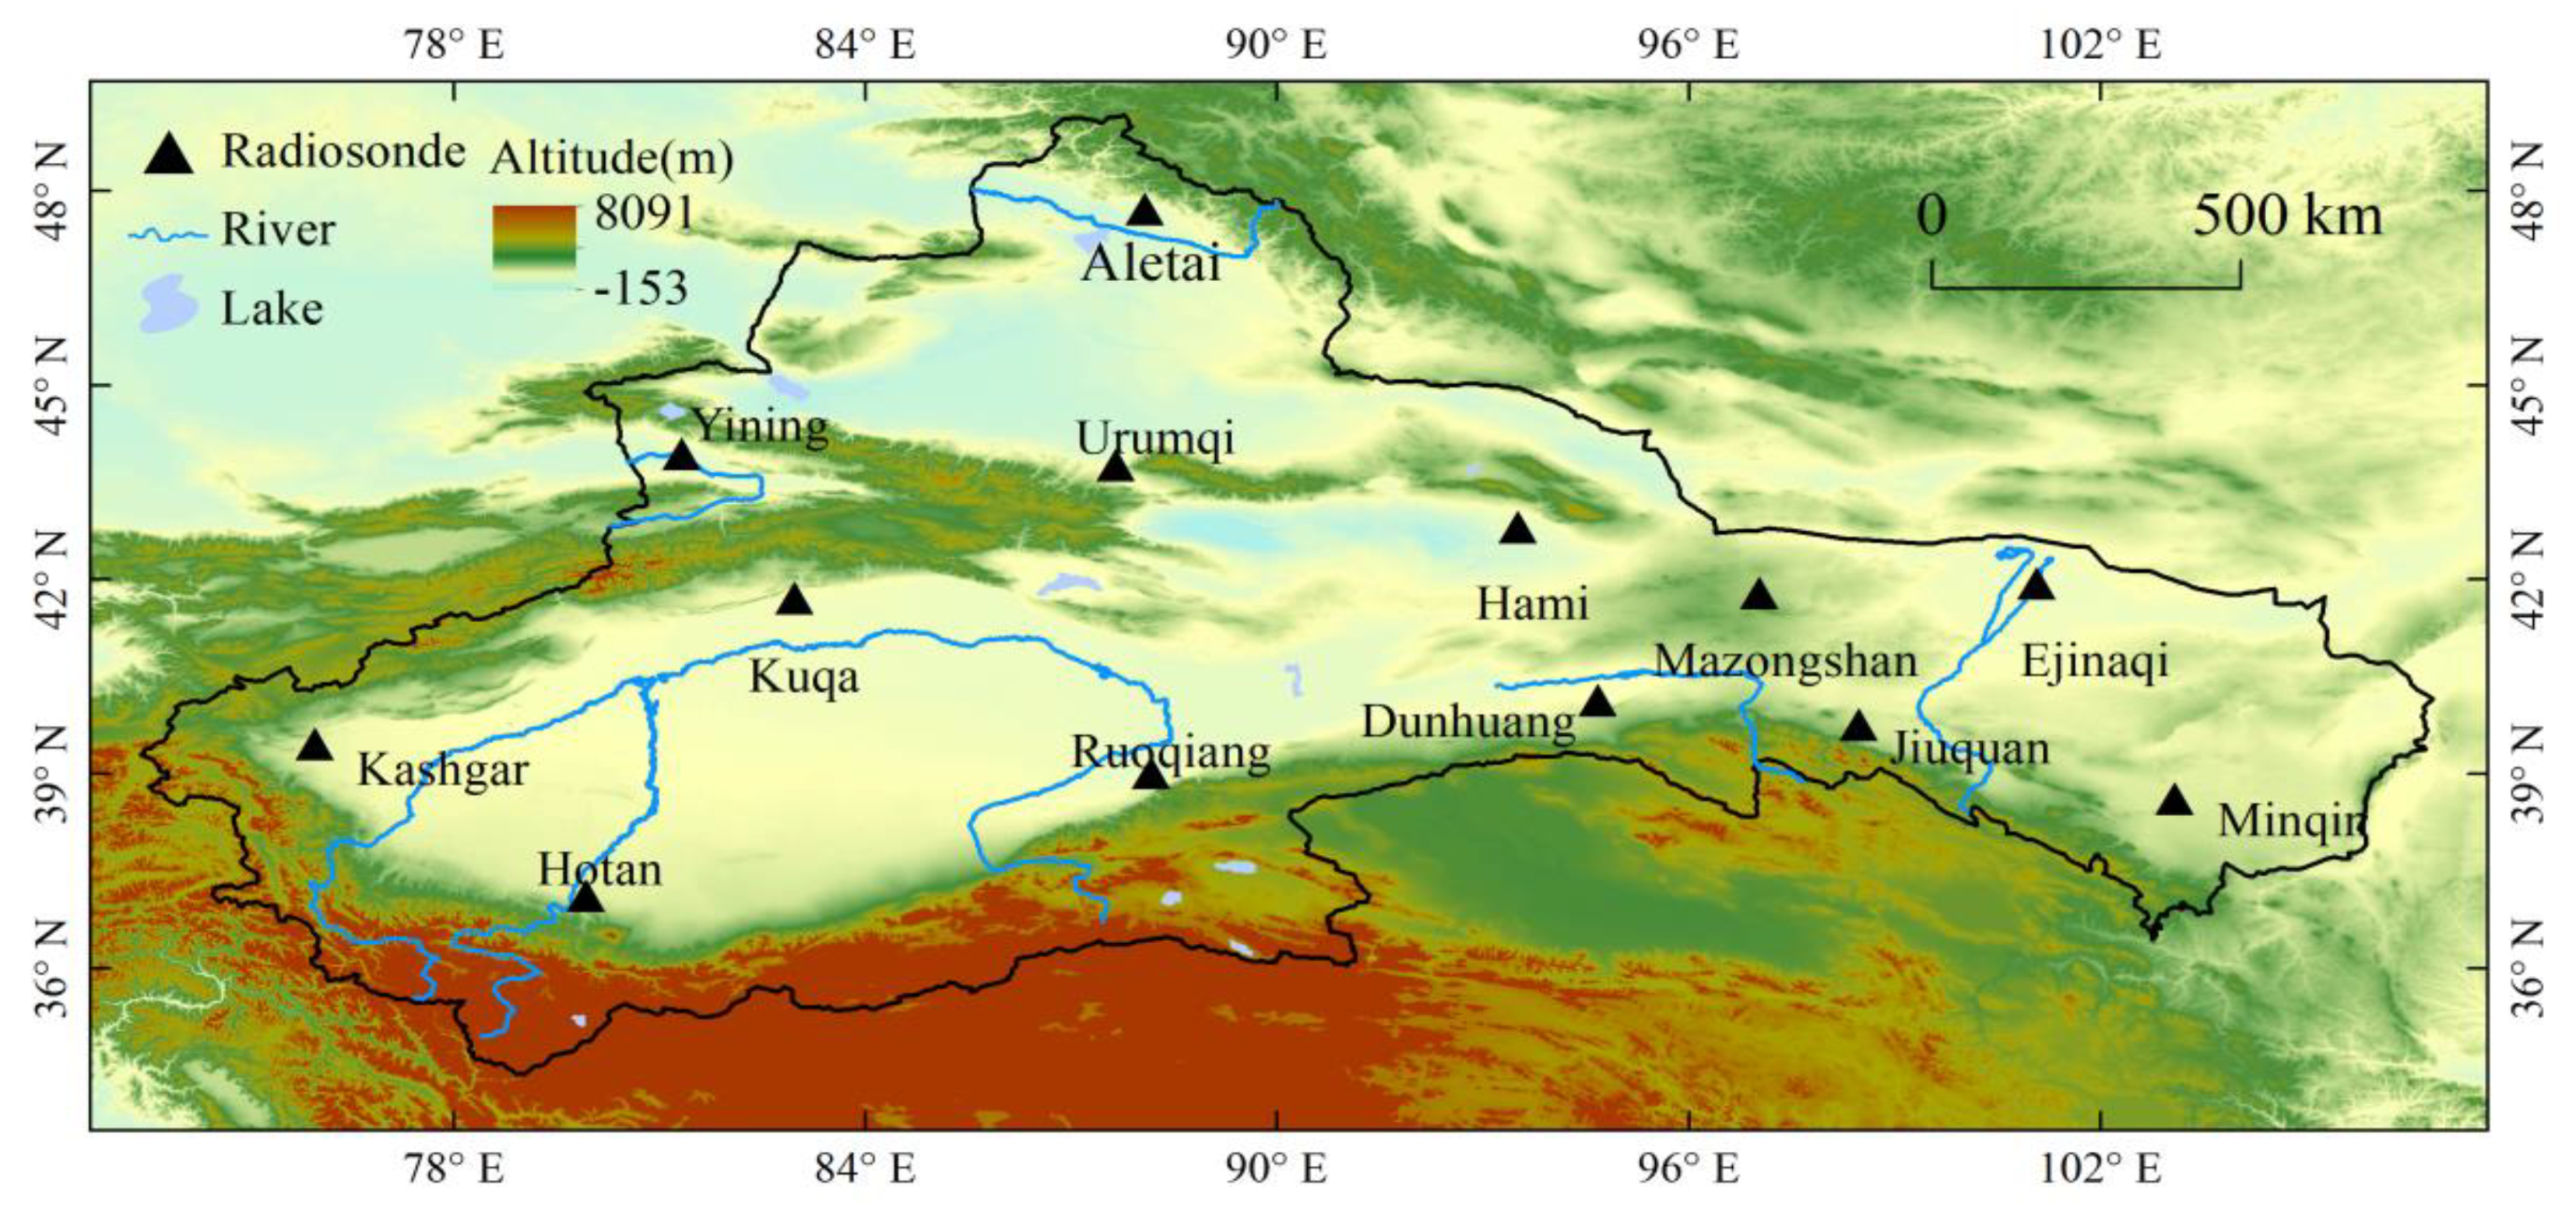
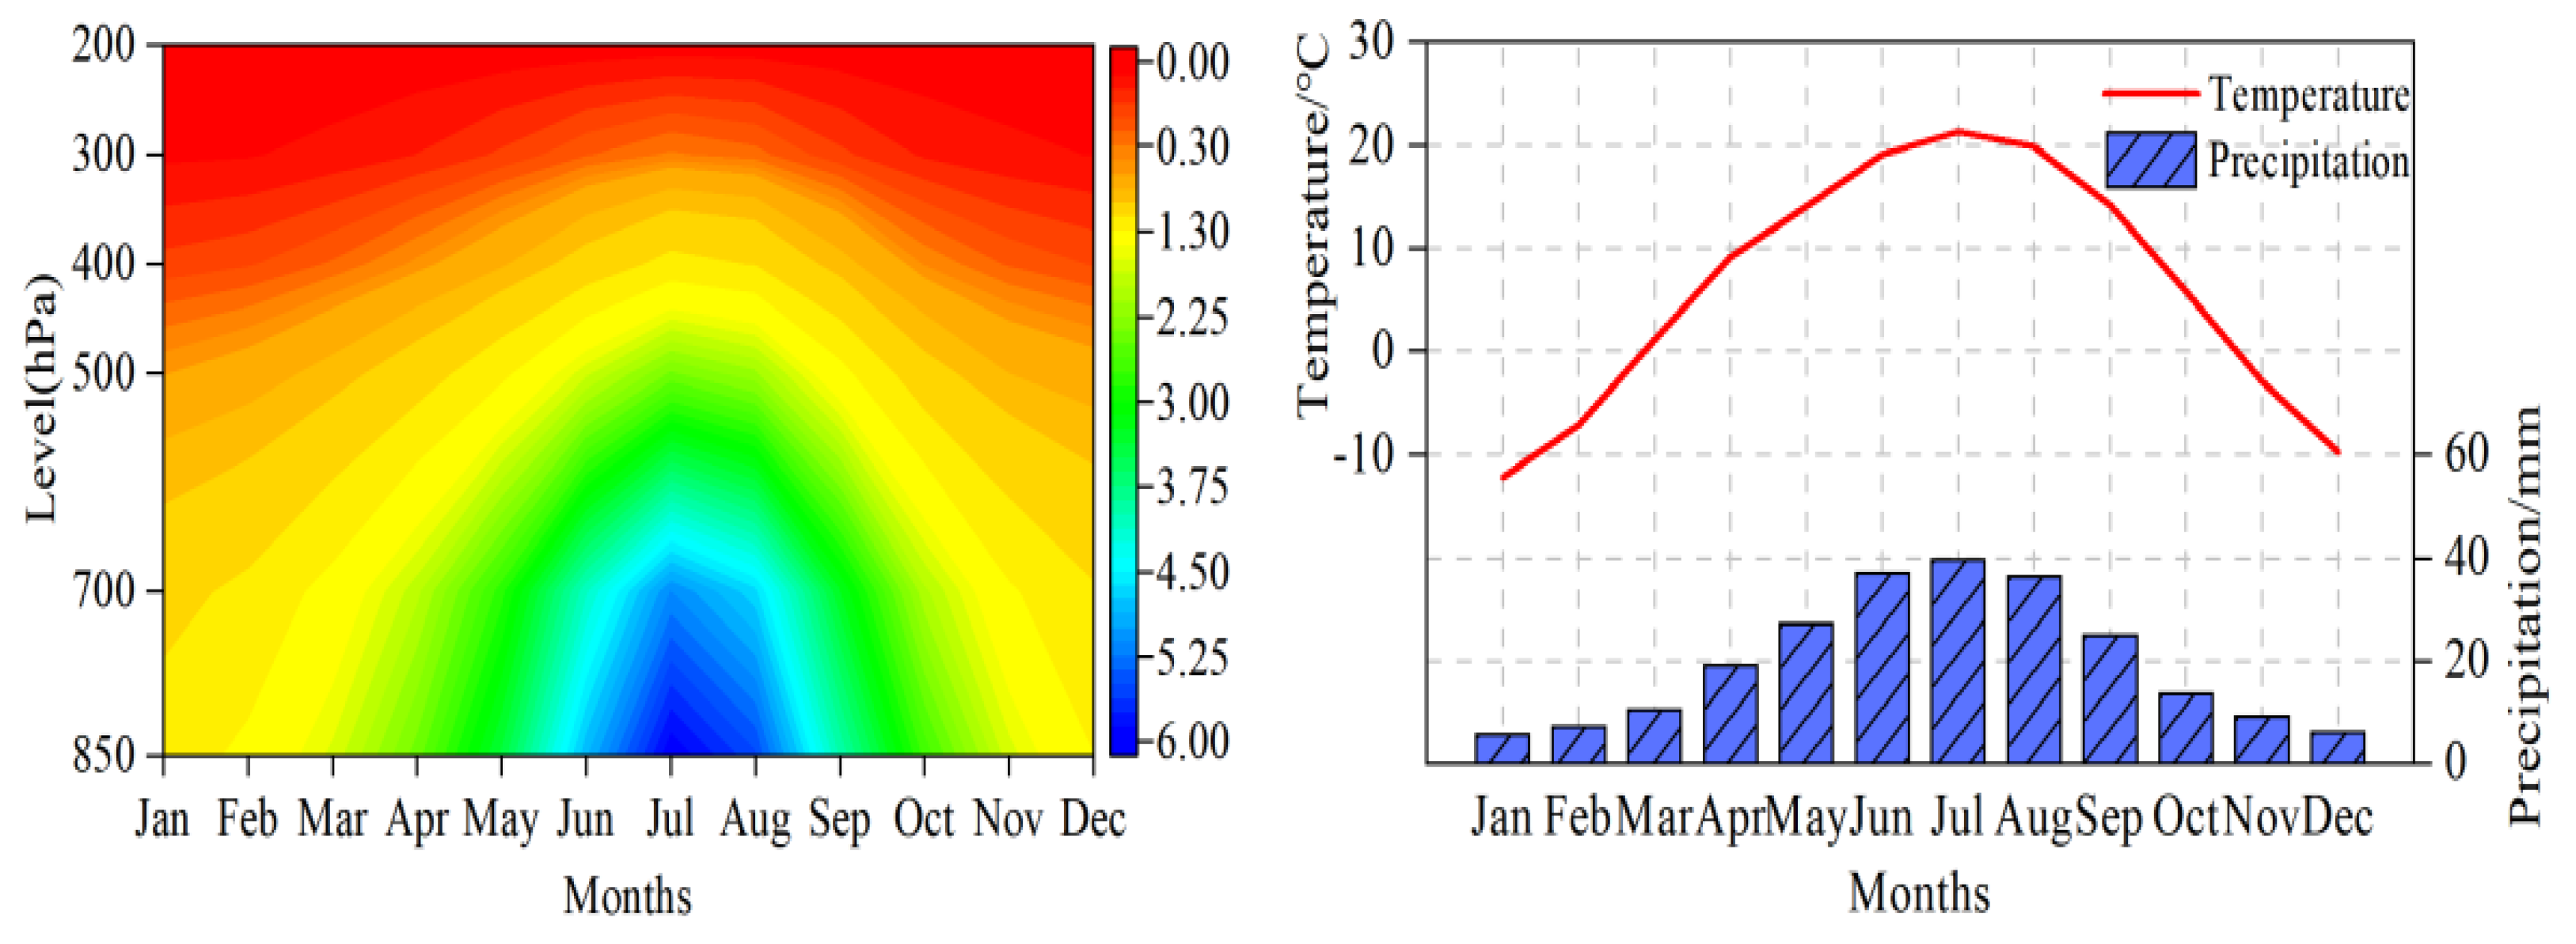
2.1. Study Area
2.2. Data
2.3. Methods
2.3.1. Calculation of Specific Humidity
2.3.2. Evaluation of Specific Humidity
2.3.3. Method of Trend Analysis
3. Results
3.1. Assessment of Reanalysis Data
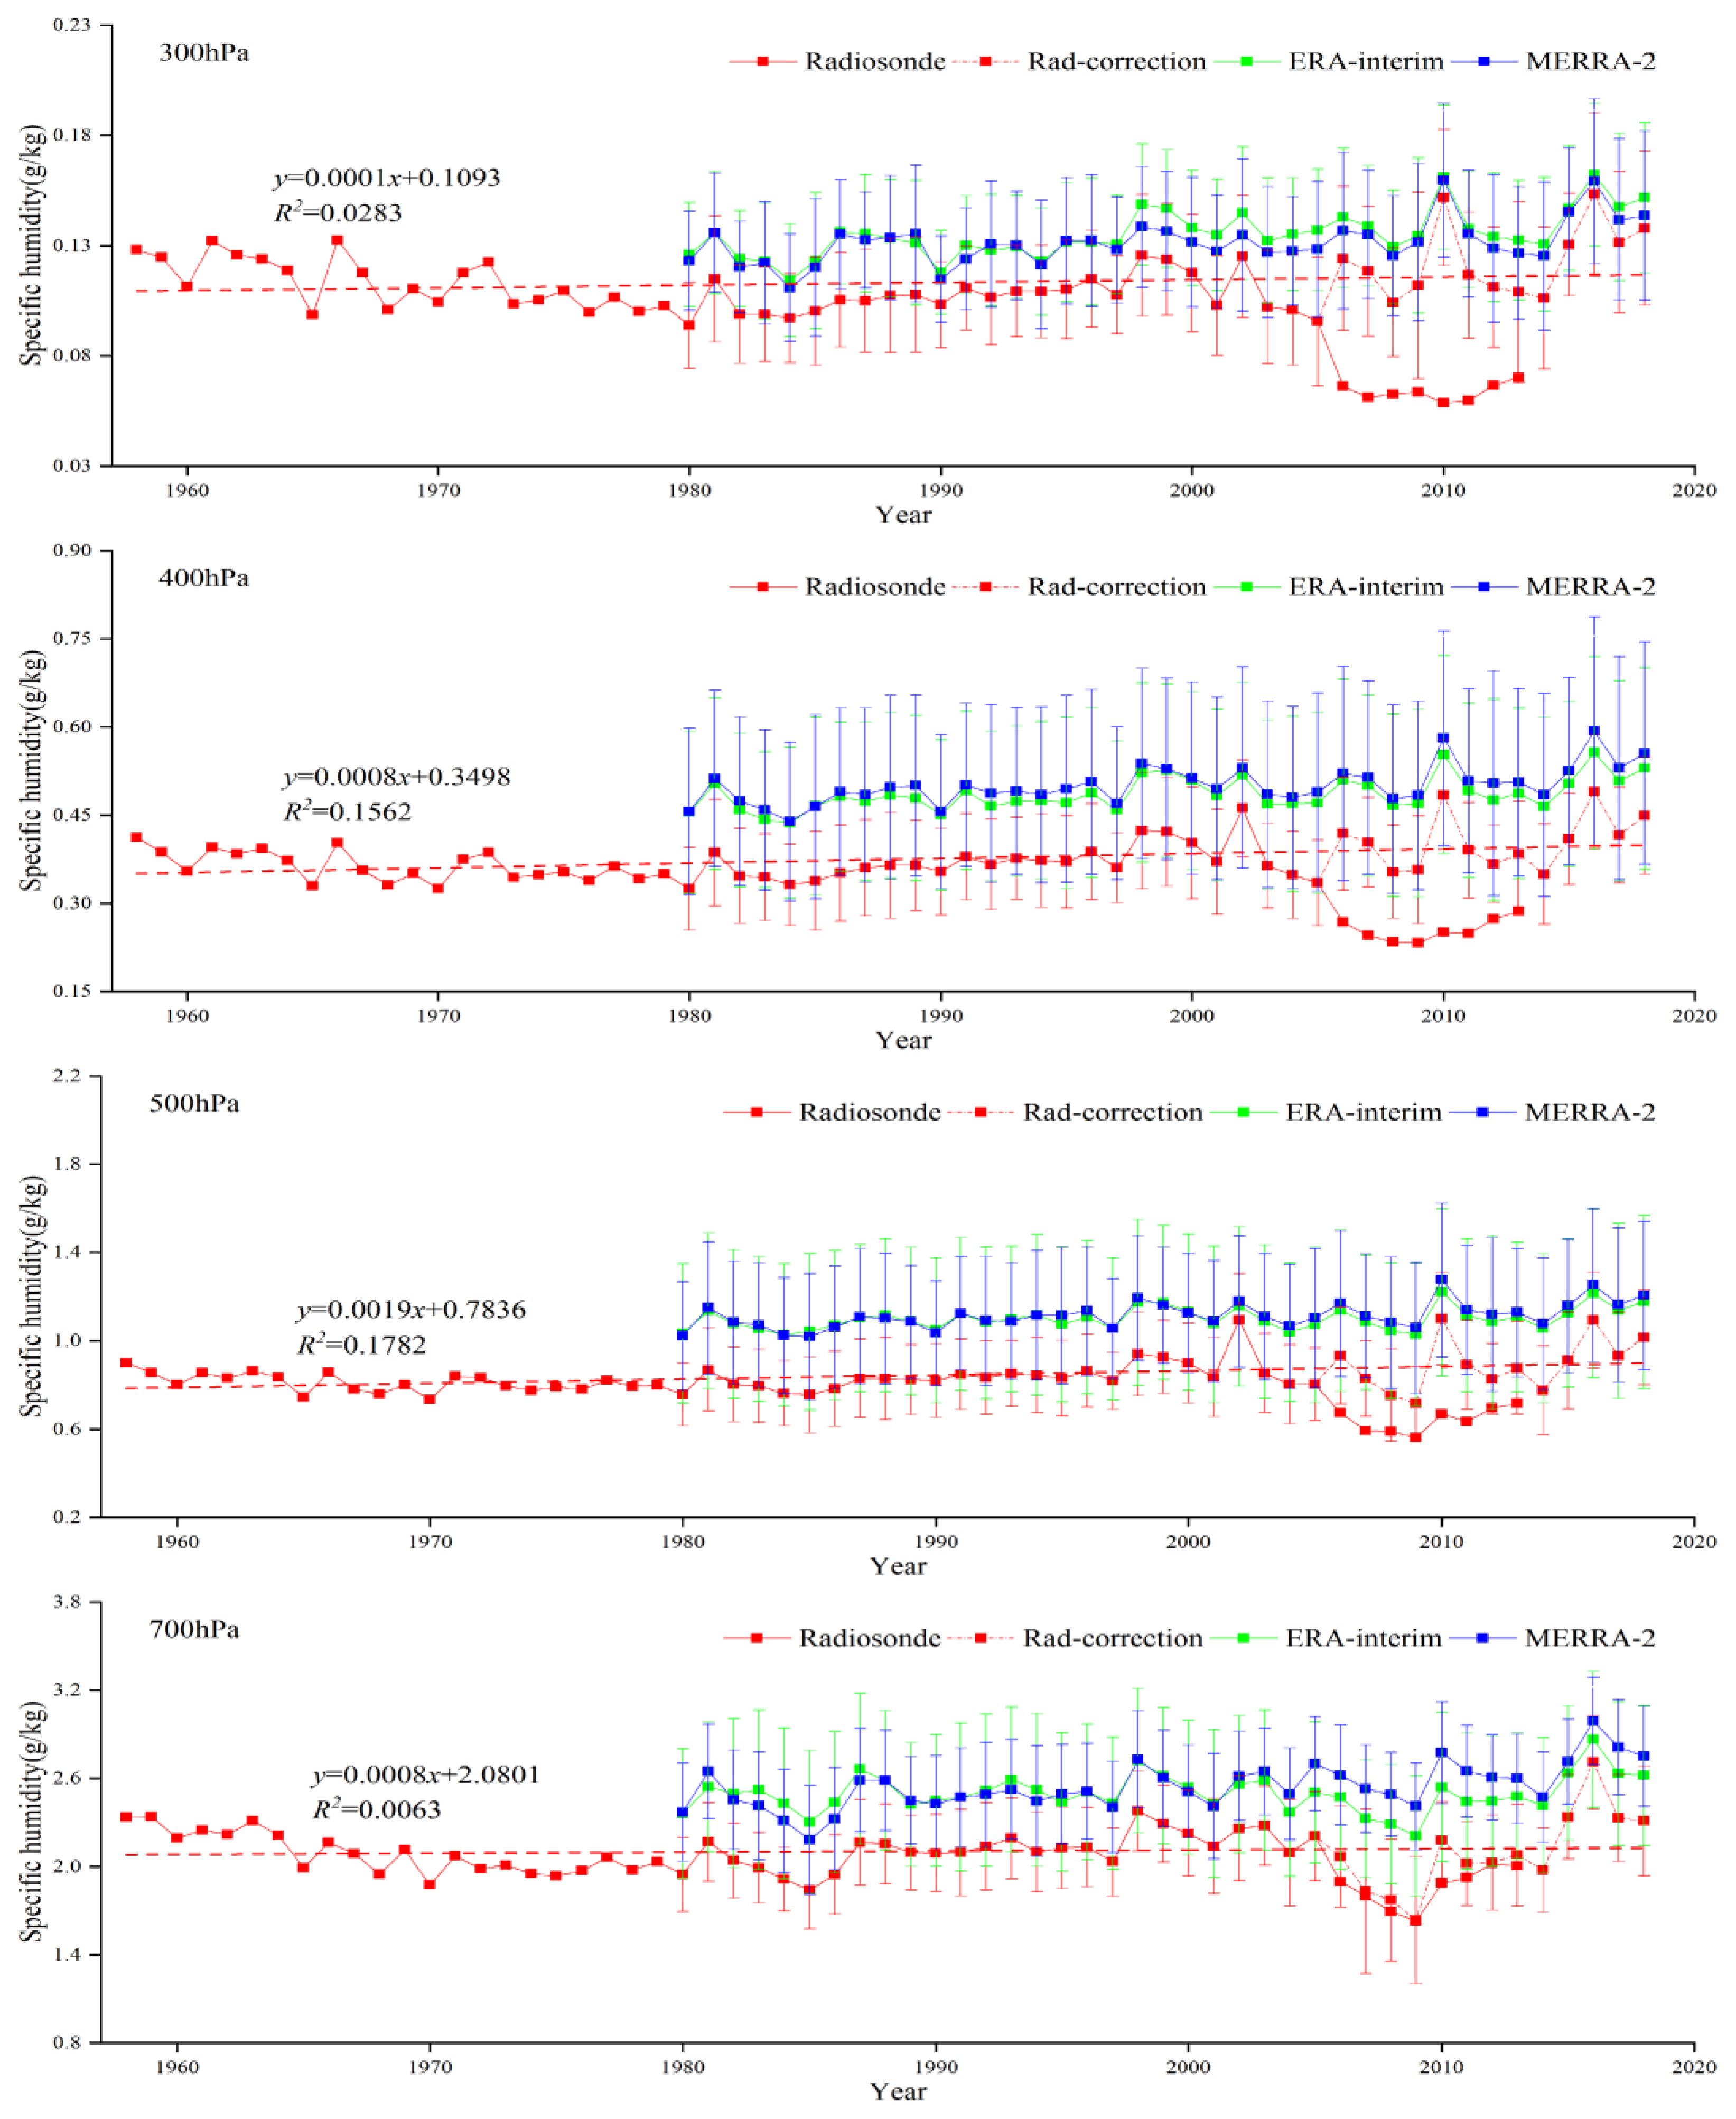
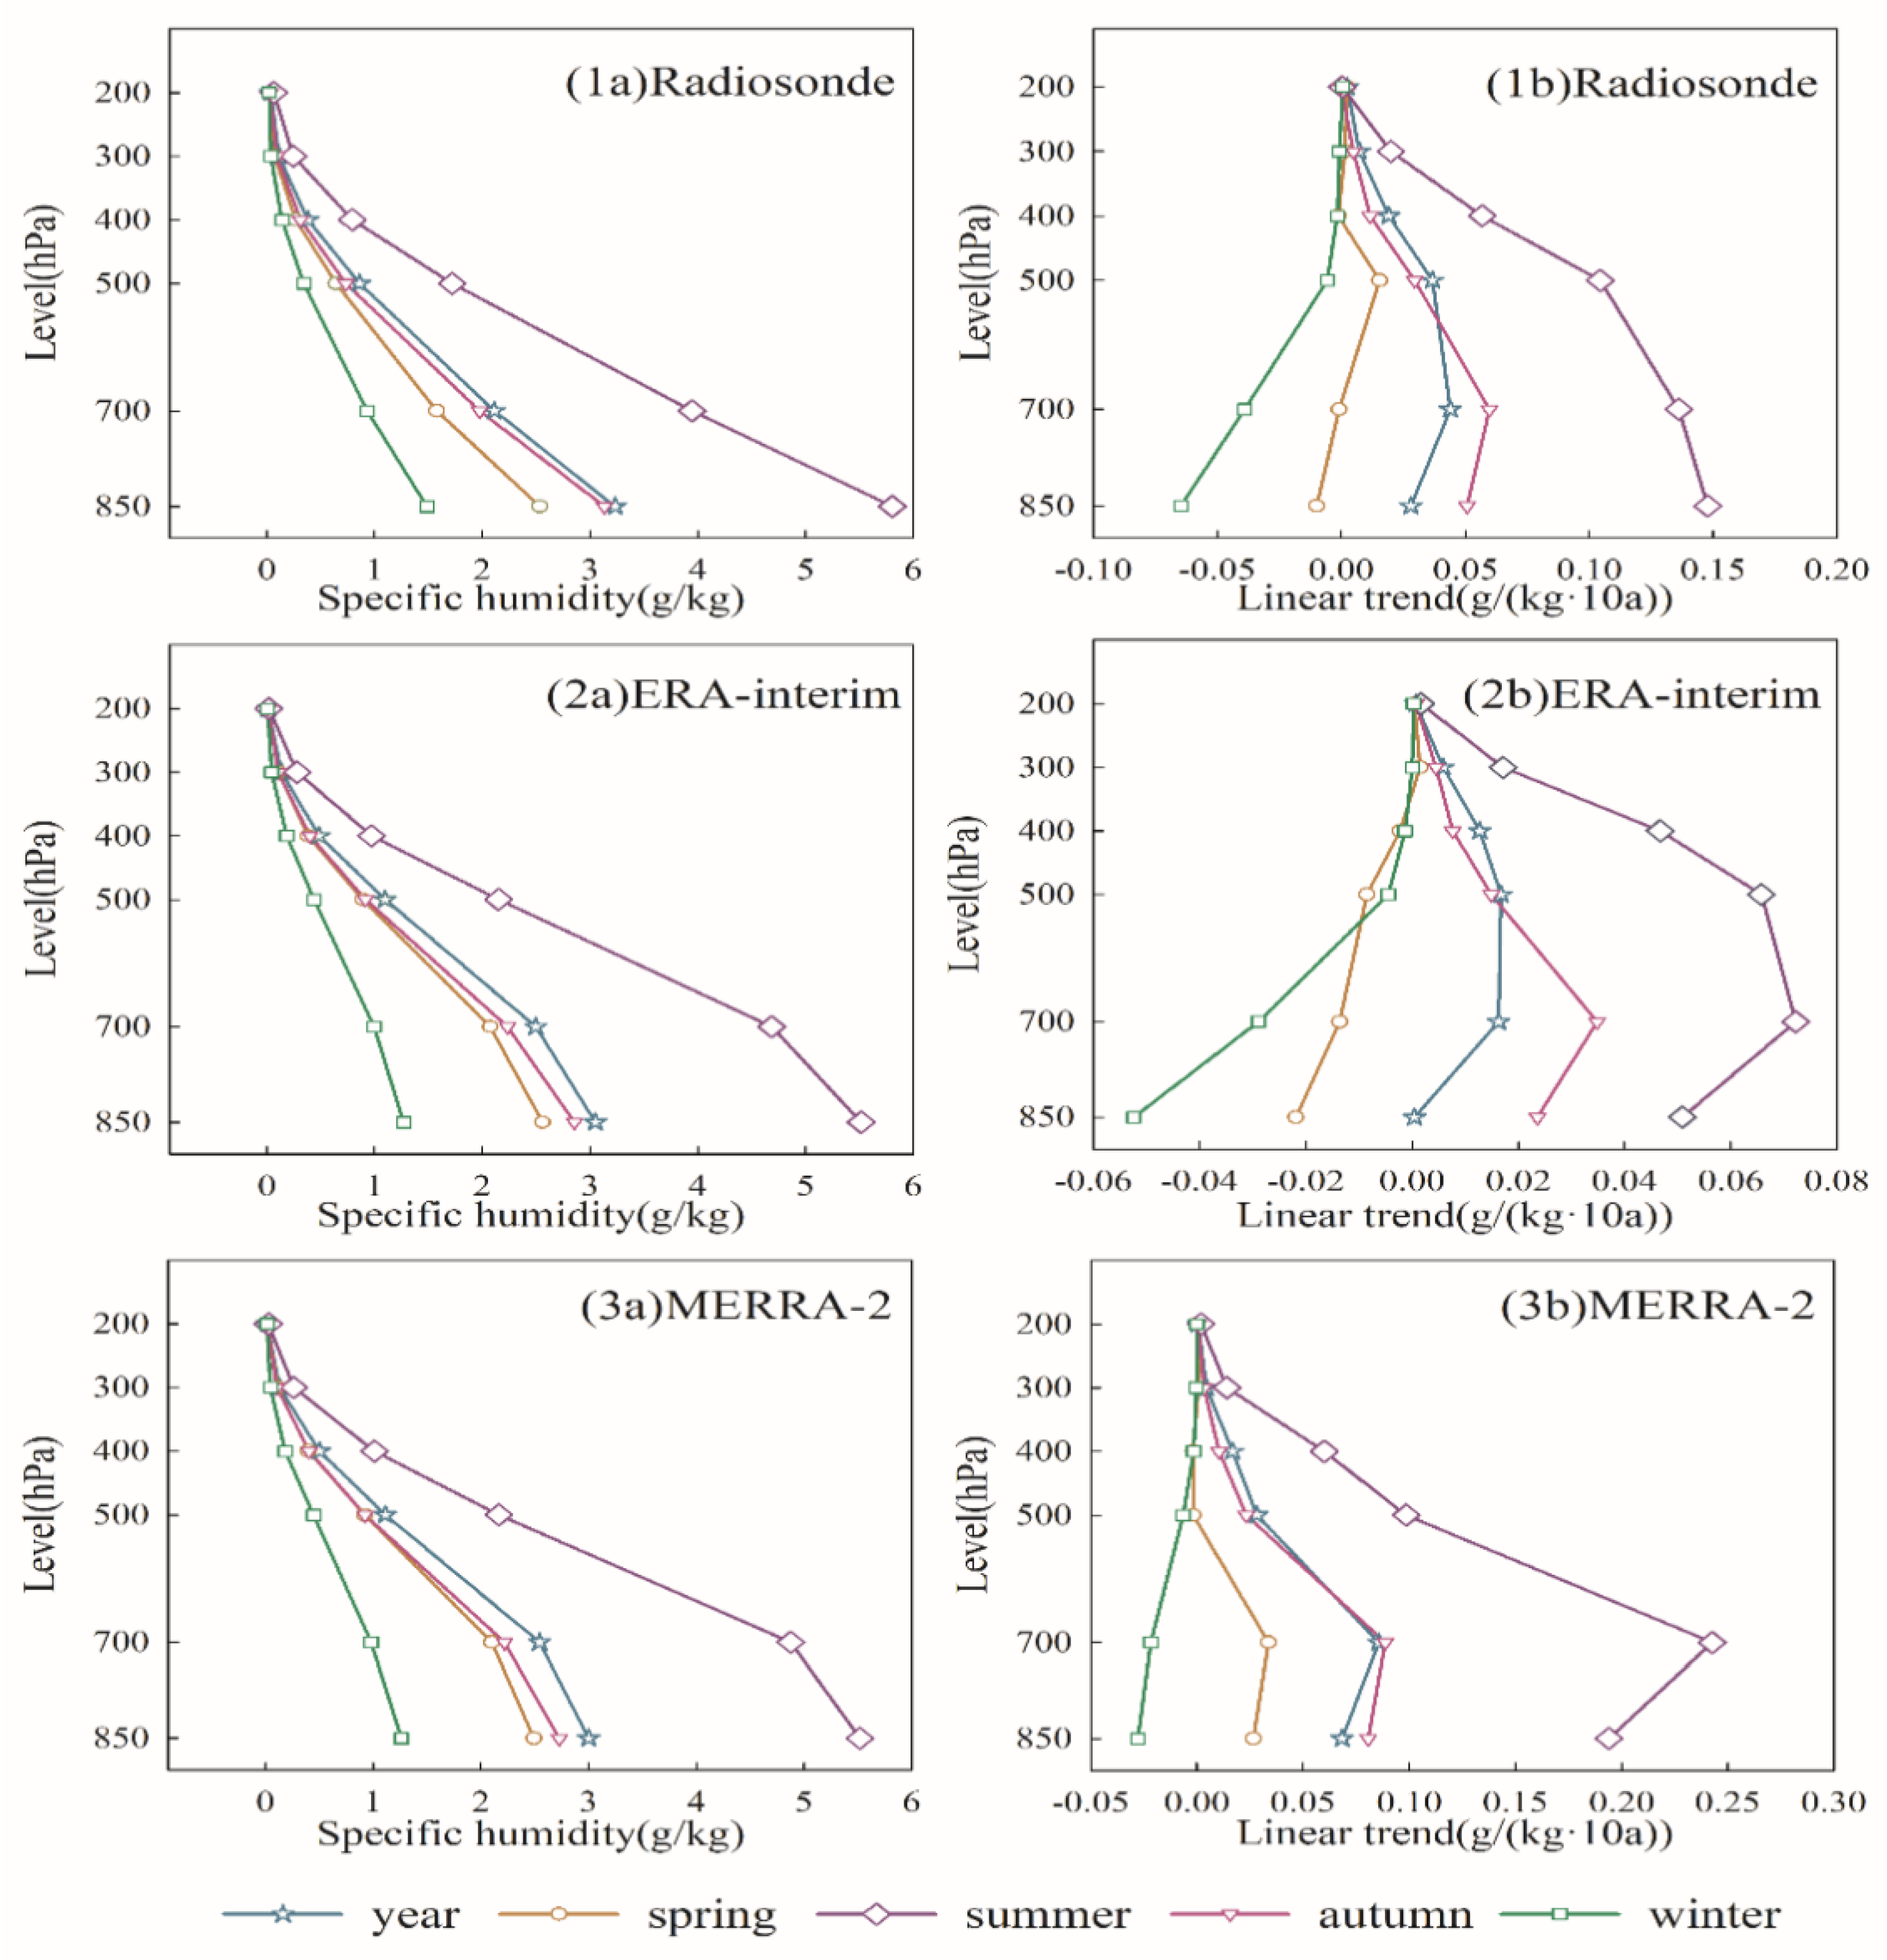
3.2. Temporal Variation and Linear Trend of Tropospheric Specific Humidity
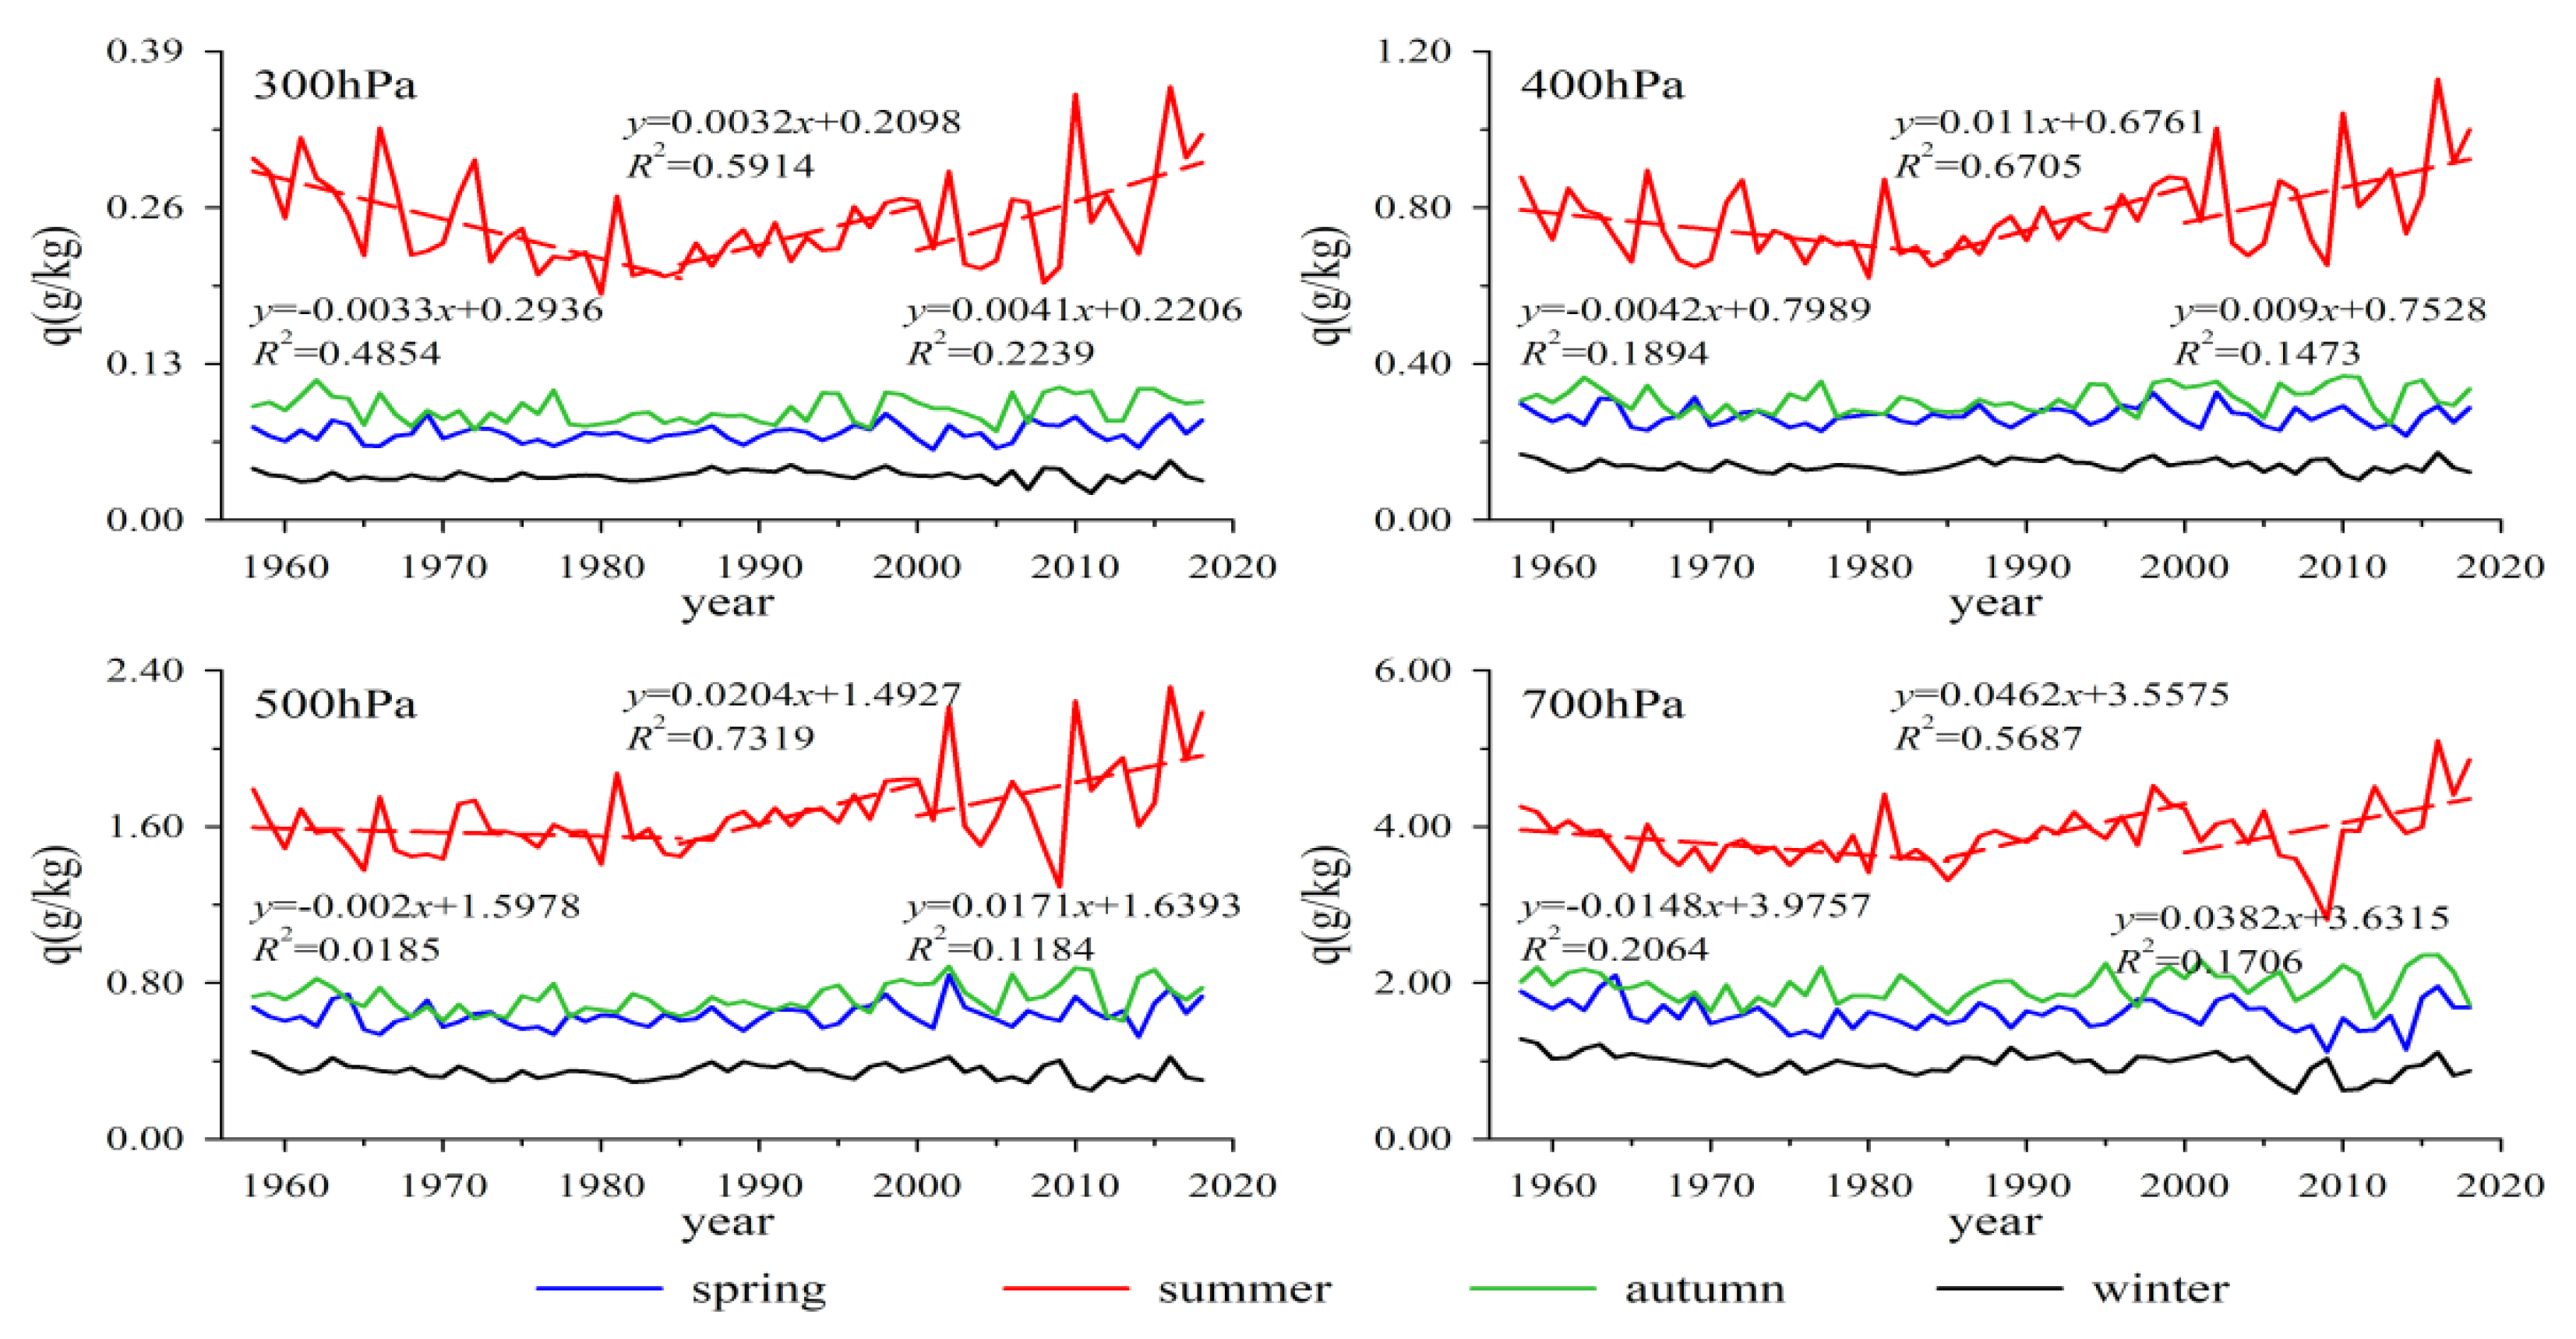
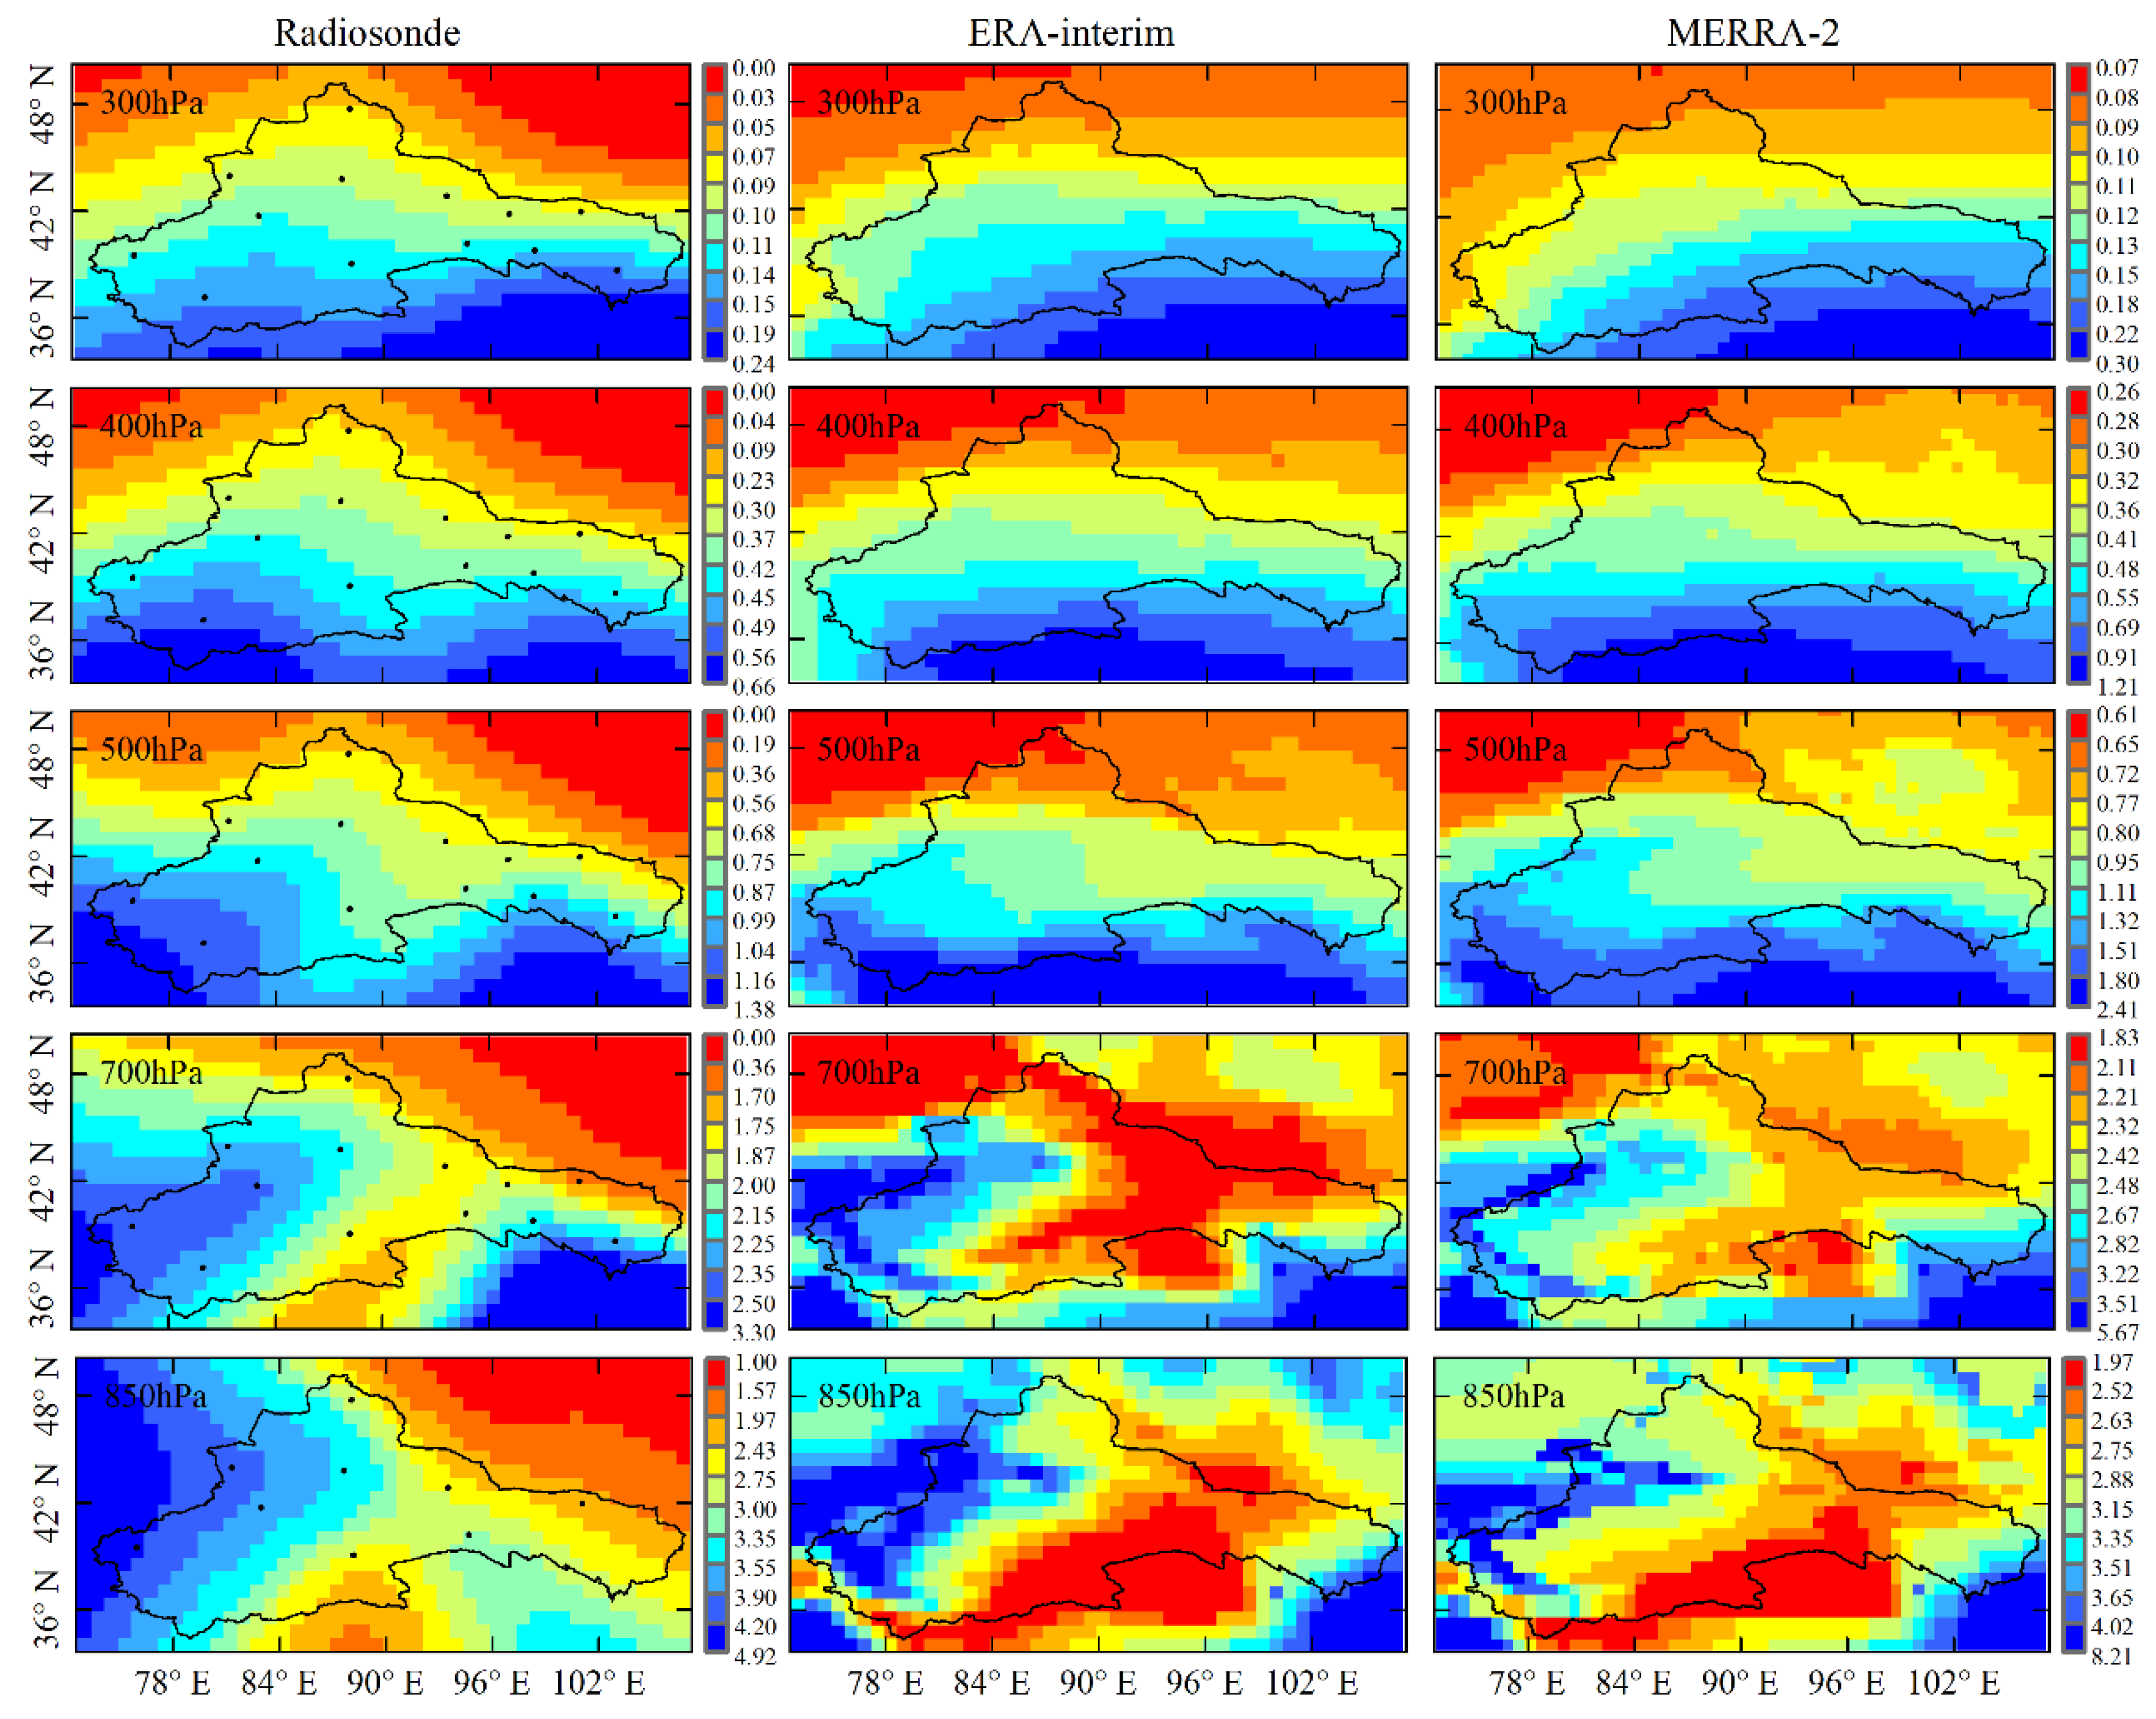
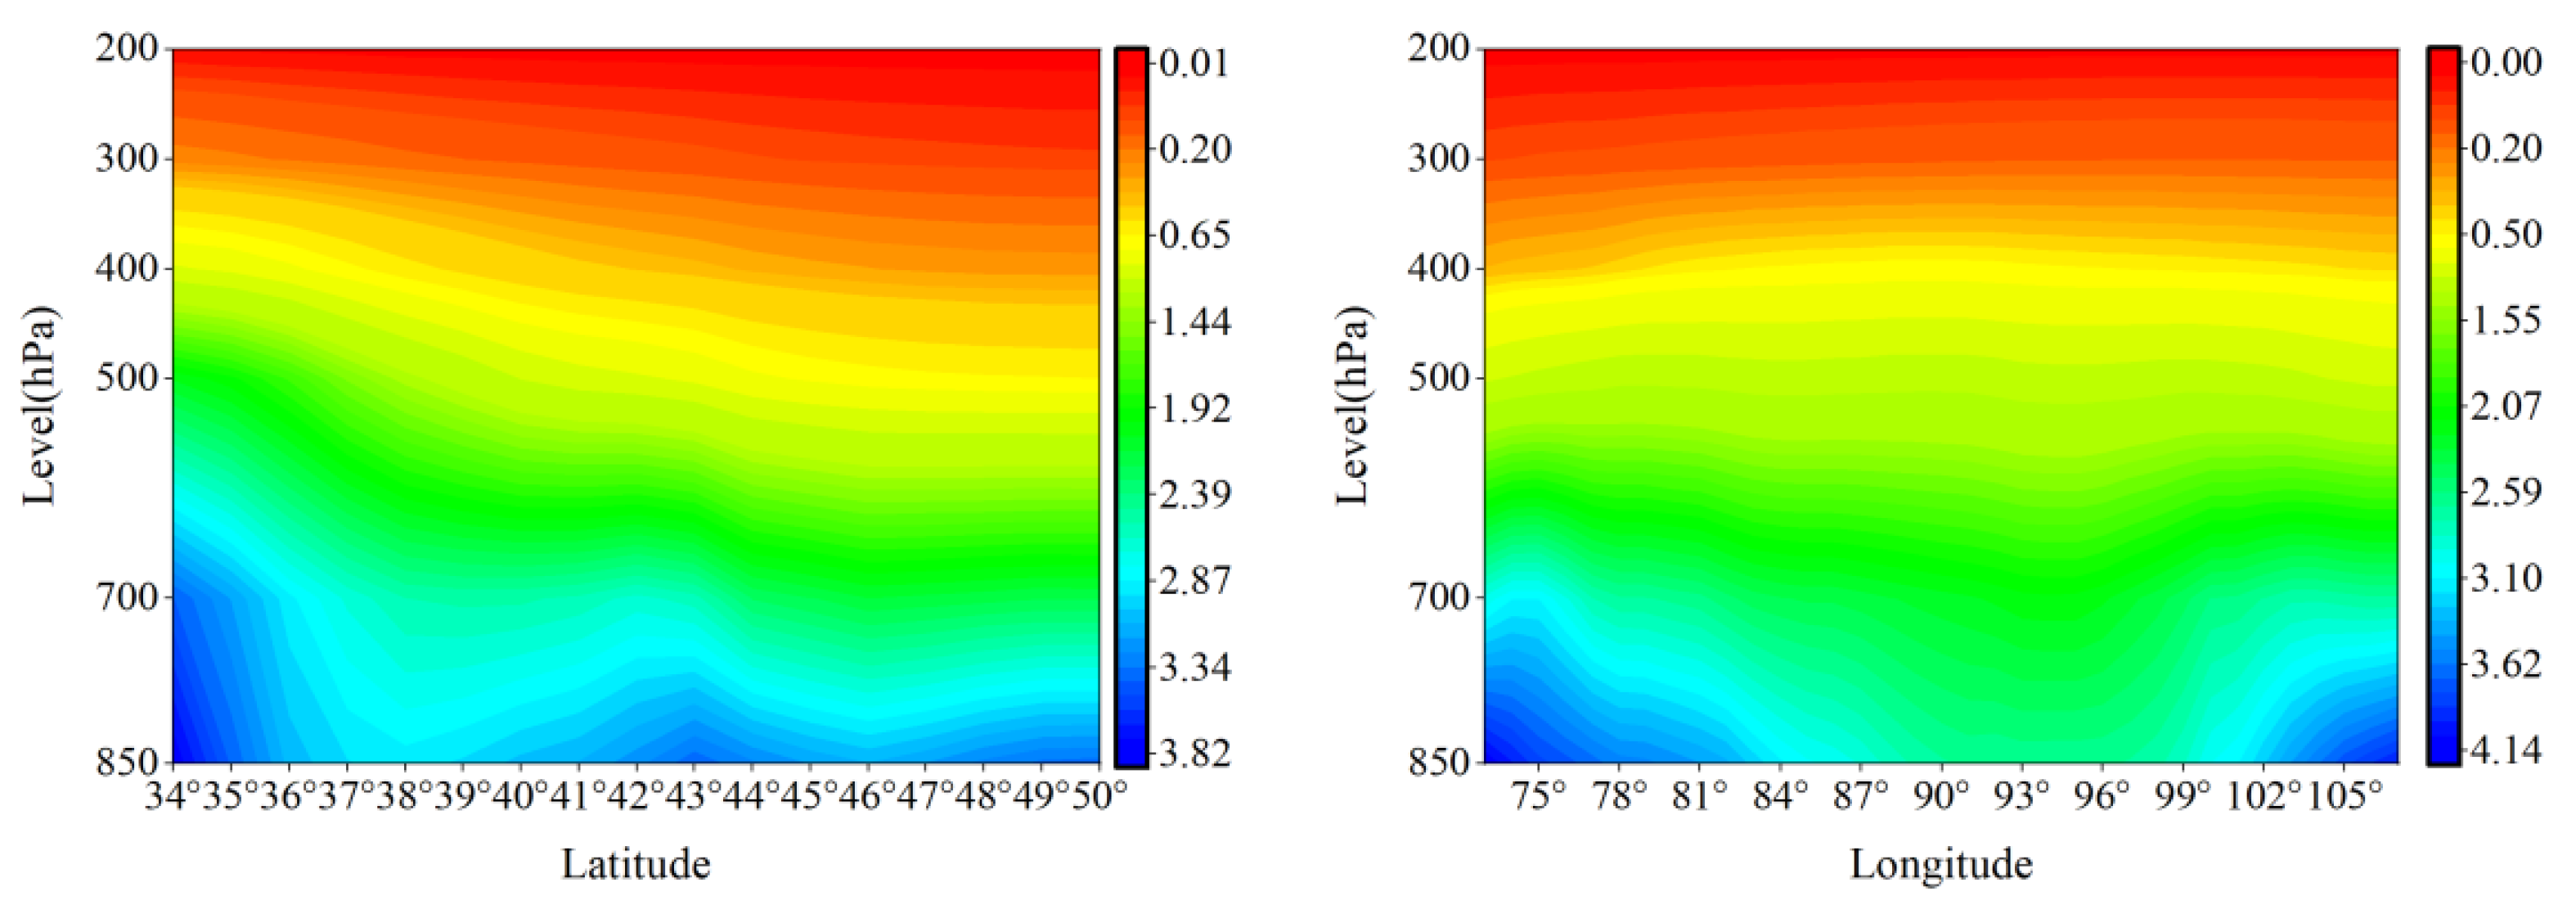
3.3. Multi-Year Mean Tropospheric Specific Humidity and Trends
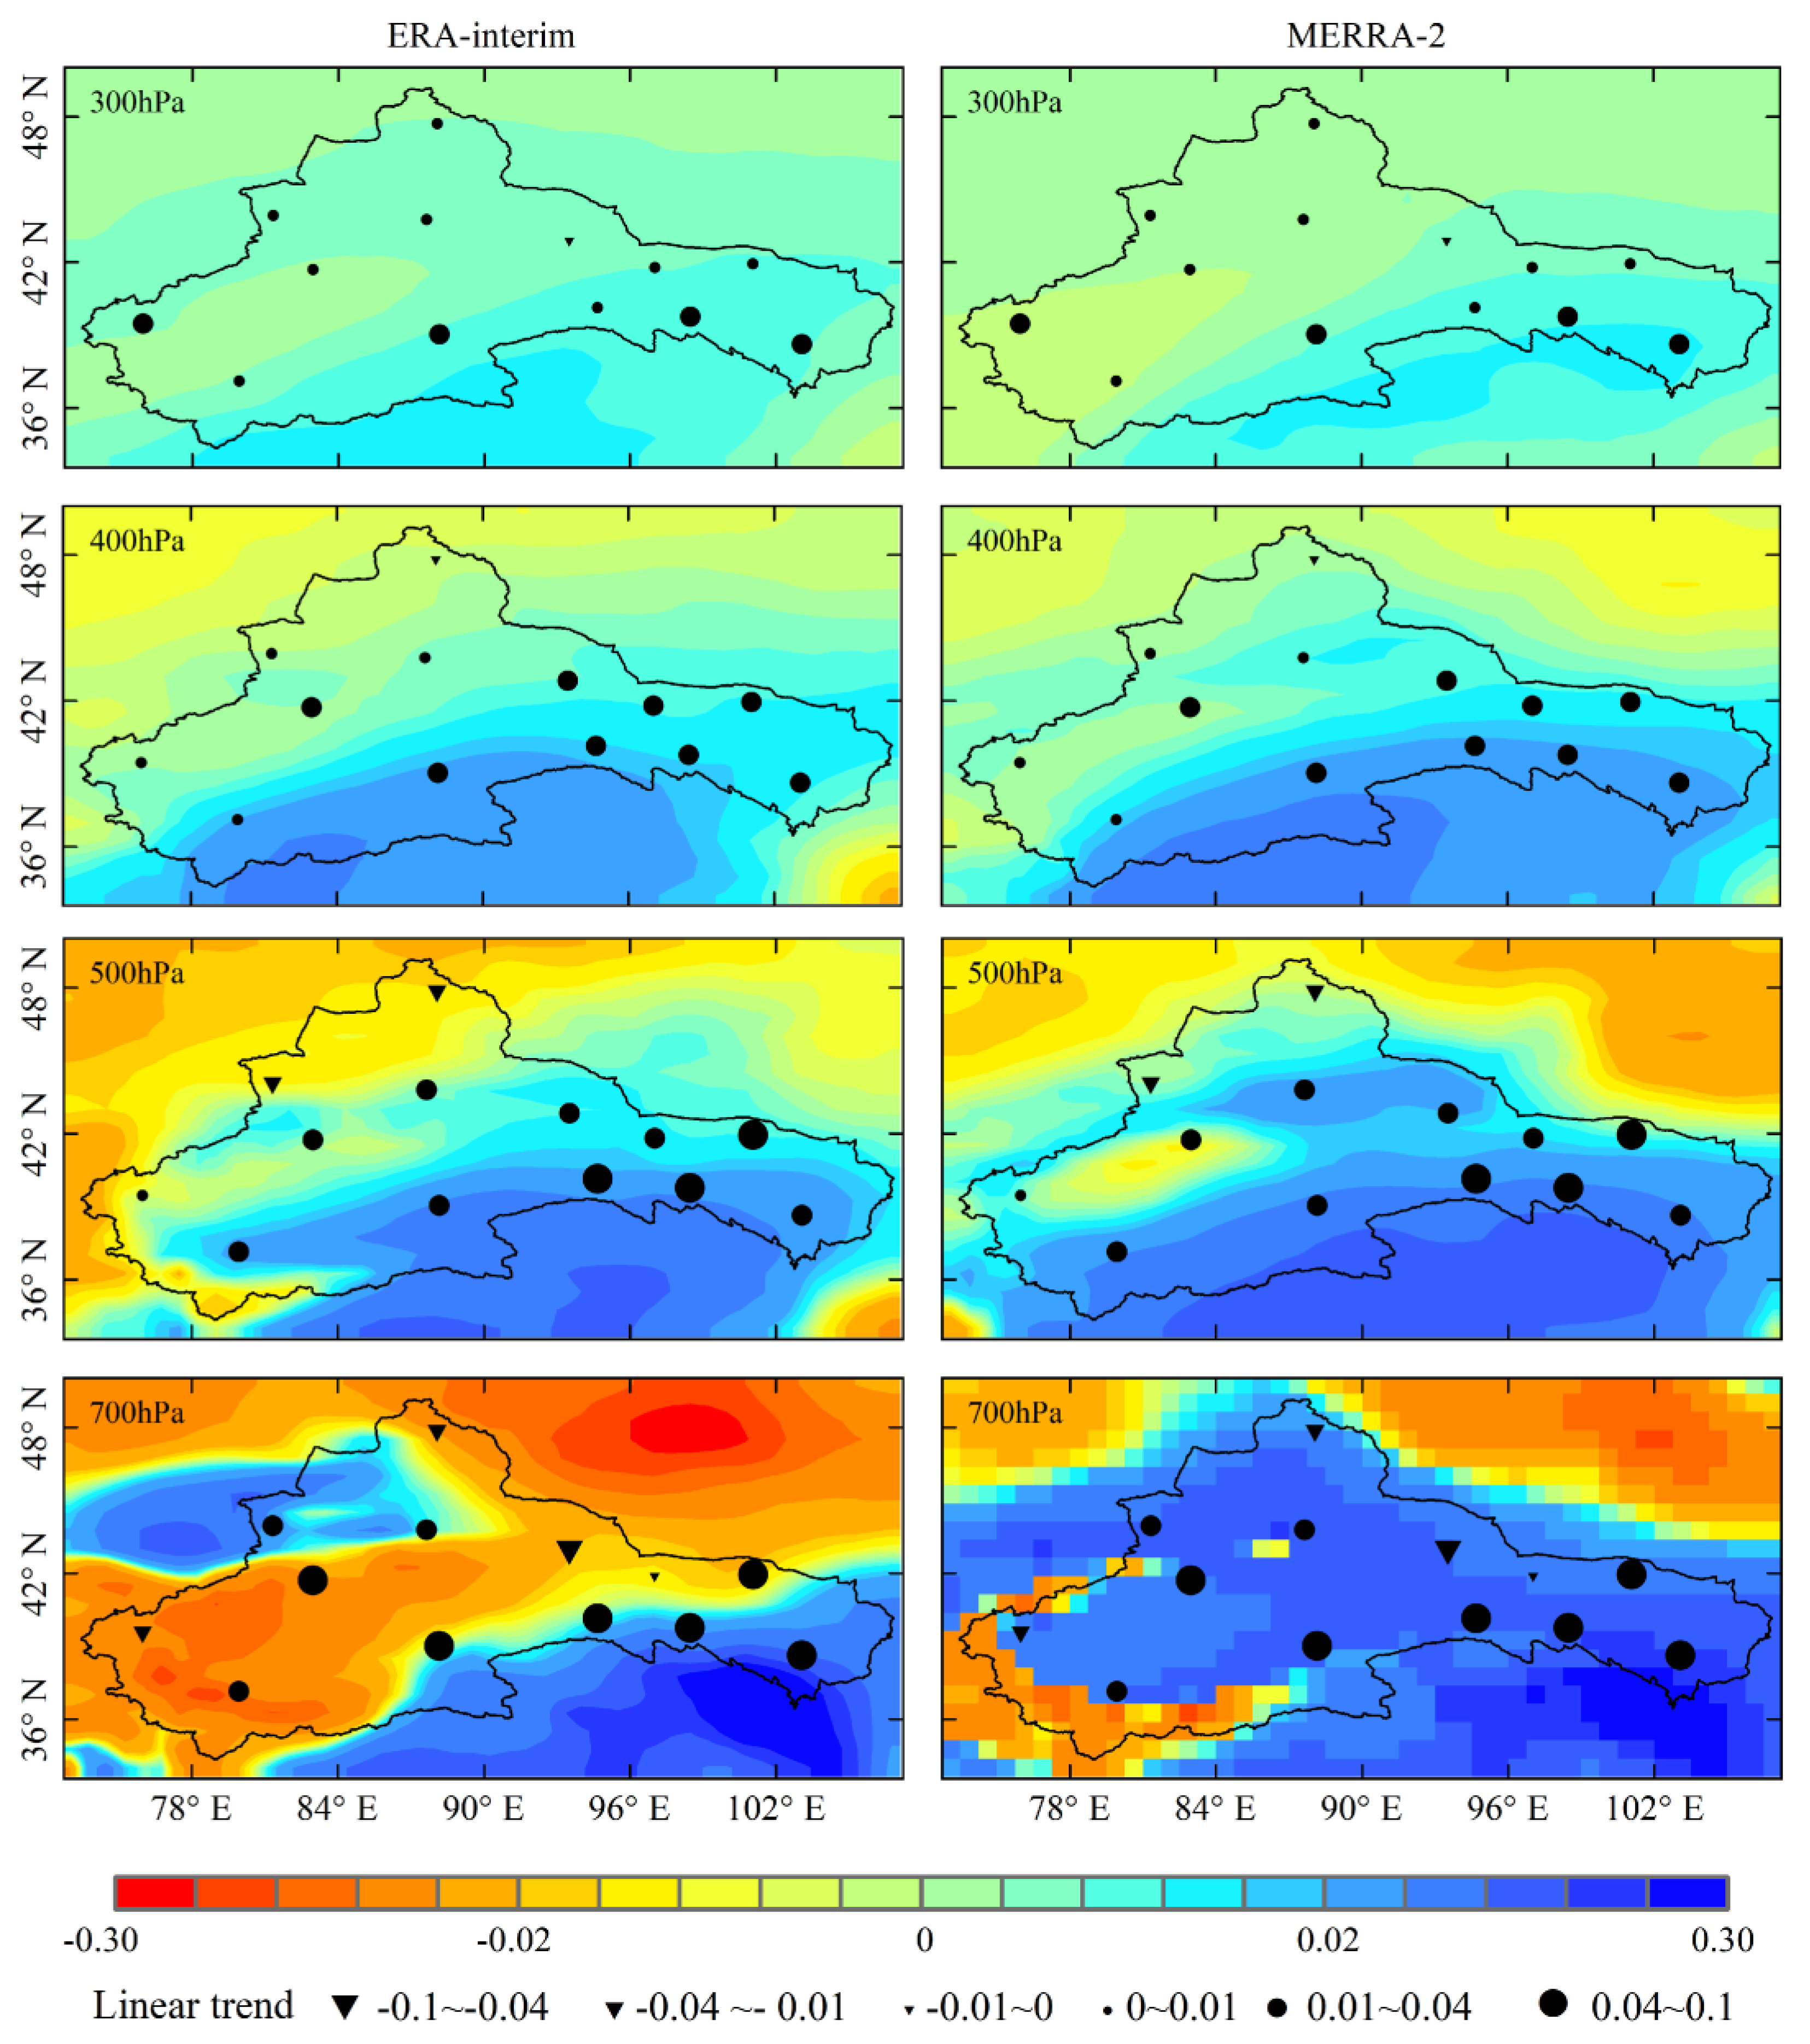
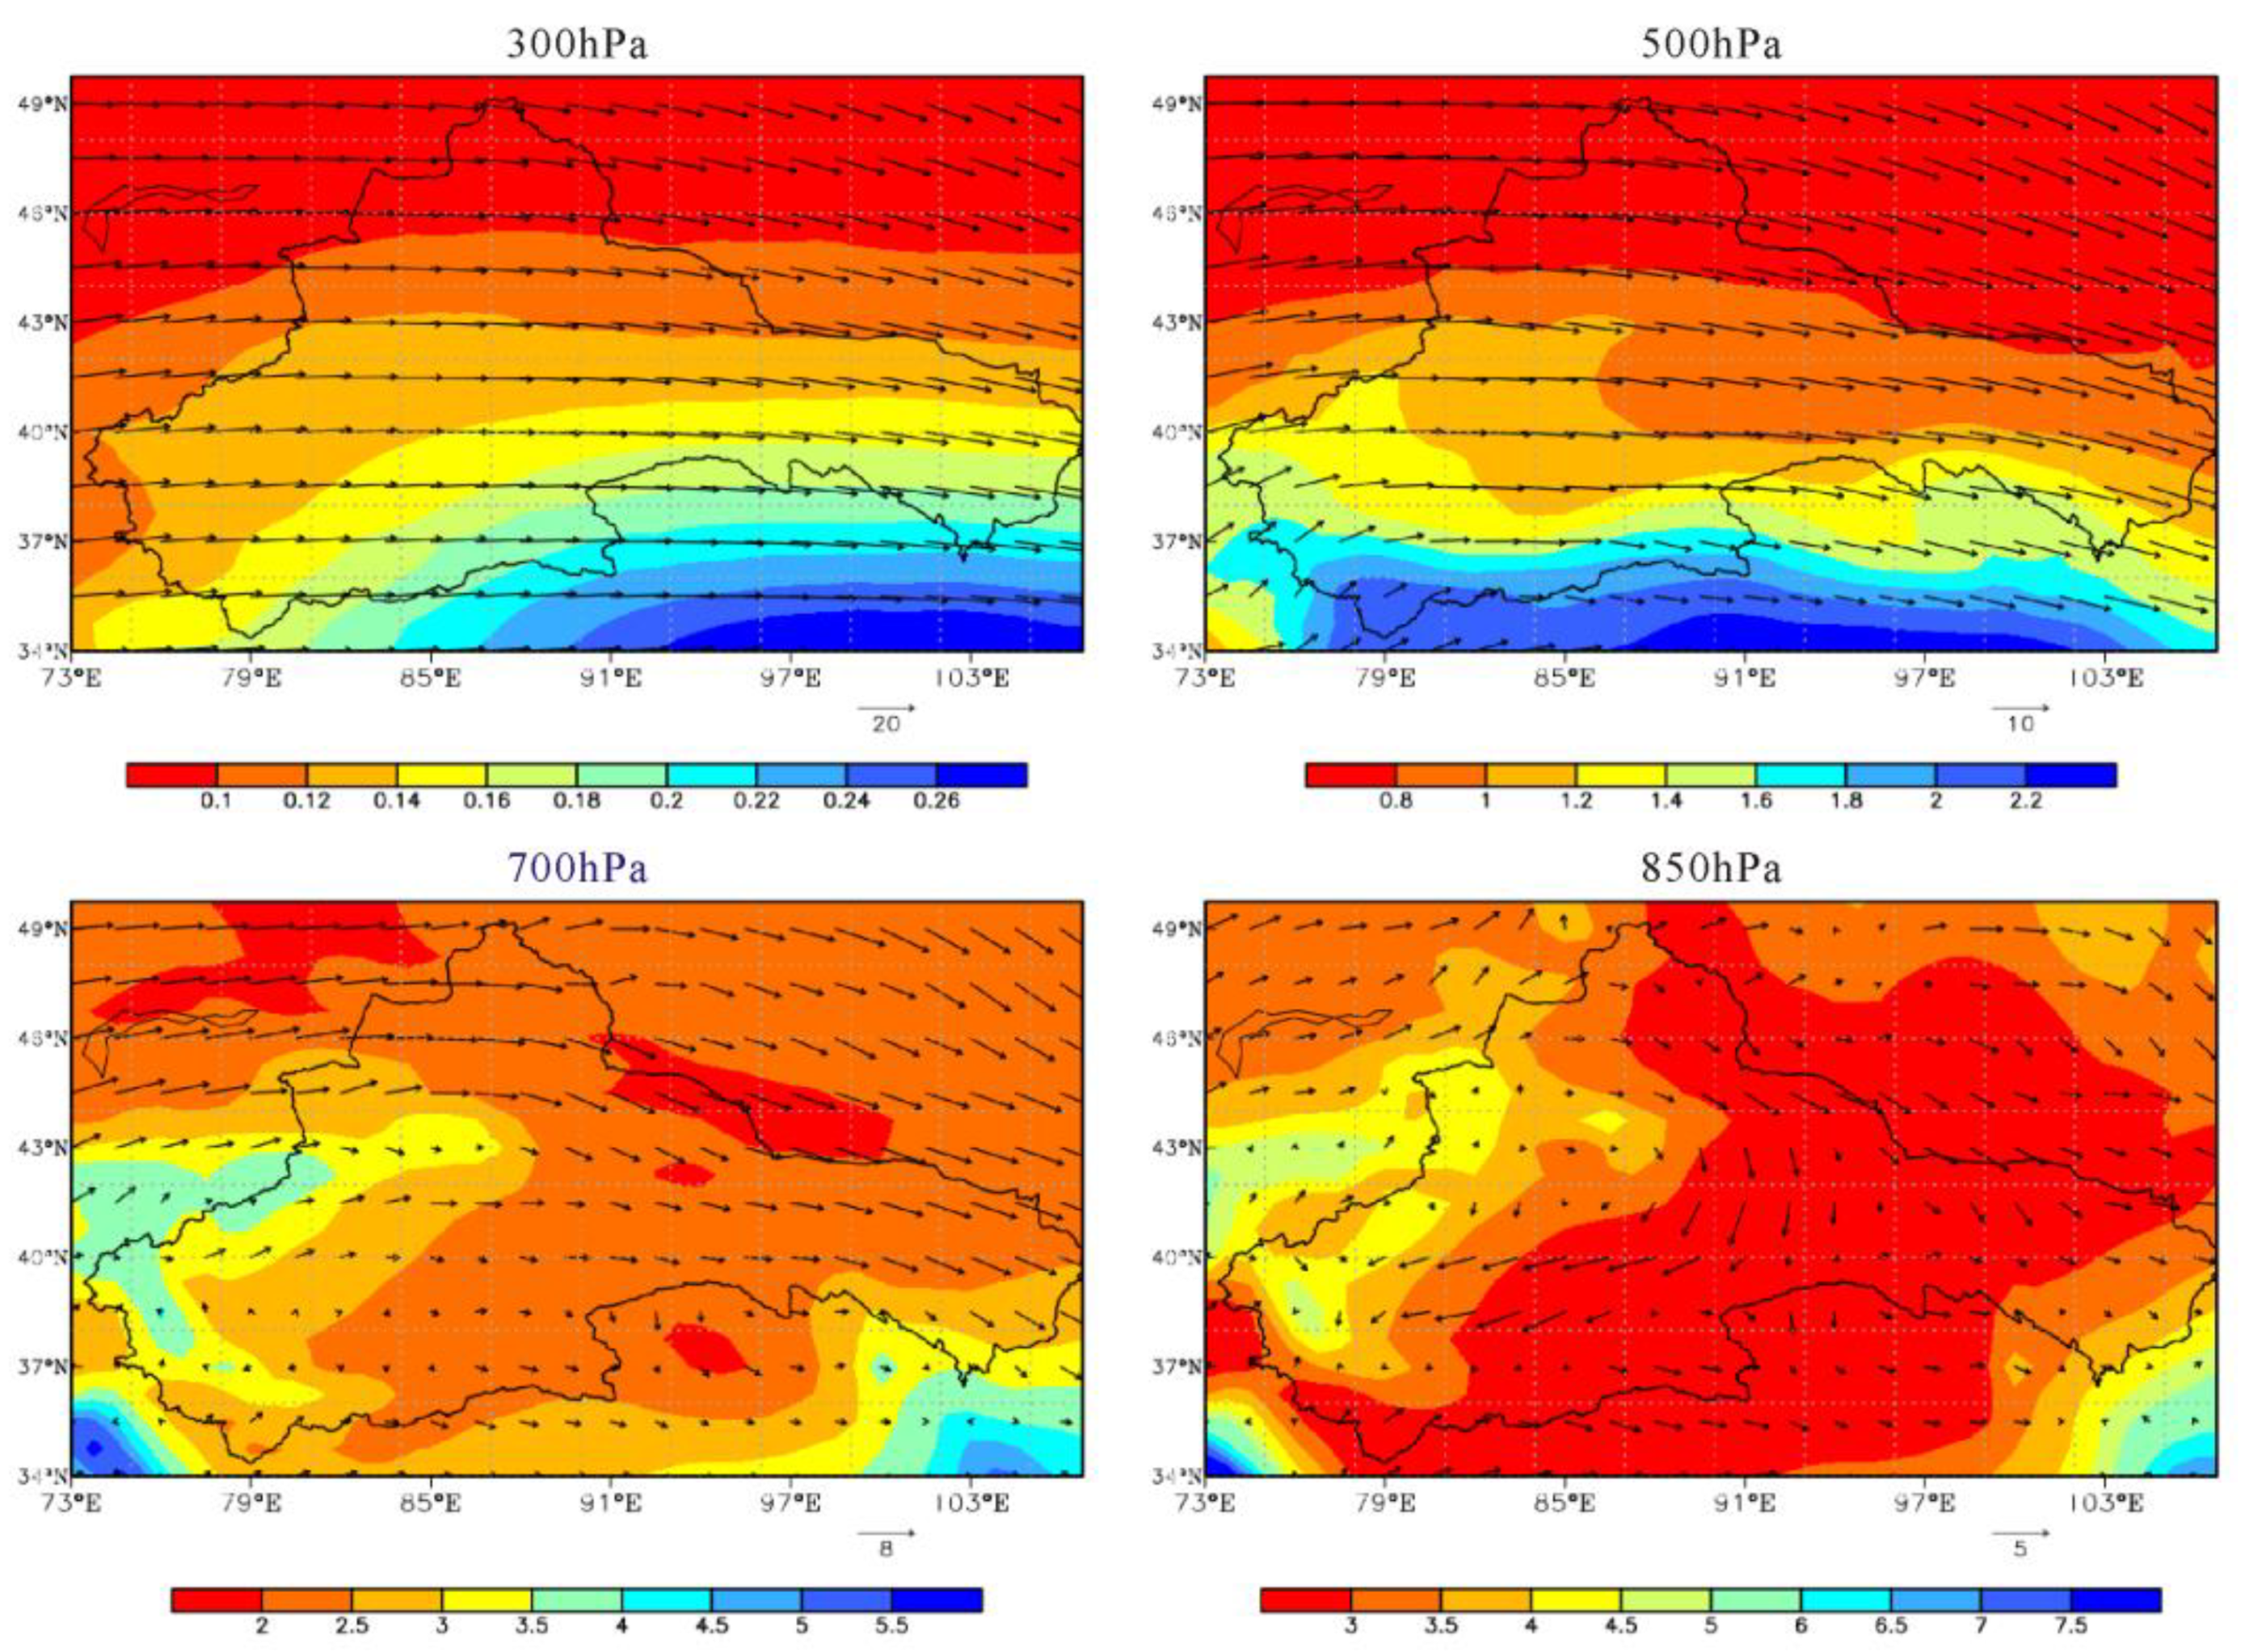
3.4. Distribution of Spatial Variation and Linear Trend of Tropospheric Specific Humidity
3.5. Discussion
4. Conclusions
Author Contributions
Funding
Institutional Review Board Statement
Informed Consent Statement
Data Availability Statement
Acknowledgments
Conflicts of Interest
References
- Liu, G.W. Atmosphere Process in Hydrologic Cycle; Science Press: Beijing, China, 1997. [Google Scholar]
- Brown, P.J.; Degaetano, A.T. Trends in U.S. surface humidity, 1930–2010. J. Appl. Meteorol. Clim. 2013, 52, 147–163. [Google Scholar] [CrossRef]
- Dessler, A.E.; Sherwood, S.C. A matter of humidity. Science 2009, 323, 1020–1021. [Google Scholar] [CrossRef]
- Dominguez, F.; Kumar, P.; Liang, X.Z.; Ting, M. Impact of atmospheric moisture storage on precipitation recycling. J. Clim. 2006, 19, 1513–1530. [Google Scholar] [CrossRef]
- He, J.H.; Guo, P.W.; Yin, Y.; Shen, S.W. Introduction of Atmospheric Science; China Meteorological Press: Beijing, China, 2015; pp. 34–45. [Google Scholar]
- Gong, N.G.; Sun, M.P.; Yan, L.X.; Gong, P.; Ma, X.G.; Mou, J.X. Temporal and spatial characteristics of atmospheric water vapor and its relationship with precipitation in Qilian Mountains during 1979–2016. Arid Land Geogr. 2017, 40, 762–771. [Google Scholar] [CrossRef]
- Wang, K.; Sun, M.P.; Gong, N.G. Spatial and temporal distribution and transportation of the water vapor in the Northwestern China. Ari. Land Geogr. 2018, 41, 290–297. [Google Scholar] [CrossRef]
- Zhang, Y.; Li, B.F.; Chen, Y.N. The temporal and spatial Variation of water vapor content and its relationship with precipitation in the arid region of Northwest China from 1970 to 2013. J. Nat. Resour. 2018, 33, 1043–1055. [Google Scholar] [CrossRef][Green Version]
- Igbawua, T.; Zhang, J.H.; Yao, F.M.; Zhang, D. Assessment of moisture budget over West Africa using MERRA-2’s aerological model and satellite data. Clim. Dyn. 2018, 52, 83–106. [Google Scholar] [CrossRef]
- Wang, B.J.; Huang, Y.X.; Tao, J.H.; Li, D.L.; Wang, P.X. Regional Features and Variations of Water Vapor in Northwest China. J. Glaciol. Geocryol. 2006, 28, 15–21. [Google Scholar]
- Bosilovich, M.G.; Robertson, F.R.; Chen, J.Y. Global Energy and Water Budgets in MERRA. J. Clim. 2011, 24, 5721–5739. [Google Scholar] [CrossRef]
- Xu, D.; Kong, Y.; Wang, C.H. Changes of water vapor budget in arid area of Northwest China and its relationship with precipitation. J. Arid Meteorol. 2016, 34, 431–439. [Google Scholar]
- Qiu, S.; Zhou, W.; Leung, M.Y.; Li, X.Z. Regional moisture budget associated with drought/flood events over China. Prog. Earth Planet. Sci. 2017, 4, 36. [Google Scholar] [CrossRef]
- Tao, C.; Zhang, Y.Y.; Tang, S.Q.; Tang, Q.; Ma, H.; Xie, S.C.; Zhang, M.H. Regional moisture budget and land–atmosphere coupling over the US Southern Great Plains inferred from the ARM long–term observations. J. Geophys. Res. Atmos. 2019, 124, 10091–10108. [Google Scholar] [CrossRef]
- Chen, Y.; Li, Y.Q.; Fan, G.Z.; Chen, Y.H. Study on temporal spatial distribution characteristics of latent heat over the Qinghai–Tibetan Plateau. Plateau Meteorol. 2019, 38, 460–473. [Google Scholar]
- Yao, J.Q.; Chen, Y.N.; Zhao, Y.; Guan, X.F.; Mao, W.Y.; Yang, L.M. Climatic and associated atmospheric water cycle changes over the Xinjiang, China. J. Hydrol. 2020, 585, 124823. [Google Scholar] [CrossRef]
- Dessler, A.E.; Davis, S.M. Trends in tropospheric humidity from reanalysis systems. J. Geophys. Res. Atmos. 2010, 115, D19127. [Google Scholar] [CrossRef]
- Darand, M.; Pazhooh, F.; Saligheh, M. Trend analysis of tropospheric specific humidity over Iran during 1979–2016. Int. J. Climatol. 2019, 39, 4058–4071. [Google Scholar] [CrossRef]
- Zhang, S.Q.; Guo, Y.J.; Wang, G.F. A comparative study of atmospheric humidity over China between radiosonde and the third generation reanalysis datasets. Acta Meteorol. Sin. 2018, 76, 289–303. [Google Scholar] [CrossRef]
- Guo, Y.J.; Ding, Y.H. Upper-air specific humidity change over China during 1958–2005. Chin. J. Atmos. Sci. 2014, 38, 1–12. [Google Scholar]
- Xu, B.R.; Zou, S.B.; Du, D.Y.; Xiong, Z.; Lu, Z.X.; Ruan, H.W.; Xiao, H.L. Variation of tropospheric specific humidity upon the middle-lower reaches of the Heihe River during 1981–2010. J. Glaciol. Geocryol. 2016, 38, 57–68. [Google Scholar]
- Liu, Y.Y.; Li, Y.F.; Xie, J.F.; Zhang, H. Climate change characteristics of free atmospheric humidity and its relationship with temperature and precipitation in Northeast China. Sci. Geogr. Sin. 2016, 36, 628–636. [Google Scholar] [CrossRef]
- Zhao, S.Q. A new scheme for comprehensive physical regionalization in China. Acta Geogr. Sin. 1983, 38, 1–10. [Google Scholar]
- Zhang, Q.; Hu, Y.Q.; Cao, X.Y.; Liu, W.M. On Some Problems of Arid Climate System of Northwest China. J. Des. Res. 2000, 20, 13–18. [Google Scholar]
- Chen, Y.N.; Yang, Q.; Luo, Y.; Shen, Y.J.; Pan, X.L.; Li, L.M.; Li, Z.Q. Ponder on the issues of water resources in the arid region of Northwest China. Arid Land Geogr. 2012, 35, 1–9. [Google Scholar] [CrossRef]
- Chen, D.D.; Zhao, J. Spatial–temporal variation of lake area in arid region of Northwest China. Remote Sens. Tech. Appl. 2017, 32, 1114–1125. [Google Scholar]
- Dee, D.P.; Uppala, S.M.; Simmons, A.J.; Berrisford, P.; Poli, P.; Kobayashi, S.; Andrae, U.; Balmaseda, M.A.; Balsamo, G.; Bauer, P.; et al. The ERA-Interim reanalysis: Configuration and performance of the data assimilation system. Q. J. R. Meteorol. Soc. 2011, 137, 553–597. [Google Scholar] [CrossRef]
- Wei, J.F.; Dirmeyer, P.A.; Bosilovich, M.G.; Wu, R.G. Water vapor sources for Yangtze River Valley rainfall: Climatology, variability, and implications for rainfall forecasting. J. Geophys. Res. 2012, 117, D05126. [Google Scholar] [CrossRef]
- Gelaro, R.; Mccarty, W.; Suárez, M.J.; Todling, R.; Molod, A.; Takacs, L.; Randles, C.A.; Darmenov, A.; Bosilovich, M.G.; Reichle, R.; et al. The Modern-Era retrospective analysis for research and applications, Version 2 (MERRA–2). J. Clim. 2017, 30, 5419–5454. [Google Scholar] [CrossRef] [PubMed]
- Lu, Y.R.; Gao, G.D. Physical Climatology; China Meteorological Press: Beijing, China, 1987. [Google Scholar]
- Xiong, Q.F.; Huang, M.; Xiong, M.Q.; Hu, J.L. Cross-validation error analysis of daily gridded precipitation based on China meteorological observation. Plateau Meteorol. 2011, 30, 1615–1625. [Google Scholar]
- Bian, J.C.; Chen, H.B.; VÖMEL, H.; Duan, Y.J.; Xuan, Y.J.; Lü, D.R. Intercomparison of humidity and temperature sensors: GTS1, Vaisala RS80, and CFH. Adv. Atmos. Sci. 2011, 28, 139–146. [Google Scholar] [CrossRef]
- Hao, M.; Gong, J.D.; Wang, R.W.; Wan, X.M.; Liu, Y. The quality assessment and correction of the radiosonde humidity data biases of L-band in China. Acta Meteorol. Sin. 2015, 73, 187–199. [Google Scholar] [CrossRef]
- Shi, Y.F.; Shen, Y.P.; Li, D.L.; Zhang, G.W.; Ding, Y.J.; Hu, R.J.; Kang, E.S. Discussion on the present climate change from warm-day to warm-wet in Northwest China. Quat. Sci. 2003, 23, 152–164. [Google Scholar]
- Zhao, H.Y.; Zhang, X.Q.; Xie, C.Y. Applicability of reanalysis data of multi-source water vapor over the Tibetan Plateau. Arid Zone Res. 2017, 34, 300–308. [Google Scholar]


| Level (hPa) | ERA-Interim | MERRA-2 | ||||
|---|---|---|---|---|---|---|
| (g/kg) | RMSE (g/kg) | COR | (g/kg) | RMSE (g/kg) | COR | |
| 200 | 0.02 | 0.02 | 0.27 | 0.01 | 0.01 | 0.26 |
| 300 | 0.03 | 0.03 | 0.87 | 0.03 | 0.03 | 0.75 |
| 400 | 0.10 | 0.11 | 0.95 | 0.12 | 0.12 | 0.96 |
| 500 | 0.20 | 0.22 | 0.98 | 0.25 | 0.25 | 0.99 |
| 700 | 0.36 | 0.43 | 0.88 | 0.40 | 0.41 | 0.95 |
| 850 | 0.05 | 0.28 | 0.94 | 0.08 | 0.23 | 0.94 |
Publisher’s Note: MDPI stays neutral with regard to jurisdictional claims in published maps and institutional affiliations. |
© 2021 by the authors. Licensee MDPI, Basel, Switzerland. This article is an open access article distributed under the terms and conditions of the Creative Commons Attribution (CC BY) license (http://creativecommons.org/licenses/by/4.0/).
Share and Cite
Zhang, H.; Sun, M.; Yao, X.; Wang, Z.; Zhang, L. Spatial–Temporal Distribution of Tropospheric Specific Humidity in the Arid Region of Northwest China. Atmosphere 2021, 12, 349. https://doi.org/10.3390/atmos12030349
Zhang H, Sun M, Yao X, Wang Z, Zhang L. Spatial–Temporal Distribution of Tropospheric Specific Humidity in the Arid Region of Northwest China. Atmosphere. 2021; 12(3):349. https://doi.org/10.3390/atmos12030349
Chicago/Turabian StyleZhang, Hao, Meiping Sun, Xiaojun Yao, Zhilan Wang, and Lei Zhang. 2021. "Spatial–Temporal Distribution of Tropospheric Specific Humidity in the Arid Region of Northwest China" Atmosphere 12, no. 3: 349. https://doi.org/10.3390/atmos12030349
APA StyleZhang, H., Sun, M., Yao, X., Wang, Z., & Zhang, L. (2021). Spatial–Temporal Distribution of Tropospheric Specific Humidity in the Arid Region of Northwest China. Atmosphere, 12(3), 349. https://doi.org/10.3390/atmos12030349