Article

First Results on Moss Biomonitoring of Trace Elements in the Central Part of Georgia, Caucasus

1
Sector of Neutron Activation Analysis and Applied Research, Frank Laboratory of Neutron Physics, Joint Institute for Nuclear Research, 141980 Dubna, Russia
2
Department of Anatomy, Physiology and Botany, Faculty of Chemistry, Biology and Biotechnology, The North Ossetian State University of K.L. Khetagurov, 362025 Vladikavkaz, Russia
3
Department of Horticulture, Faculty of Agronomy, Gorsky State Agrarian University, 362040 Vladikavkaz, Russia
*
Author to whom correspondence should be addressed.
Atmosphere 2021, 12(3), 317; https://doi.org/10.3390/atmos12030317
Submission received: 30 December 2020 / Revised: 19 February 2021 / Accepted: 24 February 2021 / Published: 28 February 2021

Abstract

:
The moss biomonitoring technique was used for assessment of air pollution in the central part of Georgia, Caucasus, in the framework of the UNECE ICP Vegetation. A total of 35 major and trace elements were determined by two complementary analytical techniques, epithermal neutron activation analysis (Na, Mg, Al, Cl, K, Ca, Sc, Ti, V, Cr, Mn, Fe, Co, Ni, Zn, Se, B, Rb, Sr, Zr, Mo, Sb, I, Cs, Ba, La, Ce, Nd, Sm, Eu, Tb, Yb, Hf, Ta, W, Th, and U) and atomic absorption spectrometry (Cu, Cd, and Pb) in the moss samples collected in 2019. Principal Component Analyses was applied to show the association between the elements in the study area. Four factors were determined, of which two are of geogenic origin (Factor 1 including Na, Al, Sc, Ti, V, Cr, Fe, Co, Ni, Th, and U and Factor 3 with As, Sb, and W), mixed geogenic–anthropogenic (Factor 2 with Cl, K, Zn, Se, Br, I, and Cu) and anthropogenic (Factor 4 comprising Ca, Cd, Pb, and Br). Geographic information system (GIS) technologies were used to construct distributions maps of factor scores over the investigated territory. Comparison of the median values with the analogous data of moss biomonitoring in countries with similar climatic conditions was carried out.

1. Introduction

At present air pollution is recognized as the fifth largest threat to human health [1]. Air pollution and the associated problems are not confined by any geopolitical boundaries. The European Directives on air quality related to particulate matter (PM), heavy metals, and polycyclic aromatic hydrocarbons in ambient air [2,3], define target and limit values in the monitoring and further control of the pollutants. During the last several decades, biomonitoring surveys considering the use of an organism as a monitor of environmental pollution [4] have become a valuable complement to instrumental measurements. Widespread species that reliably reflect air pollution represent a simple and cost-effective alternative for instrumental measurements, thus enabling measurements with much higher spatial resolution. Mosses are recognized as good biomonitors of air pollution due to their specific morpho-physiological features: the lack of a root system, large surface area, and a high cation-exchange capacity of cell membranes, which represent their adaptations to nutrition from the air. Mosses are ubiquitous species and they have been extensively used in large-scale studies for biomonitoring of trans-boundary air pollution [5] known as passive moss biomonitoring [4]. The moss biomonitoring method, in combination with nuclear and related analytical techniques, has been regularly used for the last 25 years in Western European countries to study atmospheric deposition of heavy metals (HM). Over the past 15 years it has spread to Eastern Europe [5]. The first moss survey in Georgia was undertaken in 2014 [6] and the results included in the Report on the European Moss survey 2015–2016 [5] along with data obtained in the next surveys [7,8]. Rocks of different composition, age and stability are spread on the territory of Georgia. The high degree of the relief-dissection is due to strong tectonic movement and intense erosion processes in the Caucasus region. At certain locations of Georgia the depths of erosion-cuts exceeds 2000 m [9].
There is a need to investigate whether mosses sampled in this region can be used as biomonitors of atmospheric heavy metal deposition given the rather high contribution of mineral particles to the metal concentration in mosses. The present research was carried out by the Georgian and Russian teams aimed to cover white spots in the map of this territory of Caucasus.

2. Experimental

2.1. Study Area

The study area is located in Georgia between coordinates: 42°40′ N latitude and 43°17′ E longitude for the North, 41°22′ N latitude and 43°46′ E longitude for the South, 42°35′ N latitude and 43°13′ E longitude for the West, and 41°40′ N latitude and 44°41′ E longitude for the East. Elevation ranges from 651 to 2132 m a.s.l.
The South Caucasus region is highly prone to natural disasters, and its mountainous regions are particularly high risk areas. Natural phenomena common in the region include landslides and mudflows, floods, flash floods, droughts, avalanches, rainstorms, and earthquakes. The countries are located in a region of moderate to very high seismic activity and are therefore particularly prone to earthquakes, which can have devastating consequences for lives, buildings and infrastructure. This seismic activity can also trigger secondary events such as landslides, avalanches and flash floods in mountainous areas [10].
The mountainous regions of the South Caucasus have a wide range of climatic zones, from cold temperate alpine peaks to temperate, humid and arid landscapes.
The relief of Georgia is characterized by complex hypsometric and morphographic features: heavily dissected mountain slopes, deep erosive gorges, intermountain depressions, flat lowlands, plains, plateaus, and uplands. The most important landforms found in the territory of Georgia are erosive, volcanic, karst, gravitational, and old glacial landforms [11,12].
The climate in the high-mountains contributes to the formation of eternal snows and glaciers. Mountain meadow soils prevail in the highlands, and brown forest soils on the plains. Landscape and ecosystems of each sampling site differ considerably and depend on wind direction. Study area is located outside industrial zones; however, it may experience a long-range transport of pollutants due to resuspension of soil particles.
During the summer season, the main source of air pollution is traffic. It should be noted that as of 2018, 45.5% of vehicles were over 20 years old. Diesel fuel quality and requirements remain a particularly problematic issue in the country [13].
The main industrial activities taking place in the mountainous regions of Central Caucasus are related to the extraction and processing of natural resources. Mining activities alter the structure of the landscape, which can have severe consequences. Mining and processing activities often create toxic waste, which can have adverse impacts on the surrounding environment. In the Ambrolauri region, near village Uravi arsenic mining sites are situated. When the mining sites were abandoned in 1992, approximately 100,000 tons of wastes containing arsenic were left in surface areas. These sites are situated in the basins of the Rioni river, and there was an existing high risk of arsenic leakage [14,15].

2.2. Moss Sampling

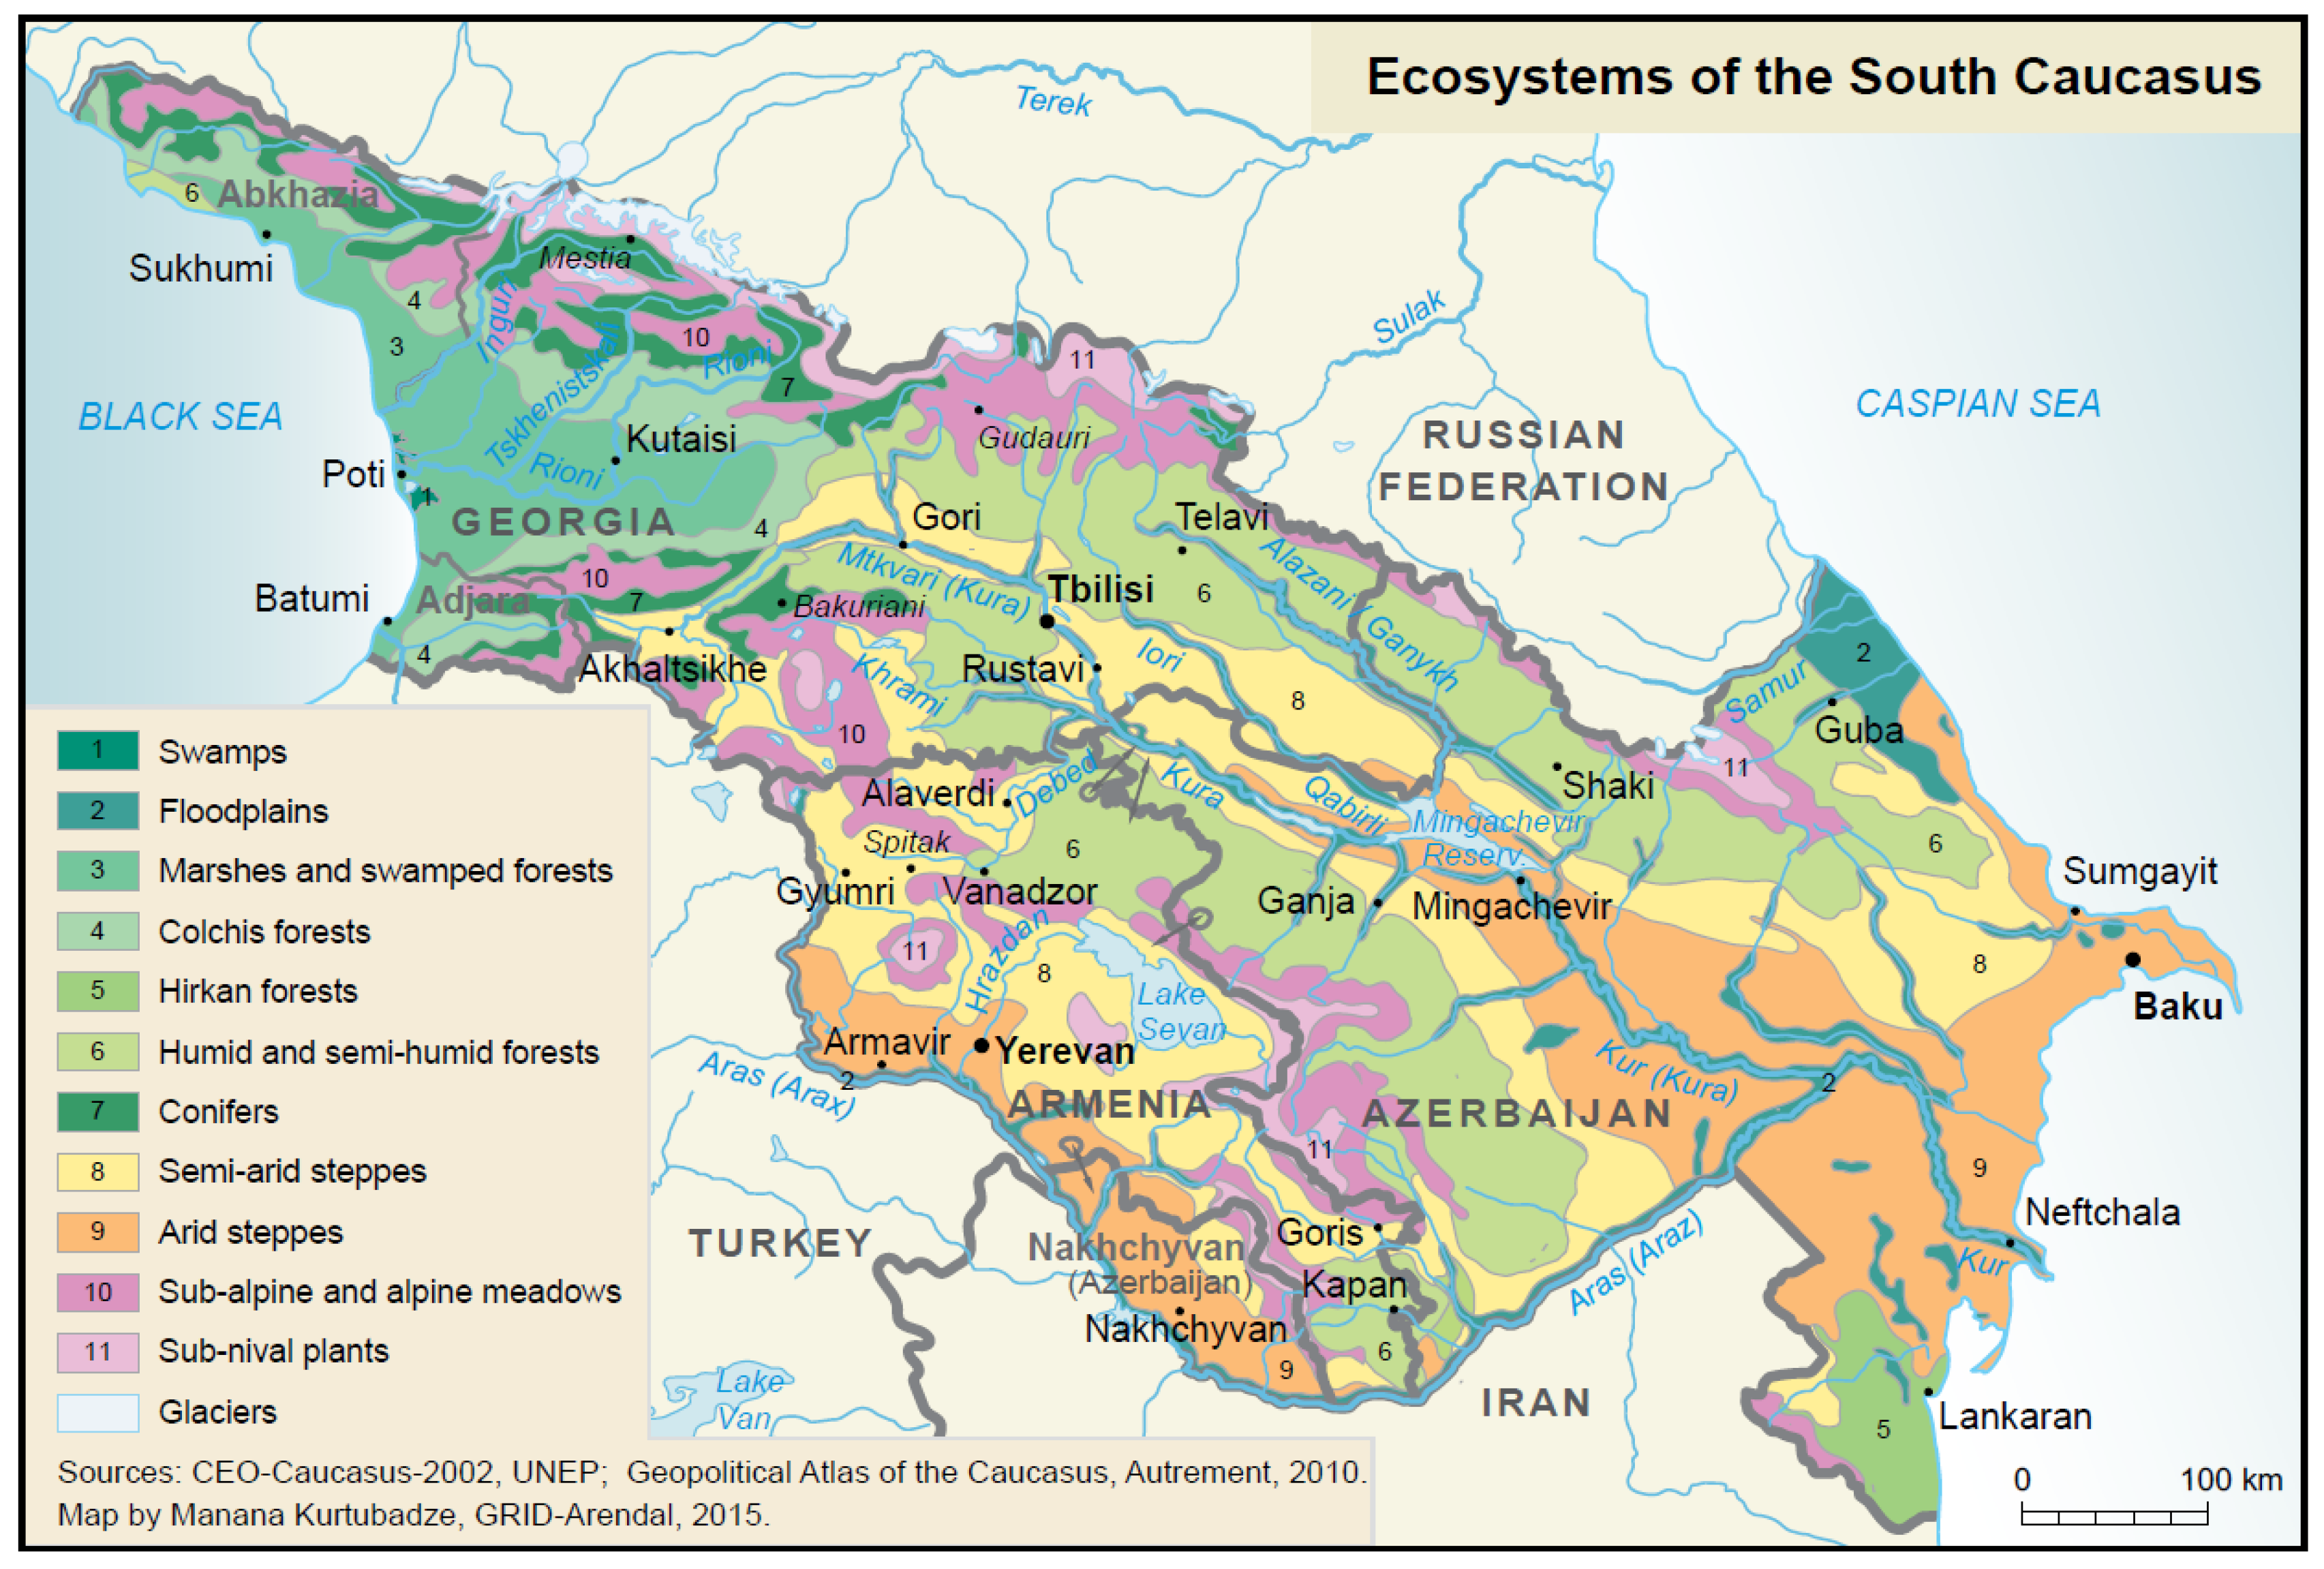
Passive moss biomonitoring was performed in compliance with the guidelines of the Convention on Long-Range Transboundary Air Pollution (CLRTAP) and International Cooperative Program on Effects of Air Pollution on Natural Vegetation and Crops monitoring manual Moss Manual 2020 [16]. The following regions are represented: Racha-Lechkhumi and Kvemo Svaneti, Shida Kartli, Mtskheta-Mtianeti, Kvemo Kartli, and Samtskhe-Javakheti. Overall, thirty-five moss samples (Hylocomium splendens (Hedw.) Schimp. (4), Hypnum cupressiforme Hedw. (12)), Pleurozium schreberi (Brid.) Mitt (5), and Abietinella abietina (Hedw.) M. Fleisch) (14) were collected during summer 2019. (The number of samples of each type is given in brackets). Three first moss species are recommended for biomonitoring purposes in the Moss Manual-2020 [16], However in some sampling sited the only available species was Abietinella abietina (Hedw.) M. Fleisch) which was considered suitable for sampling due to the closeness of its morphological properties with the mosses listed in the Moss Manual. The sampling map is given in Figure 1. From a map Ecosystems of South Caucasus (Figure 2) one can obviously see the variety of ecosystems and climatic zones of the sampled areas.
Samples were collected at least 300 m from the main roads and settlements and at least 100 m away from the side roads, mainly from open areas to avoid the impact of higher vegetation. Longitude, latitude, and elevation were noted for every sampling location using the global positioning system.
For each sampling site, details (date of the sampling, weather condition, nearby vegetation, topography, and land use) were noted. Five to ten sub-samples were collected within an area of 50 m × 50 m and mixed in one composite sample. Samples were stored and transported in tightly closed paper bags. To prevent any contamination of the samples, sampling, and sample handling in the field and in the laboratory were performed using disposable polyethylene gloves (without talc) for each sample.

2.3. Sample Preparation and Elemental Analysis

Each sample was cleaned from extraneous materials in a chemical laboratory. Only green and green-brown shoots were taken and dried to a constant weight at 30–40 °C for 48 h. The elemental analysis of each sample was performed using instrumental neutron activation analysis (INAA) and atomic absorption spectrometry (AAS). The procedure of moss preparation for INAA and AAS is described in our previous study [8].
Moss samples were subjected to INAA at the neutron activation analysis facility REGATA of the IBR-2 reactor of the FLNP, JINR (Dubna, Russia). To determine elements with short lived isotopes (Mg, Al, Cl, Ca, Ti, V, Mn, I) samples were irradiated for 3 min and measured for 20 min. To determine elements with long lived isotopes (Na, K, Sc, Cr, Fe, Co, Ni, Zn, As, Se, Br, Rb, Sr, Zr, Mo, Sn, Sb, Cs, Ba, La, Ce, Nd, Sm, Eu, Tb, Yb, Hf, Ta, W, Au, Th and U) samples were irradiated for 3 days, re-packed, and measured twice using HPGe detectors after 4 and 20 days of decay, respectively. The calculation of element concentrations was performed using software developed at FLNP JINR [17].
The AAS was used to determine amounts of Cu, Cd, and Pb in the moss samples using the iCE 3300 AAS atomic absorption spectrometer with electrothermal (graphite furnace) atomization (Thermo Fisher Scientific, Waltham, MA, USA).
The calibration solutions were prepared from a 1 g/L stock solution (AAS standard solution; Merck, DE).

2.4. Quality Control of ENAA and AAS

In order to evaluate the precision and accuracy of the results, the certified reference materials and standards were used, namely NIST SRM 1575a—Trace Elements in Pine Needles, NIST SRM 1547—Peach Leaves, NIST SRM 1633b—Constituent Elements in Coal Fly Ash, NIST SRM 1632c—Trace Elements in Coal (Bituminous), IRMM SRM 667—Estuarine Sediment, NIST SRM 2711—Montana Soil, NIST SRM 2710—Montana Soil.
Table 1 shows the differences between certified and calculated values of concentrations, where “SRM” were used as standards for calculations of concentrations for SRMs in the column “Sample”. Most differences between certified and obtained values are lower than 2 σ. There are no such data for elements Mo, Sn, W, and Au because their certified values are in the irradiated SRM only.
A comparison of heavy metal concentrations obtained using the AAS with the standard values are presented in Table 2. The difference between the certified and measured elements contents of the certified material varied between 1% and 5%.

2.5. Data Analysis Using PCA

Principle Component Analysis (PCA) is a special case of factor analysis, which transforms the original set of intercorrelated variables into a set of uncorrelated variables that are linear combinations of the original variables. The first principal component is the linear combination of the variables that accounts for a maximum of the total variability of the data set. The second principal component explains a maximum of the variability not accounted for by the first component, and so on. The objective is to find a minimum number of principal components that explain most of the variance in the data set. The principal components are statistically independent and, typically, the first few components explain almost all the variability of the whole data set. The minor principal components, which explain only a minor part of the data, can be eliminated, thus simplifying the analysis. Further, these minor components contain most of the random error, so eliminating them tends to remove extraneous variability from the analysis. A wide range in concentrations makes normalization of the data necessary if all the elements are to be given equal weight in the analysis. The values used in the PCA are made dimensionless by this transformation [18]).

2.6. Construction of GIS Maps

The ArcGis 10.6 software (Esri, Redlands, California, USA) was used to build distribution maps of factor scores over the study area. We are using the OpenLayers library and a few backgrounds like “Oceans”, “Gray”, “World”, “OSM”, etc., to generate maps.

3. Results and Discussion

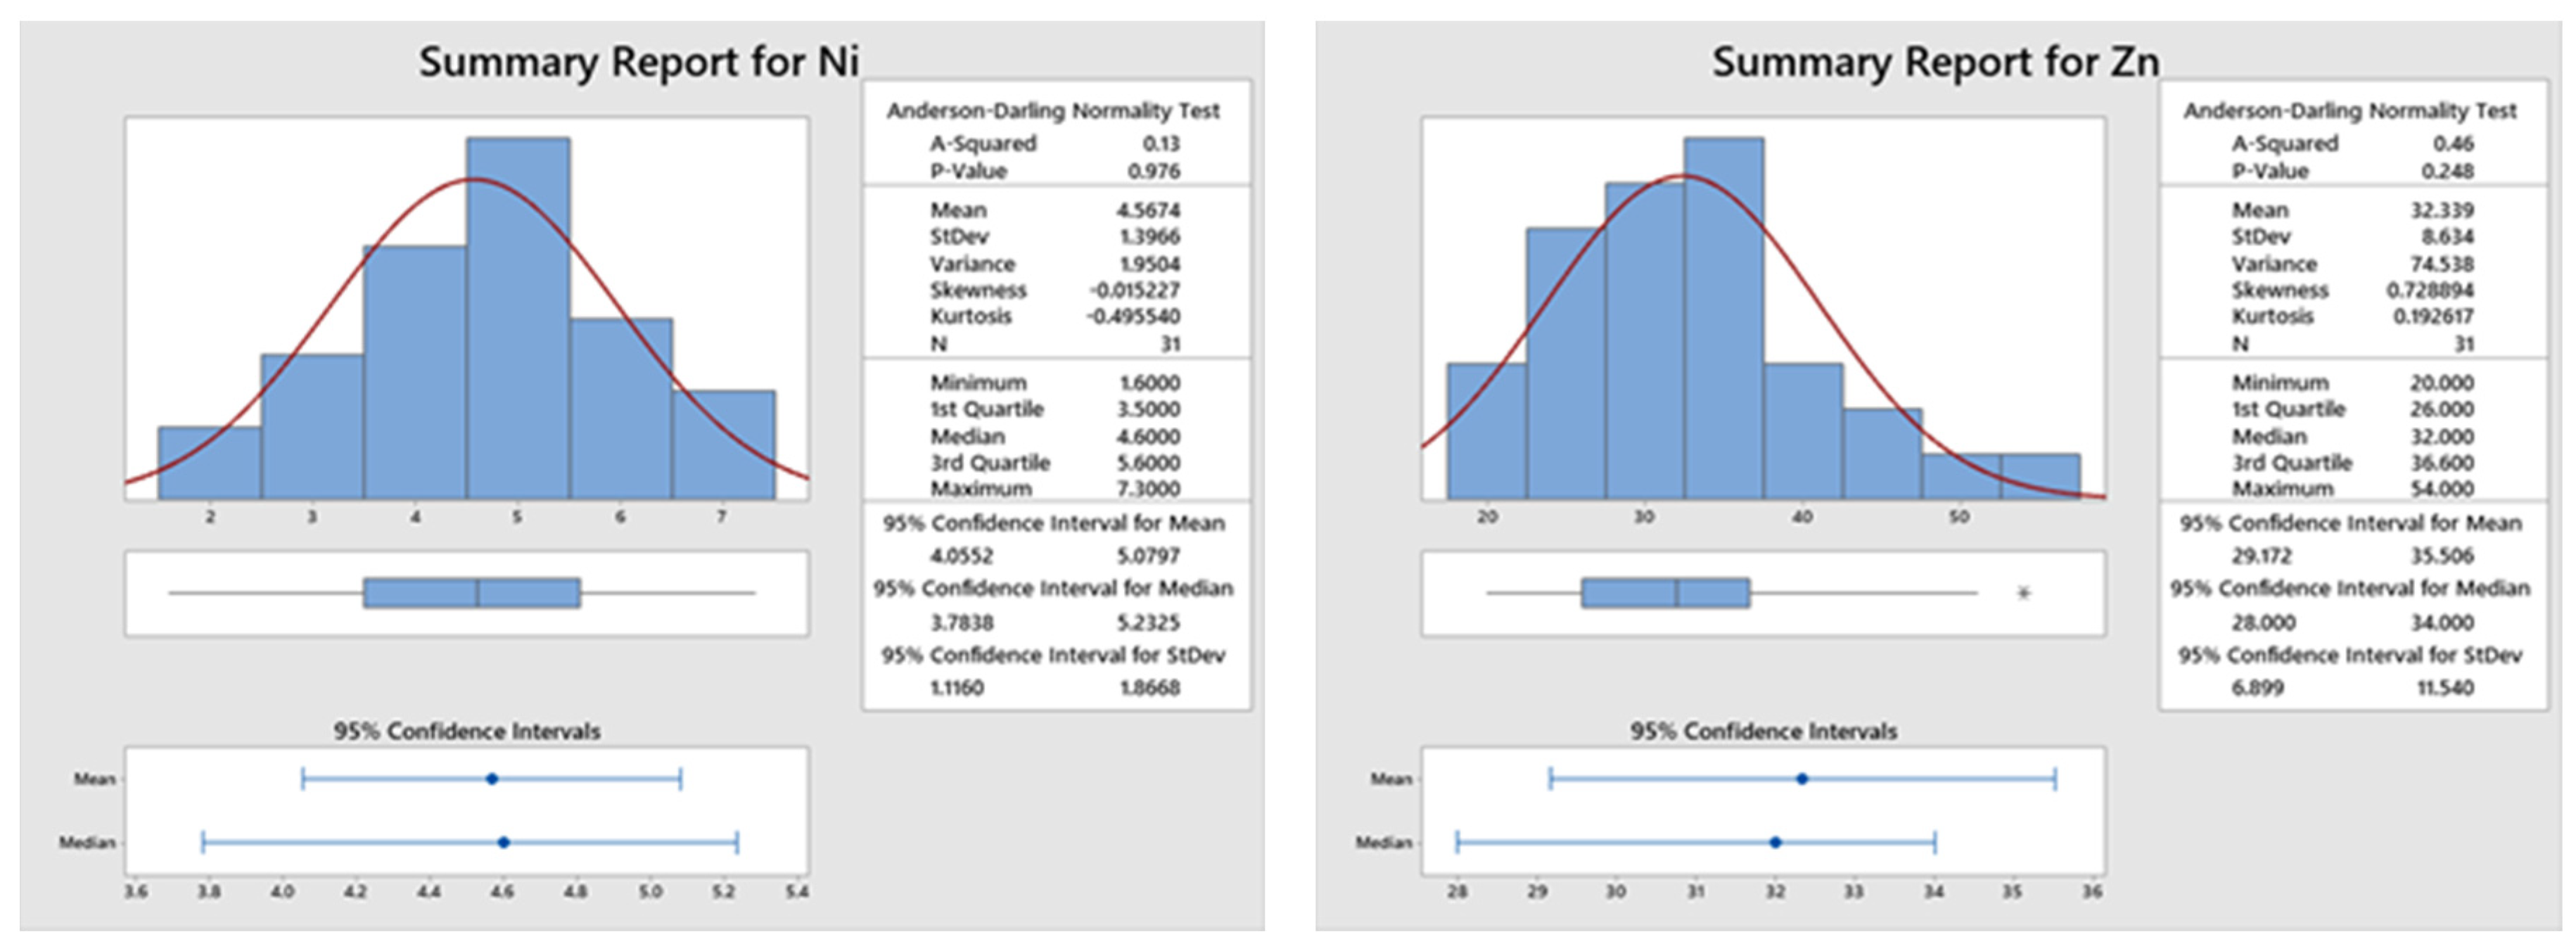
A summary of the results from the 2019 moss sampling over the study area is presented in Table 3 along with similar data obtained in previous surveys in Georgia in 2014–2017 [8], North Macedonia [19], Bulgaria [20], and pristine country Norway [21]. Data from North Macedonia and Bulgaria were obtained by INAA in Dubna, at the IBR-2 reactor of FLNP JINR using the same hard- and software, whereas Norwegian data is a result of ICP-MS. The Table 3 contains the medians and the lower and upper concentration quartiles of all components. Variability of elemental concentrations is reflected by the total range, which often spans approximately two to three orders of magnitude. Direct comparison of the medians does not show great difference in the elemental concentrations for Georgia and the Balkan countries, whereas maximal values of such element as As and Mo, both in 2014–2017 and 2019, exceed those for North Macedonia and Bulgaria, and it is five times higher than the maximum in Norway. This phenomenon is easily explained by mining and processing of arsenic and the presence of polymetallic ores abundant in the Caucasian Mountains. To demonstrate special behavior of As, the Summary Results for arsenic, iron, zinc, and nickel are presented in Figure 3 from which a strong local As contamination is evident, whereas Fe shows normal distribution, and the others are close to normal. In comparison with Norway, a country with fewer anthropogenic influences, Georgia has higher median values for the elemental content in mosses for almost all air pollution elements (As, Cd, Co, Cr, Cu, Hg, Ni, and Pb) [21].
It is also clearly confirmed by principal component analysis (PCA) used to classify the elements with respect to contribution sources.
PCA was carried out by using the Statistical Package STATISTICA 13.0 Results of factor analysis are presented in Table 4. Communality values close to 1 suggest that the extracted factors explain much of the variance of the individual variable.
The data set analyzed includes results for 24 trace elements and major components. The PCA indicates four factors, which explain 82% of the total variance.
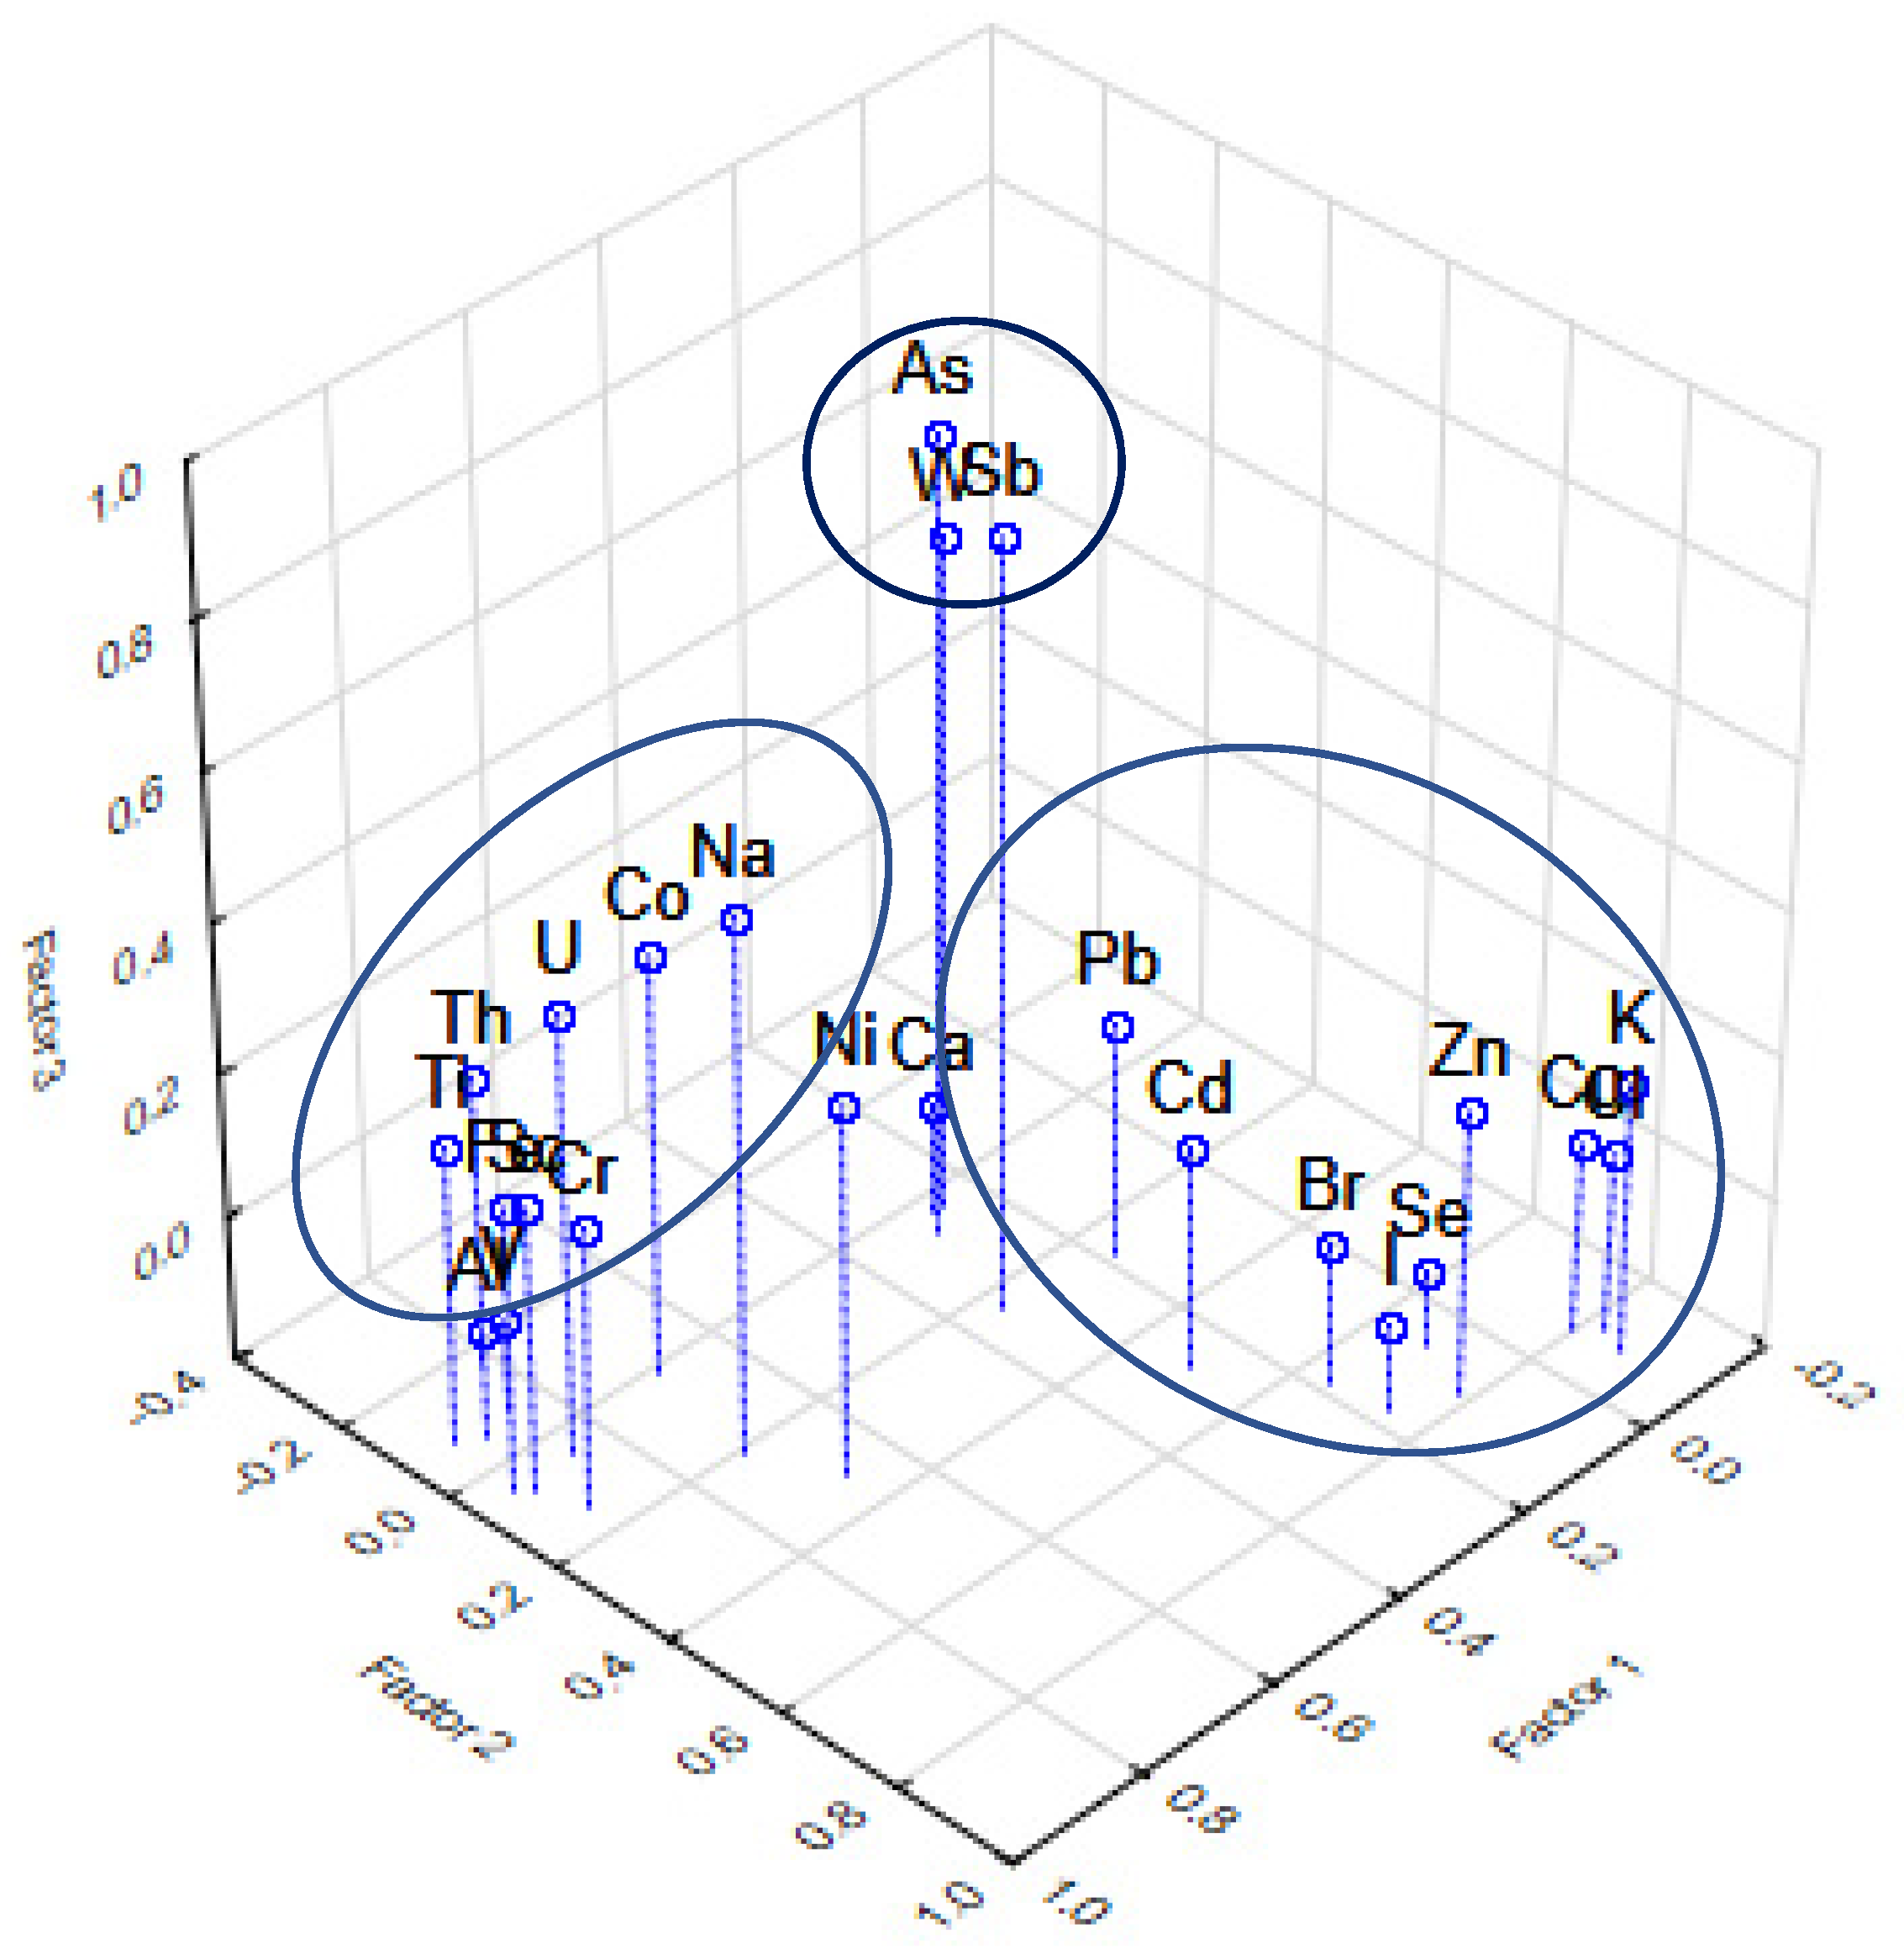
To visualize the results obtained, the graph on Factor Loadings was built (see Figure 4).
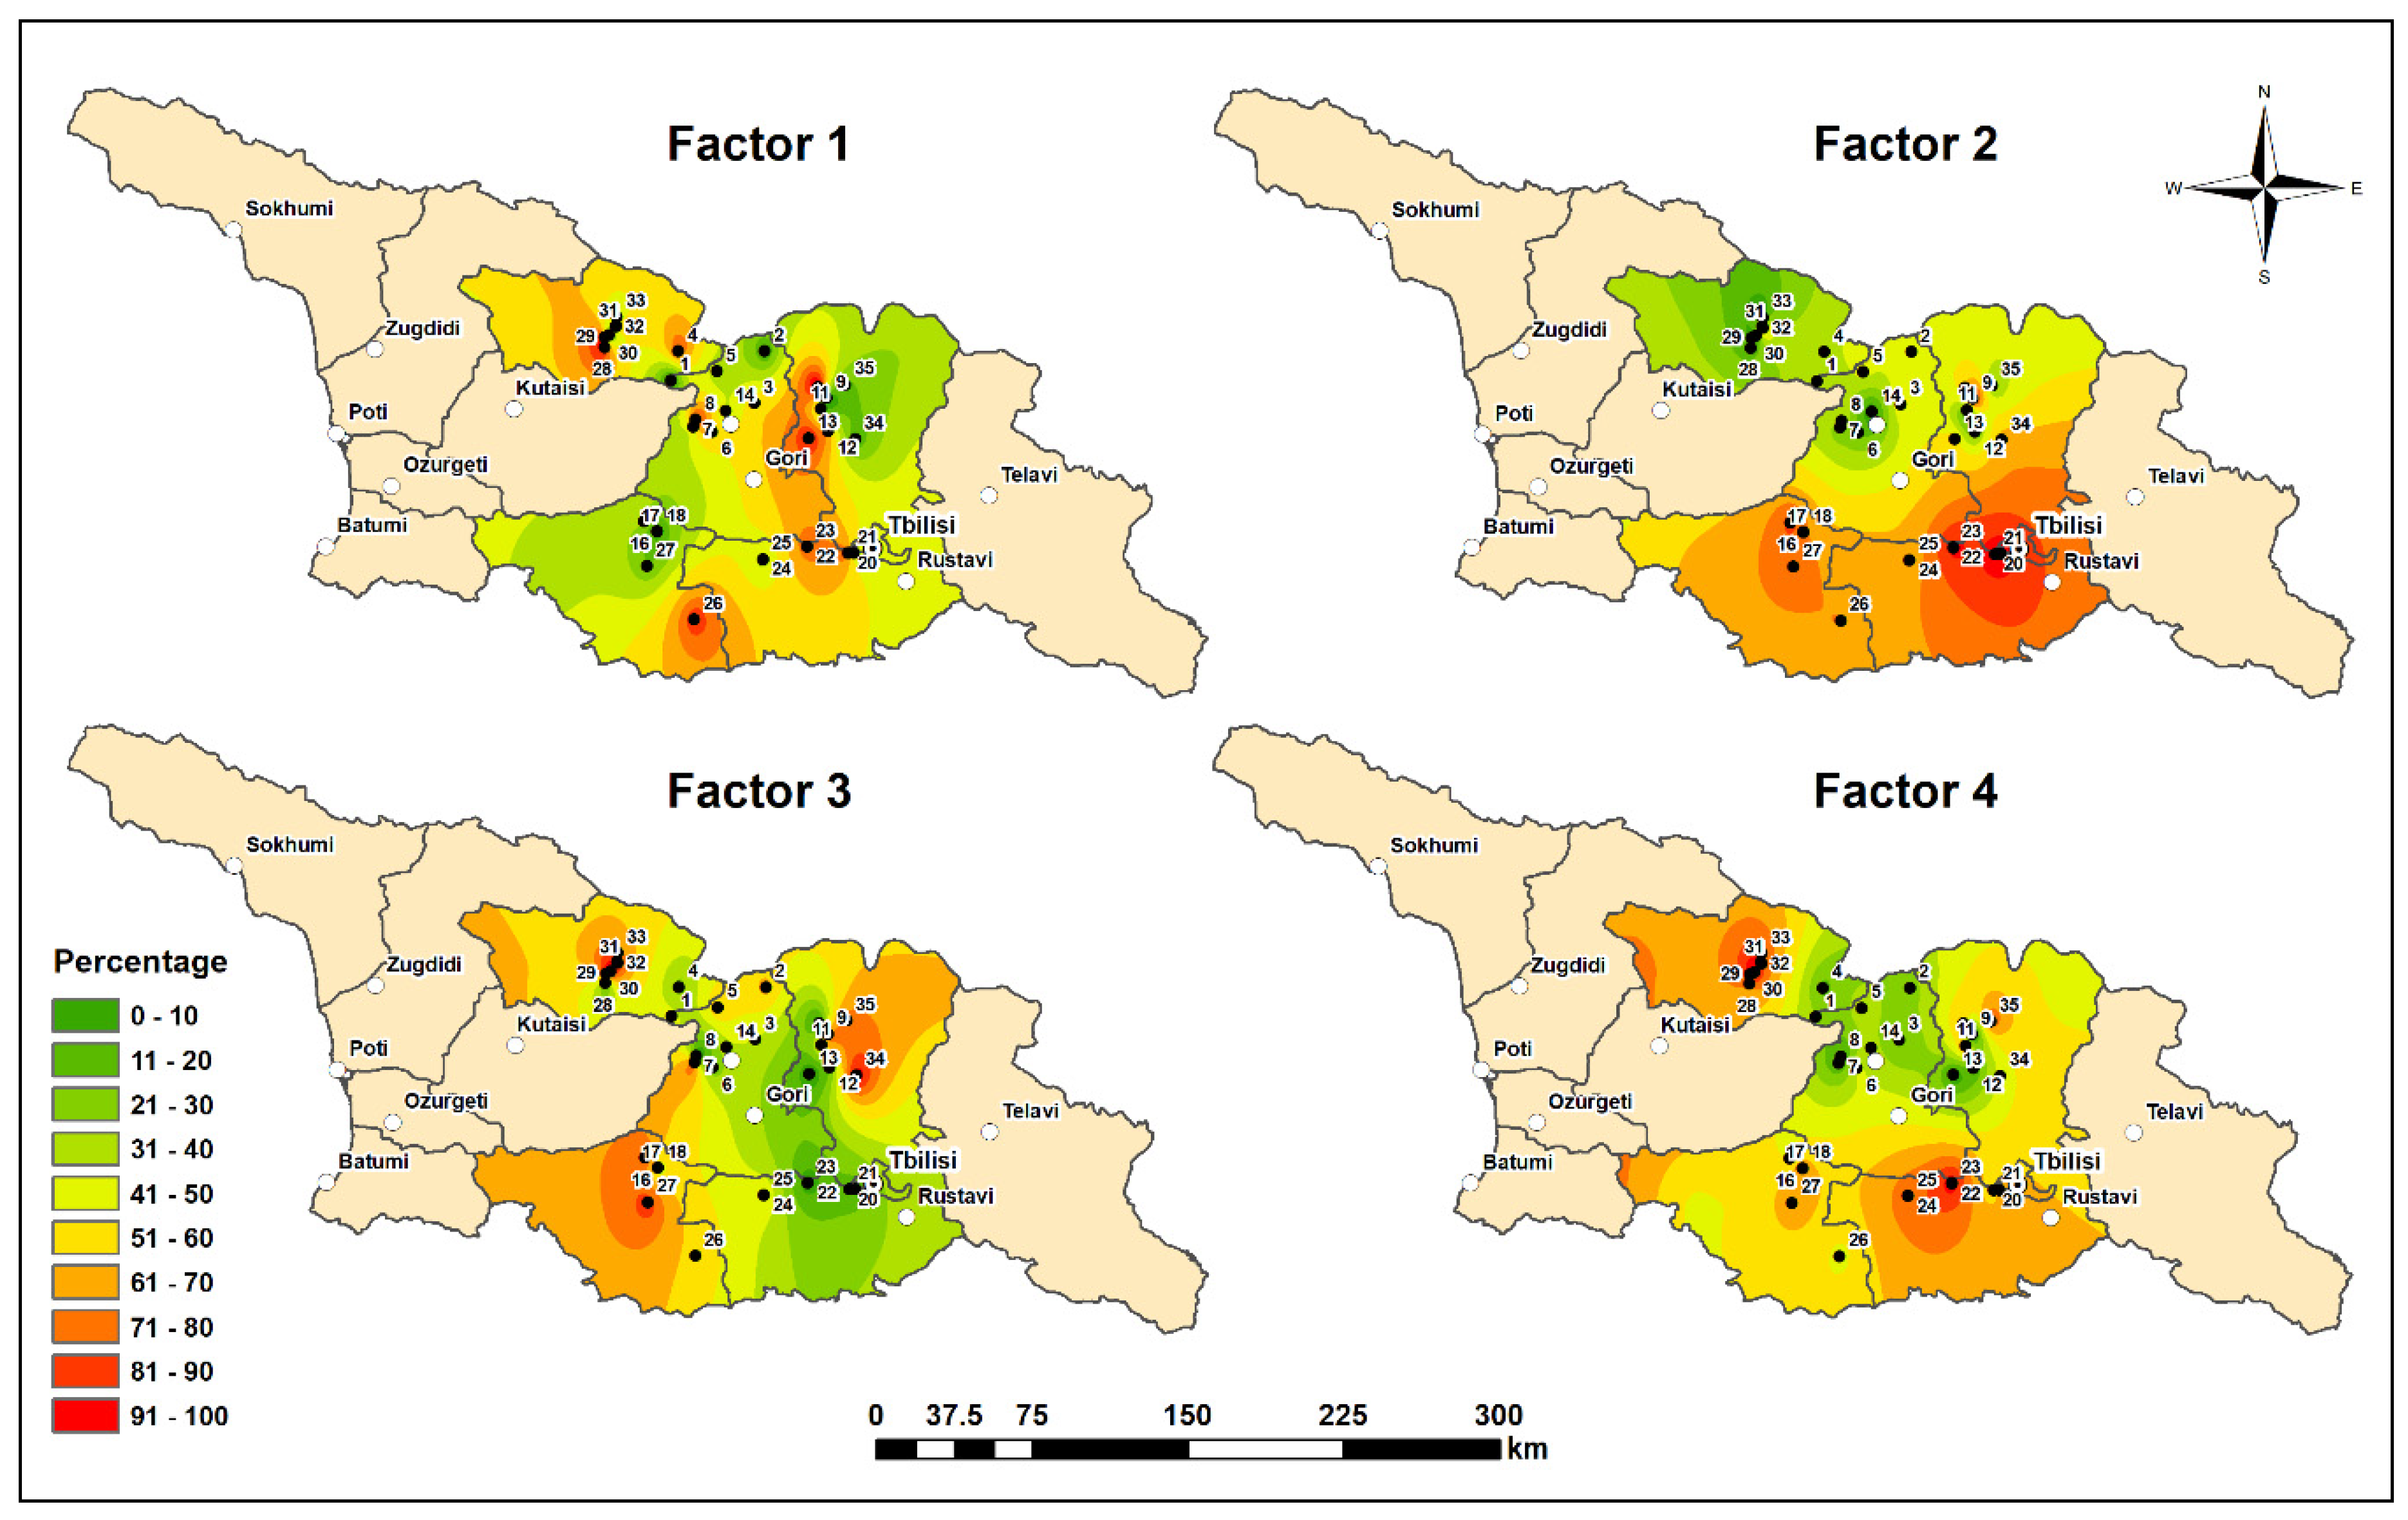
The results of factor scores are presented in the form of distribution geographic information system (GIS) maps. See Figure 4.
Factor 1 is loaded with Na, Al, Sc, Ti, V, Cr, Fe, Co, Ni, Th, and U, and represents mainly a combination of light and heavy crust component elements in the form of soil dust. It has almost 35% of the total variability and is the strongest factor (Figure 5). The contents of these elements in the moss samples are significantly influenced by the mineral particles that are carried into the atmosphere by winds, and their spatial distribution mainly depends on urban activities that are not related to industrial activities. High contents of elements of this geochemical association have been found in samples taken from the sampling points 28–29 (Racha-Lechkhumi and Kvemo Svaneti region, Ambrolauri municipality); 4 (Racha-Lechkhumi and Kvemo Svaneti region, Oni municipality); 10 (Mtskheta-Mtianeti region, Akhalgori municipality); 13 (Mtskheta-Mtianeti region, Akhalgori municipality); 22–23 (Kvemo Kartli region, Tetritskaro municipality); and 26 (Samtskhe-Javakheti region, Ninotsminda municipality).
Factor 2 contains Cl, K, Zn, Se, Br, I, and Cu and represents a combination of two sub-factors, a marine one: halogens Cl, Br, I and Se [22], and the second one possibly is due of some local agricultural activity. Zinc, potassium and copper are essential elements for several biochemical processes in plants [23]. The concentrations of heavy metals such as zinc and copper in the environment are currently increasing, due mainly to human activities. Copper is still used for protecting purposes in agriculture: it prevents and cure diseases, which can have adverse effects on crop yields and quality. Factor 3 includes As (0.89), Sb (0.85), and W (0.72) which are characteristic for ores used for arsenic extraction. In particular, in the village of Uravi (Ambrolaur region, Western Georgia) a mining and chemical factory functioned during the Soviet era. Arsenic has been mined and processed there for almost 60 years.
Factor 4 is represented by Ca (0,80) Cd (0.64), Pb (0.64), and Br (0.65) of local anthropogenic origin due to closeness to urban areas. Lead and cadmium enter the environment in the form of impurities in fertilizers, halides and oxides of these metals, as well as bromides which are contained in the exhaust gases of cars, as part of the waste generated during the extraction and processing of used batteries [24]. The highest contents of these elements are found in the moss samples collected from the sampling points 28–33 (Racha-Lechkhumi and Kvemo Svaneti region, Ambrolauri municipality); 17–18 (Samtskhe-Javakheti region, Borjomi municipality); 27 (Samtskhe-Javakheti region, Akhalkalaki municipality); 22–23 (Kvemo Kartli region, Tetritskaro municipality); 24–25 (Kvemo Kartli region, Tsalka municipality); 9 (Mtskheta-Mtianeti region, Akhalgori municipality); and 35 (Mtskheta-Mtianeti region, Dusheti municipality).

4. Conclusions

For the first time atmospheric deposition of trace elements using moss biomonitoring technique was studied in Central Georgia in 2019. By the comparison of the obtained values for a broad set of elements (Al, As, Ba, Ca, Cd, Co, Cr, Cu, Fe, Hg, K, Li, Mg, Mn, Mo, Ni, Na, Pb, Rb, Sr, V, Zn, Th, and U) with the data from previous surveys in other parts of Georgia and in the countries of the similar climatic conditions (North Macedonia and Bulgaria) it was shown that air pollution in Central Georgia does not exceed mean values for these European countries, whereas data for potentially toxic elements such as As, Cd, Co, Cr, Cu, Ni, Pb, and Zn exceed the ones in Norway used as an example of a pristine country of Europe. Of the four factors, determined by PCA one factor (F4) is purely anthropogenic (Ca, Cd, Pb, and Br) and it is explained by the relevant high factor scores in the urban areas where they may come from fertilizers, halides, and oxides as well as bromides of these metals, which are contained in the exhaust gases of cars, as part of the waste generated during the extraction and processing of used batteries, etc. High As and W loadings in factor 3 are explained by intense mining activity for more than 60 years of As extraction from ores rich in this element and accompanying elements such as antimony and tungsten. A strong marine component (Cl, Br, I, and Se) in factor 2 is provided by the location of Georgia between two seas—the Black and the Caspian ones. In this factor 2 elements of marine component are mixed with Zn, K, and Cu due to most probably agricultural activity. Factor 1 represents mainly a combination of light and heavy crust component elements in the form of soil dust.

Author Contributions

Conceptualization, O.C., I.N., K.K., Y.L. and M.F.; Formal analysis, O.C.; Investigation, I.N., K.K., Y.L., A.B., K.V. and D.G.; Methodology, M.F.; Software, O.C.; Writing—original draft, M.F.; Writing—review & editing, I.N. and K.K. All authors have read and agreed to the published version of the manuscript.

Funding

This research was supported by the grant of the Plenipotentiary of Georgia at JINR in 2020 (Order #37 of 22.01.2020).

Data Availability Statement

Not applicable.

Acknowledgments

This research was supported by the grant of the Plenipotentiary of Georgia at JINR in 2020 (Order #37 of 22.01.2020). The authors express their gratitude to Richard Hoover for editing the English.

Conflicts of Interest

The authors declare no conflict of interest.

References

  1. Cohen, A.; Brauer, M.; Burnett, R.; Anderson, H.R.; Frostad, J.; Estep, K.; Balakrishnan, K.; Brunekreef, B.; Dandona, L.; Dandona, R.; et al. Estimates and 25-year trends of the global burden of disease attributable to ambient air pollution: An analysis of data from the Global Burden of Diseases Study 2015. Lancet 2017, 389, 1907–1918. [Google Scholar] [CrossRef] [Green Version]
  2. Directive 2004/107/EC of the European parliament and of the council of 15 December 2004 relating to arsenic, cadmium, mercury, nickel and polycyclic aromatic hydrocarbons in ambient air. Off. J. Eur. Union 2005, 23, 1–16.
  3. Directive2008/50/EC of the European parliament and of the council of 21 May 2008 on ambient air and cleaner air for Europe. Off. J. Eur. Union 2008, 152, 1–44.
  4. Markert, B.A.; Breure, A.M.; Zechmeister, H.G. Definitions, strategies and principles for bioindications/biomonitoring of the environment. In Bioindicators & Biomonitors; Markert, B.A., Breure, A.M., Zechmeister, H.G., Eds.; Elsevier Science Ltd.: Amsterdam, The Netherlands, 2003; pp. 3–41. [Google Scholar]
  5. Frontasyeva, M.; Harmens, H.; Uzhinskiy, A.; Chaligava, O.; Participants of the Moss Survey. Mosses as Biomonitors of Air Pollution: 2015/2016 Survey on Heavy Metals, Nitrogen and POPs in Europe and beyond; Report of the ICP Vegetation Moss Survey Coordination Centre; Joint Institute for Nuclear Research: Dubna, Russian, 2020; p. 136. ISBN 978-5-9530-0508-1. [Google Scholar]
  6. Shetekauri, L.S.; Shetekauri, T.; Kvlividze, A.; Chaligava, O.; Kalabegeshvili, T.; Kirkesali, E.I.; Frontasyeva, M.V.; Chepurchenko, O.E. Preliminary results of atmospheric deposition of major and trace elements in the Greater and Lesser Caucasus Mountains studied by the moss technique and neutron activation analysis. Ann. Bot. 2015, 89–95. [Google Scholar] [CrossRef]
  7. Shetekauri, S.; Chaligava, O.; Shetekauri, T.; Kvlividze, A.; Kalabegishvili, T.; Kirkesali, E.; Frontasyeva, M.V.; Chepurchenko, O.E.; Tselmovich, V.A. Biomonitoring air pollution with moss in Georgia. Polish J. Environ. Stud. 2018, 27, 2259–2266. [Google Scholar] [CrossRef]
  8. Chaligava, O.; Shetekauri, S.; Badawy, W.M.; Frontasyeva, M.V.; Zinicovscaia, I.; Shetekauri, T.; Kvlividze, A.; Vergel, K.; Yushin, N. Trace elements in atmospheric deposition studied by moss biomonitoring using neutron activation analysis and atomic absorption spectrometry in Georgia: Characteristics and impacts. Arch. Environ. Contam. Toxicol. 2020. [Google Scholar] [CrossRef]
  9. Van Westen, C.J.; Straatsma, M.; Turdukulov, U.; Feringa, W.F.; Sijmons, K.; Bakhtadze, K.; Janelidze, T.; Kheladze, N. Atlas of Natural Hazards and Risk in Georgia; CENN Caucasus Environmental NGO Network: Tbilisi, Georgia, 2012; ISBN 978-9941-0-4310-9. (In Georgian) [Google Scholar]
  10. UNISDR (United Nations Office for Disaster Risk Reduction). Central Asia and Caucasus Disaster Risk Management Initiative (CAC DRMI). Risk Assessment for Central Asia and Caucasus: Desk Study Review; The United Nations Office for Disaster Risk Reduction: Geneva, Switzerland, 2009. (In Russian) [Google Scholar]
  11. Gulisashvili, V.Z. Natural Zones and Natural-Historical Regions of the Caucasus; Nauka: Moscow, Russia, 1964; 327p. (In Russian) [Google Scholar]
  12. Melikishvili, G.A.; Lordkipanidze, O.D.; Academy of Sciences of the Georgian SSR. Essays on the history of Georgia. In Javakhishvili Institute of History, Archeology and Ethnography. Date of Admission to EC 27.02.2002; Metsniereba: Tbilisi, Georgia, 1989; Volume 8. (In Russian) [Google Scholar]
  13. Special Report—“Right to Clean Air (Air Quality in Georgia)”. Public Defender (Ombudsman) of Georgia. Available online: https://www.ombudsman.ge/geo/spetsialuri-angarishebi/190627034307spetsialuri-angarishi-ufleba-sufta-haerze-atmosferuli-haeris-khariskhi-sakartveloshi (accessed on 30 December 2020).
  14. Gurguliani, I. Arsenic Contamination in Georgia, Environment Related Security Risks from old Soviet Legacy. In Proceedings of the 22nd OSCE Economic and Environmental Forum “Responding to Environmental Challenges with a View to Promoting Cooperation and Security in the OSCE Area”, Vienna, Austria, 27–28 January 2014; Available online: https://www.osce.org/files/f/documents/a/a/110702.pdf (accessed on 30 December 2020). (In Russian).
  15. Alfthan, B. Outlook on Climate Change Adaptation in the South Caucasus Mountains—2016. 2016. Available online: https://www.weadapt.org/sites/weadapt.org/files/2017/june/caucasus_smd.pdf (accessed on 30 December 2020). (In Russian).
  16. Moss Manual “Heavy Metals, Nitrogen and POPs in European Mosses: 2020 Survey”. Available online: https://icpvegetation.ceh.ac.uk/sites/default/files/ICP%20Vegetation%20moss%20monitoring%20manual%202020.pdf (accessed on 30 December 2020).
  17. Pavlov, S.S.; Dmitriev, A.Y.; Chepurchenko, I.A.; Frontasyeva, M.V. Automation system for measurement of gamma-ray spectra of induced activity for neutron activation analysis at the reactor IBR-2 of Frank Laboratory of Neutron Physics at the Joint Institute for Nuclear Research. Phys. Elem. Part Nucl. 2014, 11, 737–742. Available online: https://link.springer.com/article/10.1134/S1547477114060107 (accessed on 30 December 2020). [CrossRef]
  18. Schaug, J.; Rambaek, J.P.; Steinnes, E.; Henry, R. Multivariate Analysis of Trace Element Data from Moss Samples Used to Monitor Atmospheric Deposition. Atmos. Environ. 1990, 24A, 2625–2631. [Google Scholar] [CrossRef]
  19. Stafilov, T.; Šajn, R.; Barandovski, L.; Andonovska, K.B.; Malinovska, S. Moss biomonitoring of atmospheric deposition study of minor and trace elements in Macedonia. Air Qual. Atmos. Health 2018, 11, 137–152. [Google Scholar] [CrossRef]
  20. Hristozova, G.; Marinova, S.; Svozilík, V.; Nekhoroshkov, P.; Frontasyeva, M.V. Biomonitoring of elemental atmospheric deposition: Spatial distributions in the 2015/2016 moss survey in Bulgaria. J. Radioanal. Nucl. Chem. 2019. [Google Scholar] [CrossRef]
  21. Steinnes, E.; Uggerud, H.T.; Pfaffhuber, K.A.; Berg, T. Atmospheric Deposition of Heavy Metals in Norway; National Moss Survey 2015; NILU—Norwegian Institute for Air Research: Kjeller, Norway, 2016; p. 55. [Google Scholar]
  22. Frontasyeva, M.V.; Steinnes, E. Marine gradients of halogens in moss studied by epithermal neutron activation analysis. J. Radioanal. Nucl. Chem. 2004, 261, 101–106. [Google Scholar] [CrossRef]
  23. Kabata-Pendias, A. Trace Elements in Soils And Plants, 4th ed.; CRC Press/Taylor & Francis Group: Boca Raton, FL, USA, 2010; ISBN 9780429192036,. [Google Scholar] [CrossRef]
  24. Nriagu, J.O. A global assessment of natural sources of atmospheric trace metals. Nature 1989, 338, 47–49. [Google Scholar] [CrossRef]
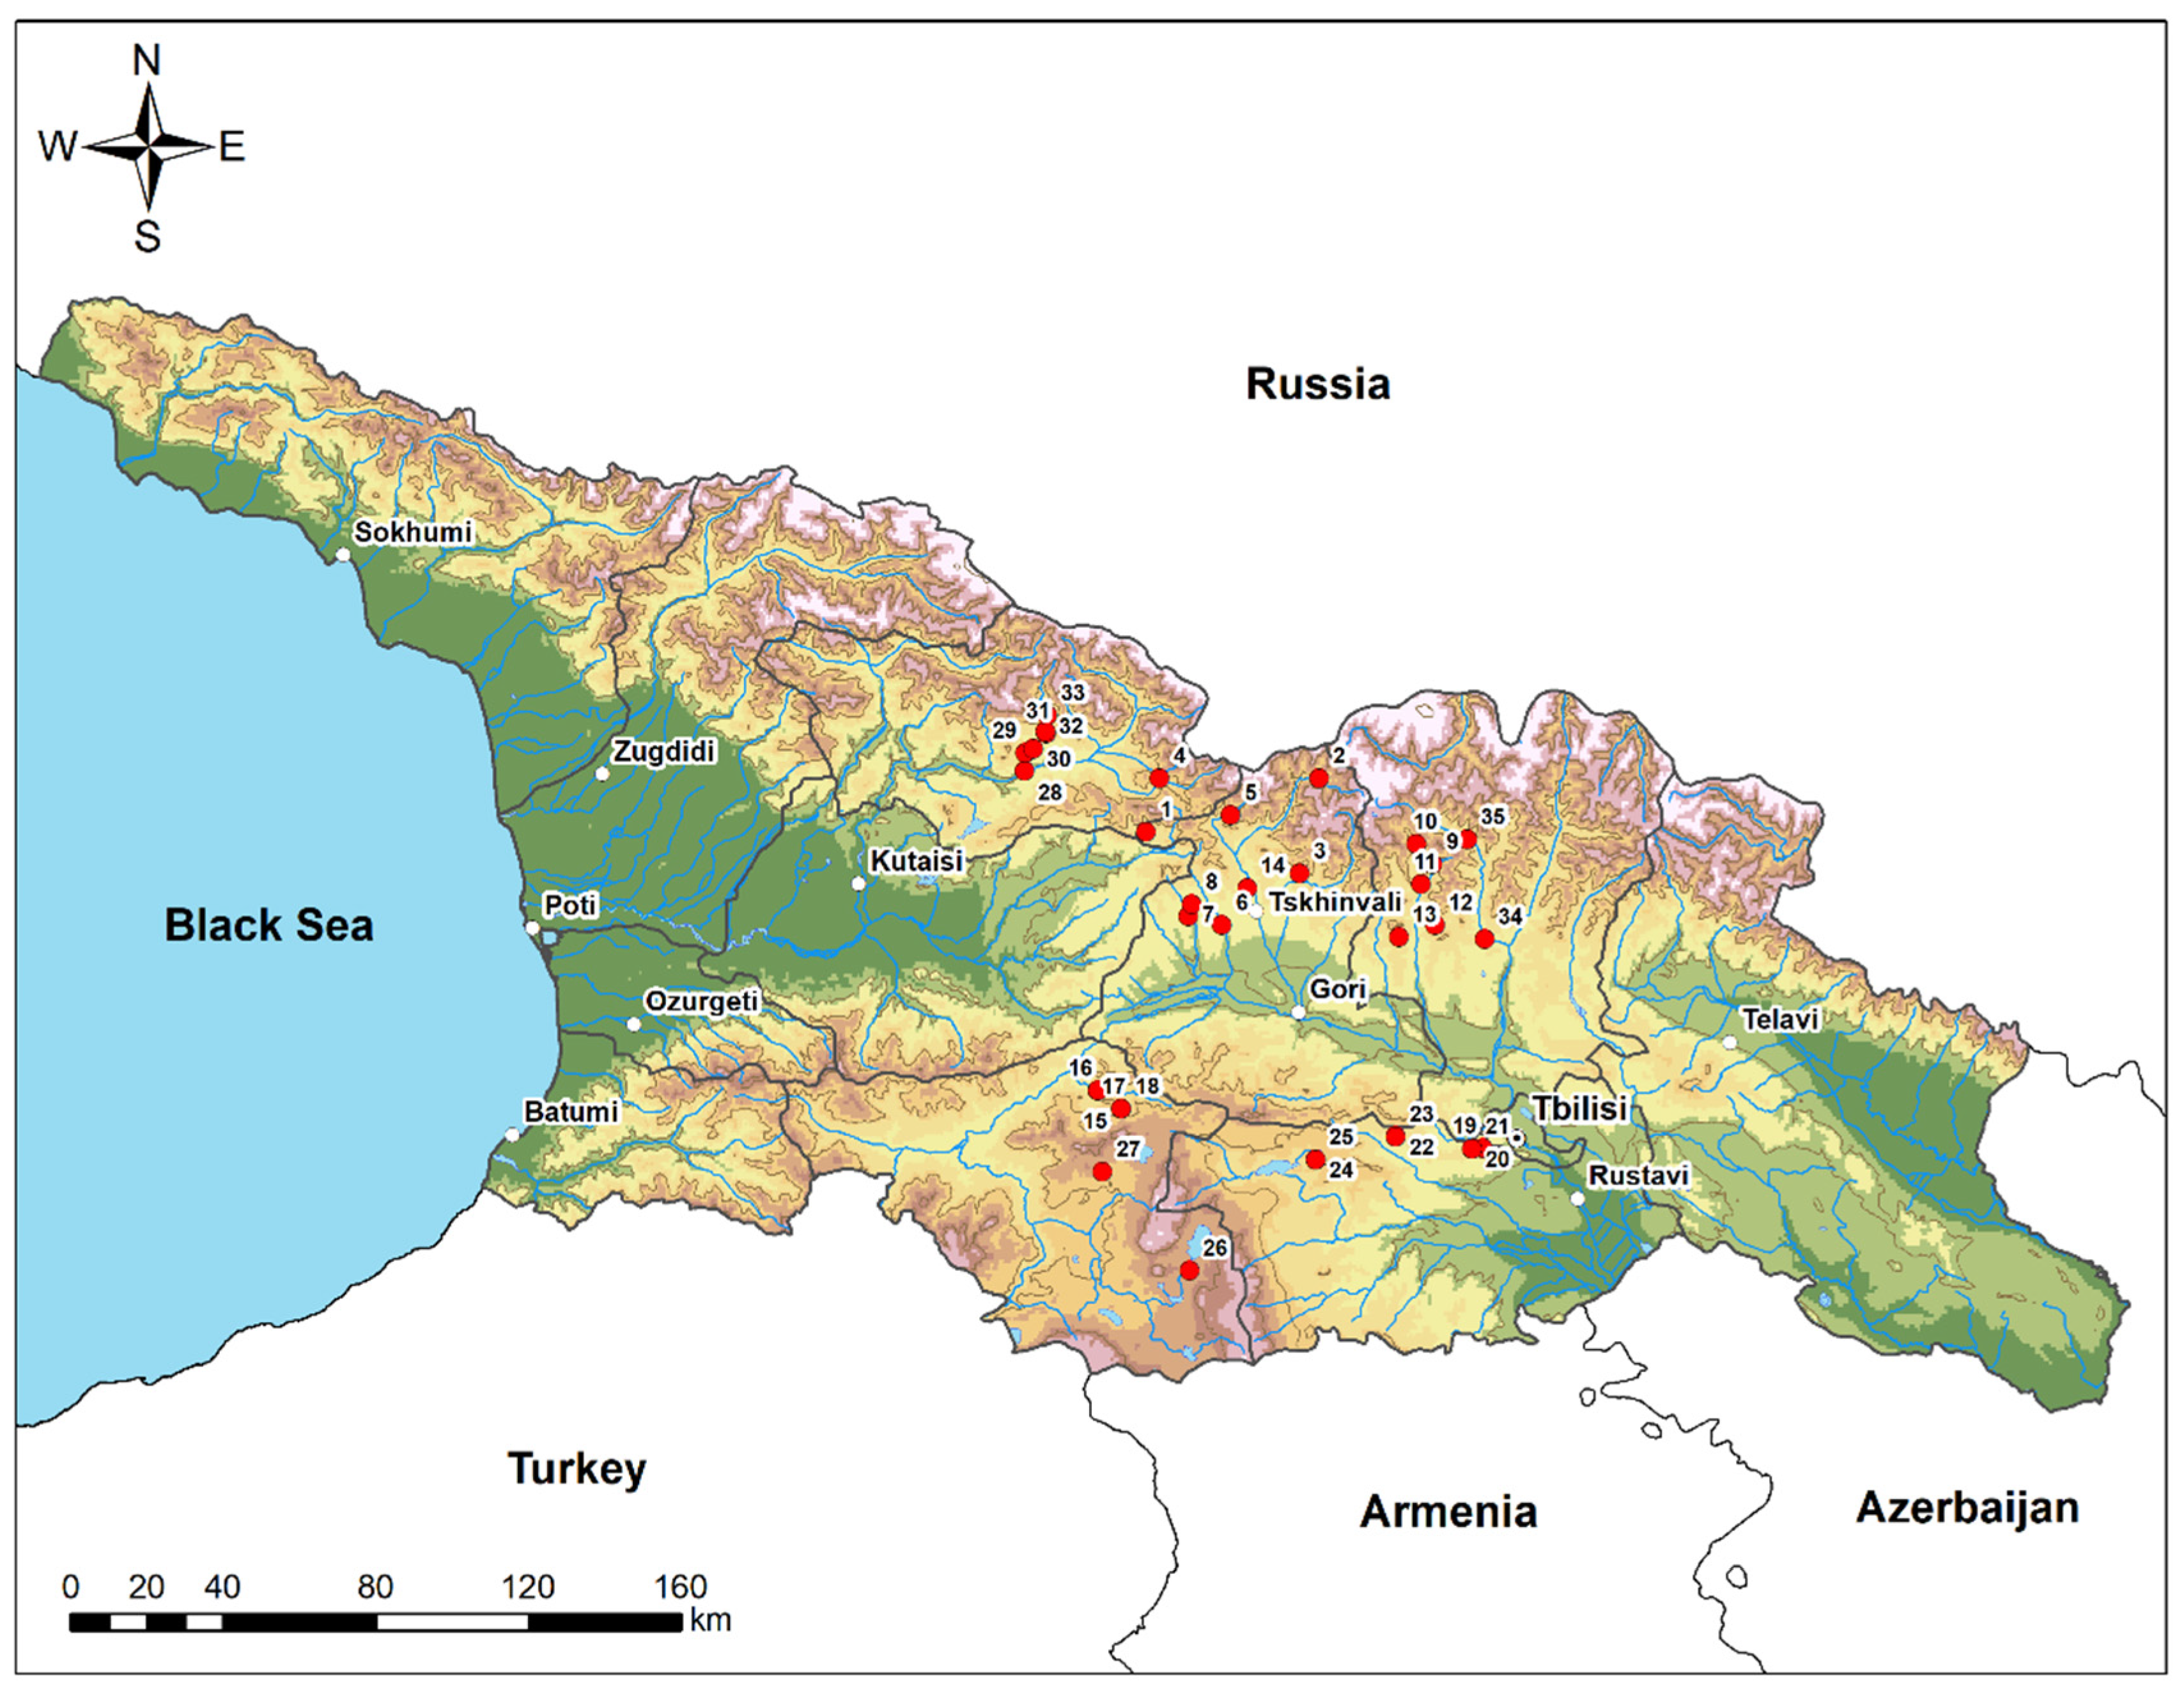
Figure 1. Sampling map.
Atmosphere 12 00317 g001
Figure 2. Ecosystems of South Caucasus [15].
Atmosphere 12 00317 g002
Figure 3. Summary Report for As and some selected elements created byMinitab® 19.
Atmosphere 12 00317 g003aAtmosphere 12 00317 g003b
Figure 4. Factor Loadings, Factor 1 vs. Factor 2 vs. Factor 3. Rotation: Varimax normalized. Extraction: Principal components.
Atmosphere 12 00317 g004
Figure 5. Factor Scores.
Atmosphere 12 00317 g005
Table 1. Epithermal Neutron Activation Analysis (ENAA): obtained and certified values of reference materials, mg/kg.
SRMSampleElementObtainedCertifiedSRMSampleElementObtainedCertified
2709aFFA1Na21,647 ± 160221,900 ± 811FFA12709aRb100.4 ± 16.699.00 ± 2.97
15471575aMg1086.5 ± 59.81060 ± 170FFA12709aSr239.8 ± 21.1239.00 ± 5.98
1632c1633cAl133,841 ± 4016132,800 ± 61092709a1632cZr18.31 ± 4.8616.0 ± 4.8
15491632cCl1120 ± 771139 ± 412709aFFA1Sb17.92 ± 3.7917.6 ± 2.5
2709aFFA1K22,498 ± 137322,000 ± 660015491547I0.394 ± 0.0990.30 ± 0.09
1633c2709aCa19,711 ± 181419,100 ± 8982709a667Cs7.9 ± 0.37.80 ± 0.71
2709a667Sc13.82 ± 0.3513.7 ± 0.72709a1632cBa41.83 ± 6.0341.1 ± 1.61
1633c2710aTi2928 ± 2053110 ± 726672709aLa21.26 ± 1.1321.7 ± 0.4
1633c1632cV22.79 ± 1.0323.72 ± 0.536672709aCe42.26 ± 2.7942.00 ± 1.01
FFA1667Cr181.6 ± 11.9178 ± 16667FFA1Nd51.44 ± 6.4956.8 ± 3.7
1575a1547Mn97.83 ± 5.9798 ± 36671632cSm1.021 ± 0.0921.078 ± 0.029
FFA12709aFe34,306 ± 178433,600 ± 7066672709aEu0.833 ± 0.0670.83 ± 0.02
2709aFFA1Co39.87 ± 1.3639.8 ± 1.7667FFA1Tb1.285 ± 0.0471.38 ± 0.14
2709a1632cNi9.56 ± 0.769.32 ± 0.52FFA1667Yb2.49 ± 0.232.200 ± 0.091
2709a667Zn177.11 ± 9.04175 ± 13FFA11632cHf0.508 ± 0.0470.585 ± 0.011
FFA11632cAs6.07 ± 0.366.18 ± 0.28667FFA1Ta1.774 ± 0.0552.11 ± 0.17
1632c2709aSe1.02 ± 0.181.5 ± 0.45FFA12709aTh10.95 ± 0.4310.9 ± 0.2
6671632cBr21.08 ± 0.8518.7 ± 0.42709a1632cU0.51 ± 0.030.52 ± 0.02
Table 2. Comparison of the atomic absorption spectrometry (AAS)-obtained heavy metal concentrations with the standard values, mg/kg.
ElementCertifiedObtained
Cd0.54 ± 0.020.54 ± 0.01
Cu5.0 ± 0.104.6 ± 0.3
Pb0.20 ± 0.060.18 ± 0.01
Table 3. Comparison of the results obtained in present study with the countries allocated in relatively the same geographical belt. Norway chosen as a pristine area. Concentration is in mg/kg.
ElementGeorgia, 2019
Present Study
Georgia,
2014–2017 [8]
North Macedonia,
2015 [19]
Bulgaria,
2015/16 [20]
Norway,
2015 [21]
n—number of samplesn = 35n = 120n = 72n = 115n = 229
ElementMedianRangeMedianRangeMedianRangeMedianRangeMedianRange
Na482169–1350581101–3000190140–38022579–1560210 60–800
Mg26401910–442030601220–1160019001200–38002080514–85501350470–3280
Al27701610–96804295759–24,5002100750–74002310569–10,900460100–3050
Cl13256–63518557.3–1080NDND78.816.6–861NDND
K59303970–886059352030–15,00060003100–14,00056703250–14,20035601770–6400
Ca84005490–12,40082554620–17,10069003500–13,0006630606–14,20030301820–7230
Sc0.80.36–2.11.110.17–6.58NDND0.410.10–3.130.090.02–1.4
Ti238129–596349.568.6–2100NDND14346.4–764246–152
V6.53.85–16.29.41.71–543.30.47–113.891.3–22.71.20.3–14
Cr6.63.14–15.57.7514,3375.711,536.002.730.219–250.70.2–17
Mn14264–377141230,30616033–51018039–55140040–1660
Fe24101150–61102725404–14,1001700510–46001190376–724031078–8125
Co10.36–2.61.430.23–8.120.60.16–20.590.197–3.290.2 0.06–23
Ni4.91.6–10.85.561.92–24.23.50.68–632.10.45–13.51.10.4–550
Cu *8.936.58–13.75.540.13–1434.63.0–8.37.363.2–46.884.21.8–370
Zn3220–5428.857.15–75.230дек.66289–101318–409
As0.580.27–27.61.050.18–83.30.540.13–1.40.450.20–3.570.130.04–4.72
Se0.180.09–0.370.230.068–0.65NDND0.20.008–0.670.30.009–2
Br4.41.84–8.16.312.33–25.2NDND2.81.2–9.4NDND
Rb7.24.1–16.410.552.92–34.25.302.02.20287.382.24–50.712.41.4–81
Sr37.624–6843.8517.2–157256.5-2202511.3–12213.63.8–60
Zr9.43.5–2510.551.19–67.9NDNDNDNDNDND
Mo0.570.37–6.30.350.14–2.10.170.08–0.51NDNDNDND
Cd *0.120.058–0.355.570.01–0.580.230.018–0.880.10.02–1.560.080.02–1.33
Sb0.130.07–0.720.150.049–1.36NDND0.110.04–0.510.070.007–0.38
I2.041.14–4.350.160.58–11.8NDND1.280.48–2.99NDND
Cs0.2630.16–0.972.480.036–2.67NDND0.2070.0716–1.80.160.02–1.63
Ba3717–1000.424.98–365429.7–1804614.2–30925 5.3–130
La1.570.82–6.251.30.34–12NDND1.350.39–22.60.320.07–3.5
Ce2.971.38–9.22.150.31–21.7NDND2.40.5–29.20.61 0.10–4.78
Nd1.730.87–7.63.750.45–10.7NDND1.30.2–24.10.23 0.01–2.24
Sm0.260.12–1.172.040.031–2.7NDNDNDND0.050.004–0.38
Eu0.0540.02–0.220.340.023–0.52NDND0.070.009–0.920.040.01–0.19
Tb0.040.02–0.150.10.011–0.31NDND0.030.005–0.420.01<0.001–0.09
Yb0.150.054–0.510.050.022–0.8NDND0.10.03–1.080.003<0.001–0.016
Hf0.240.11–0.760.150.041–1.81NDND0.160.04–1.44NDND
Ta0.0460.02–0.130.270.0069–0.28NDND0.040.009–0.28NDND
W0.140.04–0.410.060.026–0.67NDND0.10.02–1.44NDND
Pb *4.332.34–8.210.110.18–9.14.92.2–1410.73.72–102.80.050.001–0.4
Th0.450.18–1.570.510.063–2.9NDND0.390.09–2.80.030.007–1.5
U0.120.06–0.340.160.021–1.25NDND0.120.03–3.20.0060.002–0.08
* Elements determined by AAS marked with asterisks.
Table 4. Rotated factor loadings for the Central Georgia data set (36 samples). Varimax normalized. Extraction: Principal components (Marked loadings are > 0.6).
VariableFactor 1Factor 2Factor 3Factor 4Communality
Na0.720.210.530.210.98
Al0.82−0.16−0.15−0.431.00
Cl−0.100.830.040.190.92
K−0.080.870.18−0.060.81
Ca0.270.03-0.05−0.800.80
Sc0.930.070.190.141.00
Ti0.93−0.070.21−0.120.98
V0.86−0.07−0.07−0.300.99
Cr0.900.140.180.190.99
Fe0.940.050.200.111.00
Co0.690.010.380.280.94
Ni0.670.340.320.400.97
Zn0.100.780.20−0.120.83
As0.300.070.89−0.120.97
Se0.070.69−0.090.540.92
Br0.190.650.000.650.94
Sb0.340.240.850.000.98
I0.180.74−0.080.540.96
Th0.90−0.050.290.060.89
U0.850.050.410.151.00
Cd0.270.490.100.641.00
Pb0.190.260.120.710.91
Cu−0.070.800.060.270.92
W0.260.030.720.320.84
Expl.Var8.394.753.103.4919.72
Prp.Totl0.350.200.130.150.82
Publisher’s Note: MDPI stays neutral with regard to jurisdictional claims in published maps and institutional affiliations.