
Which Meteorological and Climatological Information Is Requested for Better Surfing Experiences? A Survey-Based Analysis


Abstract
1. Introduction
2. Data and Methods
2.1. Survey Description and Target Audience
2.2. Survey Analysis
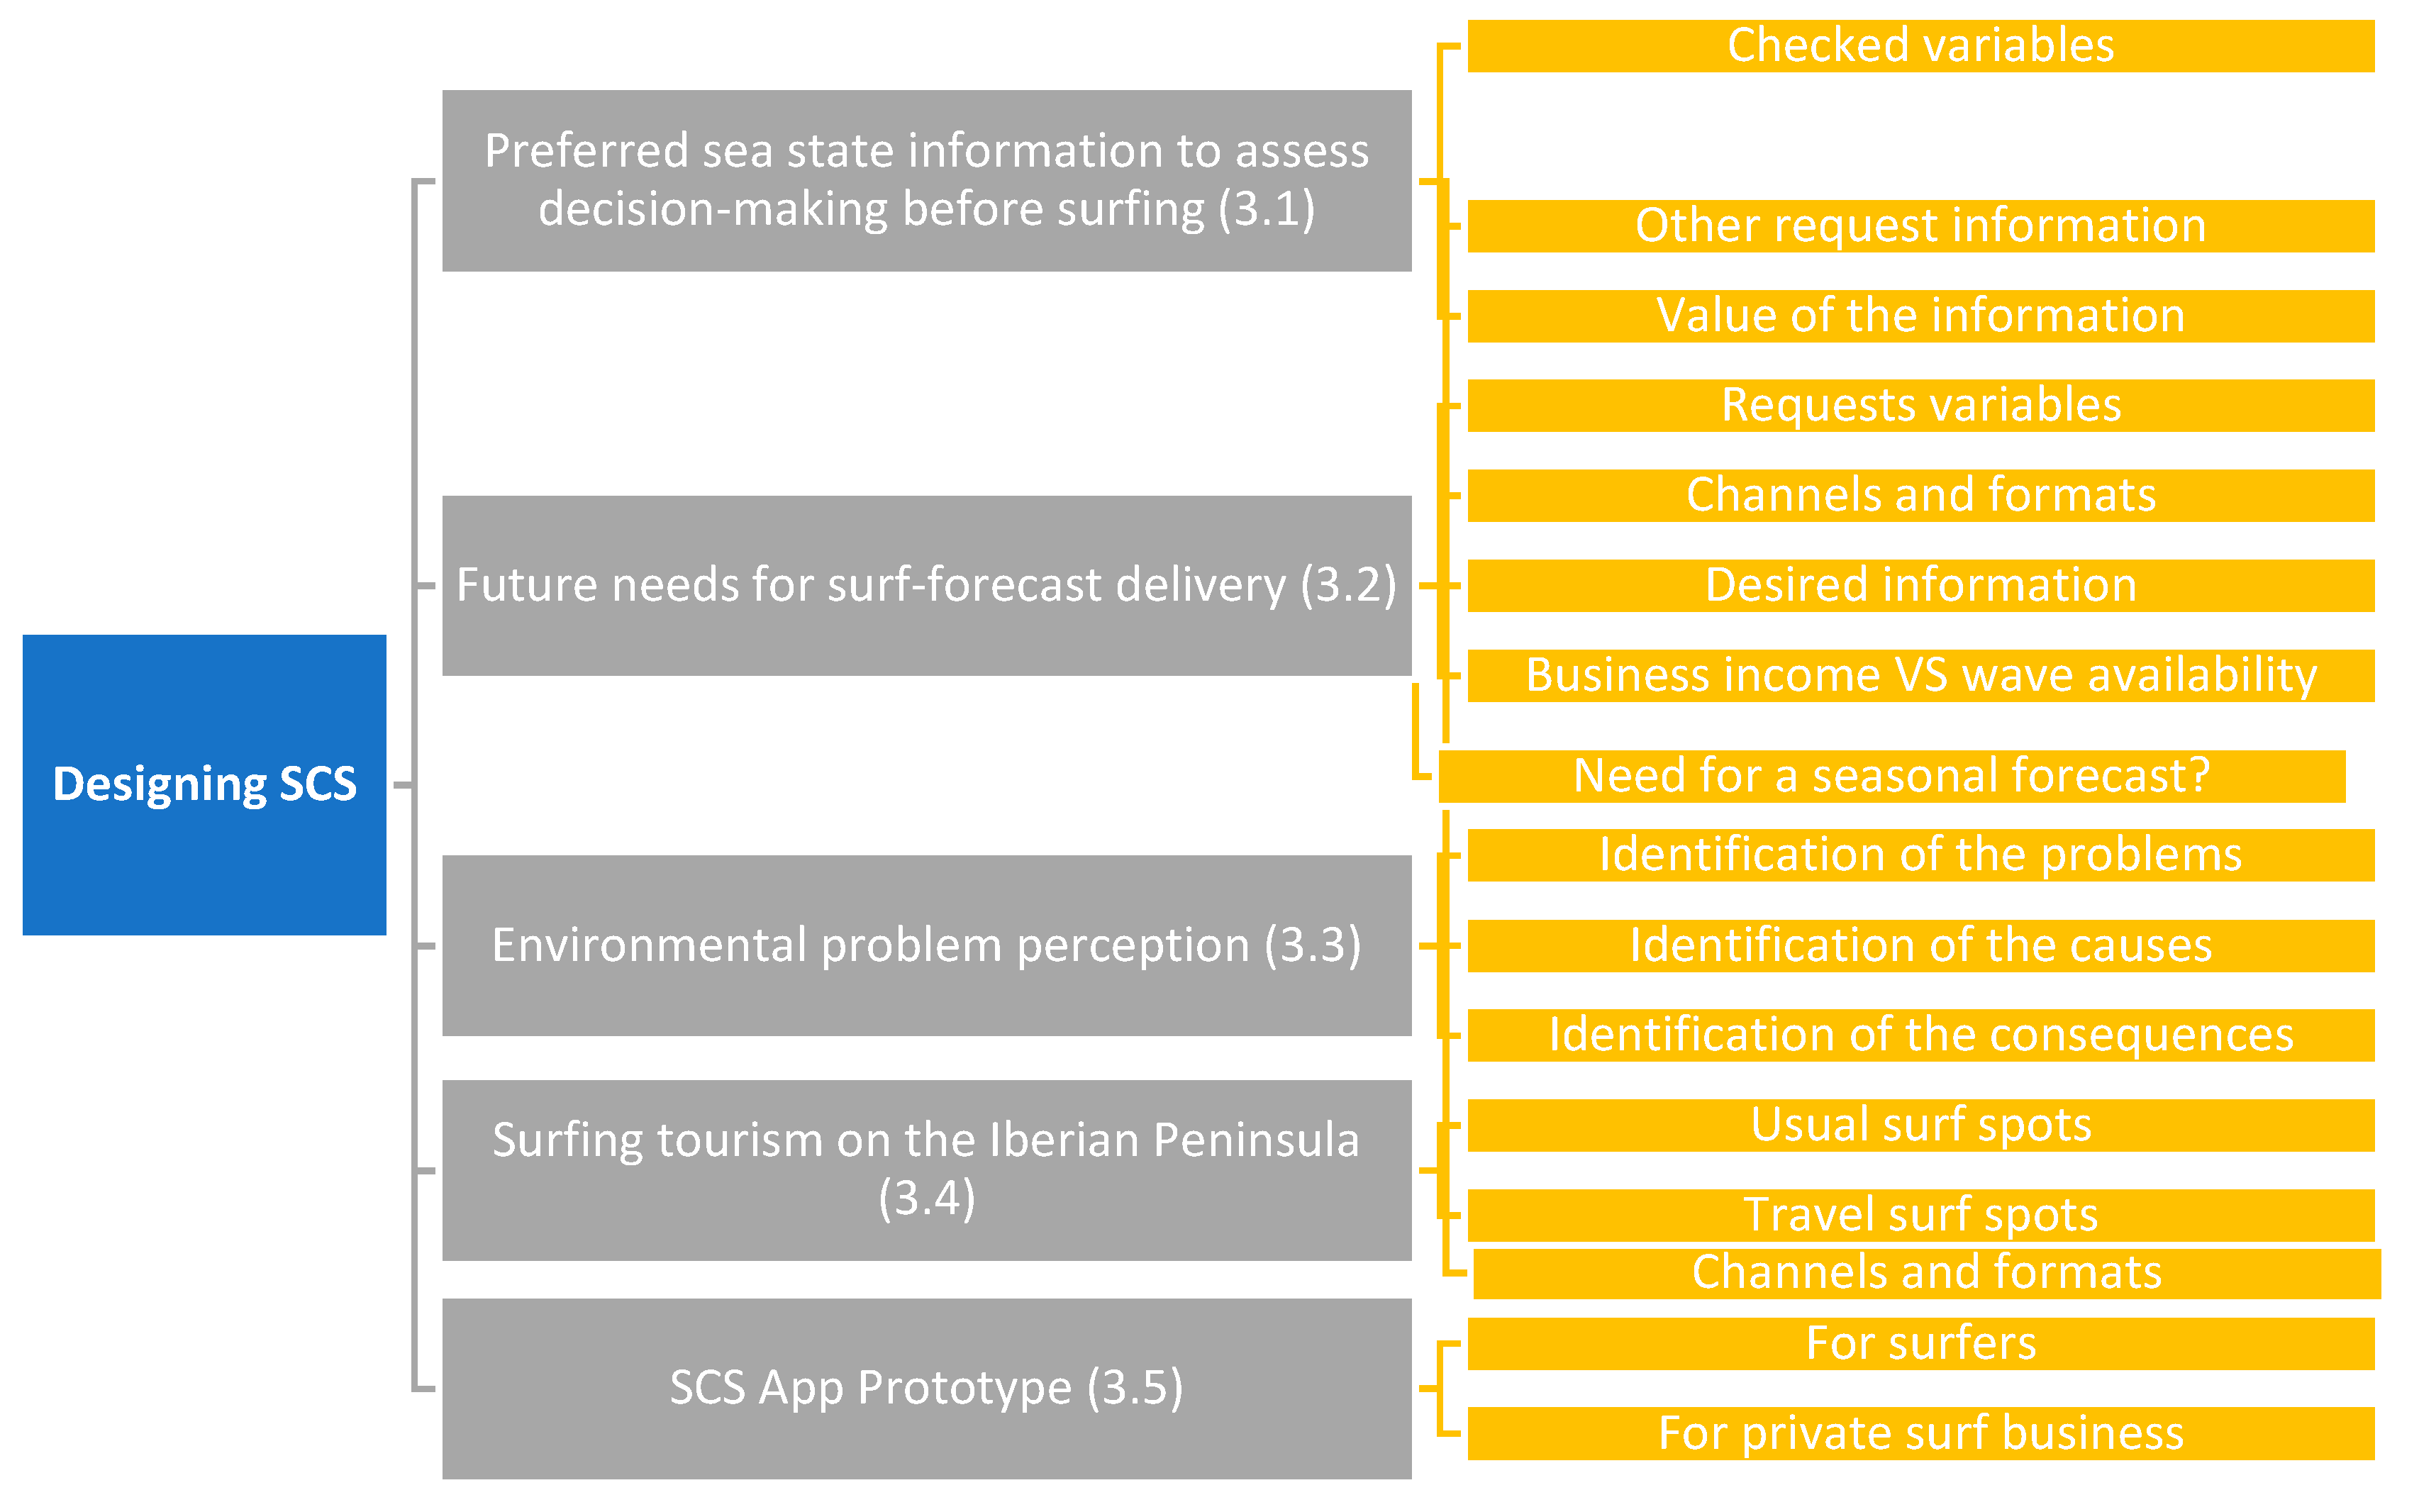
3. Results
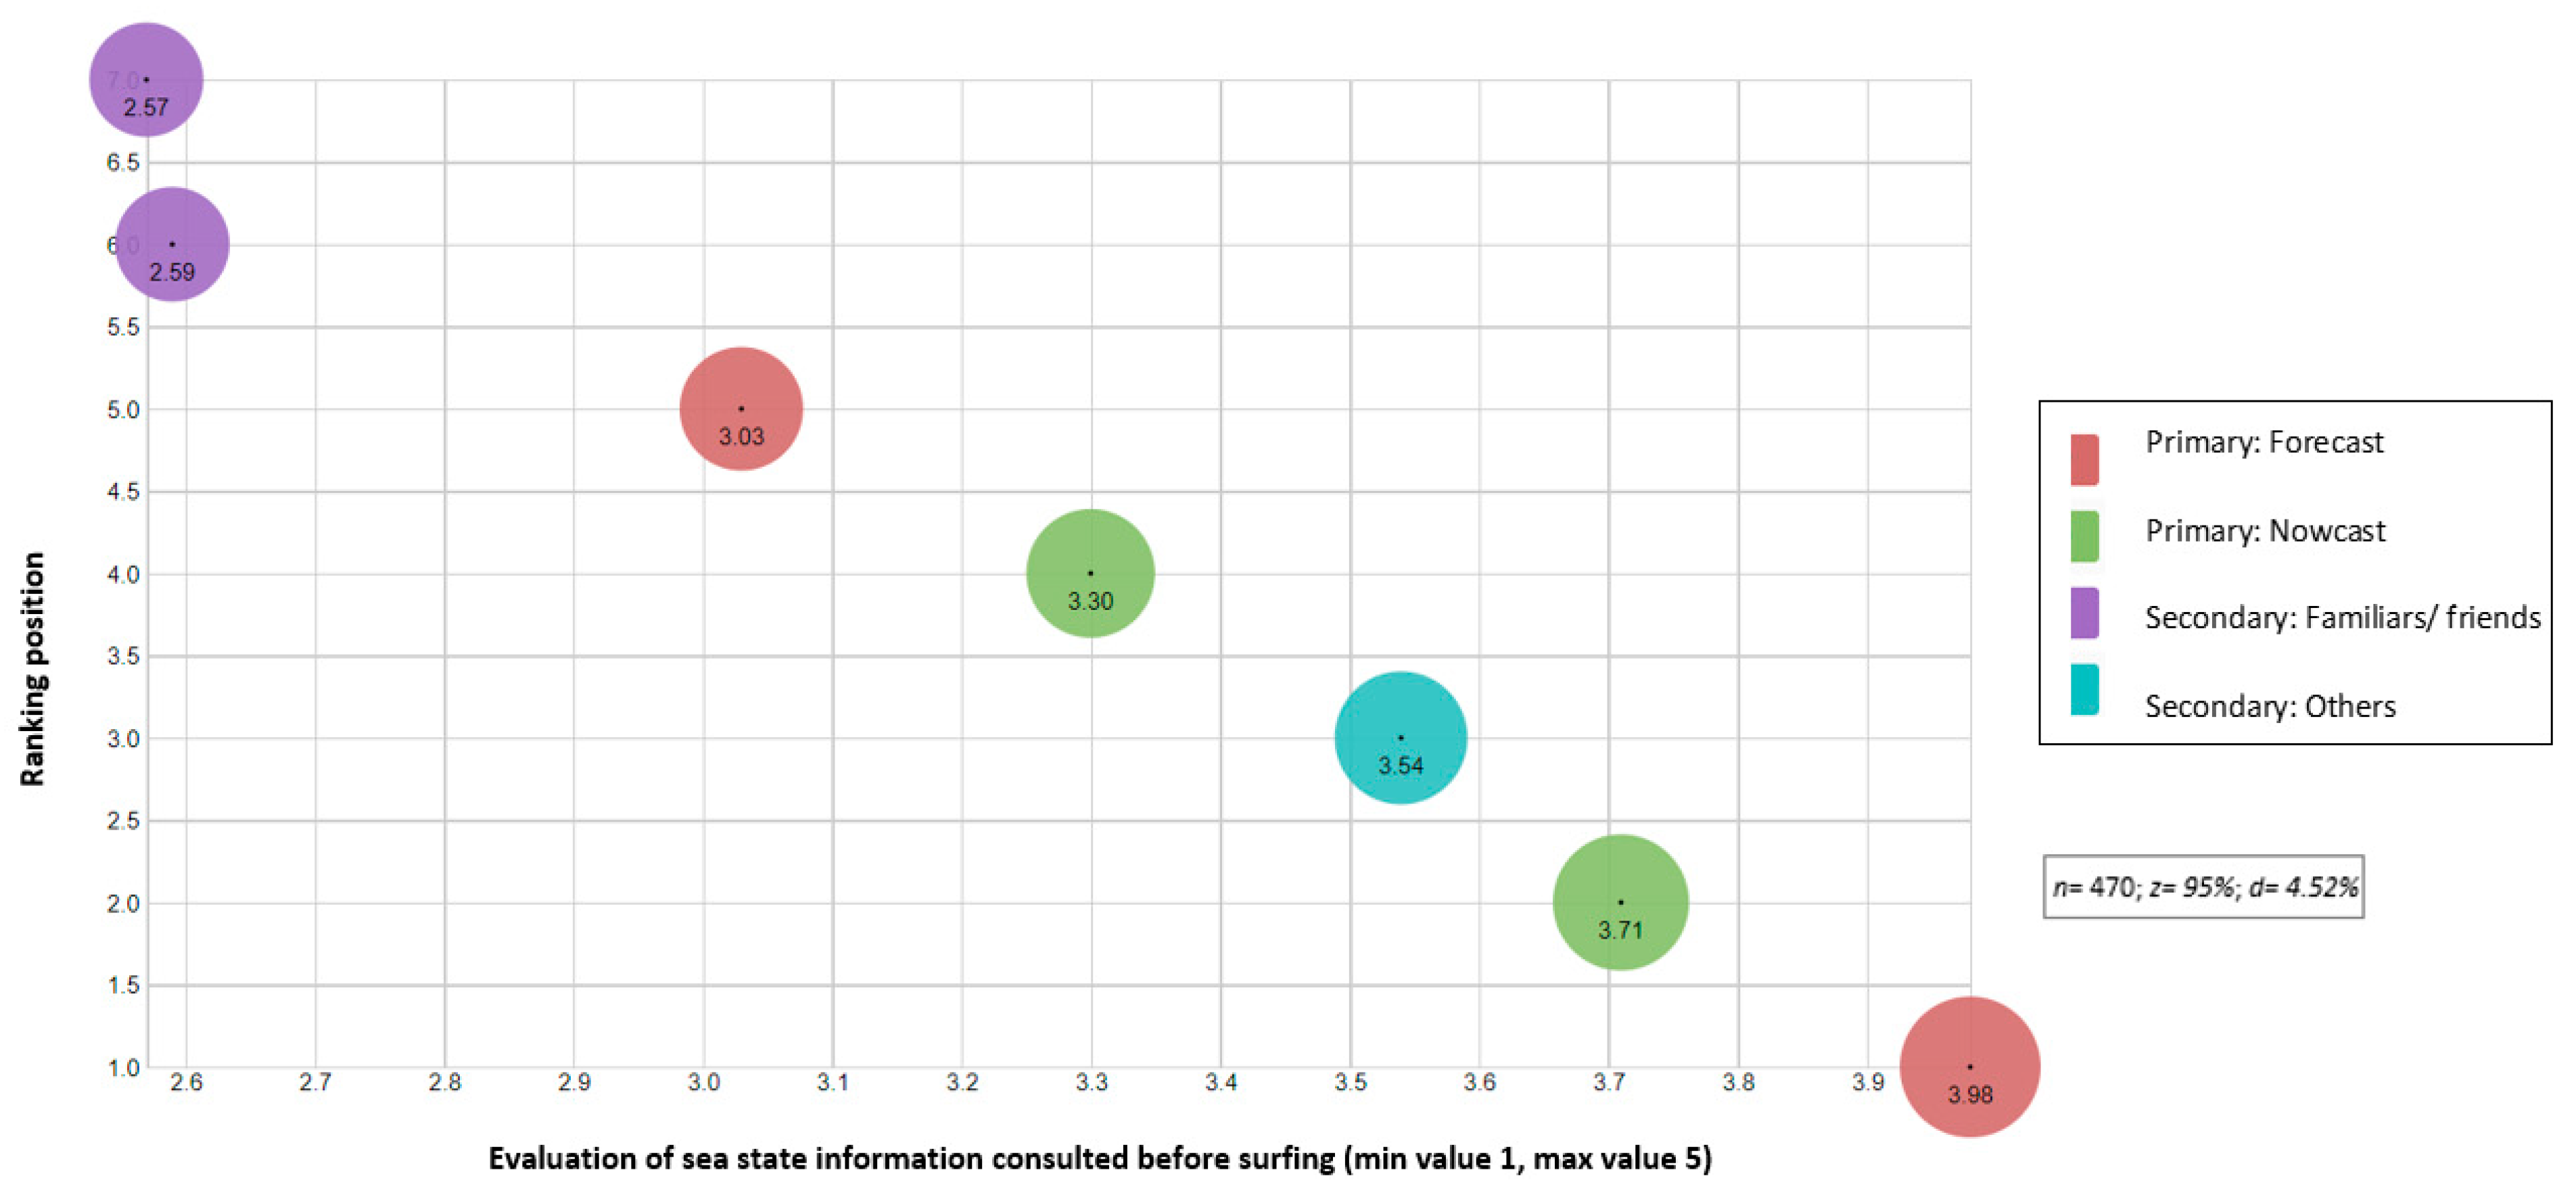
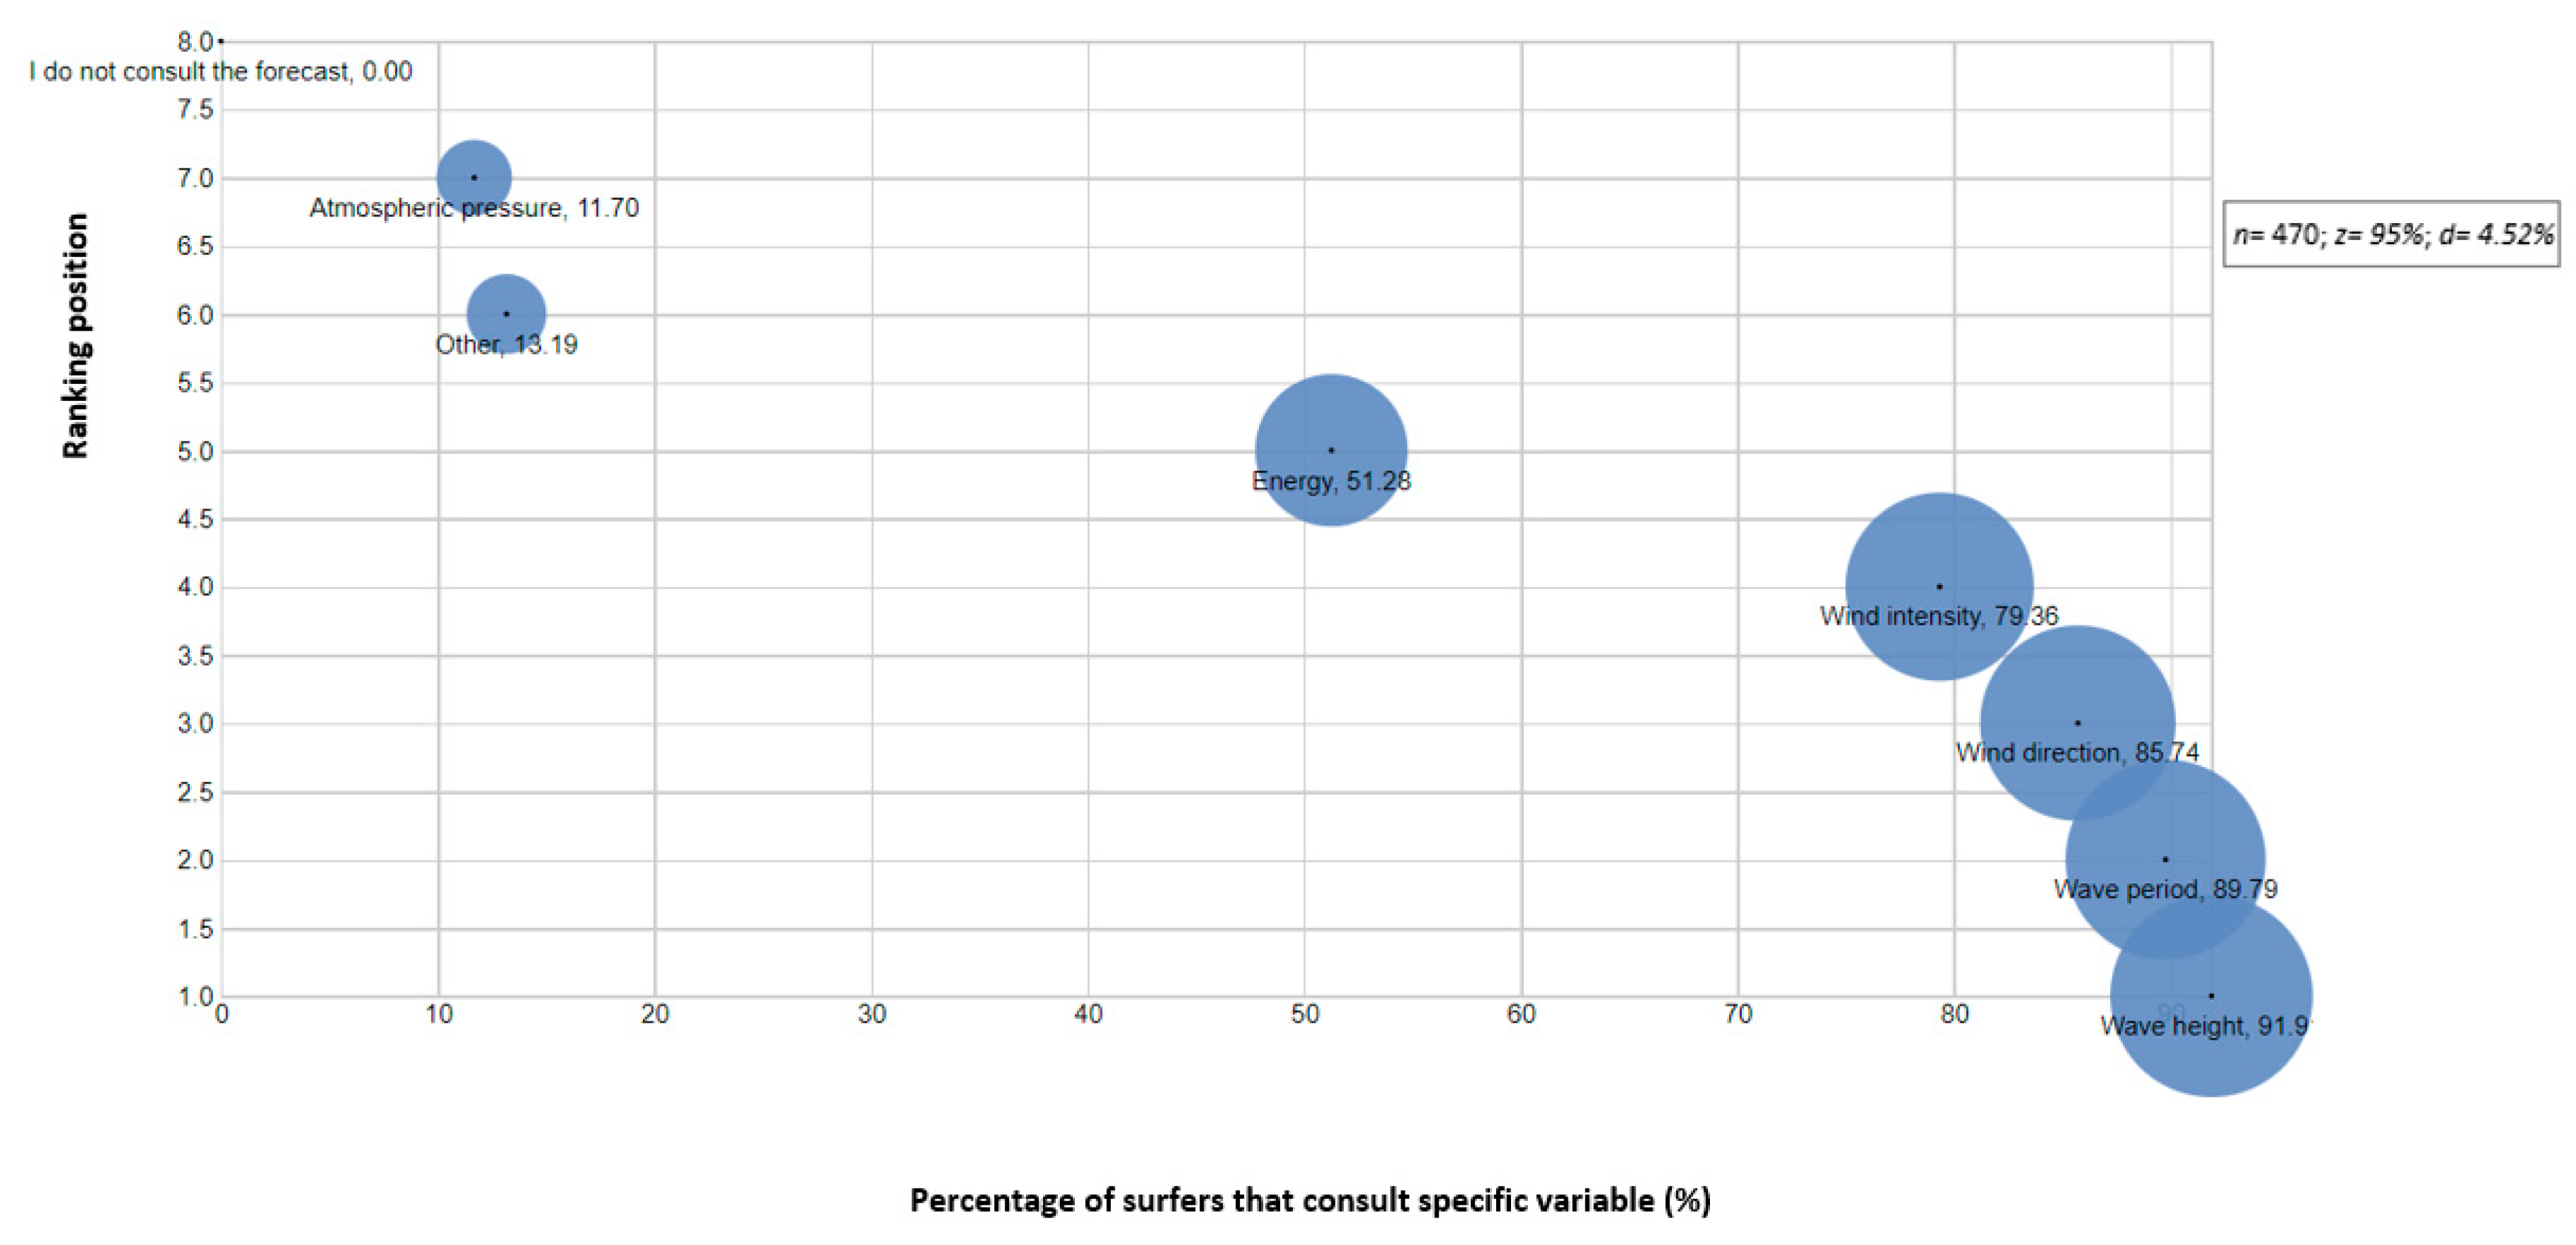
3.1. Preferred Sea-State Information to Assess Decision-Making before Surfing
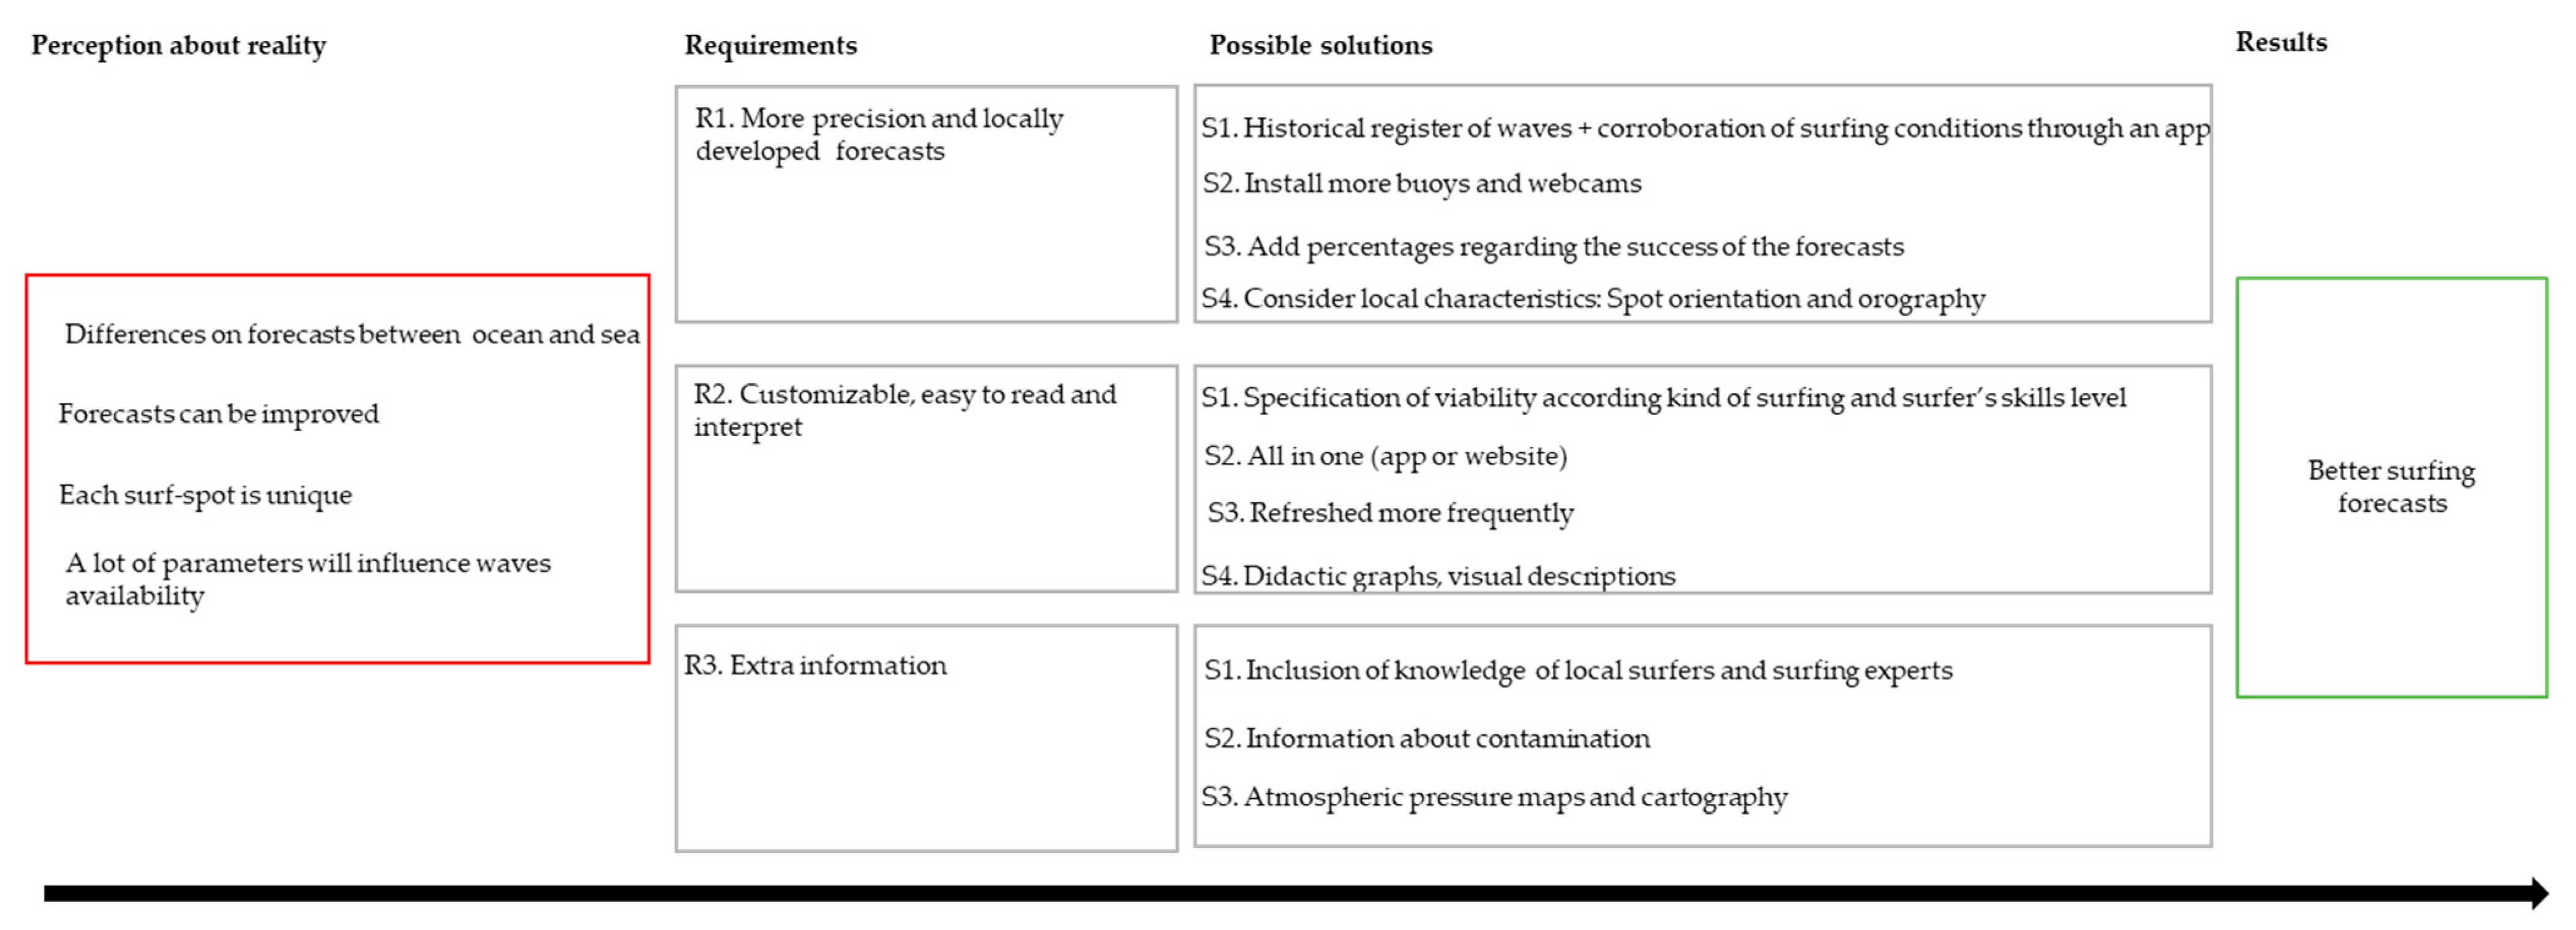
3.2. Future Needs for Surf-Forecast Delivery
3.2.1. Future Needs for Surf-Forecast Delivery for Surfers
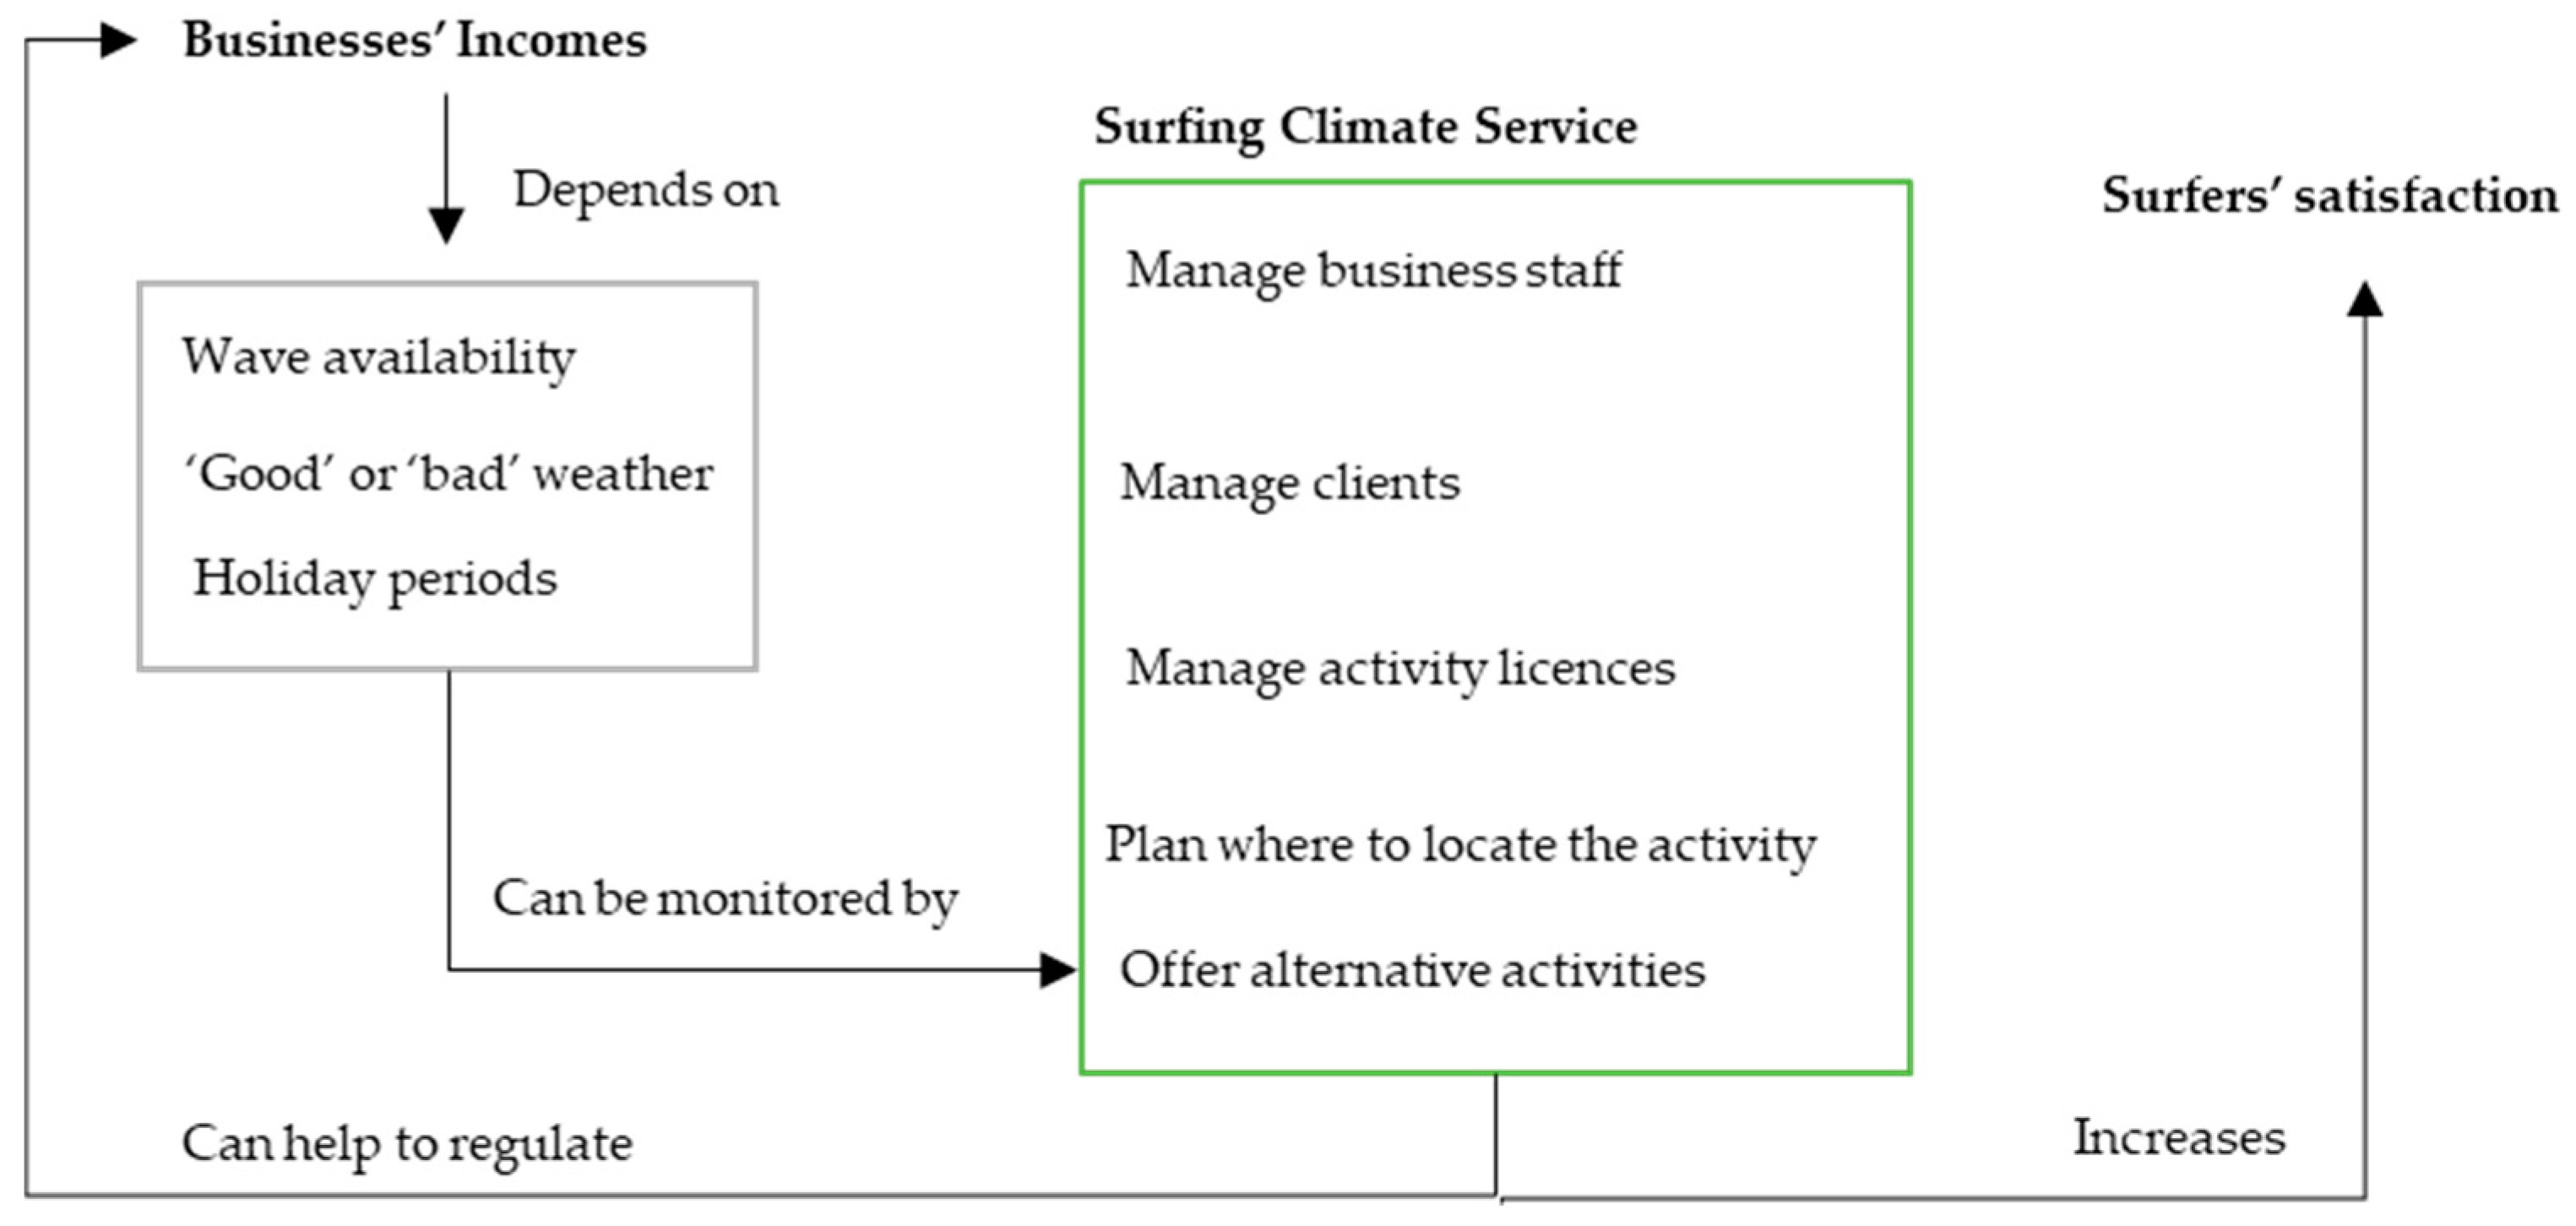
3.2.2. Future Needs for Surf-Forecast Delivery for Private Surfing Businesses
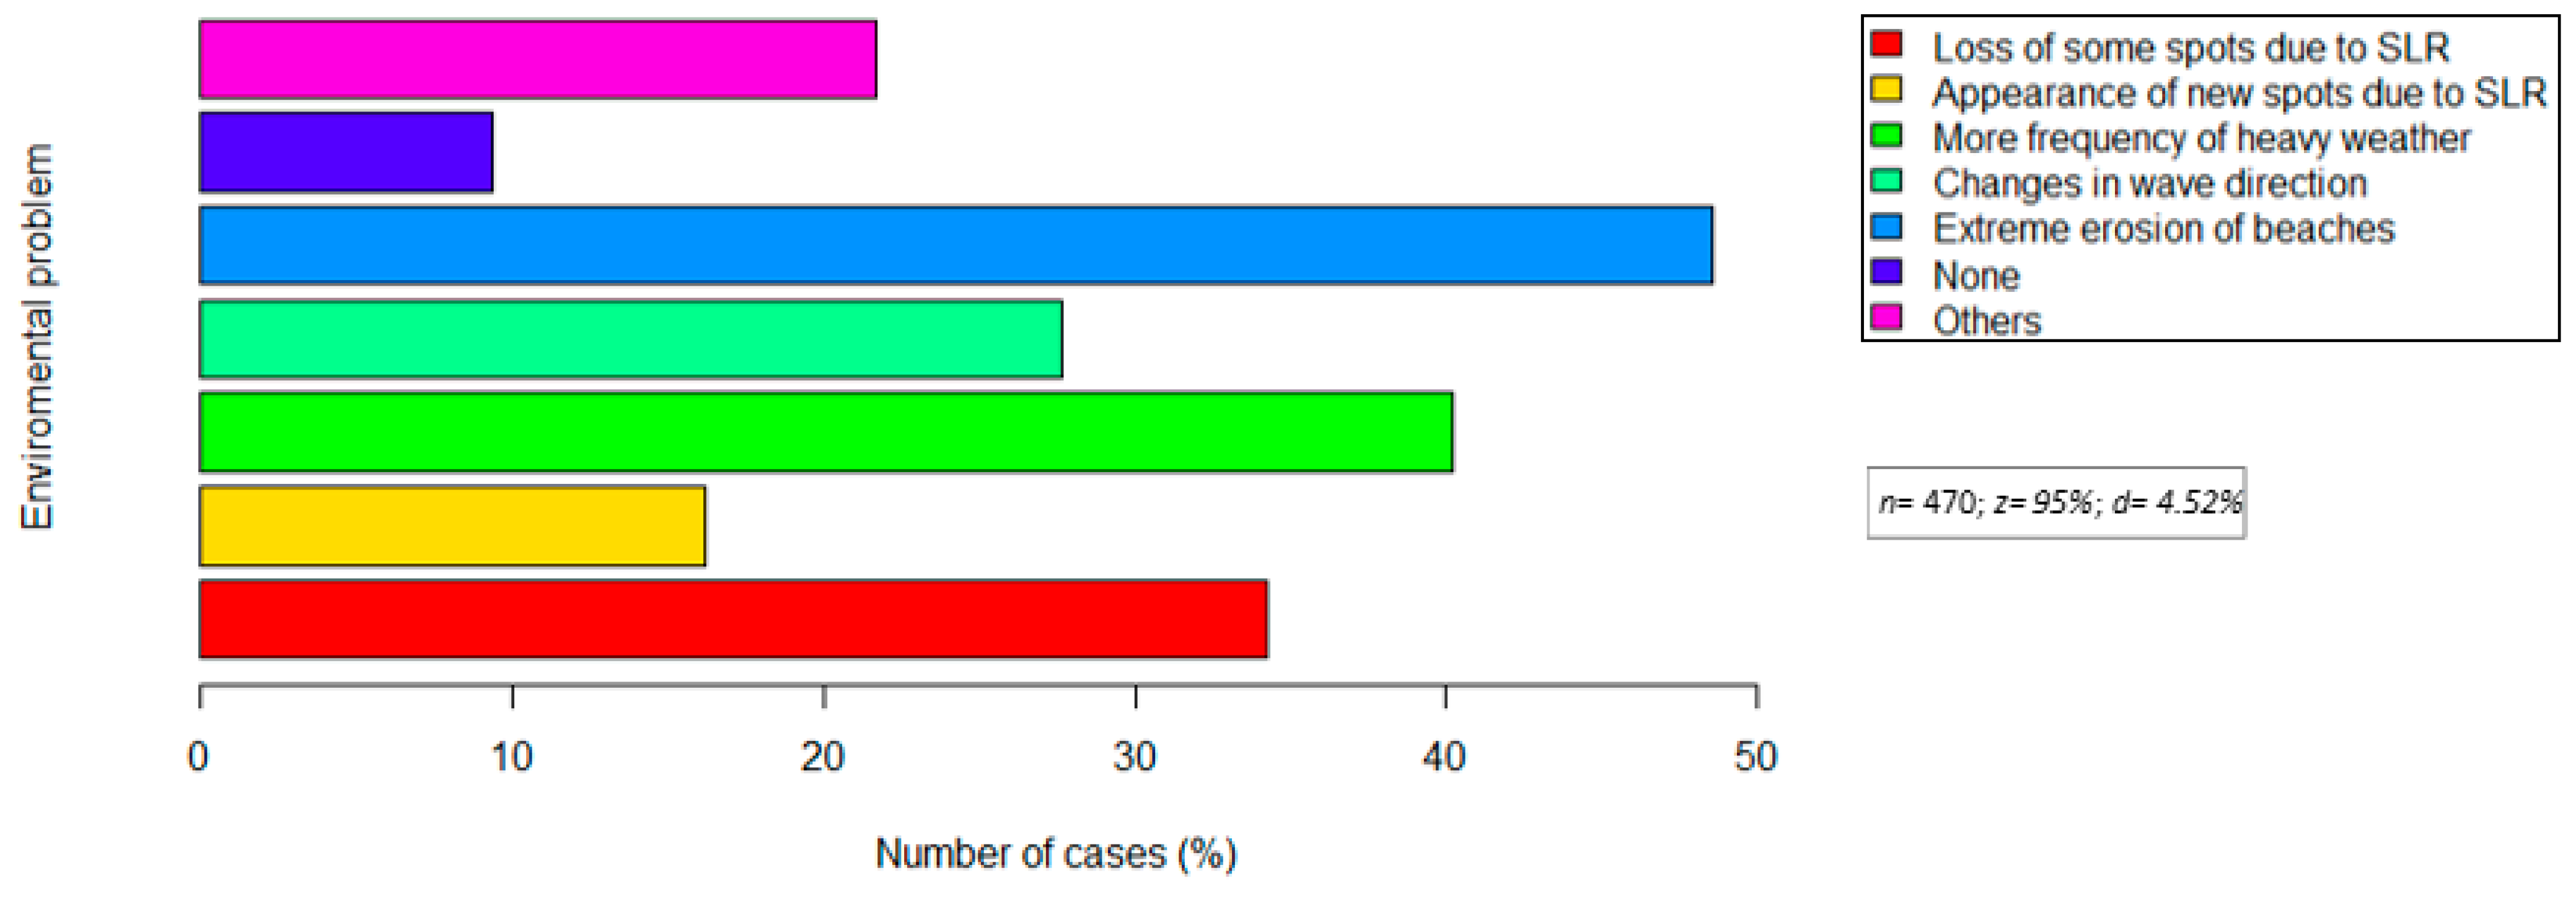
3.3. Environmental Problems That Harm the Surfing Experience
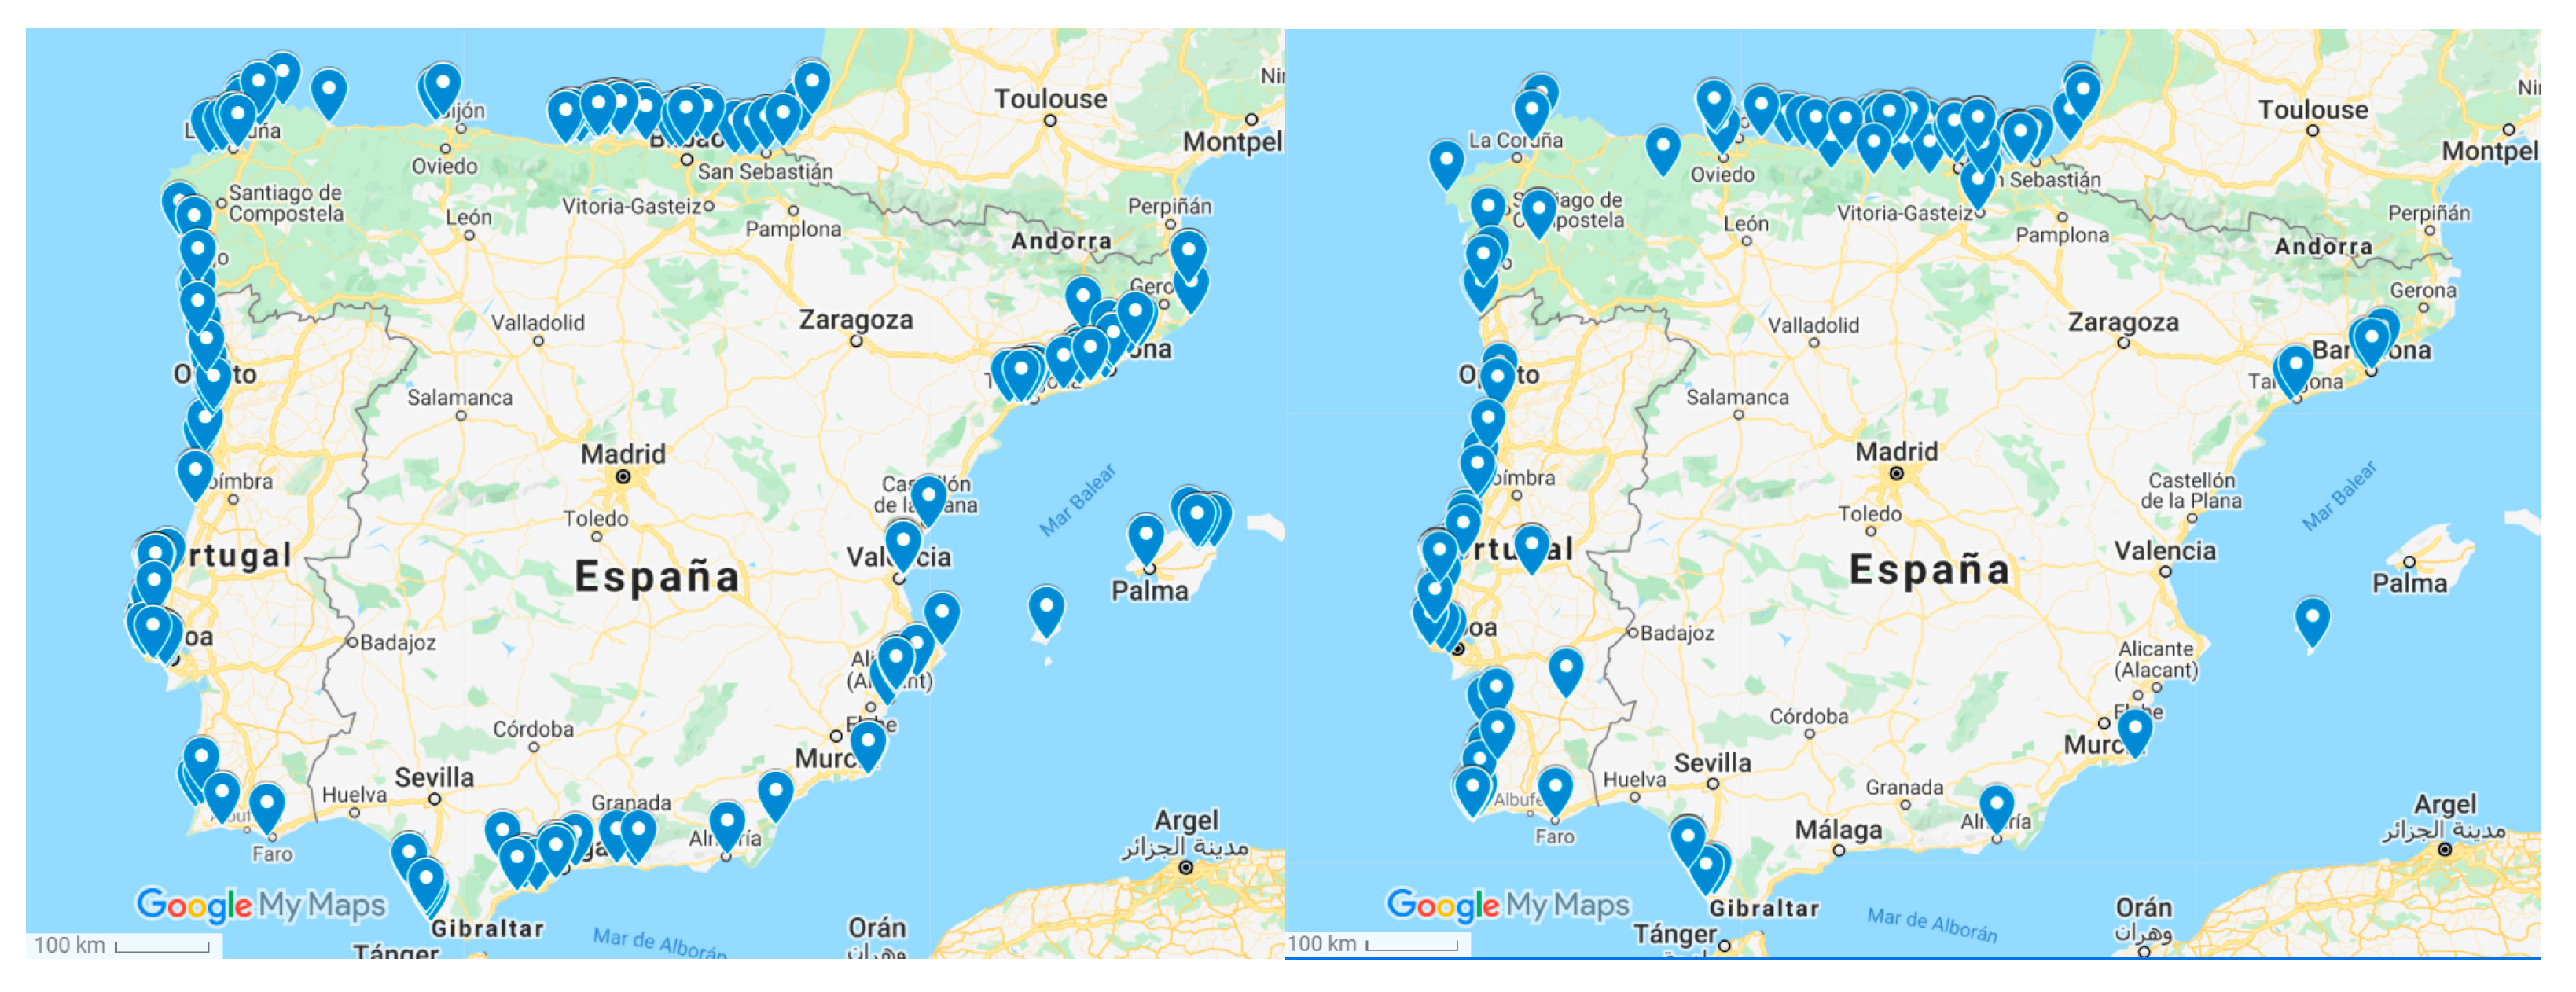
3.4. Usual Surf Spots and Surf Tourism on the Iberian Peninsula
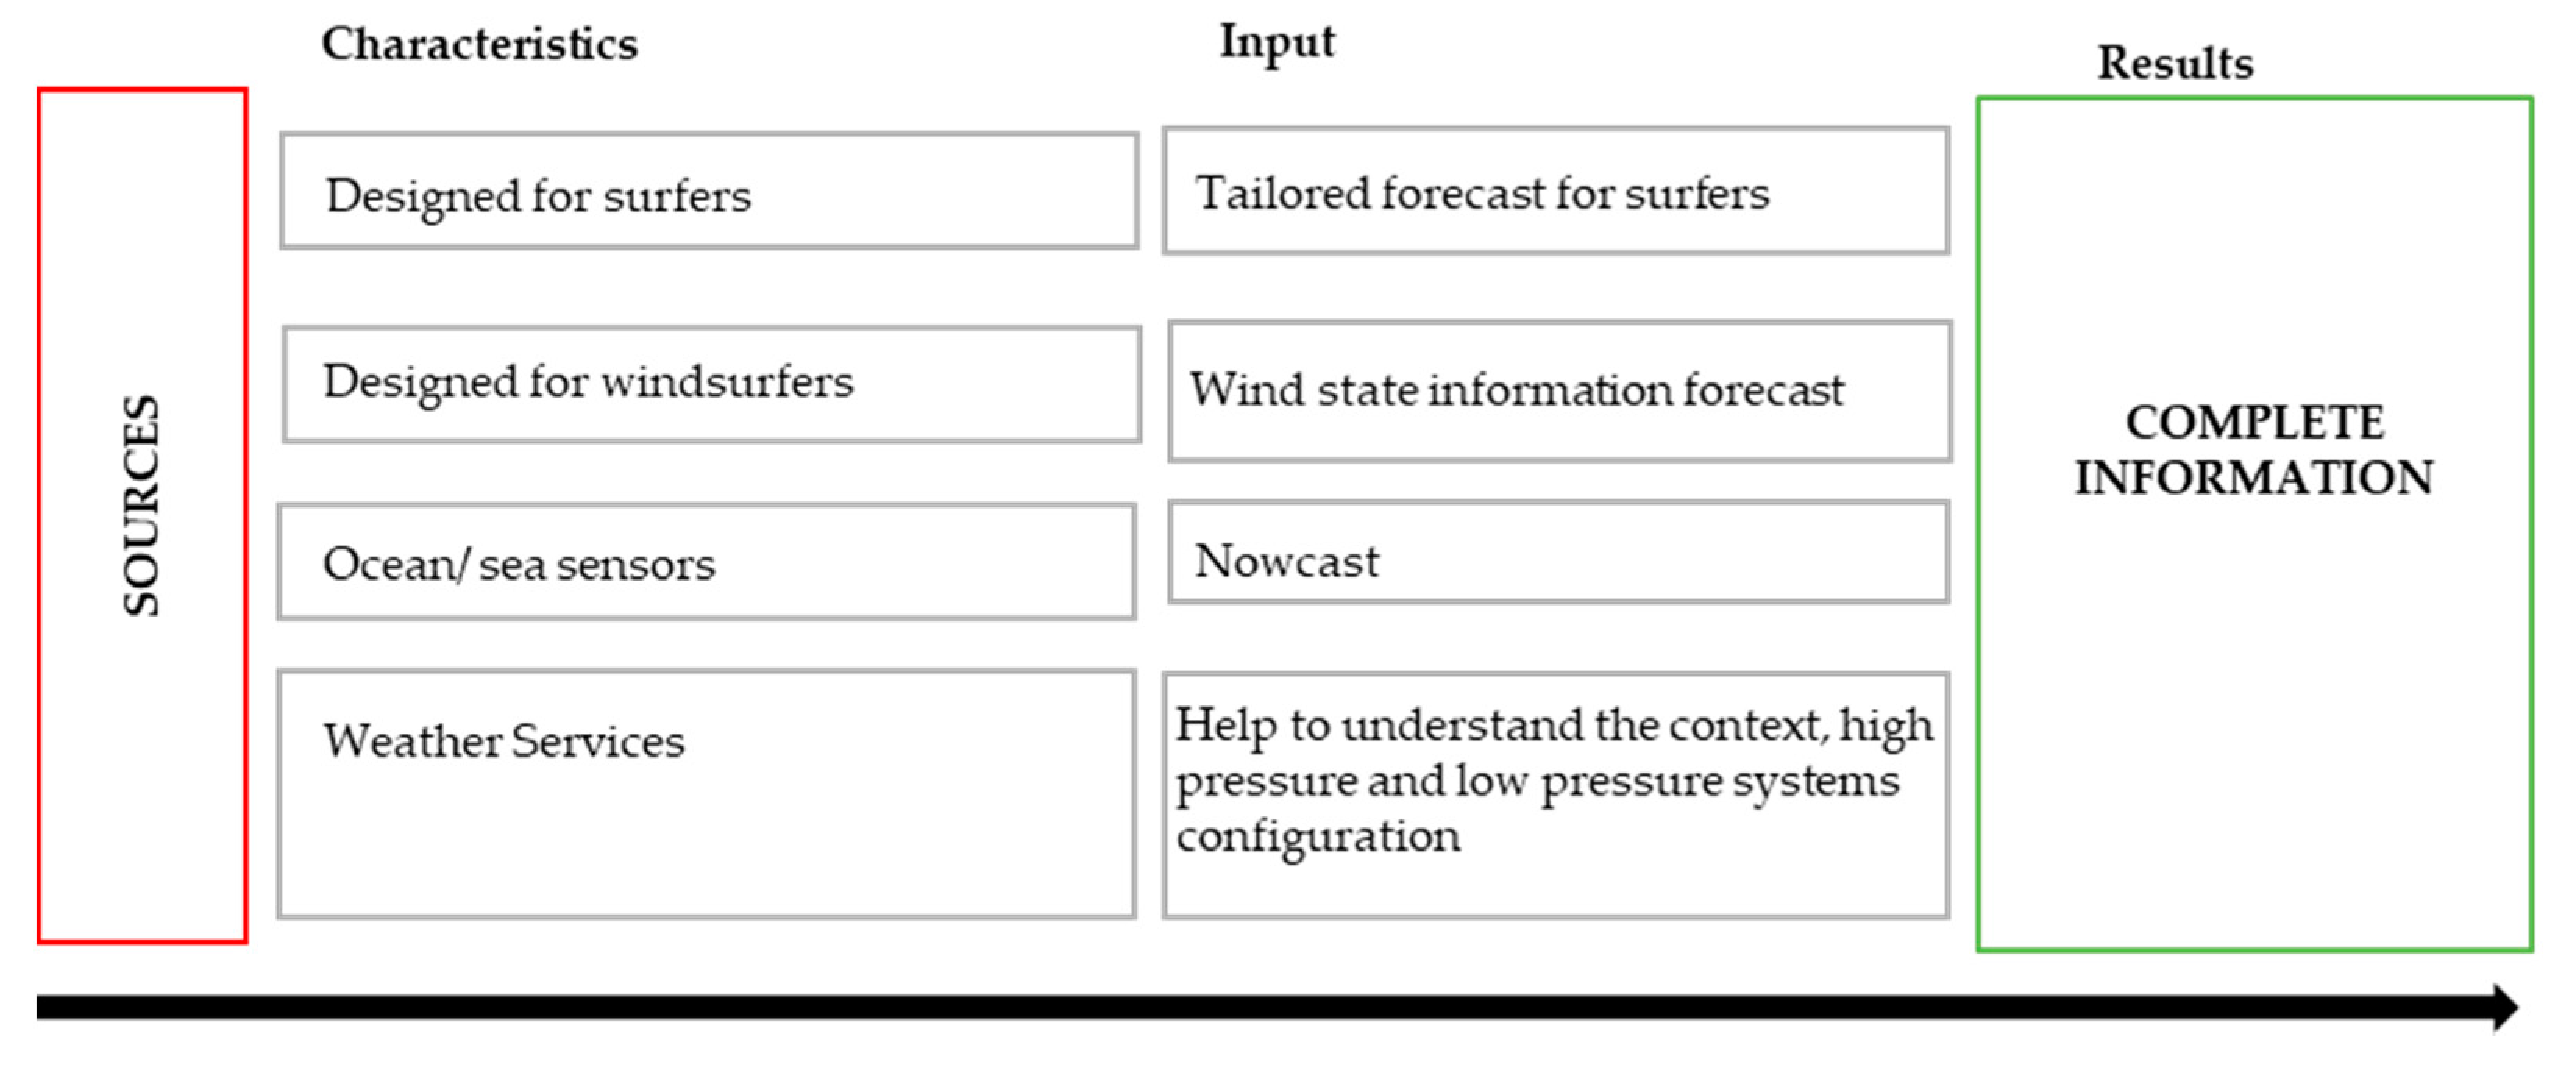
3.5. Design of SCS Prototype
4. Discussion and Conclusions
Author Contributions
Funding
Institutional Review Board Statement
Informed Consent Statement
Data Availability Statement
Acknowledgments
Conflicts of Interest
Appendix A. Survey Model
Appendix B. Summary of Survey Responses

| 0. Have you ever surfer on the Iberian Peninsula? | Yes | No | |||
| 97.77% | 2.23% | ||||
| 1. Gender | % Male | % Female | |||
| 75.11% | 24.89% | ||||
| 2. Age | [16–25) | [25–35) | [35–45) | [45–55) | >=55 |
| 26.00% | 38.90% | 24.95% | 8.46% | 1.69% | |
| 3. Nationality | Spanish | Portuguese | Others | ||
| 66.52% | 17.29% | 16.19% | |||
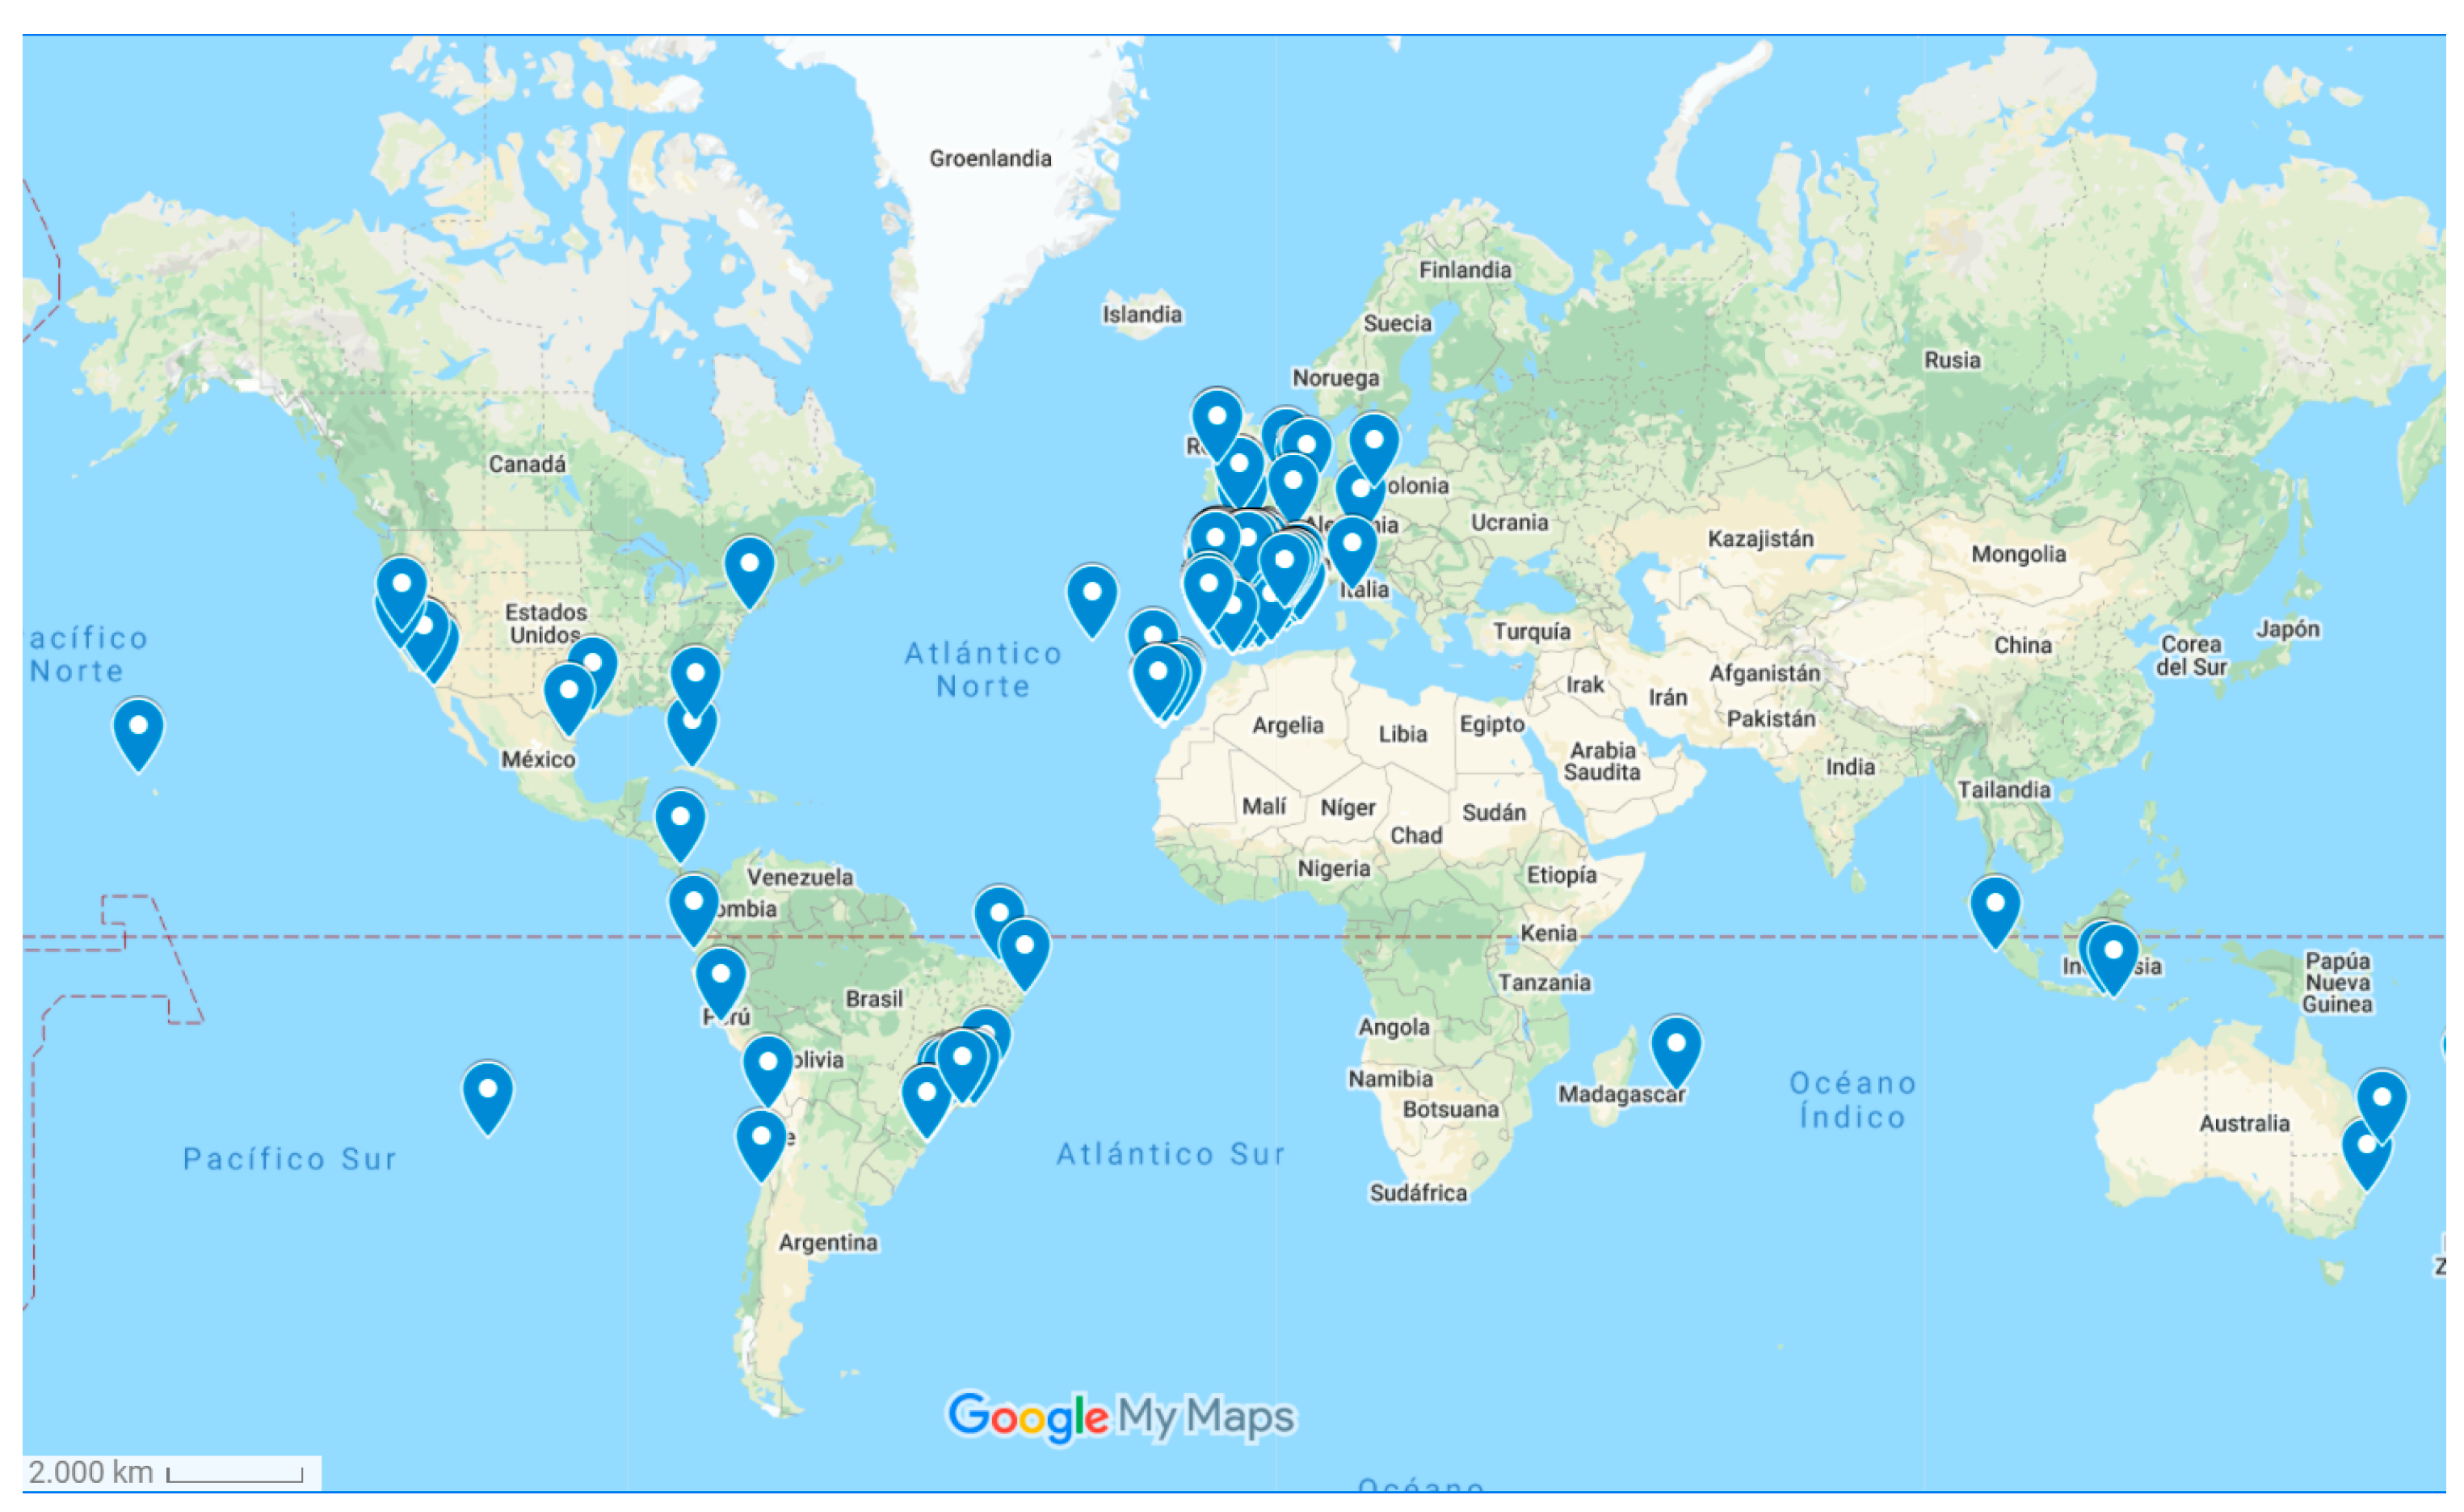
| 4. Municipality of residence | See Figure A1 | ||||
| 5. Was the place you live chosen to be able to surf? | Yes | No | NA | ||
| 40.90% | 59.10% | 0.64% | |||
| 6. Years of surfing | <5 | [5-10) | [10,15) | [15,20) | >=20 |
| 20.85% | 27.66% | 14.47% | 12.13% | 24.89% | |
| 7. Board water sport practiced more frequently | Bodyboard | Shortboard | Longboard | Stand up Paddle | |
| 11.49% | 64.68% | 17.66% | 6.17% | ||
| 8. Level of surfing | Beginner | Intermediate | Advanced | ||
| 5.74% | 25.11% | 69.15% | |||
| 9. Do you dedicate yourself or have you dedicated yourself professionally to surfing (competition, instructor, judge…)? | Yes | No | |||
| 39.15% | 60.85% | ||||
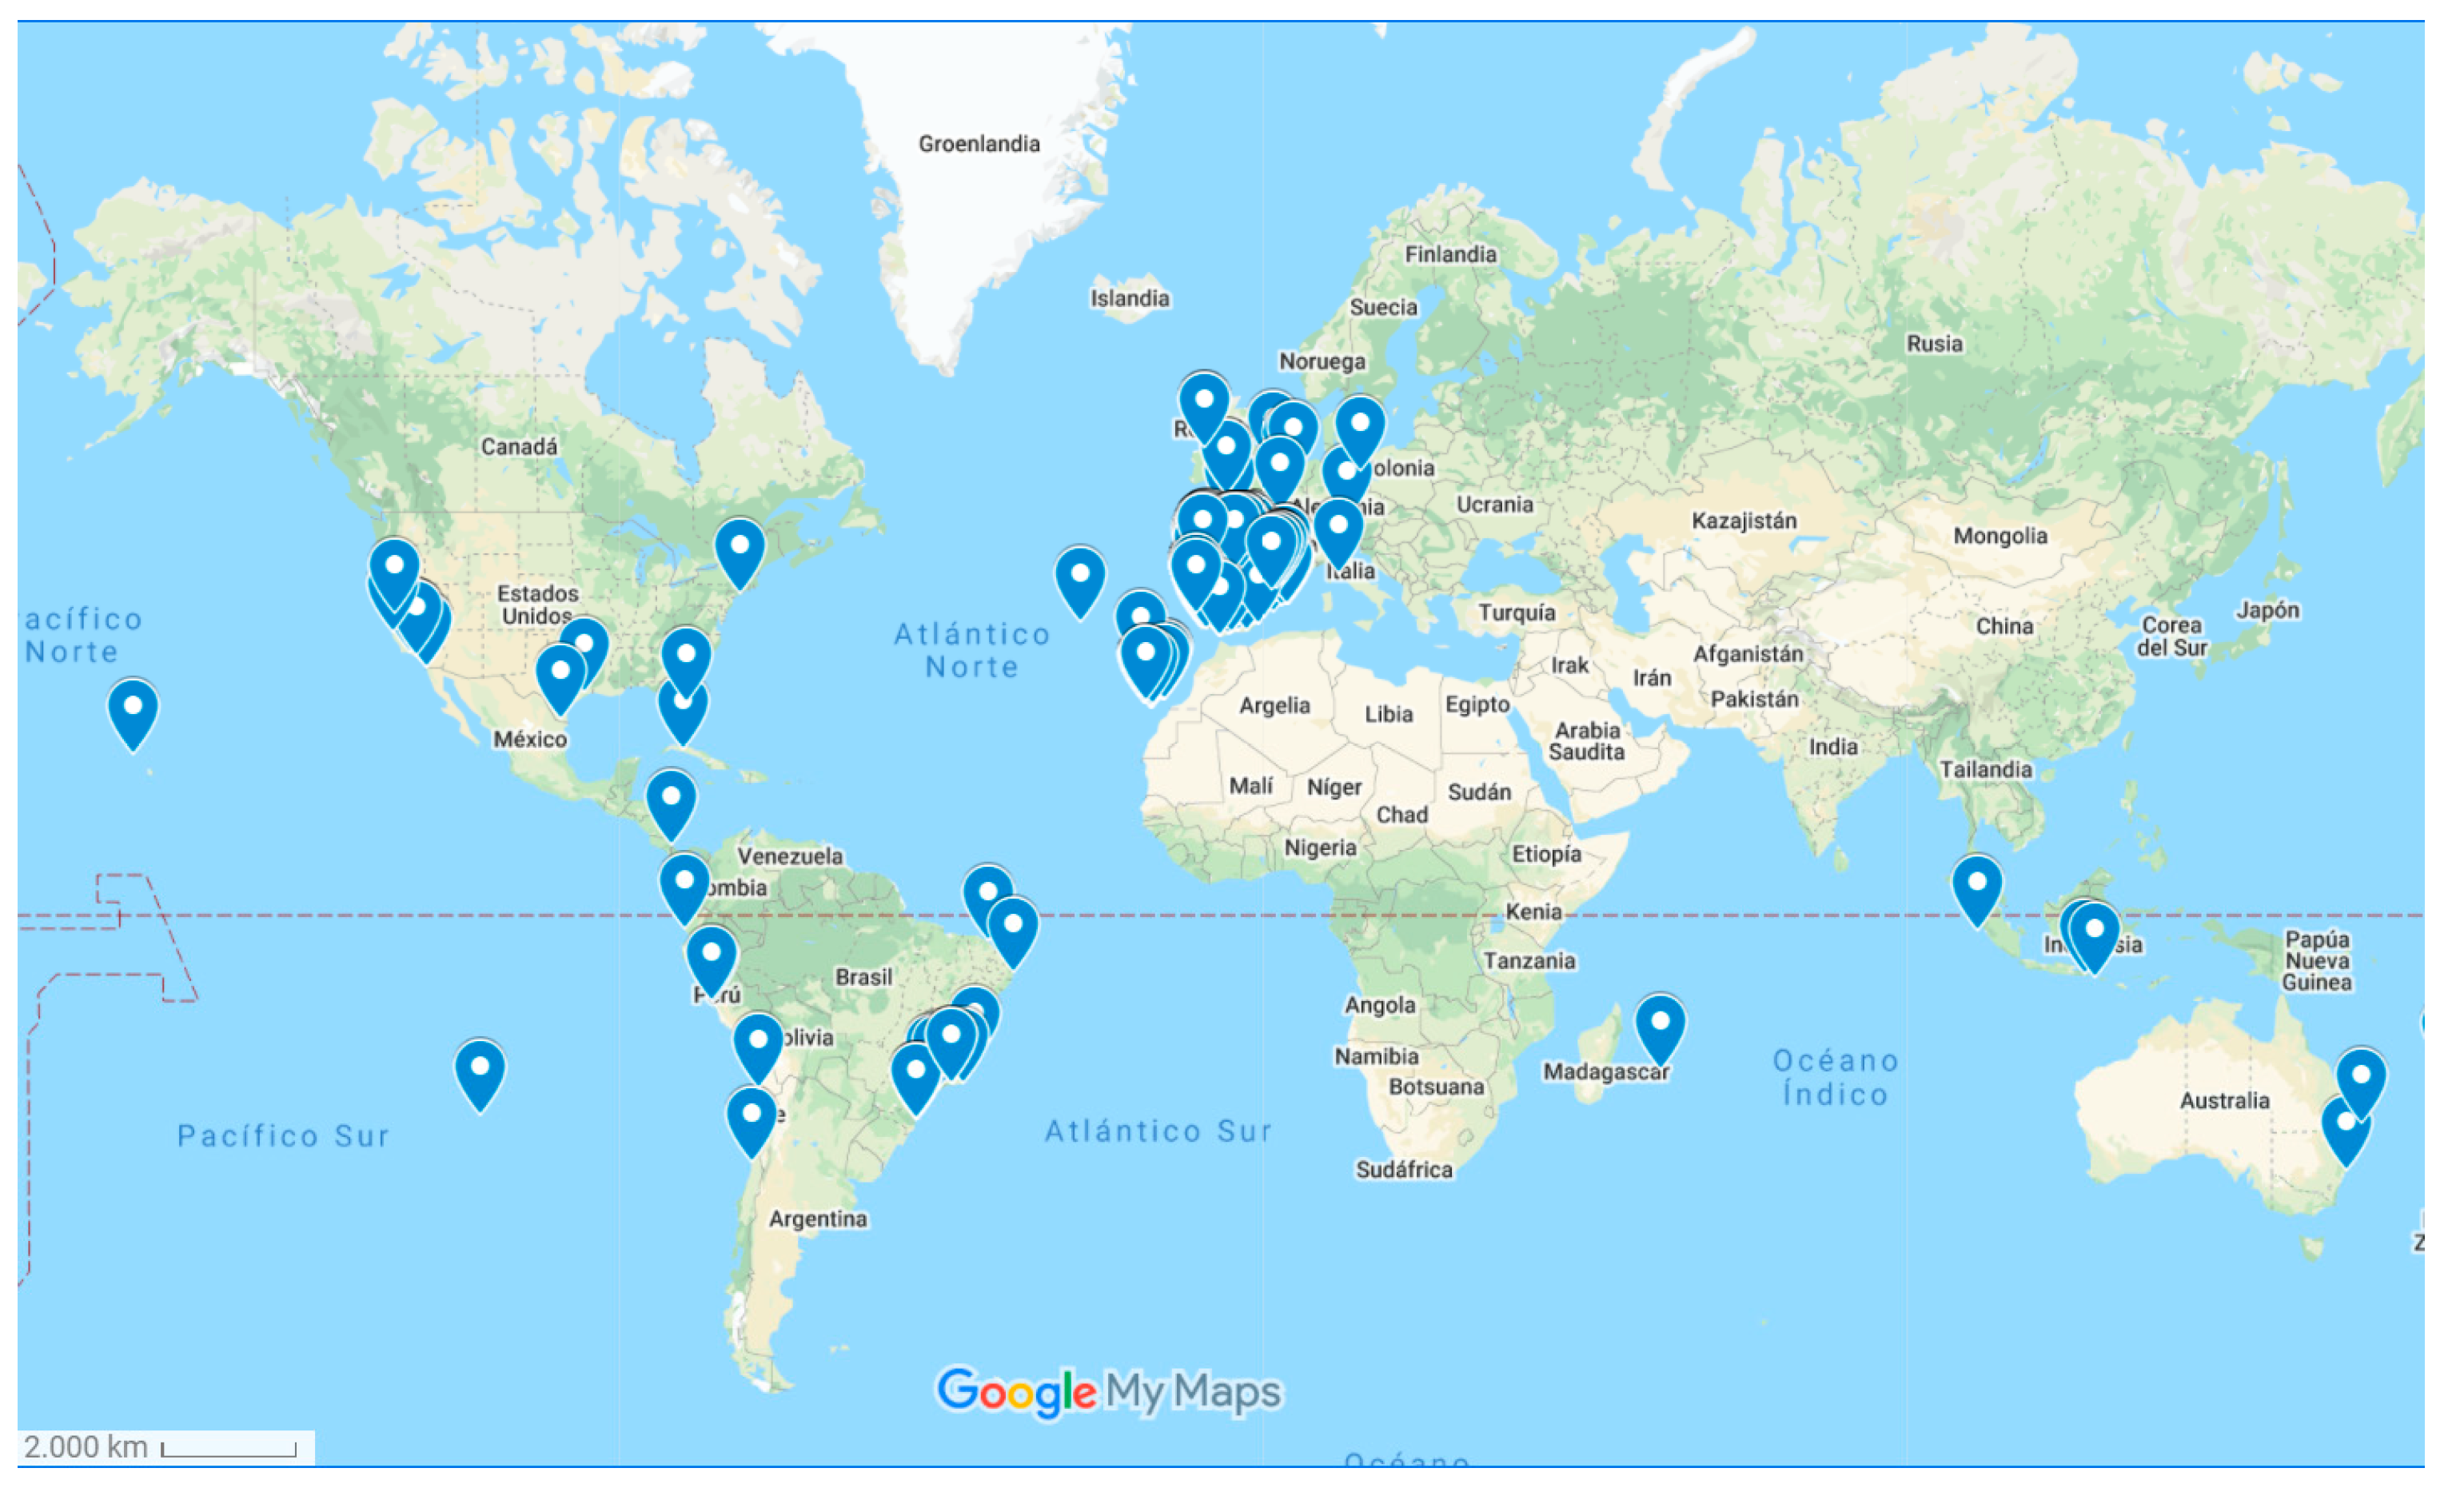
| 10. Indicate your usual spots | Section 3.4 See Figure A2 | ||||
| 11. What do you think are the environmental impacts that affect surfing? (multiple choice) | Section 3.3 | ||||
| 12. Please list any changes you have observed in your usual spot (s) that harm or benefit the practice of the sport. Indicate in which surf spot | Section 3.3 | ||||
| 13. Do you have to travel at a distance that involves you spending a night away from home in order to surf surf? | Yes | No | |||
| 88.30% | 11.70% | ||||
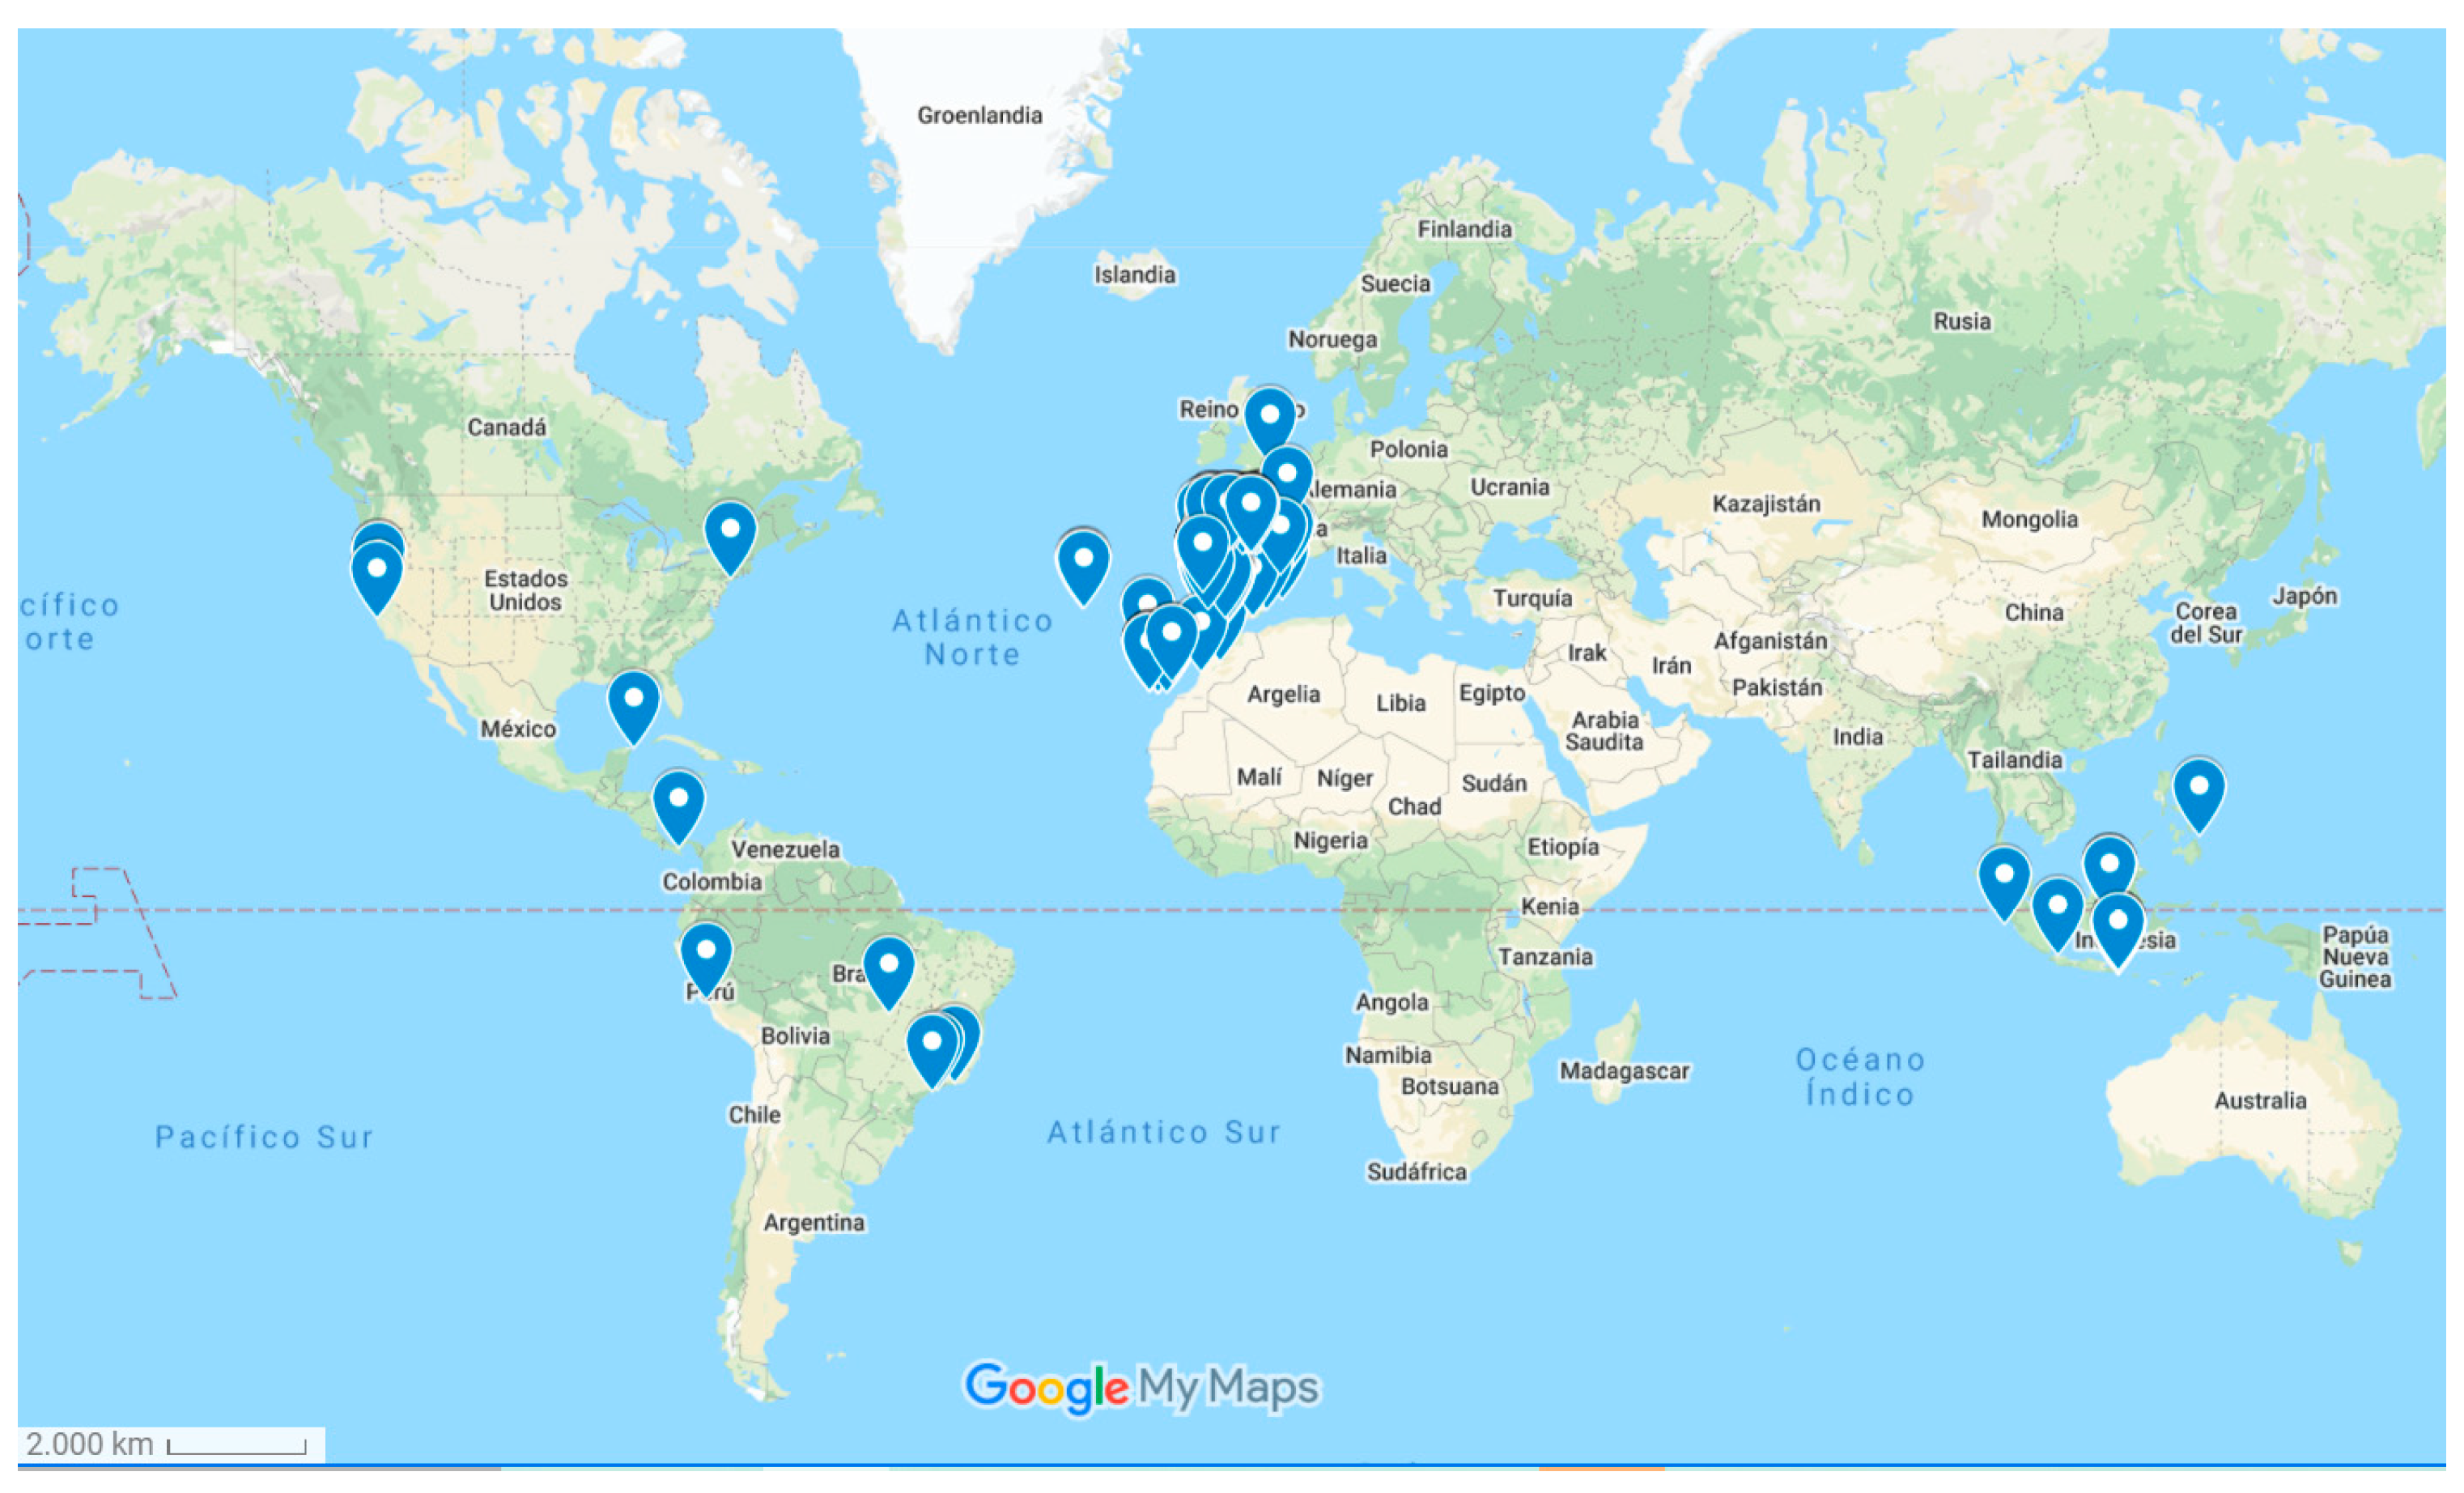
| 14. Indicate some of you travel spots that you would like to highlight (if possible, within the Iberian Peninsula) | Section 3.4 See Figure A3 | ||||
| 15. When do you travel (spend a minimum of 1 night away from home) do you consult the state of the sea in a different way? (multiple choice) | Section 3.1 | ||||
| 16. Where do you surf most often? | Home | Not home | |||
| 88.30% | 11.70% | ||||
| 17. Indicate what information you consult before going surfing and assess its quality (1 = very bad – 5 = very good) [Friends / family inform me] | Section 3.1 | ||||
| 18. Before going surfing, do you consult information to know the state of the sea? | Section 3.1 | ||||
| 19. How far long in advance do you check the forecast? (multiple choice) | Section 3.1 | ||||
| 20. What website or application do you consult to look at the prediction? | Section 3.1 | ||||
| 21. What parameters do you look at when checking at the wave forecasts? | Section 3.1 | ||||
| 22. Do you know what the significant height of the wave is? | Yes | No | I have heard about it, but I don’t know what it is | ||
| 71.91% | 13.19% | 14.89% | |||
| 23. What do you think could be improved from the surf forecasts? | Section 3.2 | ||||
| 24. If you had seasonal forecast * do you think it would be useful for you? * for example, if in the spring, you had the information of the summer | Section 3.2 | ||||
| 25. In what format would you like to receive seasonal forecast information? (multiple choice) | Section 3.2 | ||||
| 26. Filter question | |||||
| 27. If you had seasonal information, would it be useful to you? (multiple choice) | Section 3.2 | ||||
| 28. In what format would you like to receive the information? | Section 3.2 | ||||
| 29. Does the income of the company/department vary depending on the availability of waves? | Section 3.2 | ||||
| 30. Does your company currently offer other water activities apart from surfing? | Section 3.2 | ||||
| 31. Would you be willing to pay to receive seasonal information? | Section 3.2 | ||||
| 32. Do you think you would diversify the offer of aquatic activities if you had adequate information on the state of the sea? | Section 3.2 | ||||
| 33. Add comments that you think you can contribute extra information to the study: | |||||
| 34. If you want to stay informed of the results of the investigation you can write your email here | |||||


References
- Damm, A.; Köberl, J.; Stegmaier, P.; Alonso, E.J.; Harjanne, A. The market for climate services in the tourism sector—An analysis of Austrian stakeholders’ perceptions. Clim. Serv. 2020, 17, 100094. [Google Scholar] [CrossRef]
- Hewitt, C.; Mason, S.J.; Walland, D. The Global Framework for Climate Services. Nat. Clim. Chang. 2012, 2, 831–832. [Google Scholar] [CrossRef]
- Jancloes, M.; Thomson, M.; Costa, M.M.; Hewitt, C.; Corvalan, C.; Dinku, T.; Lowe, R.; Hayden, M. Climate Services to Improve Public Health. Int. J. Environ. Res. Public Health 2014, 11, 4555–4559. [Google Scholar] [CrossRef] [PubMed]
- Connor, S.J.; Omumbo, J.; Green, C.; DaSilva, J.; Mantilla, G.; Delacollette, C.; Thomson, M. Health and cli-mate–needs. Procedia Environ. Sci. 2010, 1, 27–36. [Google Scholar] [CrossRef]
- Williges, K.; Mechler, R.; Bowyer, P.; Balkovic, J. Towards an assessment of adaptive capacity of the European agricultural sector to droughts. Clim. Serv. 2017, 7, 47–63. [Google Scholar] [CrossRef]
- Coulibaly, J.Y.; Birachi, E.A.; Kagabo, D.M.; Mutua, M. Climate Services for Agriculture in Rwanda Baseline Survey Report; CCAFS: Wageneigen, The Netherlands, 2017. [Google Scholar]
- Vaughan, C.; Hansen, J.; Roudier, P.; Watkiss, P.; Carr, E. Evaluating agricultural weather and climate services in Africa: Evidence, methods, and a learning agenda. Wiley Interdiscip. Rev. Clim. Chang. 2019, 10, 586. [Google Scholar] [CrossRef]
- Rosas, G.; Gubler, S.; Oria, C.; Acuña, D.; Avalos, G.; Begert, M.; Castillo, E.; Croci-Maspoli, M.; Cubas, F.; DaPozzo, M.; et al. Towards implementing climate services in Peru—The project CLIMANDES. Clim. Serv. 2016, 4, 30–41. [Google Scholar] [CrossRef]
- Dayamba, D.S.; Ky-Dembele, C.; Bayala, J.; Dorward, P.; Clarkson, G.; Sanogo, D.; Mamadou, L.D.; Traoré, I.; Diakité, A.; Nenkam, A.; et al. Assessment of the use of Participatory Integrated Climate Services for Agriculture (PICSA) approach by farmers to manage climate risk in Mali and Senegal. Clim. Serv. 2018, 12, 27–35. [Google Scholar] [CrossRef]
- Lowe, R.; Bailey, T.C.; Stephenson, D.B.; Jupp, T.E.; Graham, R.J.; Barcellos, C.; Carvalho, M.S. The development of an early warning system for climate-sensitive disease risk with a focus on dengue epidemics in Southeast Brazil. Stat. Med. 2013, 32, 864–883. [Google Scholar] [CrossRef]
- Dinku, T.; Asefa, K.; Hilemariam, K.; Grimes, D.; Connor, S. Improving availability, access and use of climate information. WMO Bull. 2011, 60. Available online: http://www.wmo.int/pages/publications/bulletin_en/archive/60_2_en/60_2_Tufa_en.html (accessed on 20 February 2021).
- Soares, M.B.; Alexander, M.; Dessai, S. Sectoral use of climate information in Europe: A synoptic overview. Clim. Serv. 2018, 9, 5–20. [Google Scholar] [CrossRef]
- Martín, M.B.G. Weather, climate and tourism a geographical perspective. Ann. Tour. Res. 2005, 32, 571–591. [Google Scholar] [CrossRef]
- Smith, K. The influence of weather and climate on recreation and tourism. Weather 1993, 48, 398–404. [Google Scholar] [CrossRef]
- Aguilar, E.; Reverté, F.G. El valor de los factores geográficos en la localización de instalaciones turísti-co-recreativas. El caso de Port Aventura. Vila-Seca y Salou (Tarragona). In Cambios Regionales a Finales del Siglo XX: XIV Congreso Nacional de Geografía: Comunicaciones; Asociación Española de Geografía: Madrid, Spain, 1995; pp. 279–282. [Google Scholar]
- Barbier, B. Les stations de sports d’hiver françaises et le milieu physique. Geogr. Pol. 1984, 49, 109–116. [Google Scholar]
- Becker, S. Bioclimatological rating of cities and resorts in South Africa according to the Climate Index. Int. J. Clim. 2000, 20, 1403–1414. [Google Scholar] [CrossRef]
- Besancenot, J.P. Premières données sur les stress bioclimatiques moyens en France. In Annales de geographie; Armand Colin: Paris, France, 1974; pp. 497–530. [Google Scholar]
- Mieczkowski, Z. The tourism climatic index: A method of evaluating world climates for tourism. Can. Geogr./Géographe Can. 1985, 29, 220–233. [Google Scholar] [CrossRef]
- Scott, D.; Rutty, M.; Amelung, B.; Tang, M. An Inter-Comparison of the Holiday Climate Index (HCI) and the Tourism Climate Index (TCI) in Europe. Atmosphere 2016, 7, 80. [Google Scholar] [CrossRef]
- Becker, S. Beach comfort index—A new approach to evaluate the thermal conditions of beach holiday resorts us-ing a South African example. GeoJournal 1998, 44, 297–307. [Google Scholar] [CrossRef]
- Scott, D.; Lemieux, C.; Malone, L. Climate services to support sustainable tourism and adaptation to climate change. Clim. Res. 2011, 47, 111–122. [Google Scholar] [CrossRef]
- Lise, W.; Tol, R.S. Impact of climate on tourist demand. Clim. Chang. 2002, 55, 429–449. [Google Scholar] [CrossRef]
- Moreno, A.; Amelung, B. Climate change and tourist comfort on Europe’s beaches in summer: A reassessment. Coast. Manag. 2009, 37, 550–568. [Google Scholar] [CrossRef]
- Grillakis, M.G.; Koutroulis, A.G.; Seiradakis, K.D.; Tsanis, I.K. Implications of 2 C global warming in Euro-pean summer tourism. Clim. Serv. 2016, 1, 30–38. [Google Scholar] [CrossRef]
- Gable, F.J. Climate change impacts on Caribbean coastal areas and tourism. J. Coast. Res. 1997, 49–69. [Google Scholar]
- Le Cozannet, G.; Nicholls, R.J.; Hinkel, J.; Sweet, W.V.; McInnes, K.L.; Van De Wal, R.S.W.; Slangen, A.B.A.; Lowe, J.A.; White, K.D. Sea Level Change and Coastal Climate Services: The Way Forward. J. Mar. Sci. Eng. 2017, 5, 49. [Google Scholar] [CrossRef]
- Scott, D.; Wall, G.; McBoyle, G. Chapter 3. The Evolution of the Climate Change Issue in the Tourism Sector. Tour. Recreat. Climate Chang. 2005, 22, 44–60. [Google Scholar] [CrossRef]
- Buckley, R. Perceived Resource Quality as a Framework to Analyze Impacts of Climate Change on Adventure Tourism: Snow, Surf, Wind, and Whitewater. Tour. Rev. Int. 2017, 21, 241–254. [Google Scholar] [CrossRef]
- Ponting, J. Projecting Paradise: The Surf Media and the Hermeneutic Circle in Surfing Tourism. Tour. Anal. 2009, 14, 175–185. [Google Scholar] [CrossRef]
- Fluker, M. Riding the wave: Defining surf tourism, the Council of Australian University Tourism and Hospitality Educators Conference. Coffs Harbour, Australia; Available online: https://ro.uow.edu.au/commpapers/248/ (accessed on 20 February 2021).
- Martin, S.A.; Assenov, I. Developing a Surf Resource Sustainability Index as a Global Model for Surf Beach Conservation and Tourism Research. Asia Pac. J. Tour. Res. 2013, 19, 760–792. [Google Scholar] [CrossRef]
- Espejo, A.; Losada, I.J.; Méndez, F.J. Surfing wave climate variability. Glob. Planet. Chang. 2014, 121, 19–25. [Google Scholar] [CrossRef]
- Peñas de Haro, P. La geografía del surf y el bodyboard en Mallorca, clima y turismo activo. Ph.D. Thesis, Universitat de les Illes Balears, Baleares, Spain, February 2019. [Google Scholar]
- Ciurana, A.B.; Aguilar, E. Expected Distribution of Surfing Days in the Iberian Peninsula. J. Mar. Sci. Eng. 2020, 8, 599. [Google Scholar] [CrossRef]
- Dolnicar, S.; Fluker, M. Behavioural market segments among surf tourists: Investigating past destination choice. J. Sport Tour. 2003, 8, 186–196. [Google Scholar] [CrossRef]
- Mach, L.; Ponting, J.; Brown, J.; Savage, J. Riding waves of intra-seasonal demand in surf tourism: Analysing the nexus of seasonality and 21st century surf forecasting technology. Ann. Leis. Res. 2020, 23, 184–202. [Google Scholar] [CrossRef]
- Towner, N. Searching for the perfect wave: Profiling surf tourists who visit the Mentawai Islands. J. Hosp. Tour. Manag. 2016, 26, 63–71. [Google Scholar] [CrossRef]
- Reiblich, J. Greening the tube: Paddling toward comprehensive surf break protection. Env.: Envtl. L. Pol’y J. 2013, 37, 45. [Google Scholar]
- Scheske, C.; Arroyo Rodriguez, M.; Buttazzoni, J.E.; Strong-Cvetich, N.; Gelcich, S.; Monteferri, B.; Ruiz, M. Surfing and marine conservation: Exploring surf-break protection as IUCN protected area categories and other effec-tive area-based conservation measures. Aquat. Conserv. Mar. Freshw. Ecosyst. 2019, 29, 195–211. [Google Scholar] [CrossRef]
- Amorim, R.C.; Rocha, A.; Oliveira, M.; Ribeiro, C. Efficient delivery of forecasts to a nautical sports mo-bile Application with semantic data services. In C3S2E ’16: Proceedings of the Ninth International C* Conference on Computer Science & Software Engineering; Association for Computing Machinery: New York, NY, USA, 2016; pp. 7–12. [Google Scholar]
- Pontes Caselli, R.; Ferreira, M.G.G. Systematic proposal for UX centered mobile apps for tracking perfor-mance in sports through an application in recreational surfing. Prod. Manag. Dev. 2018, 16, 37–46. [Google Scholar] [CrossRef][Green Version]
- Scott, V. Who Will Surf for Science? Understanding Motivations to Engage Surfers in Citizen Science with Smart-fin. Ph.D. Thesis, University of California, Oakland, CA, USA, 2019. [Google Scholar]
- Edwards, A.; Stephenson, W. Assessing the potential for surf break co-management: Evidence from New Zea-land. Coast. Manag. 2013, 41, 537–560. [Google Scholar] [CrossRef]
- Esparza, D. De Hawai al Mediterráneo: La génesis del surf en España. (From Hawaii to the Mediterranean Sea: The Beginnings of Surfing in Spain). RICYDE. Rev. Int. Cienc. Deport. 2011, 7, 370–383. [Google Scholar] [CrossRef]
- Álvarez Esteban, R. Las preguntas de respuesta abierta y cerrada en los cuestionarios. Análisis Estadístico Inf. Metodol. Encuestas 2003, 5, 45–54. [Google Scholar]
- Fussel, W. Treating the cause, not the symptom. ILEA Newsl. 1995, 11, 30–31. [Google Scholar]
- Mysiak, J.; Perrels, A.; Larosa, F.; Harjanne, A. Policy recommendations, promising resourcing and business models for climate services (deliverable 5.4-policybrief). Available online: http://eu-macs.eu/wp-content/uploads/2017/01/EUMACS_D54_Policy_Brief_final.pdf (accessed on 20 February 2021).
- Buckley, R. Surf Tourism and Sustainable Development in Indo-Pacific Islands. I. The Industry and the Islands. J. Sustain. Tour. 2002, 10, 405–424. [Google Scholar] [CrossRef]
- Ponting, J. Consuming Nirvana: An Exploration of Surfing Tourist Space. Ph.D. Thesis, Open Publications of UTS Scholars: Sydney, Australia 2008. Ph.D. Thesis, Open Publications of UTS Scholars, Sydney, Australia, 2008. [Google Scholar]
- Reineman, D.R. The utility of surfers’ wave knowledge for coastal management. Mar. Policy 2016, 67, 139–147. [Google Scholar] [CrossRef]
- Reineman, D.R.; Thomas, L.N.; Caldwell, M.R. Using local knowledge to project sea level rise impacts on wave resources in California. Ocean Coast. Manag. 2017, 138, 181–191. [Google Scholar] [CrossRef]
- Groves, A.; Klanten, R.; Funk, M.; Crockett, D. Surf Odyssey: The Culture of Wave Riding; Die Gestalten Verlag GmbH & Co. KG.: Berlin, Germany, 2016. [Google Scholar]
- Todd Cool, N. The WetSand WaveCast Guide to Surf Forecasting. A Simple Approach to Planning the Perfect Sessions; iUniverse, Inc.: Bloomington, Indiana, 2003. [Google Scholar]
- User, S. Home—CoastSnap—Citizen Science App. [online] Coastsnap.com. 2021. Available online: https://www.coastsnap.com/ (accessed on 23 February 2021).
- Valencia, L.; Osorio García, M.; Serrano Barquín, R.D.C. Turismo de surf: Revisión de nuevas líneas y temát-icas de investigación (2012–2018). Investig. Turísticas 2020, 20, 215–238. [Google Scholar]
- Boqué, A.; Aguilar, E. Can You help Us to Predict Waves for Surfing? Available online: https://forms.gle/yQrTeUARKaTaZy7z7 (accessed on 20 February 2021).


| Question Number | Format of Survey Question | Topic of Interest |
|---|---|---|
| 0 | Filter | Ever surfed on the Iberian Peninsula |
| 1 | Closed-ended | Demographic information |
| 2, 3, 4 | Open-ended | Demographic information |
| 5, 16 | Closed-ended | Behavior information |
| 6 | Open-ended | Surfer profile |
| 7, 8, 9 | Closed-ended | Surfer profile |
| 10 | Open-ended | Local surf spot |
| 11 | Multiple choice | Environmental changes |
| 12 | Open-ended | Environmental changes |
| 13 | Closed-ended | Surfing tourism mobility behavior |
| 14 | Open-ended | Surfing tourism mobility behavior |
| 15, 19, 21, 25 | Multiple choice | Request for meteorological/climatological information |
| 17 | Rating | Request for meteorological/climatological information |
| 18, 22, 24 | Closed-ended | Request for meteorological/climatological information |
| 20, 23 | Open-ended | Request for meteorological/climatological information |
| 26 | Open-ended | The perceptions of meteorological and climatological information use by entrepreneurs, managers or workers at surf schools or similar |
| 27 | Multiple-choice | The perceptions of meteorological and climatological information use by entrepreneurs, managers or workers at surf schools or similar |
| 28, 29, 30, 31, 32 | Closed-ended | The perceptions of meteorological and climatological information use by entrepreneurs, managers or workers at surf schools or similar |
| 33, 34 | Open-ended | Other comments |
| Name of The Resource | Prediction Model | Time of Prediction | Variables | Comments |
|---|---|---|---|---|
| Todosurf | Nonspecified | 7 days, 14 days (new) | Wave height, wave direction, wave period, energy, wind intensity, wind direction. Summary of wind waves, swell 1, swell 2 with the following variables: wave height, wave period, and wave direction. Quality rating. | In the same app/website buoy’s data, wind map, and waves map are present from Puertos del Estado. The site allows configuring alarms for the favorite surf-spots. |
| Wisuki | Nonspecified | 7 days | Wind (direction, average, gust), waves (direction, height, period), and tides. | This app is very visual and interactive with satellite images joined with graphs. In the same app/website weather information is shown. |
| Magicseaweed | NOA WAVEWATCH III, PROTEUS GLOBAL | 7 days, 16 days (pro) | Surf height, wind gusts, wave direction, wind intensity and direction, tides. Quality rating. Information about primary and secondary swell can be shown. | In the same app/website weather information is shown. Webcam access with the pro version. It is possible to consult the sea stat historic of the spots. |
| Windy | ECMWF WAM, Wavewatch 3 | 10 days | Wind direction, wind average, wind gust, wave height (primary and secondary swell), wave period. | General weather app where there is a specific section for surfing activity. |
| Windguru | GFS 13, AROME 1.3, AROME 2.5, Zephr-HD3, Zephr-HD4, WRF 9, ICON 7, HIRLAM 7.5, Zephr-HD 9, WRF 27, ICON 13, GDPS 15 | 10 days | Wind speed, wind gust, wind direction, temperature, cloudiness, tides. Quality rating (in this case is for windsurfing). | There is a pro version that allows access to more maps and models which helps to have a more accurate wind prediction. |
| Windfinder | GFS and Superforecast (This mixes GFS + horizontal information) | 7 days | Wind direction, wind speed, wind gust, cloudiness, kind of precipitation, air temperature, sea level pressure, wave direction, wave height, and wave period. Wind chill, relative humidity (in Superforecast) | The site also provides statistical historic of some variables. The site presents some surf-spot webcams. |
| Medswells | From FNMOC wave watch 3 model | 3 days | Isobaric and surge maps- Wave height, wave direction, and wave period. It also presents variables from wind swell and sea swell and quality rating. | The site also allows surf-spot webcams access and configure alarms for the favorite surf-spots. |
| Surfline | LOLA | 2 days, 17 days premium | Wave height, direction, and period (primary, secondary and tertiary swell). Wind direction and intensity. Tide hours and weather conditions. | The site also allows access to a global navigator where there are regional waves, local waves, buoys observations, and Surfline charts around the world. The site also informs about specific surf conditions. |
| Name of the Resource | Prediction Model | Time of Prediction | Variables | Comments |
|---|---|---|---|---|
| Surf forecast | Nonspecified | 7 days | Significant wave height map. Wave height, wave direction, wave period, energy, wind direction, wind intensity, wind state, and tides. Quality rating. | Wave height is in the open sea. In the same app/website information about weather, advanced surf, local wavefinder, and global wavefinder are shown. |
| Puertos del estado | Wind modelized from Hamnnie-Arome, then wave data is modelized by WAM | 3 days and nowcast | Wind speed, wind direction, wave height, wave period, water temperature, atmospheric pressure, salinity level. | It is possible to consult historic data. |
| Surfmediterraneo | Aemet, Meteocat, FNMOC, UOA Mediterranean, DICCA, laMMA, GFS, MetOffice | 7 days, 9 days (isobaric maps), 16 days (wind maps) | There is a link to the table of Puertos del Estado: wind speed, wind direction, wave height, wave direction, wave period. Secondary and primary swell variables. | Webcams. This website collects different cartography about the forecast of different Meteo services for different variables. |
| Surfcantabria.com | See Windy information See Windguru information | See Windy information See Windguru information | This website collects Windguru forecast and Windy forecast in a visual way. | The website collects links to other sources of forecast (Magicseaweed, storm surf, aemet…) with link to surf-spot webcams. |
| Camaramar | Not applicable. Nowcast | Nowcast | Specification of surf-spot localization, better wind, better season, and surf-spot orientation | This website provides a webcam for different surf-spots as well it links to active tourism offers |
| Fnmoc | From FNMOC wave watch 3 model | 3 days | Significant wave height and direction, swell wave height and direction, wind wave height and direction, swell wave period and direction, wind wave period and direction, peak wave period and direction, white cap probability. | Maps of prediction. |
| Meteogal | Nonspecified | 3 days | Tide time, sky state, wind direction and intensity, sea state, visibility, wave height direction and height, air temperature, water temperature, and maximum UV index. | In MeteoGalicia there is a maritime prediction section. |
| SurfCatalunya | From FNMOC wave watch 3 model | 3 days | See Medswells variables. | The website also presents some surf-spot webcams. The forecast section uses Medswells information. |
| Aemet | Nonspecified | 5 days | Map of wind sea and wave sea including wave direction and height. | In Aemet there is a coast maritime prediction section. |
| Name of The Resource | Prediction Model | Time of Prediction | Variables | Comments |
|---|---|---|---|---|
| Lineapp | Nonspecified | 7 days | Wave height, direction, and period. Wind intensity and direction. Air temperature and cloudiness. Quality rating. | The app includes surf alerts, social and news feed. The app helps to better communication between surfers and surf schools. The app also includes tailored information regarding your profile—surfer or surf school. The app also informs users about spot details—kind of spot, bottom type, best swell, best wind, wave type, and spot level. |
| Imar | Aemet (wind), Puertos del Estado (other variables) | 3 days and nowcast | Wave height, wave direction, wave period, sea level. Wind direction wind intensity. There are the same variables available in real-time. Weather alert. | The main information of sea state from Puertos del Estado in one practical app. |
| FACT PROBLEM | Pollution | Overtourism Too Many Tourists in the Water | Beach Erosion, Sea Level Rise, and Dune System Erosion | Changes in Surfing-Wave Availability | Fewer Tourists |
|---|---|---|---|---|---|
| CAUSES | Discharges from outfalls Inefficient management of pollution systems Increase in population in tourism season Chemical pollution from factories | Increase in tourism flows before COVID-19 pandemic Promotion of surf destination with no environmental protection plan | Construction of breakwaters and dikes Massive construction on the coast Little sedimentary contribution Seasonal variability Sand drainage/massive sand movements | Changes in primary swell direction. Changes in wind patterns | COVID-19 pandemic: restricted mobility |
| CONSEQUENCES | Human health problems (gastritis, otitis) Affects the biodiversity of surf spots | Changes in security in the water Increase in pollution Construction of artificial beaches for sun and beach tourism | Changes in wave breaks’ characteristics such as shape and height Sand beaches with increasing presence of rocks in relation to sand Loss or appearance of surf spots Changes on sea floor | Changes in the number of expected surfing days. | More security in the water Reduce local income from tourists New opportunities to offer surfing activities to local surfers Increase well-being of the population Boost the local economy |
Publisher’s Note: MDPI stays neutral with regard to jurisdictional claims in published maps and institutional affiliations. |
© 2021 by the authors. Licensee MDPI, Basel, Switzerland. This article is an open access article distributed under the terms and conditions of the Creative Commons Attribution (CC BY) license (http://creativecommons.org/licenses/by/4.0/).
Share and Cite
Boqué Ciurana, A.; Aguilar, E. Which Meteorological and Climatological Information Is Requested for Better Surfing Experiences? A Survey-Based Analysis. Atmosphere 2021, 12, 293. https://doi.org/10.3390/atmos12030293
Boqué Ciurana A, Aguilar E. Which Meteorological and Climatological Information Is Requested for Better Surfing Experiences? A Survey-Based Analysis. Atmosphere. 2021; 12(3):293. https://doi.org/10.3390/atmos12030293
Chicago/Turabian StyleBoqué Ciurana, Anna, and Enric Aguilar. 2021. "Which Meteorological and Climatological Information Is Requested for Better Surfing Experiences? A Survey-Based Analysis" Atmosphere 12, no. 3: 293. https://doi.org/10.3390/atmos12030293
APA StyleBoqué Ciurana, A., & Aguilar, E. (2021). Which Meteorological and Climatological Information Is Requested for Better Surfing Experiences? A Survey-Based Analysis. Atmosphere, 12(3), 293. https://doi.org/10.3390/atmos12030293