Impact of Inter-Regional Transport in a Low-Emission Scenario on PM2.5 in Hubei Province, Central China


Abstract
1. Introduction
2. Data and Methods
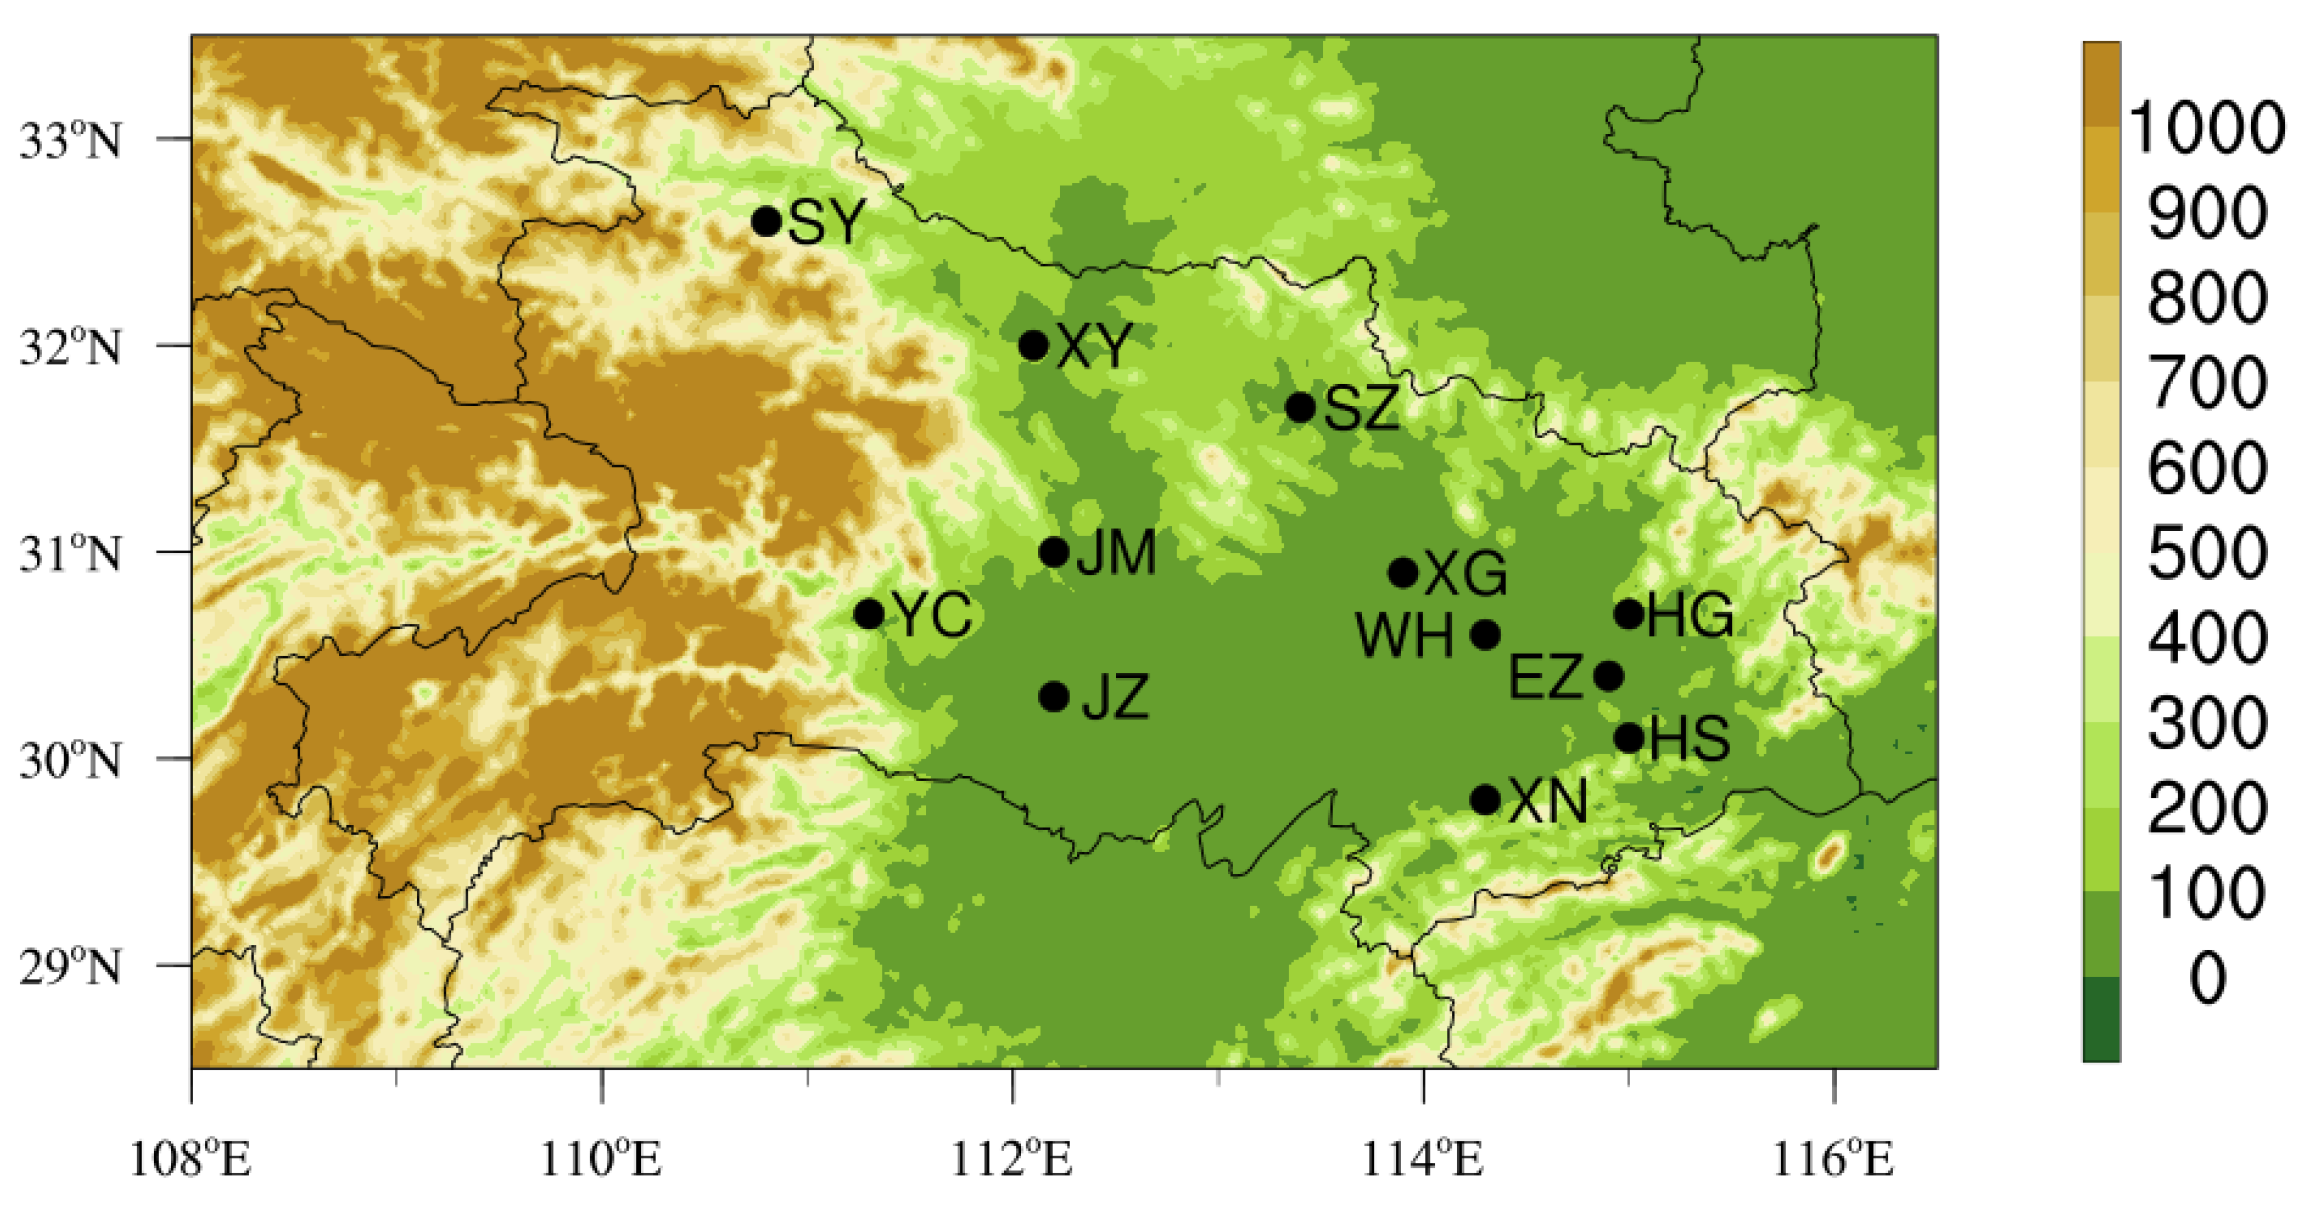
2.1. Data Source
2.2. EOF Method
2.3. Numerical Modeling
3. Results
3.1. PM2.5 Concentration Variation in Hubei during COVID-19
3.2. Spatial-Temporal Variation Characteristics of PM2.5 Pollution in Hubei Based on EOF Decomposition
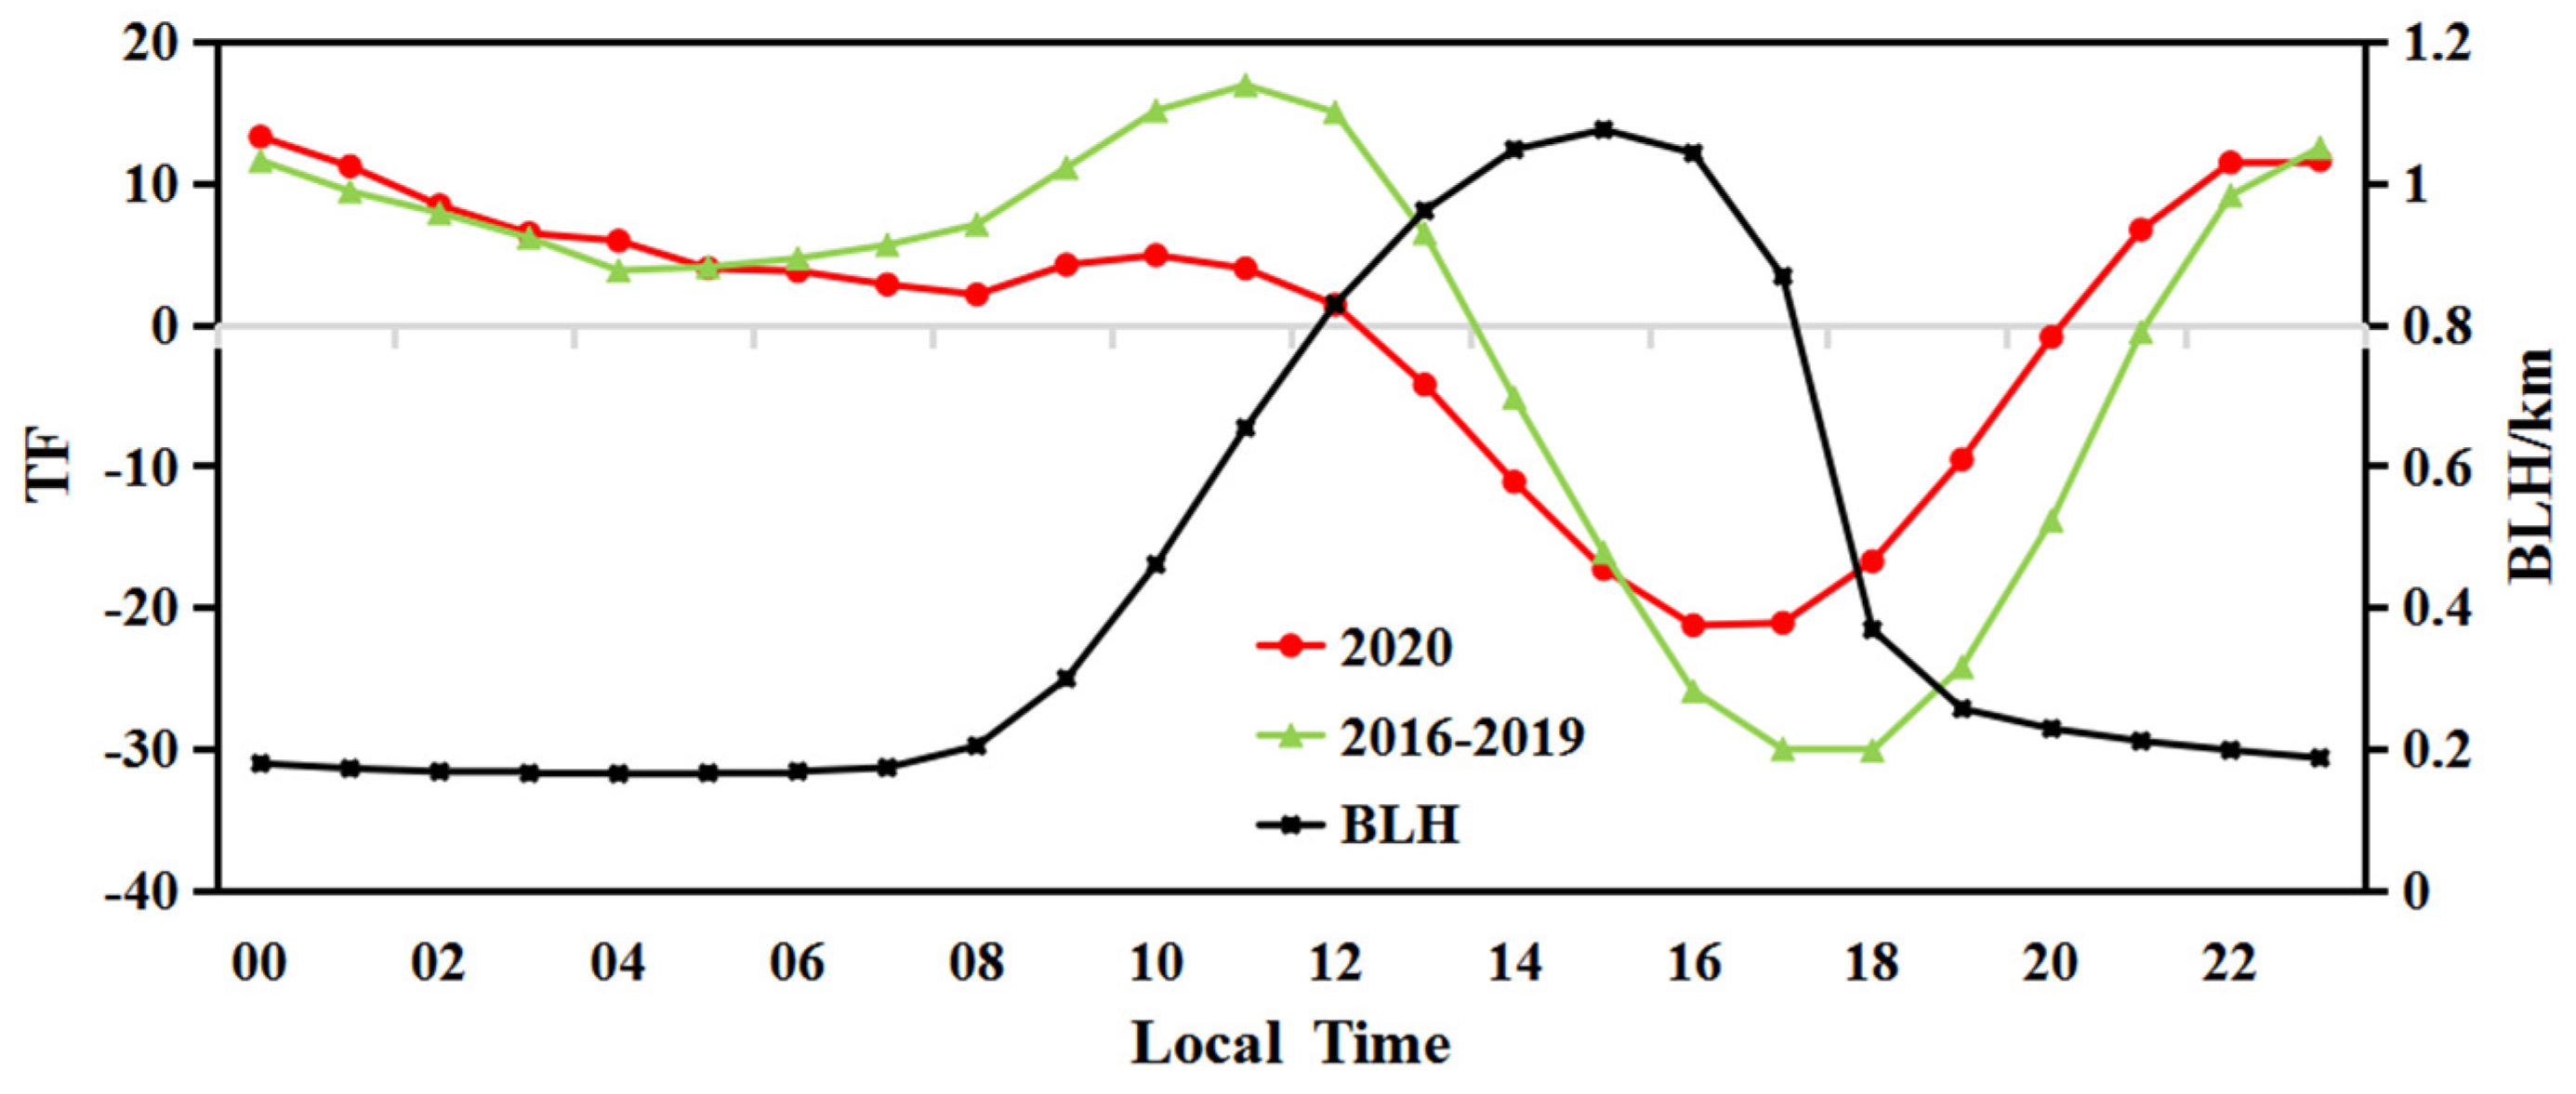
3.2.1. Diurnal Variation Characteristics of PM2.5 in Hubei
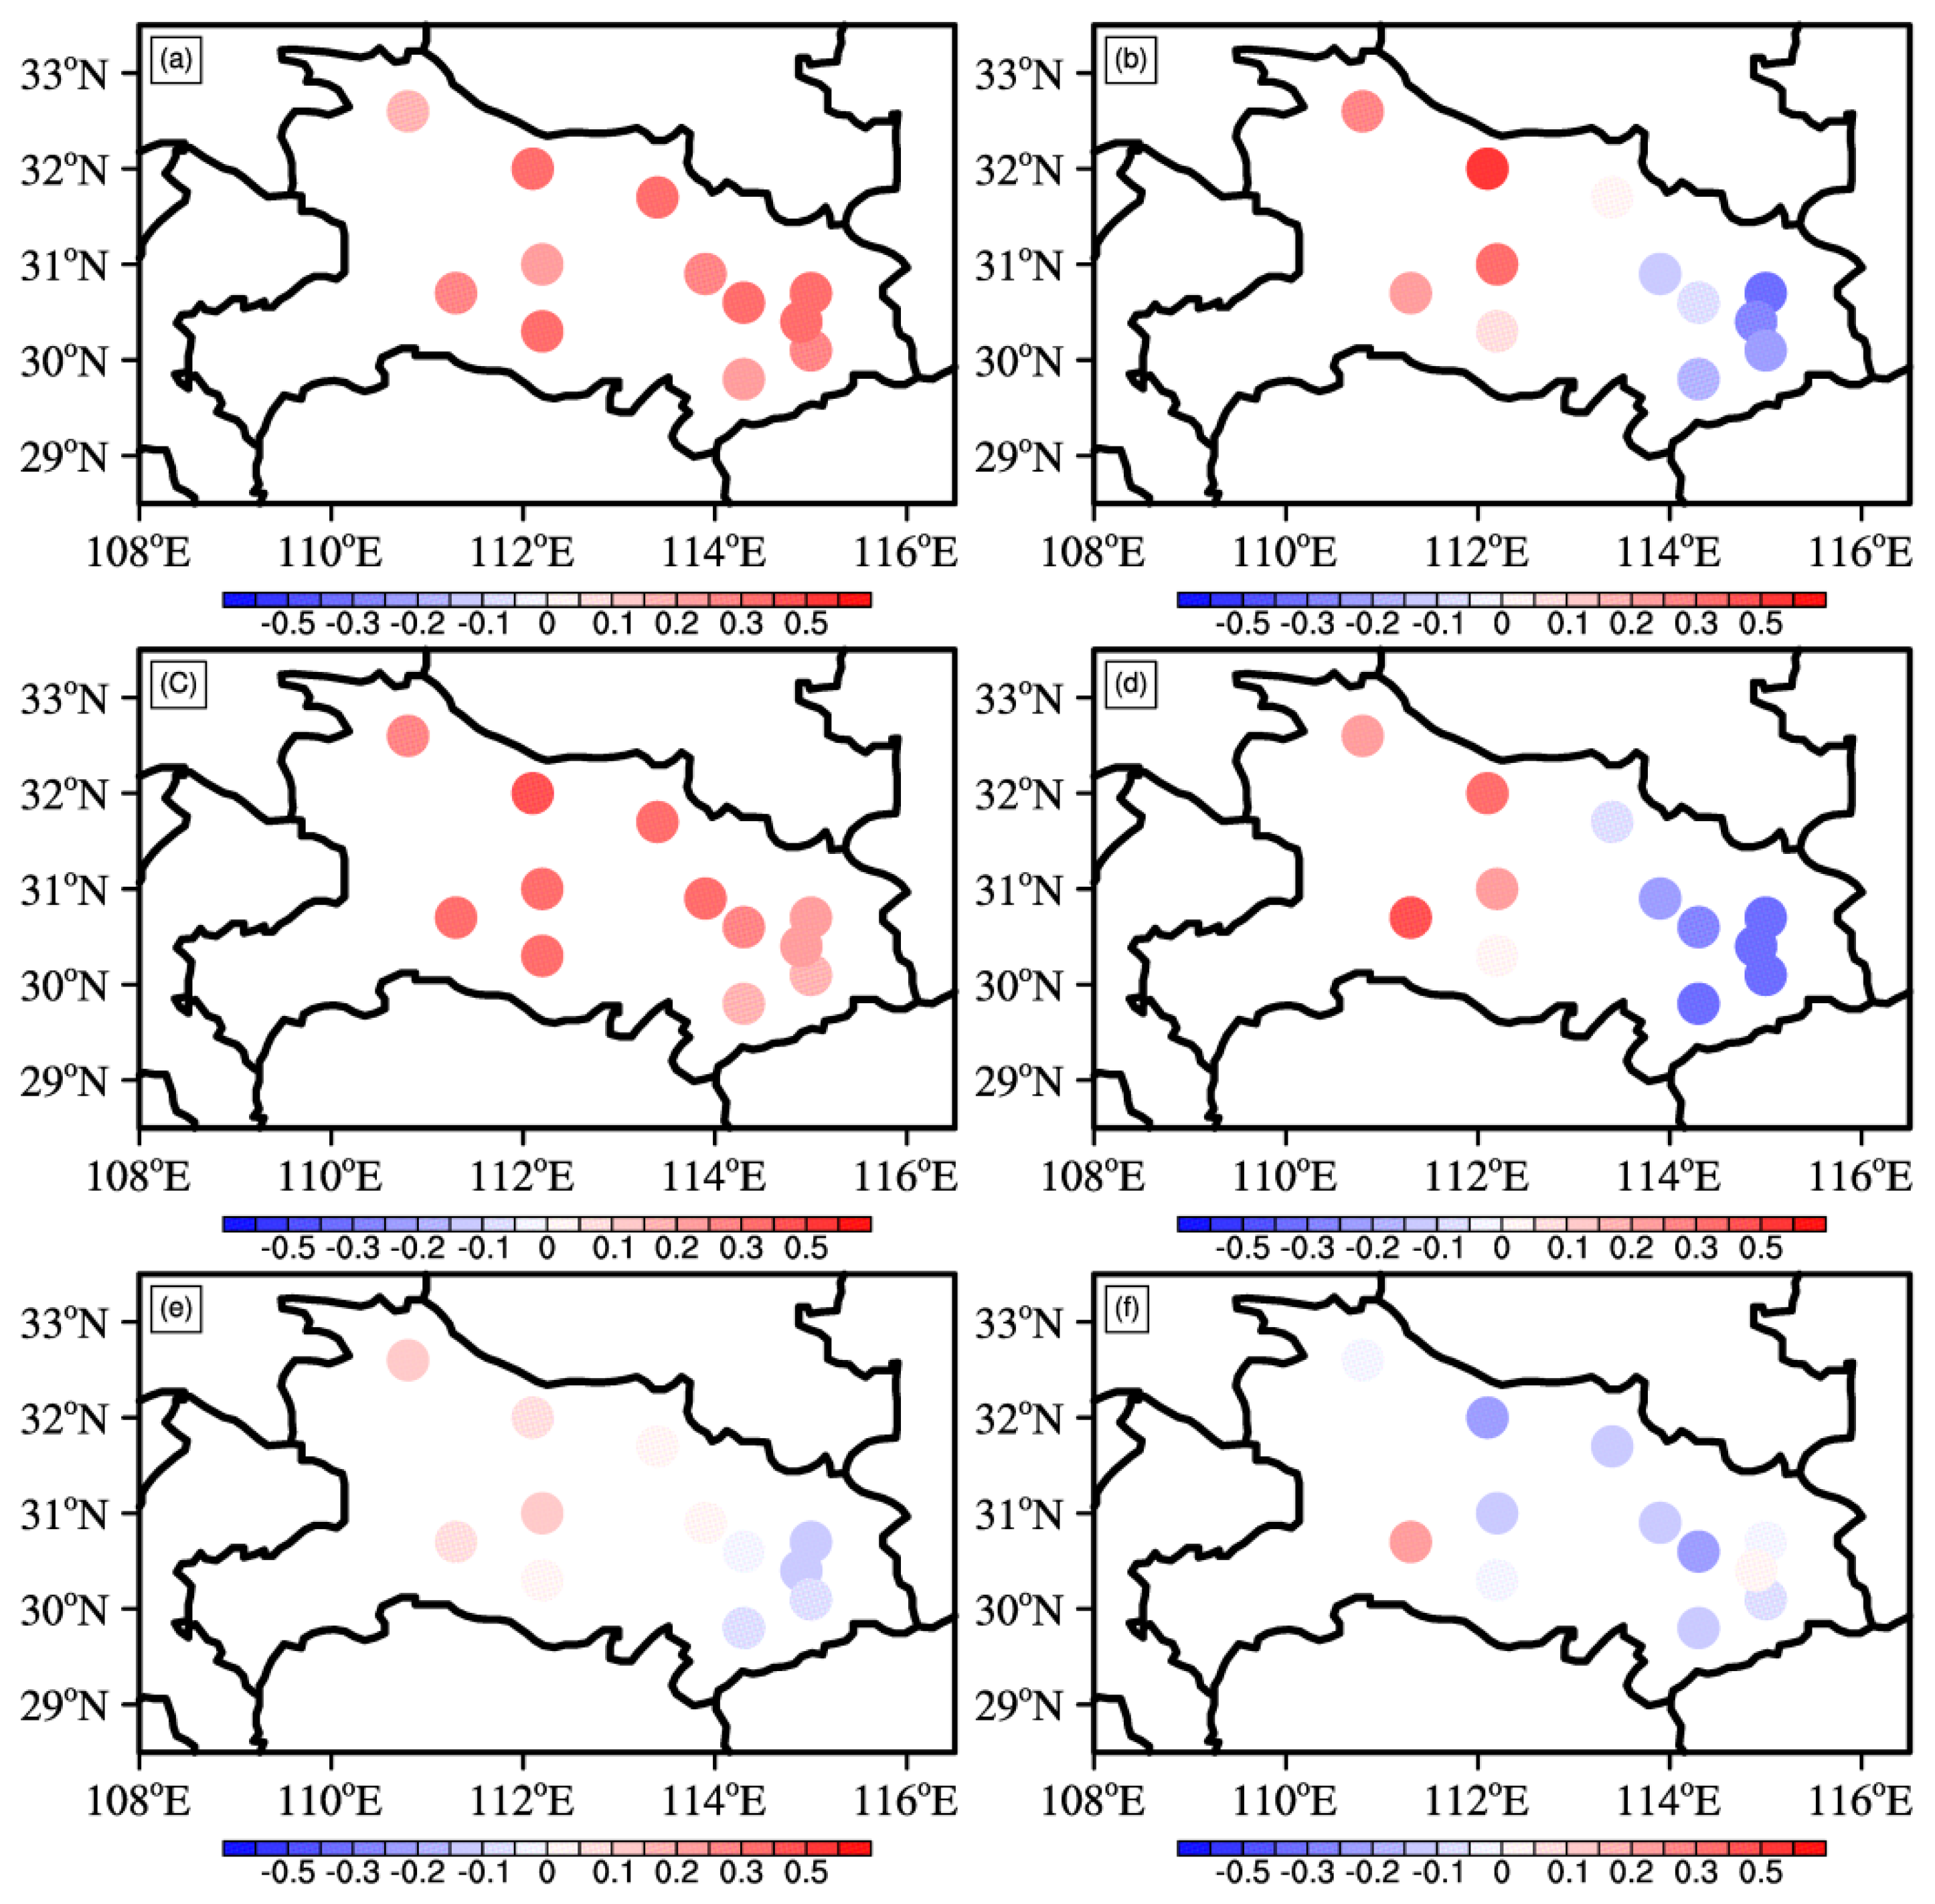
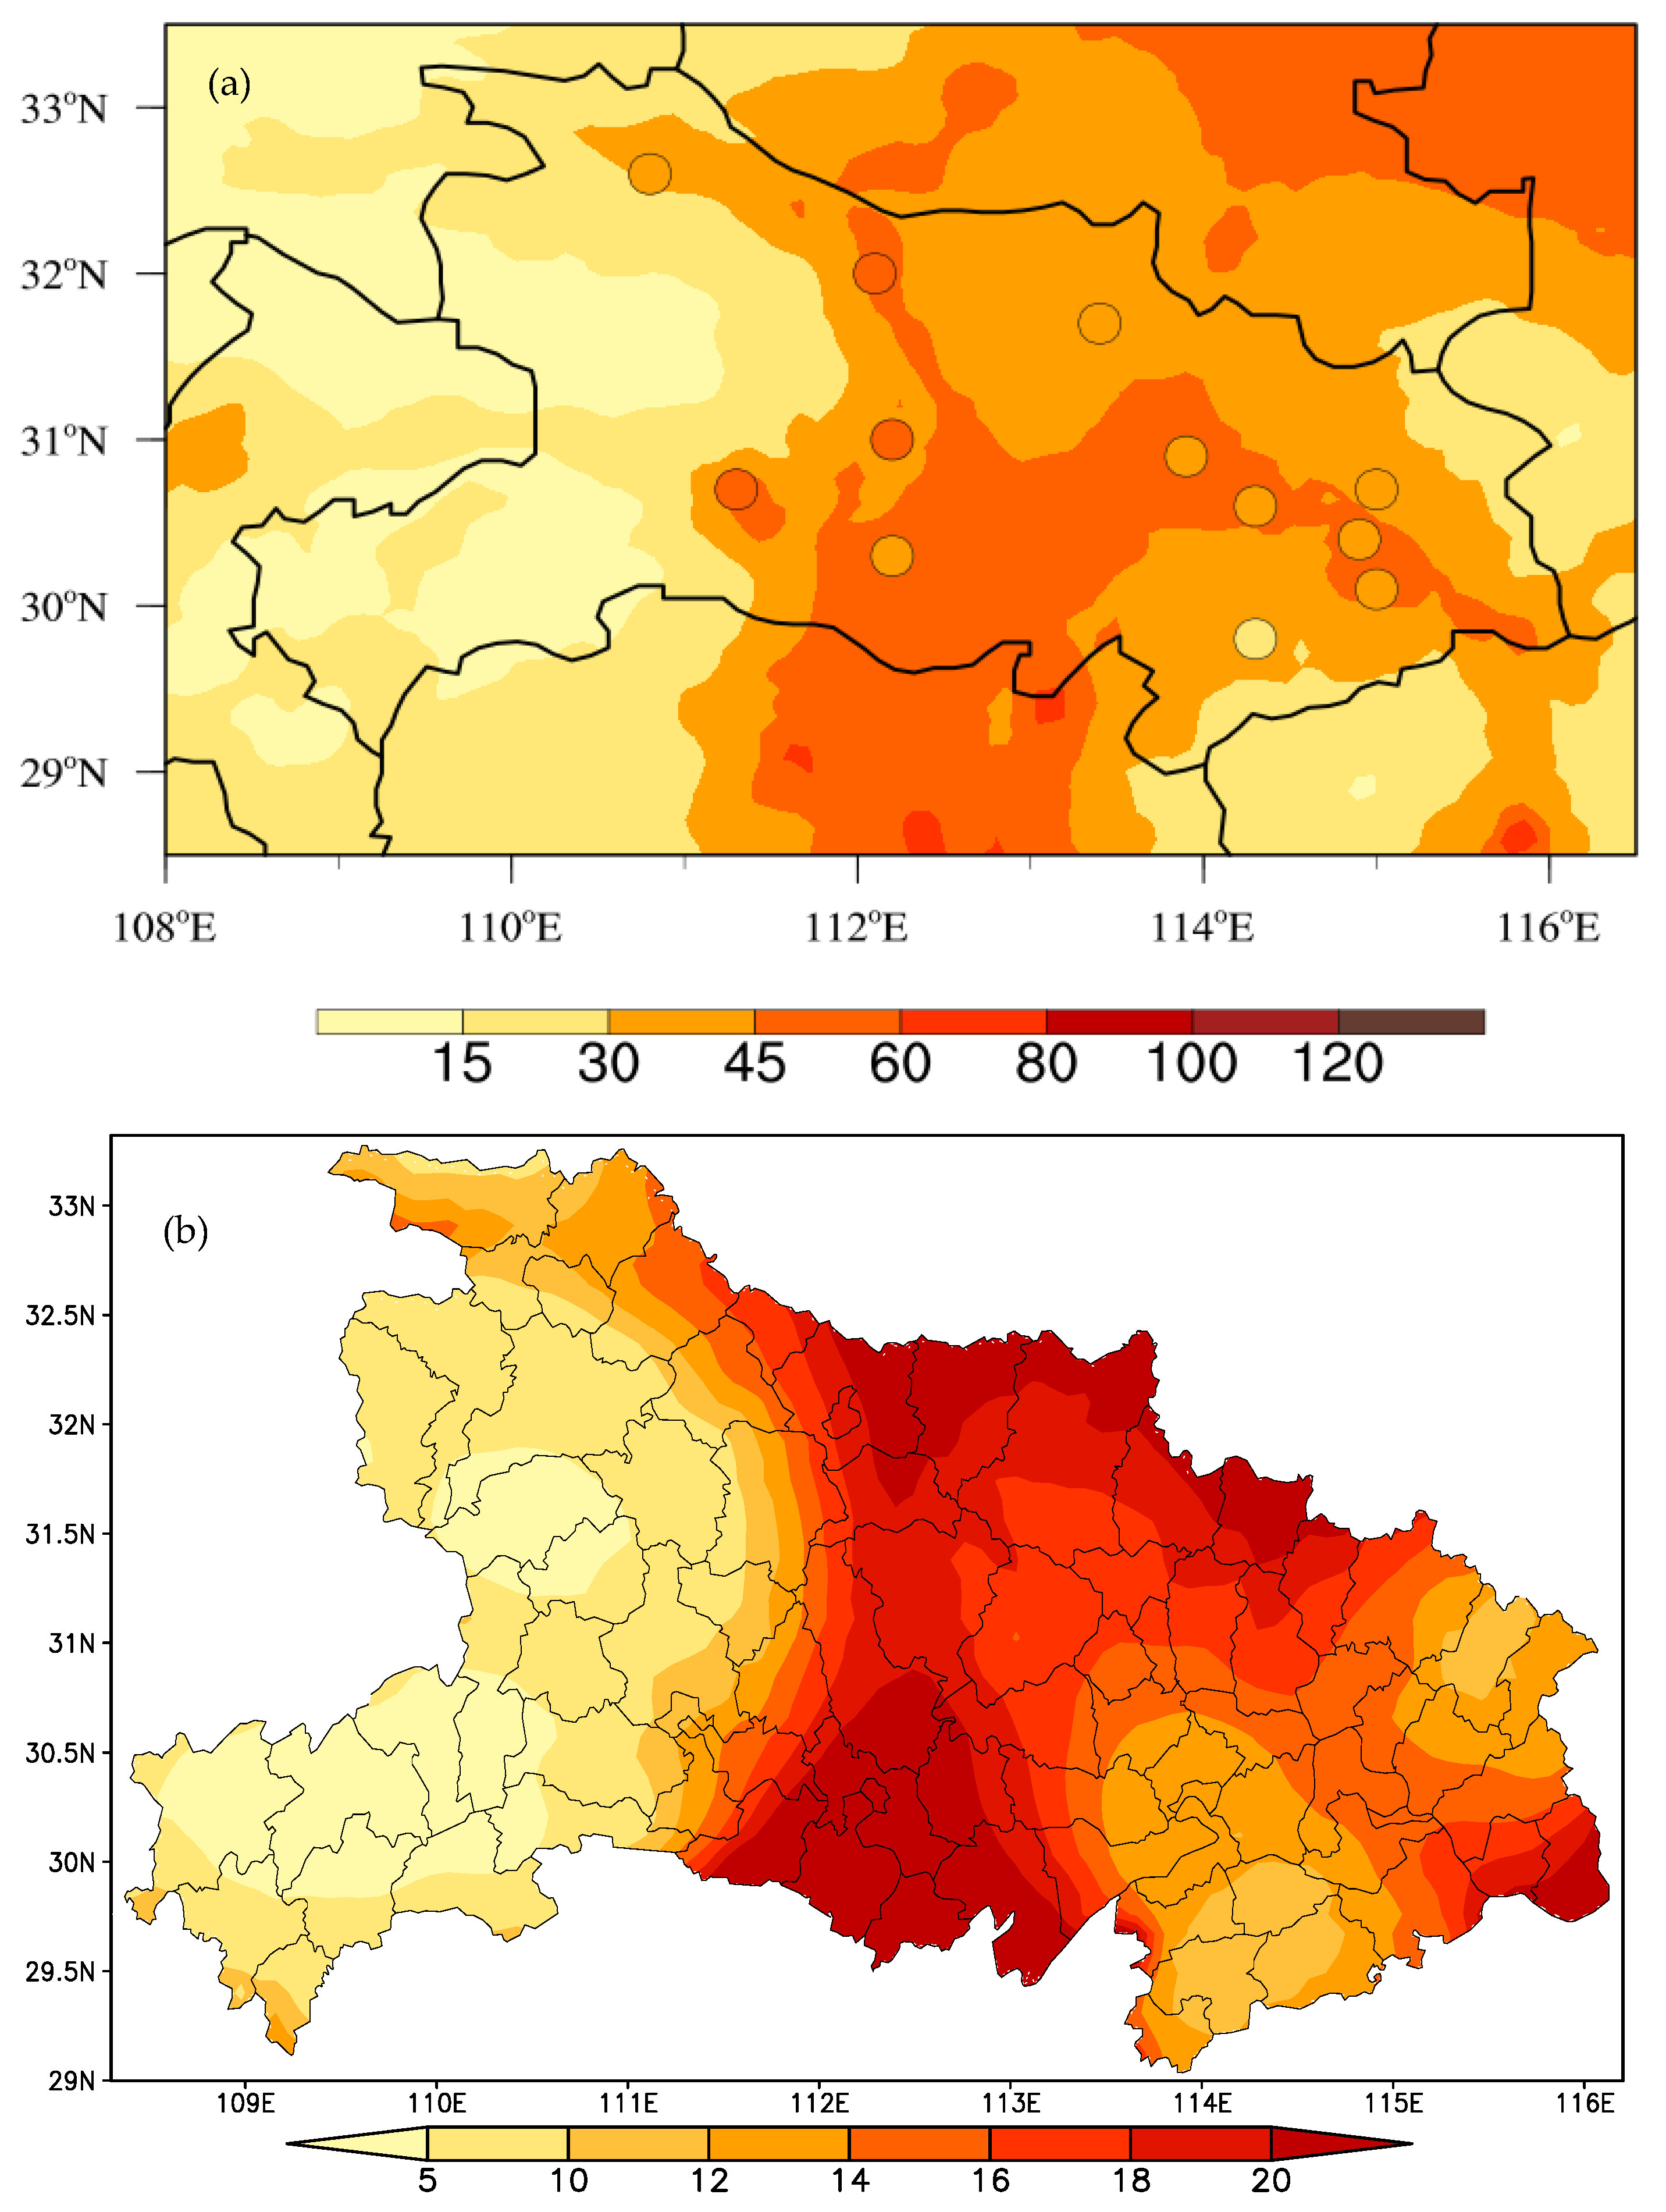
3.2.2. Spatial Variation Characteristics of PM2.5 in Hubei
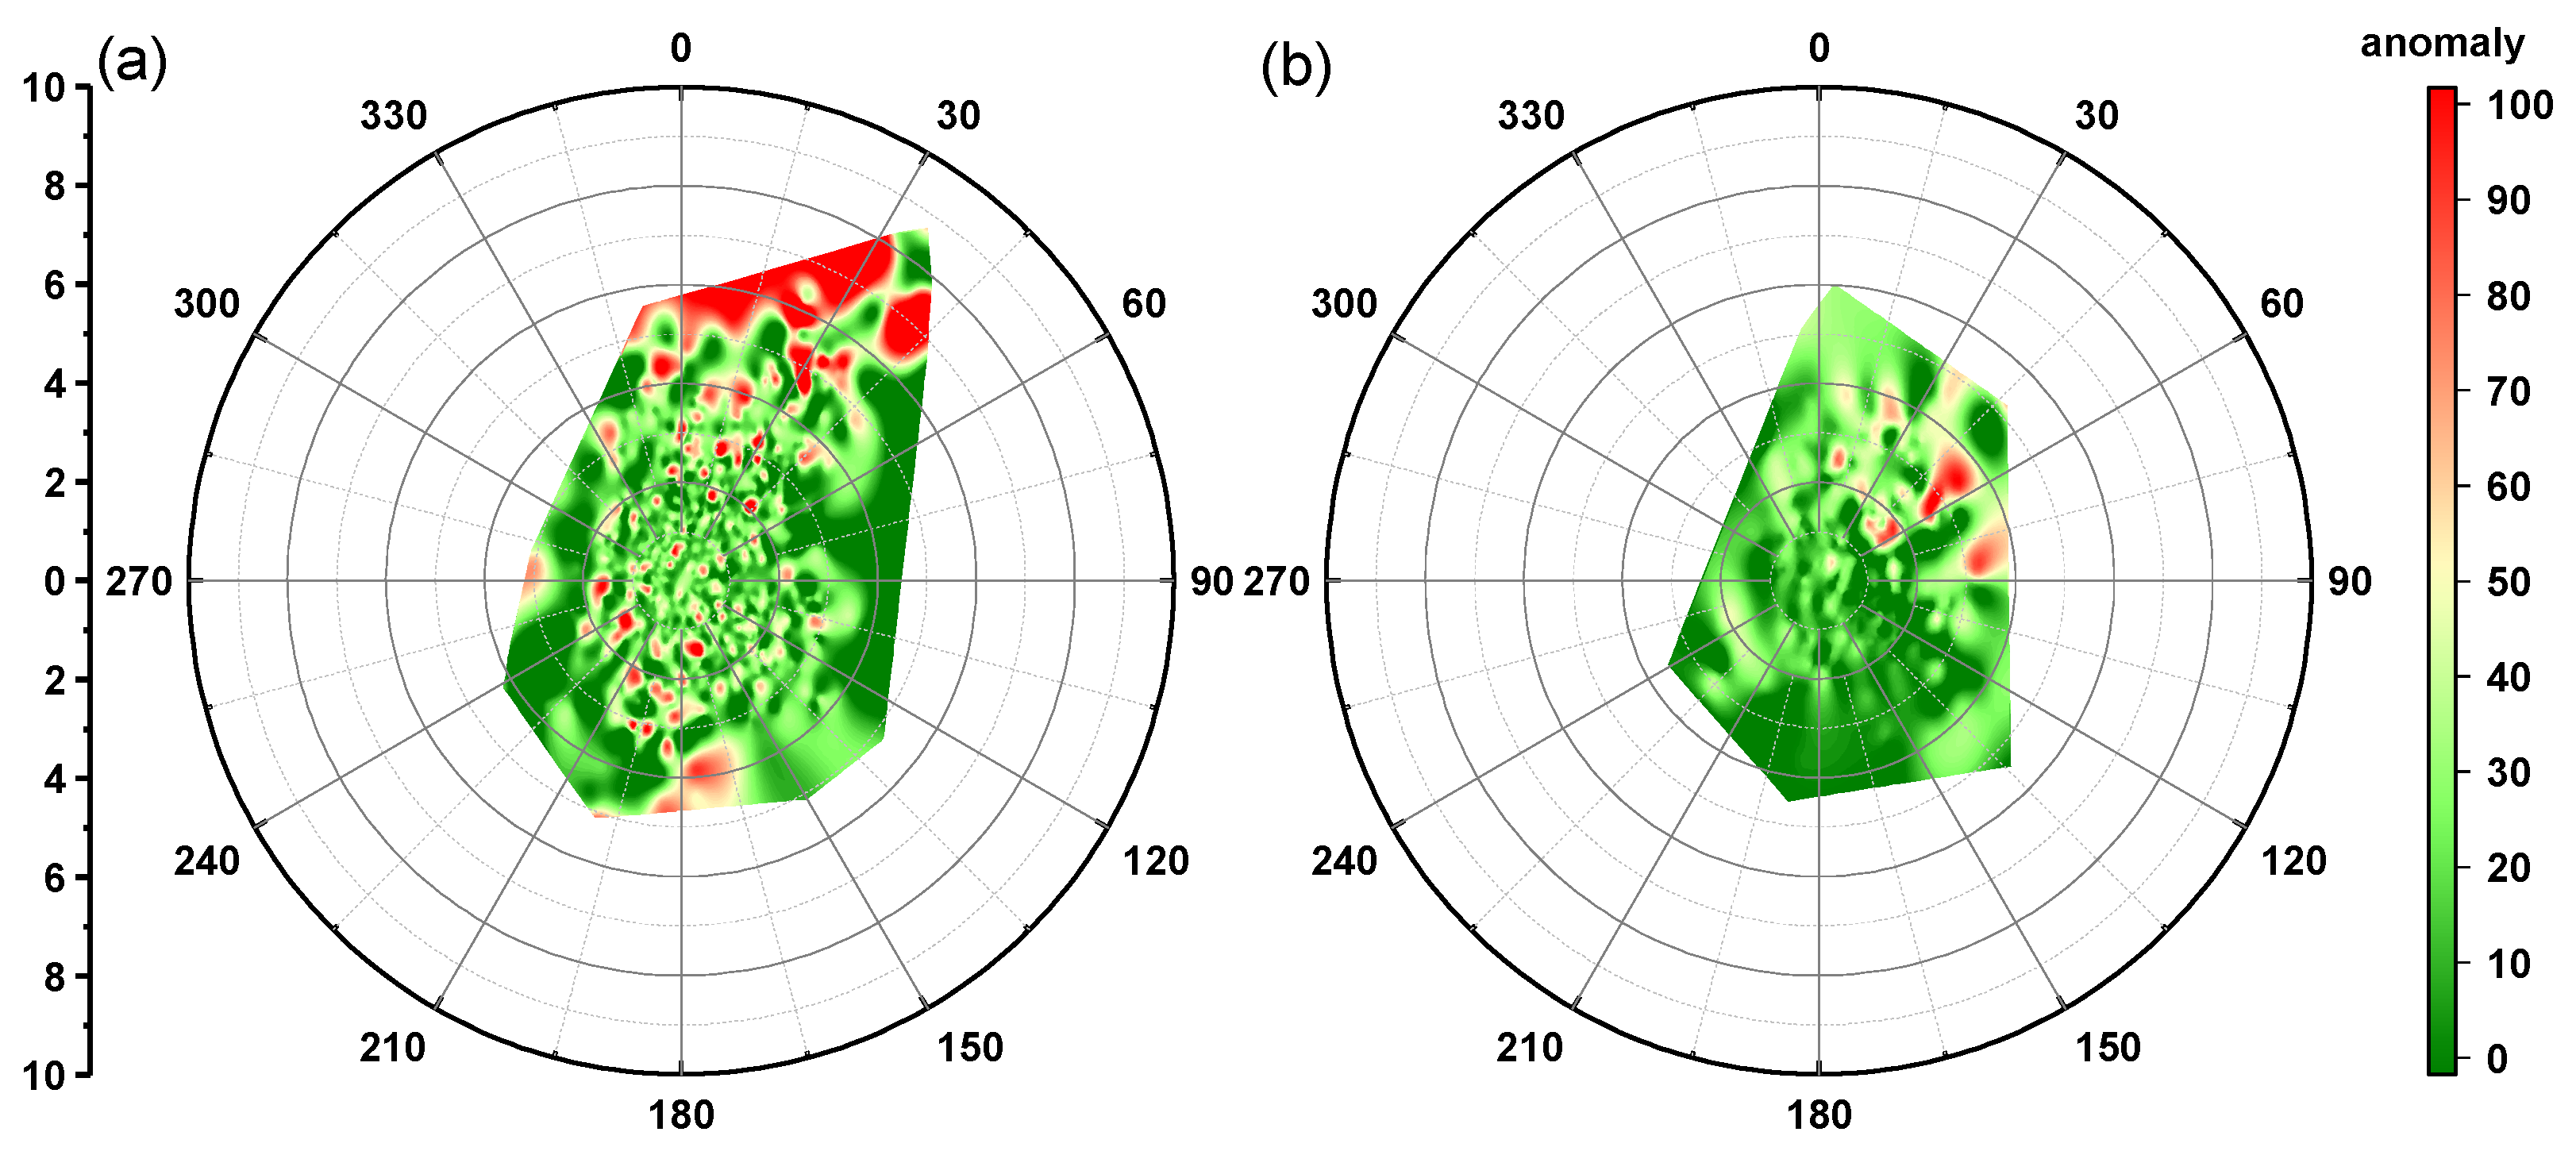
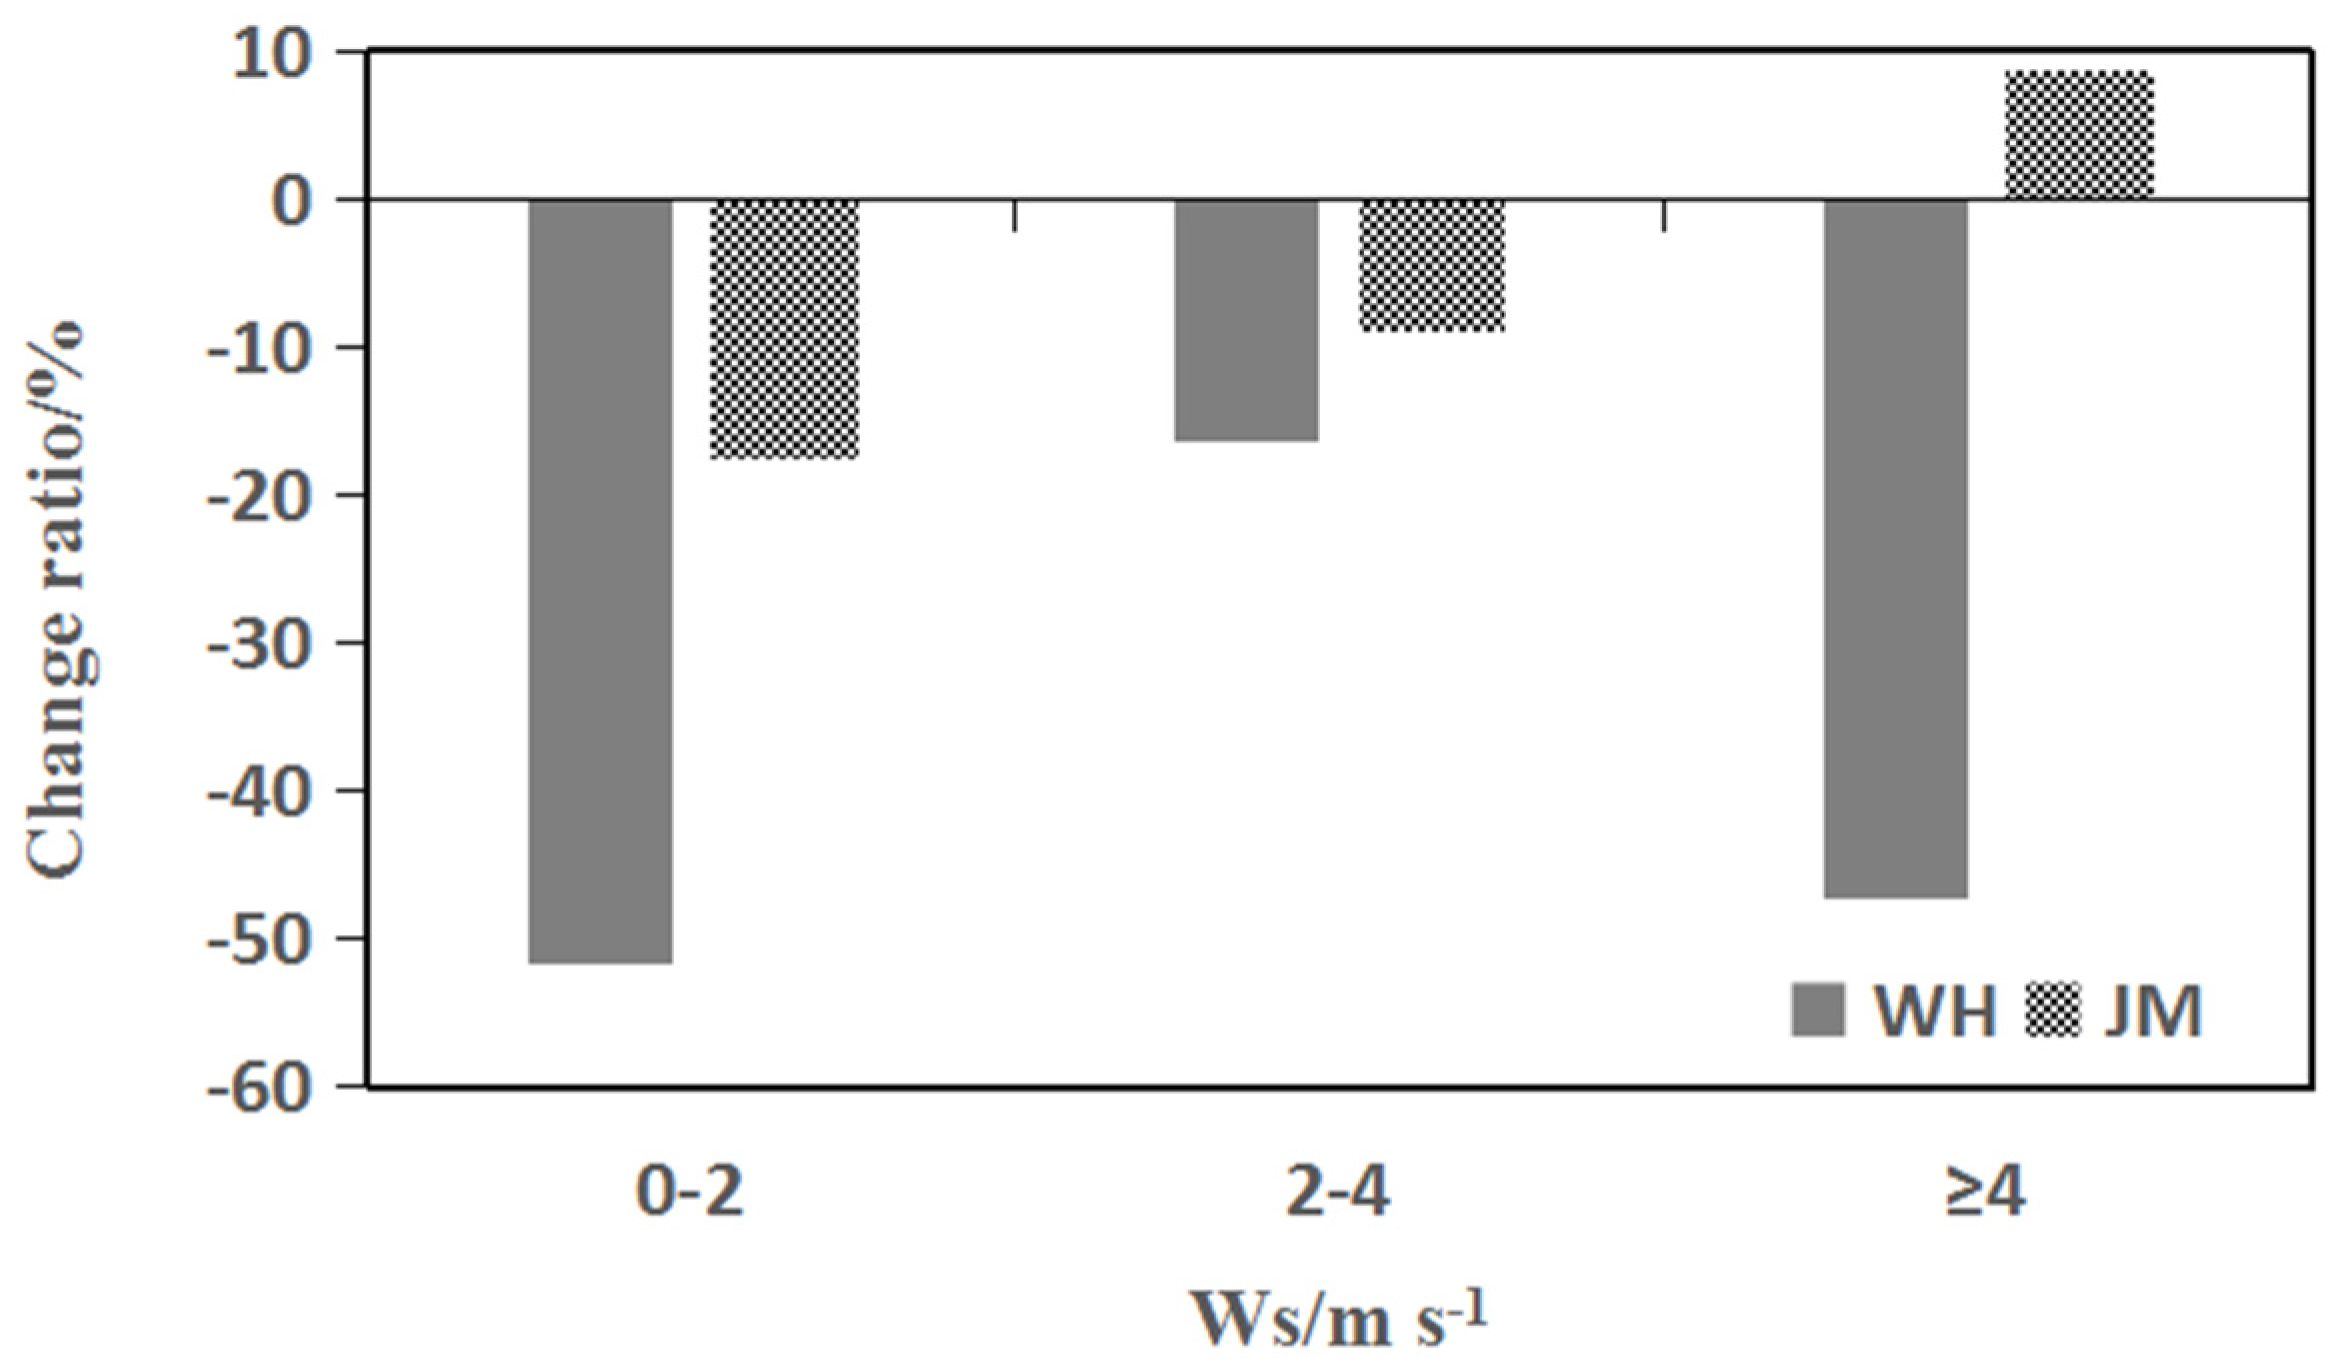
3.3. Variation Characteristics of Inter-Regional Transport
4. Discussion and Conclusions
Supplementary Materials
Author Contributions
Funding
Data Availability Statement
Acknowledgments
Conflicts of Interest
References
- Huang, X.; Ding, A.; Gao, J.; Zheng, B.; Zhou, D.; Qi, X.; Tang, R.; Wang, J.; Ren, C.; Nie, W.; et al. Enhanced secondary pollution offset reduction of primary emissions during COVID-19 lockdown in China. Natl. Sci. Rev. 2020. [Google Scholar] [CrossRef]
- Kong, S.F.; Li, L.; Li, X.X.; Yin, Y.; Chen, K.; Liu, D.; Yuan, L.; Zhang, Y.J.; Shan, Y.P.; Ji, Y.Q. The impacts of firework burning at the Chinese Spring Festival on air quality: Insights of tracers, source evolution and aging processes. Atmos. Chem. Phys. Discuss. 2015, 15, 2167–2184. [Google Scholar] [CrossRef]
- Zheng, H.; Kong, S.; Chen, N.; Yan, Y.; Liu, D.; Zhu, B.; Xu, K.; Cao, W.; Ding, Q.; Lan, B.; et al. Significant changes in the chemical compositions and sources of PM2.5 in Wuhan since the city lockdown as COVID-19. Sci. Total. Environ. 2020, 739, 140000. [Google Scholar] [CrossRef]
- Le, T.; Wang, Y.; Liu, L.; Yang, J.; Yung, Y.L.; Li, G.; Seinfeld, J.H. Unexpected air pollution with marked emission reductions during the COVID-19 outbreak in China. Science 2020, 369, 702–706. [Google Scholar] [CrossRef]
- Wang, P.; Chen, K.; Zhu, S.; Wang, P.; Zhang, H. Severe air pollution events not avoided by reduced anthropogenic activities during COVID-19 outbreak. Resour. Conserv. Recycl. 2020, 158, 104814. [Google Scholar] [CrossRef] [PubMed]
- Shen, L.; Zhao, T.; Wang, H.; Liu, J.; Bai, Y.; Kong, S.; Zheng, H.; Zhu, Y.; Shu, Z. Importance of meteorology in air pollution events during the city lockdown for COVID-19 in Hubei Province, Central China. Sci. Total. Environ. 2021, 754, 142227. [Google Scholar] [CrossRef]
- Bauwens, M.; Compernolle, S.; Stavrakou, T.; Müller, J.; Van Gent, J.; Eskes, H.; Levelt, P.F.; Van Der, A.R.; Veef kind, J.P.; Vlietinck, J.; et al. Impact of coronavirus outbreak on NO2 pollution assessed using TROPOMI and OMI observations. Geophys. Res. Lett. 2020, 47, e2020GL087978. [Google Scholar] [CrossRef]
- Zhang, R.; Zhang, Y.; Lin, H.; Feng, X.; Fu, T.-M.; Wang, Y. NOx emission reduction and recovery during COVID-19 in East China. Atmosphere 2020, 11, 433. [Google Scholar] [CrossRef]
- Cui, Y.; Ji, D.; Maenhaut, W.; Gao, W.; Zhang, R.; Wang, Y. Levels and sources of hourly PM2.5-related elements during the control period of the COVID-19 pandemic at a rural site between Beijing and Tianjin. Sci. Total. Environ. 2020, 744, 140840. [Google Scholar] [CrossRef] [PubMed]
- Yuan, Q.; Qi, B.; Hu, D.; Wang, J.; Zhang, J.; Yang, H.; Zhang, S.; Liu, L.; Xu, L.; Li, W. Spatiotemporal variations and reduction of air pollutants during the COVID-19 pandemic in a megacity of Yangtze River Delta in China. Sci. Total. Environ. 2021, 751, 141820. [Google Scholar] [CrossRef]
- Xu, L.; Zhang, J.; Sun, X.; Xu, S.; Shan, M.; Yuan, Q.; Liu, L.; Du, Z.; Liu, D.; Xu, D.; et al. Variation in concentration and sources of black carbon in a megacity of China during the COVID-19 pandemic. Geophys. Res. Lett. 2020, 47, e2020GL090444. [Google Scholar] [CrossRef]
- Kim, C.-H.; Park, S.-Y.; Kim, Y.-J.; Chang, L.-S.; Song, S.-K.; Moon, Y.-S.; Song, C.-K. A numerical study on indicators of long-range transport potential for anthropogenic particulate matters over northeast Asia. Atmos. Environ. 2012, 58, 35–44. [Google Scholar] [CrossRef]
- Lang, J.; Cheng, S.; Li, J.; Chen, D.; Zhou, Y.; Wei, X.; Han, L.; Wang, H. A monitoring and modeling study to investigate regional transport and characteristics of PM2.5 pollution. Aerosol Air Qual. Res. 2013, 13, 943–956. [Google Scholar] [CrossRef]
- Wu, D.; Fung, J.C.H.; Yao, T.; Lau, A.K.H. A study of control policy in the Pearl River Delta region by using the particulate matter source apportionment method. Atmos. Environ. 2013, 76, 147. [Google Scholar] [CrossRef]
- Xu, X.D.; Ding, G.A. Generalized method of urban air pollutant source tracking and integration approach of nudging source assimilation. Eng. Sci. 2012, 14, 10–22. (In Chinese) [Google Scholar]
- Yang, Y.; Quan, J.; Wang, Y.; Zhang, Y.; Cao, G.; Zhang, Q.; Wang, W.; Wang, J.; Sun, J.; Zhang, X.; et al. Factors contributing to haze and fog in China. Chin. Sci. Bull. (ChinVer) 2013, 58, 1178–1187. [Google Scholar] [CrossRef]
- Gao, M.; Carmichael, G.R.; Wang, Y.; Saide, P.E.; Yu, M.; Xin, J.; Liu, Z.; Wang, Z. Modeling study of the 2010 regional haze event in the North China Plain. Atmos. Chem. Phys. 2016, 16, 1673–1691. [Google Scholar] [CrossRef]
- Li, J.; Du, H.; Wang, Z.; Sun, Y.; Yang, W.; Li, J.; Tang, X.; Fu, P. Rapid formation of a severe regional winter haze episode over a mega-city cluster on the North China Plain. Environ. Pollut. 2017, 223, 605–615. [Google Scholar] [CrossRef]
- Wu, P.; Ding, Y.; Liu, Y. Atmospheric circulation and dynamic mechanism for persistent haze events in the Beijing-Tianjin-Hebei region. Adv. Atmos. Sci. 2017, 34, 429–440. [Google Scholar] [CrossRef]
- Ji, Y.; Qin, X.; Wang, B.; Xu, J.; Shen, J.; Chen, J.; Huang, K.; Deng, C.; Yan, R.; Xu, K.; et al. Counteractive effects of regional transport and emission control on the formation of fine particles: A case study during the Hangzhou G20 summit. Atmos. Chem. Phys. 2018, 18, 13581–13600. [Google Scholar] [CrossRef]
- Shen, L.-J.; Wang, H.-L.; Zhao, T.; Liu, J.; Bai, Y.; Kong, S.-F.; Shu, Z.-Z. Characterizing regional aerosol pollution in central China based on 19 years of MODIS data: Spatiotemporal variation and aerosol type discrimination. Environ. Pollut. 2020, 263, 114556. [Google Scholar] [CrossRef]
- Yu, C.; Zhao, T.; Bai, Y.; Zhang, L.; Kong, S.; Yu, X.; He, J.; Cui, C.; Yang, J.; You, Y.; et al. Heavy air pollution with a unique “non-stagnant” atmospheric boundary layer in the Yangtze River middle basin aggravated by regional transport of PM2.5 over China. Atmos. Chem. Phys. 2020, 20, 7217–7230. [Google Scholar] [CrossRef]
- Lu, M.; Tang, X.; Wang, Z.; Wu, L.; Chen, X.; Liang, S.; Zhou, H.; Wu, H.; Hu, K.; Shen, L.; et al. Investigating the Transport Mechanism of PM2.5 Pollution during January 2014 in Wuhan, Central China. Adv. Atmos. Sci. 2019, 36, 1217–1234. [Google Scholar] [CrossRef]
- Department of Ecology and Environment Hubei Province. Available online: http://sthjt.hubei.gov.cn/hjsj/sjfb/ (accessed on 12 January 2021).
- Lorenz, E.N. Empirical Orthogonal Functions and Statistical Weather Prediction; Statistical Forecasting Project; Scientific Report No. 1; Dep. Meteorol MIT: Cambridge, MA, USA, 1956; p. 49. [Google Scholar]
- von Storch, H.; Zwiers, F.W. Statistical Analysis in Climate Research; Cambridge University Press: Cambridge, UK, 2002; p. 496. [Google Scholar]
- Schepanski, K.; Mallet, M.; Heinold, B.; Ulrich, M. North African dust transport toward the western Mediterranean basin: Atmospheric controls on dust source activation and transport pathways during during June–July 2013. Atmos. Chem. Phys. 2016, 16, 14147–14168. [Google Scholar] [CrossRef]
- Wu, X.Y.; Ye, C.Z.; Wang, Q. Analysis on the climatic characteristics of precipitation in rainy season in the Two-lake Region. Torrential Rain Disasters 2016, 35, 497–503. (In Chinese) [Google Scholar]
- Sun, Y.; Yin, D.P.; Yao, L.N.; Cao, S.Y. Spatial-temporal distribution and circulation features of the Meiyu precipitation anomaly in Jiangsu in the latest 50 years. Torrential Rain Disasters 2012, 31, 149–154. (In Chinese) [Google Scholar]
- Wei, F.Y. Modern Climate Statistical Diagnosis and Prediction Technology: II; China Meteorological Press: Beijing, China, 2007. (In Chinese) [Google Scholar]
- Sha, T.; Ma, X.; Wang, J.; Tian, R.; Zhao, J.; Cao, F.; Zhang, Y.-L. Improvement of inorganic aerosol component in PM2.5 by constraining aqueous-phase formation of sulfate in cloud with satellite retrievals: WRF-Chem simulations. Atmos. Chem. Phys. 2020. in review. [Google Scholar] [CrossRef]
- Grell, G.A.; Peckham, S.E.; Schmitz, R.; McKeen, S.A.; Frost, G.; Skamarock, W.C.; Edere, B. Fully coupled “online” chemistry within the WRF model. Atmos. Environ. 2005, 39, 6957–6975. [Google Scholar] [CrossRef]
- Gustafson, W.I.; Chapman, E.G.; Ghan, S.J.; Easter, R.C.; Fast, J.D. Impact on modeled cloud characteristics due to simplified treatment of uniform cloud condensation nuclei during NEAQS 2004. Geophys. Res. Lett. 2007, 34, 255–268. [Google Scholar] [CrossRef]
- Guo, J.; He, J.; Liu, H.; Miao, Y.; Liu, H.; Zhai, P. Impact of various emission control schemes on air quality using WRF-Chem during APEC China 2014. Atmos. Environ. 2016, 140, 311–319. [Google Scholar] [CrossRef]
- Lennartson, E.M.; Wang, J.; Gu, J.; Garcia, L.C.; Ge, C.; Gao, M.; Choi, M.; Saide, P.; Carmichael, G.R.; Kim, J.; et al. Diurnal variation of aerosol optical depth and PM2.5 in South Korea: A synthesis from AERONET, satellite (GOCI), KORUS-AQ observation, and the WRF-Chem model. Atmos. Chem. Phys. 2018, 18, 15125–15144. [Google Scholar] [CrossRef]
- Bai, Y.; Qi, H.; Zhao, T.; Zhou, Y.; Liu, L.; Xiong, J.; Zhou, Z.; Cui, C. Simulation of the responses of rainstorm in the Yangtze River Middle Reaches to changes in anthropogenic aerosol emissions. Atmos. Environ. 2020, 220, 117081. [Google Scholar] [CrossRef]
- Liu, L.; Bai, Y.Q.; Lin, C.Z.; Yang, H. Evaluation of Regional Air Quality Numerical Forecasting System in Central China and Its Application for Aerosol Radiative Effect. Meteorol. Mon. 2018, 44, 1179–1190. (In Chinese) [Google Scholar]
- Hong, S.Y.; Noh, Y.; Dudhia, J. A New Vertical Diffusion Package with an Explicit Treatment of Entrainment Processes. Mon. Weather Rev. 2006, 134, 2318–2341. [Google Scholar] [CrossRef]
- Mlawer, E.J.; Taubman, S.J.; Brown, P.D.; Iacono, M.J.; Clough, S.A. Radiative transfer for inhomogeneous atmospheres: RRTM, a validated correlated-k model for the longwave. J. Geophys. Res. 1997, 102, 16663. [Google Scholar] [CrossRef]
- Chou, M.D.; Suarez, M.J. An Efficient Thermal Infrared Radiation Parameterization 491 for Use in General Circulation Models; NASA Technical Memorandum 104606; National Aeronautics and Space Administration: Greenbelt, MD, USA, 1994; p. 85. [Google Scholar]
- Tewari, M.; Chen, F.; Wang, W.; Dudhia, J.; LeMone, M.A.; Mitchell, K.; GaynoEk, M.; Wegiel, G.J.; Cuenca, R.H. Implementation and verification of the unified NOAH land surface model in the WRF model. In Proceedings of the 20th conference on weather analysis and forecasting/16th conference on numerical weather prediction, Seattle, WA, USA, 12–16 January 2004; pp. 11–15. [Google Scholar]
- Stockwell, W.R.; Middleton, P.; Chang, J.S.; Tang, X. The second generation regional acid deposition model chemical mechanism for regional air quality modeling. J. Geophys. Res. Atmos. 1990, 95, 16343–16367. [Google Scholar] [CrossRef]
- MEIC Model. Available online: http://www.neicmodel.org (accessed on 12 January 2021).
- Li, M.; Zhang, Q.; Kurokawa, J.-I.; Woo, J.-H.; He, K.; Lu, Z.; Ohara, T.; Song, Y.; Streets, D.G.; Carmichael, G.R.; et al. MIX: A mosaic Asian anthropogenic emission inventory under the international collaboration framework of the MICS-Asia and HTAP. Atmos. Chem. Phys 2017, 17, 935–963. [Google Scholar] [CrossRef]
- NCEP FNL Operational Model Global Tropospheric Analyses, continuing from July 1999. Available online: http://rda.ucar.edu/datasets/ds083.2/ (accessed on 12 January 2021).
- Qi, H.X.; Cui, C.G.; Zhao, T.L.; Bai, Y.Q.; Liu, L. Numerical simulation on the characteristics of PM2.5 heavy pollution and the influence of weather system in Hubei Province in winter 2015. Meteor Mon. 2019, 45, 1113–1122. (In Chinese) [Google Scholar]
- Lu, M.; Tang, X.; Wang, Z.; Gbaguidi, A.; Liang, S.; Hu, K.; Wu, L.; Wu, H.; Huang, H.; Shen, L. Source tagging modeling study of heavy haze episodes under complex regional transport processes over Wuhan megacity, Central China. Environ. Pollut. 2017, 231, 612–621. [Google Scholar] [CrossRef] [PubMed]
- Yue, Y.Y.; Wang, X.L.; Zhang, M.X.; Cao, W.X.; Zhou, Y.; Chen, S.N.; Zhu, Y. Air quality condition in Wuhan and its relationship to meteorological factors. Torrential Rain Disasters 2016, 35, 271–278. (In Chinese) [Google Scholar]
- Lian, X.; Huang, J.; Huang, R.; Liu, C.; Wang, L.; Zhang, T. Impact of city lockdown on the air quality of COVID-19-hit of Wuhan city. Sci. Total. Environ. 2020, 742, 140556. [Google Scholar] [CrossRef] [PubMed]
- Hu, W.; Zhao, T.; Bai, Y.; Kong, S.; Xiong, J.; Sun, X.; Yang, Q.; Gu, Y.; Lu, H. Importance of regional PM2.5 transport and precipitation washout in heavy air pollution in the Twain-Hu Basin over Central China: Observational analysis and WRF-Chem simulation. Sci. Total. Environ. 2021, 758, 143710. [Google Scholar] [CrossRef] [PubMed]
- Hu, W.; Zhao, T.; Bai, Y.; Shen, L.; Sun, X.; Gu, Y. Contribution of Regional PM2.5 Transport to Air Pollution Enhanced by Sub-Basin Topography: A Modeling Case over Central China. Atmosphere 2020, 11, 1258. [Google Scholar] [CrossRef]


| Eigenvectors/Year | 2016 | 2017 | 2018 | 2019 | 2020 |
|---|---|---|---|---|---|
| EOF1 | 64.09 | 64.01 | 61.57 | 65.69 | 68.95 |
| EOF2 | 13.43 | 13.93 | 14.94 | 14.78 | 10.65 |
| EOF1 + EOF2 | 77.52 | 77.94 | 76.51 | 80.47 | 79.60 |
Publisher’s Note: MDPI stays neutral with regard to jurisdictional claims in published maps and institutional affiliations. |
© 2021 by the authors. Licensee MDPI, Basel, Switzerland. This article is an open access article distributed under the terms and conditions of the Creative Commons Attribution (CC BY) license (http://creativecommons.org/licenses/by/4.0/).
Share and Cite
Xiong, J.; Bai, Y.; Zhao, T.; Kong, S.; Hu, W. Impact of Inter-Regional Transport in a Low-Emission Scenario on PM2.5 in Hubei Province, Central China. Atmosphere 2021, 12, 250. https://doi.org/10.3390/atmos12020250
Xiong J, Bai Y, Zhao T, Kong S, Hu W. Impact of Inter-Regional Transport in a Low-Emission Scenario on PM2.5 in Hubei Province, Central China. Atmosphere. 2021; 12(2):250. https://doi.org/10.3390/atmos12020250
Chicago/Turabian StyleXiong, Jie, Yongqing Bai, Tianliang Zhao, Shaofei Kong, and Weiyang Hu. 2021. "Impact of Inter-Regional Transport in a Low-Emission Scenario on PM2.5 in Hubei Province, Central China" Atmosphere 12, no. 2: 250. https://doi.org/10.3390/atmos12020250
APA StyleXiong, J., Bai, Y., Zhao, T., Kong, S., & Hu, W. (2021). Impact of Inter-Regional Transport in a Low-Emission Scenario on PM2.5 in Hubei Province, Central China. Atmosphere, 12(2), 250. https://doi.org/10.3390/atmos12020250