Article

Dust Transport from Inland Australia and Its Impact on Air Quality and Health on the Eastern Coast of Australia during the February 2019 Dust Storm

1
Department of Environmental Sciences, Macquarie University, Macquarie Park, NSW 2113, Australia
2
Department of Planning, Industry and Environment, New South Wales, P.O. Box 29, Lidcombe, NSW 2141, Australia
3
Environmental Quality, Atmospheric Science and Climate Change Research Group, Ton Duc Thang University, Ho Chi Minh City, Vietnam
4
Faculty of Environment and Labor Safety, Ton Duc Thang University, Ho Chi Minh City, Vietnam
5
The Fenner School of Environment & Society, Australian National University, Acton, ACT 2601, Australia
6
Land and Water—Black Mountain, CSIRO, Acton, ACT 2601, Australia
7
University Centre of Rural Health—North Coast, University of Sydney, Lismore, NSW 2480, Australia
8
Rural Clinical School (Northern Rivers), University of Sydney, Lismore, NSW 2480, Australia
*
Author to whom correspondence should be addressed.
Atmosphere 2021, 12(2), 141; https://doi.org/10.3390/atmos12020141
Submission received: 24 November 2020 / Revised: 18 January 2021 / Accepted: 19 January 2021 / Published: 22 January 2021
(This article belongs to the Section Air Quality and Human Health)

Abstract

:
Dust storms originating from Central Australia and western New South Wales frequently cause high particle concentrations at many sites across New South Wales, both inland and along the coast. This study focussed on a dust storm event in February 2019 which affected air quality across the state as detected at many ambient monitoring stations in the Department of Planning, Industry and Environment (DPIE) air quality monitoring network. The WRF-Chem (Weather Research and Forecast Model—Chemistry) model is used to study the formation, dispersion and transport of dust across the state of New South Wales (NSW, Australia). Wildfires also happened in northern NSW at the same time of the dust storm in February 2019, and their emissions are taken into account in the WRF-Chem model by using Fire Inventory from NCAR (FINN) as emission input. The model performance is evaluated and is shown to predict fairly accurate the PM2.5 and PM10 concentration as compared to observation. The predicted PM2.5 concentration over New South Wales during 5 days from 11 to 15 February 2019 is then used to estimate the impact of the February 2019 dust storm event on three health endpoints, namely mortality, respiratory and cardiac disease hospitalisation rates. The results show that even though as the daily average of PM2.5 over some parts of the state, especially in western and north western NSW near the centre of the dust storm and wild fires, are very high (over 900 µg/m3), the population exposure is low due to the sparse population. Generally, the health impact is similar in order of magnitude to that caused by biomass burning events from wildfires or from hazardous reduction burnings (HRBs) near populous centres such as in Sydney in May 2016. One notable difference is the higher respiratory disease hospitalisation for this dust event (161) compared to the fire event (24).

1. Introduction

Dust storms around the world cause elevated particle concentrations downwind from source areas, which are often dry land or desert regions [1]. Occasionally, the affected downwind areas are populated or urban regions [2,3,4]. Dust storms, such as those from the Sahara [5] or Gobi deserts [6], often can carry dust on a global scale, from one continent to another crossing over the oceans. Dust deposited over the ocean also promoted phytoplankton growth due to the presence of aeolian iron in the dust [7,8,9,10,11]. Dust also contains semi-volatile organic compounds [12] organic matter [13], pathogenic or non-pathogenic microorganisms including airborne fungal and bacterial spores [14]. Microbial endotoxins molecules and fungal mycotoxins can trigger respiratory stress [15]. Impact of dust on population health is mostly focused on particles with diameter size of less than 10 µm (PM10 or coarse particles) and 2.5 µm (PM2.5 or fine particles) which can be inhaled and enter the blood stream.
In Australia, as the majority of the population lives in cities and towns along the eastern seaboard, occasional dust storms originated in deserts in central Australia, and also the dry land agricultural and pastoral areas when in drought. Common source areas are in western New South Wales (NSW), western Queensland and the Mallee region of Victoria and South Australia. Dust from these areas often affects populated areas under the right meteorological conditions [16,17]. The effect of dust exposure on population is therefore expected. However, not many studies have been conducted to assess the dust storm impact on health in eastern Australia. Rutherford et al., 1999 [18] found the dust events was associated with increase in asthma severity in Brisbane, Australia. Johnston et al., 2011 [19], in their study of extreme air pollution events from bushfires and dust storms and their association with mortality in Sydney in the period from 1994 to 2007 using PM10 and relevant health data, have found that dust events were associated with 15% increase in non-accidental mortality at a lag of three days, with Odd Ratio (OR) at 95% confidence interval (CI) of 1.16 (95%CI: 1.03–1.30). Finally, Merrifield et al., 2013 [20], in their study of the health effect in Sydney due to a massive “Red Dawn” dust storm originating from central Australia in September 2009, have derived the Relative Risk (RR) in asthma emergency department visits and determined there was a 23% increase or 1.23 (CI:1.10–1.38), emergency department visits of 1.04 (CI: 1.03–1.06) and respiratory emergency department visits of 1.20 (CI: 1.15–1.26). However, there was no significant increase in cardiovascular emergency department visits.
In other parts of the world where desert dust caused significant impact, such as in the Caribbean due to dust storms originated in North Africa, some of the highest incidences of asthma in the world were found [21]. Khaniabadi et al., 2017 [22] in their study of the impact of Middle East dust storms on health have found that exposure to PM10 (particulate matter of size less than 10 µm) during the dust storm events led to an increase of hospital admissions for COPD (chronic obstructive pulmonary disease) and respiratory mortality. Thalib et al., 2012 [23], in their study of dust storms and the risk of asthma admissions to hospitals in Kuwait have found that the dust storms were significantly associated with an increased risk of same-day asthma and respiratory admission, with adjusted relative risk of 1.07 (95% CI: 1.02–1.12) and 1.06 (95% CI: 1.04–1.08), respectively, based on an increase of 10 μg/m3 of PM10. Kim et al., 2012 [24] studied the effect of Asian dust (AD) from deserts in north and central Asia on health in Korea and found that all-cause and cardiovascular mortalities were significantly associated with PM2.5 during smog–AD and AD days only and that changes in the chemical composition of PM2.5, occurring during long-range transport, represent important factors in differential effects on health. Zhang et al., 2013 [25] in their study of desert dust effect on health in Wuwei (Gansu Province, north west of China), have reported associations between PM2.5 due to dust from Badain Jaran Desert and Tengger Deser, and the increasing of respiratory and cardiovascular diseases outpatient visits for males and females.
Even though it was not as large or as significant as the “Red Dawn” dust storm in September 2009 [3,17], the dust storm from 11 to 15 February 2019 was a significant event. It originated from the deserts of central Australia and dry lands of western NSW which were under drought conditions and caused significant degradation of air quality in most of NSW, including the coastal cities, before the dust was then transported across the Tasman Sea to New Zealand and Antarctica [26]. A thick layer of dust (up to 2 km above ground level) above central Australia was detected by CALIOP lidar onboard CALIPSO satellite on 11 February 2019 from 4:27 to 4:40 UTC. The dust (yellow) and polluted dust (brown) are shown in Figure 1a. From the lidar profile data, it can be seen that the extent of the dust cloud ranged from western NSW near the border with Victoria to western Queensland (Figure 1b) and was approximately 1500 km long (Figure 1a). In northern NSW, there were wildfires (Figure 1c) when the dust plume passed through the region on 13 February 2019. Figure 1d shows maximum AOD over Australia on 13 February 2019 as measured by MODIS Terra satellite provided by the Deep Blue MOD08-D3 product. This dust event has been studied using meteorological and air quality model WRF-Chem to simulate the transport and dispersion of the dust in eastern Australia and New Zealand [26]. The current study extends the previous work by focussing on the impact of this dust storm event on air quality (PM2.5) and on exposed population in NSW.
To study the impact of the dust storm on air quality, population exposure and health due to high particle concentration during dust storms, a modelling approach of source emission and dispersion modelling is usually adopted to account for the emission and transport of dust particles. There are various dust emission schemes to be used in the Chemical Transport Module (CTM) mechanism component of the air quality model, such as WRF-Chem. Once the model is validated, the predicted concentration of particulates during a dust storm or bush fires can be predicted over a modelling domain using the dispersion CTM model. The population exposure or health impact of a dust storm causing elevated concentration can then be estimated. Many dust storms or wildfire events and their impact on air quality were studied using air quality models, such as [27] in their study of the impact of the wildfires during October 2013 on regional air quality in eastern Australia using CHIMERE. Ma et al., 2019 [28] has used and compared the performance of four air quality models, CMAQ, CAMx, CHIMERE and WRF-Chem, in dust storm simulation in East Asia. Chen et al., 2014 [29] used WRF-Chem to study the dust over East Asia from 2007 to 2011 based on the GOCART dust scheme, RADM2 chemical mechanism and MADE/SORGAM (Modal Aerosol Dynamics Model for Europe (MADE) and Secondary Organic Aerosol Model (SORGAM) aerosol model. They found that WRF-Chem reasonably reproduces not only the AOD column variability as measured from satellites but also the vertical profile of mineral dust over and near the dust source regions from AERONET sites. Subsequently, Chen et al., 2018 [30] has used WRF-Chem to study dust emission and transport over East Asia and the life cycle and radiation feedbacks of dust particles over East Asia in summer 2010.
Besides the changing radiation budget, dust particles also have a large impact on human health. Particles such as PM2.5 and PM10 from emission sources have an impact on health endpoints such as mortality, respiratory or cardiovascular disease hospitalisation. Segersson et al., 2017 [31] has used a modelling approach to study the health impact of PM10, PM2.5 and Black Carbon (BC) exposure due to different emission source sectors in the three cities of Stockholm, Gothenburg and Umea in Sweden. For PM2.5, they used different relative risk values (per 10 μg/m3) dependent on whether the PM2.5 came from local, long-range or non-combustion sources. They found that BC has a higher relative risk compared to that of PM2.5.
In this study, we use the modelling approach with WRF-Chem air quality model as the modelling tool to assess the impact of the dust storm in February 2019 on air quality and on health due to population exposure to dust in NSW, Australia. Air quality monitoring data measured on ground and satellite data are used to validate or corroborate the model prediction.

2. Data and Methods

Data used in this study consists of MODIS Aqua/Terra satellite data such as AOD (Aerosol Optical Depth), CALIOP lidar vertical structure of aerosols and air quality monitoring data from the Department of Planning, Industry and Environment (DPIE) air quality monitoring stations in NSW. Figure 2a shows the location of some of DPIE air quality monitoring stations in NSW.
Aerosol optical properties such as optical thickness or AOD measured by NASA MODIS Aqua/Terra satellites are very useful in understanding and validating the simulation of dispersion and transport of aerosols from emission sources such as desert or bare dry lands. NASA Level-1 and Atmosphere Archive & Distribution System (LAADS) (https://ladsweb.modaps.eosdis.nasa.gov) provides the MODIS 3km aerosol products MYD04-3k (Aqua) and MOD04-3k (Terra) which give AOD over ocean (Dark Target) and land (Deep Blue algorithm). The MYD04-3k and MOD04-3k monitor the ambient aerosol optical properties (e.g., optical thickness and size distribution), mass concentration, look-up-table-derived reflected and transmitted fluxes over the oceans globally and over a portion of the continents. In addition, at a higher level, the level-3 MODIS MOD08_D3 product provides gridded atmosphere daily global joint data of 1° × 1° grid average values combining both a Dark Target (DT) algorithm over ocean and part of the continents and Deep Blue (DB) algorithm over bright surface such as desert. These AOD data will be used to understand and verify the simulated dispersion of dust aerosols in our study.
The sources of dust during a dust storm in eastern Australia are mainly from the six desert regions in central Australia (between the states of Queensland, NSW, South Australia) as shown in Figure 3a. In February 2019, most of western NSW and northern Victoria was in drought as shown by the vegetation map in February 2019 (Figure 3b).

2.1. Dust Emission Model

WRF-Chem currently has a number of different dust emission schemes: the GOCART (Georgia Tech/Goddard Global Ozone Chemistry Aerosol Radiation and Transport) aerosol scheme, the GOCART with AFWA (Air Force Weather Agency) modification to include saltation flux and the University of Cologne (UoC) based on three different dust emission algorithms. The GOCART with AFWA dust emission scheme is used in this study as in the previous study by [26] on the long-range transport of dust from Central Australia to New Zealand and Antarctica during the February 2019 dust storm.
In the GOCART model, the dust emission flux Fp for different particle size is described as a function of wind speed and soil moisture and is expressed as (Ginoux et al., 2001) [33].
This Ginoux flux equation indicates that when the wind velocity at 10 m high (U) is less than the threshold wind velocity (Ut), there is no dust flux from the surface and when U is greater than Ut then the flux is proportional to the cube of wind velocity.
F p = C S s p   U 2 U U t D p ,     θ s                         U >   U t D p ,     θ s 0                                                           U   U t D p ,     θ s
Equation (1) is an empirical equation with C as a proportionality constant (10−6 g s2m−5), S as a unitless erodibility value indicating the availability of particles to be entrained, sp as the mass fraction of emitting dust from soil class (sand, silt and clay) of size p, Ut(Dp, θs) as the threshold wind velocity over which erosion occurs, Dp the particle diameter of size p and θs degree of saturation measuring soil moisture. S is a function of topography and is calculated as
S =   z m a x   z i z m a x z m i n
where zi is the cell i elevation and zmax, zmin are the maximum and minimum elevation in the surrounding 100 × 100 area, respectively. This dust source function (DSF) is often called the Ginoux source function (GSF).
The Ginoux flux equation (Equation (1)) was further improved based on the work of [34,35] in which the threshold wind velocity was replaced by the threshold friction velocity [36]. The Marticorena-Bergametti equation was implemented in WRF-Chem using threshold friction velocity u*t
u t = 0.129   ρ p g D p ρ a 0.5 1 + 0.006 ρ p g D p 2.5 0.5 1.928 a D p x + b 0.092   1 0.5
where g is gravitational acceleration, ρp density of size p particle, ρa air density, x = 1.56, a = 1331 cmx and b = 0.38.
In the GOCART-AFWA scheme, a correction factor to account for the effect of soil moisture on threshold friction velocity is applied for saltation process
u t , s , p =   u t D s , p f θ
where
f θ =   1 + 1.21 θ g θ g 0.68 1                             θ g <   θ g                     θ g > θ g
Ds,p is the diameter of saltation size bin p while θg is the gravimetric soil moisture fraction and θg’ is the soil moisture fraction (or threshold moisture) to be absorbed into the soil before capillary forces start influencing the particle disaggregation.
Based on the threshold friction velocity, the horizontal saltation flux for particle size of bin p is then calculated as
H D s , p =   C m b ρ g g u 3 1 + u t , s , p u 1 u t , s , p 2 u               u > u t , s , p 0             u u t , s , p  
The constant Cmb is implemented in GOCART AFWA WRF-Chem as 1 rather than 2.6 of the original equation in [34].
Finally, from the horizontal saltation flux, the bulk dust emission vertical flux is then calculated for regions defined as grassland, sparsely vegetated or barren [36], i.e., surface roughness length z0 ≤ 20 cm as
F B = G S β             z 0   20   c m 0                 z 0   20   c m    
where G is the total streamwise horizontal saltation flux, S is the erodibility value and the sandblasting efficiency β is between 1 × 10⁻⁶ and 1.36 × 10⁻⁶ cm−1 (varying with clay mass fraction from 0 to 1).

2.2. WRF-Chem Configuration

The WRF-Chem domain (Figure 2b) of the study consists of the eastern half of Australia, the Tasman sea and New Zealand with 15 km × 15 km resolution (lat from −45.5384° to −17.914°, and longitude from 116.025° to 184.175°) and 32 vertical levels with pressure at the top level as 5000 hPa. The National Center for Environmental Prediction (NCEP) Final Analysis (FNL) Reanalysis data provides the boundary and initial meteorological condition and the default chemical profiles in WRF-Chem for the simulation.
The WRF-Chem sand erodibility map corresponds to five of the dust source regions (Figure 3) as grouped by [32] based on previous studies of dust sources using MODIS satellite images. The following WRF_Chem physics options were used: WRF Single-Moment (WSM) 3-class microphysics scheme suitable for mesoscale grid sizes (mp_physics = 3), Monin-Obukhov similarity scheme for surface layer physics (sf_sfclay_physics = 1), Noah Land-Surface Model, for land surface model (sf_surface_physics = 2), aerosol direct radiative effect based on Rapid Radiative Transfer Model (RRTMG) for both short-wave and long wave radiation (ra_sw_physics = 4, ra_lw_physics = 4), Kain-Fritsch scheme for cloud cumulus (cu_physics = 1) and YSU scheme for plane boundary physics (bl_pbl_physics = 1). WRF-Chem simulation of this dust storm event used dust scheme GOCART-AFWA with saltation flux and moisture correction for threshold friction velocity (dust_opt = 3) and has dust particles distributed into five bins: bin 1 (particles of size 0–1 µm), bin 2 (1.0–1.8 µm), bin 3 (1.8–3.0 µm), bin 4 (3.0–6.0 µm) and bin 5 (6.0–10 µm). Their effective radiuses are 0.5, 1.4, 2.4, 4.5 and 8 μm respectively.
The WRF-Chem chemistry option is MOZART/GOCART (chemp_opt = 112). This coupled option was also employed by [37,38] to study hazardous air quality from fires. Crippa et al., 2016 [37] noted that coupling the aerosol scheme with the gaseous phase chemistry would be computationally less expensive.

2.3. Emission Data

The anthropogenic emission data used in this study is based on the global 2005 anthropogenic EDGAR (Emission Database for Global Atmospheric Research) version 4 compiled for Task Force on Hemispheric Transport of Air Pollution (TF-HTAP). This data set has land-based and shipping transport emission sources at 0.1° × 0.1° resolution at monthly interval. Rea et al., 2016 [27] and Crippa et al., 2016 [37] also used the EDGAR-HTAP 0.1° × 0.1° emissions data for their air quality model to simulate the October 2009 wildfires in NSW and the effect of 2005 wildfires in Equatorial Asia (Indonesia) on mortality, respectively. Rea et al., 2016 [27] uses the annual emissions of CH4, NMVOC, CO, SO2, NOx, NH3, PM10, PM2.5, BC and OC for air, ships, energy industry, transport, residential and agriculture in their CTM model to predict concentration over the South East Australia and Greater Sydney region modelling domains.
As there were large wildfires in the New England region of northern NSW from 10 February 2019 to 15 February 2019, the emission of aerosols and gaseous chemical species is taken into consideration by using the Fire Inventory from NCAR (FINN) emission data derived from MODIS Rapid Response fire count (FIRMS) hotspots.

2.4. Impact of Dust on Health

There are various epidemiological studies on the association of PM2.5 on these health endpoints for short-term exposure (several days) based on daily average in many parts of the world. The results of these studies are usually summarised as relative risk factors for a specified increase concentration level of PM2.5. Hvidtfeldt et al., 2019 [39], in their health impact study of long-term residential exposure to PM2.5, PM10, black carbon (BC), NO2 and ozone in a Danish cohort, have found that there is a hazard ratio (HR) or relative risk of 1.29 (95% CI: 1.13–1.47) associated with cardio-vascular disease (CVD) mortality per 5 μg/m3 increase of PM2.5 concentration. For BC, the HR of 1.16 (95% CI: 1.05–1.27) in CVD mortality per 1 μg/m3 increase of BC concentration was reported. In a more comprehensive meta study on the short-term effect of ambient particulate air pollution and daily mortality in 652 cities of 24 countries or regions around the world, including three cities in Australia (Brisbane, Sydney and Melbourne), Liu et al., 2019 [40] found that on average, an increase of 10 μg/m3 in the 2-day moving average of PM10 concentration (average over the current and previous day) was associated with increases of 0.44% (95% confidence interval [CI], 0.39 to 0.50) in daily all-cause mortality, 0.36% (CI, 0.30 to 0.43) in daily cardiovascular mortality and 0.47% (CI, 0.35 to 0.58) in daily respiratory mortality. For the same increase in PM2.5 concentration (10 μg/m3), the figures were 0.68% (CI, 0.59 to 0.77), 0.55% (CI, 0.45 to 0.66) and 0.74% (CI, 0.53 to 0.95) increase in total daily mortality, daily cardiovascular and daily respiratory mortalities, respectively. For Australia, the pooled estimate (for 3 cities) with 95% CI on the percentage change in all-cause mortality per 10 μg/m3 increase in concentration of daily 2-day moving average is 1.32 (0.22 to 2.44) for PM10 and 1.42 (−0.12 to 2.99) for PM2.5.
In this study, the relative risk (RR) factors for 10 μg/m3 increase of PM2.5 on mortality (all cases) and cardiovascular (cvd) diseases are based on World Health Organization’s (WHO) Health Risks of Air Pollution in Europe project (HRAPIE) recommendations for concentration response functions for cost benefit analysis on the health effects of particulate matter, ozone and nitrogen dioxide (WHO 2013) [41]. We use these recommended short-term concentration response coefficients for mortality and cvd diseases in this study.
RR (mortality) = 1.0123 (CI: 1.0045, 1.0201)
RR (cvd) = 1.0091 (CI: 1.0017, 1.0201)
where CI is the confidence interval.
For respiratory hospitalisation, the RR 1.03 (CI: 1.01, 1.04) of PM2.5 based on a study of the 2003 California wildfires [42] was used by [43,44] for wildfires or hazardous reduction burnings (HRBs) health impact. As the composition of dust particles is different from those of wildfires, in this study, we use the relative risk factor for respiratory hospitalisation based on a study of health effect on exposed population in Sydney due to the “Red Dawn” dust storm in September 2009 [20].
RR (resp.) = 1.20 (CI: 1.15–1.26)
This RR value is about the same as RR value from another study on the health effect of PM2.5 from desert dust in Wuwei (Gansu, China) [25] which reported the RR for total respiratory diseases hospitalisation as 1.217 (1.08, 1.606) for male and 1.156 (0.991, 1.347) for female.
The impact factor (IF) is the relative risk associated with a specific change in air pollution concentration ΔX. In this case, ΔX is the PM2.5 increase due to dust event and IF is calculated as:
IF = RRΔX/10
The attributable number of the impact on health endpoint due to an increase of ΔX concentration in a population with a specific incidence rate for this endpoint is
AN = (IF − 1) × Pop × incidence rate
The incidence rate data for mortality are sourced from the Australian Bureau of Statistics (ABS) which provides detailed mortality data nationally for each SA4 (Statistical Area Level 4) area in Australia. The SA4s are geographical areas built from whole Statistical Areas Level 3 (SA3s) which in turn are built from SA2 and so on with SA1 as the smallest statistical unit area. The SA4 regions are the largest sub-State regions. They have been designed by ABS for the output of a variety of regional data, including data from the 2016 Census of Population and Housing.
As ABS does not provide hospitalisation data for each SA4 nationally, consequently the cardiovascular and respiratory diseases hospitalisation rates are obtained from the state government of NSW. The NSW Department of Health (DOH) provides publicly the statistical data for each Local Health District (LHD) or Local Government Area (LGA) each year. These rates are then applied to the SA4 areas enclosed within the LHD or LGA as indicated. Each SA4 can intersect with several different LHDs, the incident rate in the SA4 is then the average of the incident rates of the intersected LHDs. The shapefiles of SA4 and LHD are used in R software to determine the intersection and incident rate calculation.
In this work, we derived the incidence rate for cardiovascular diseases hospitalisation based on LGA statistical data and respiratory diseases hospitalisation based on LHD statistical data for the year 2018 from the NSW Department of Health.

3. Results

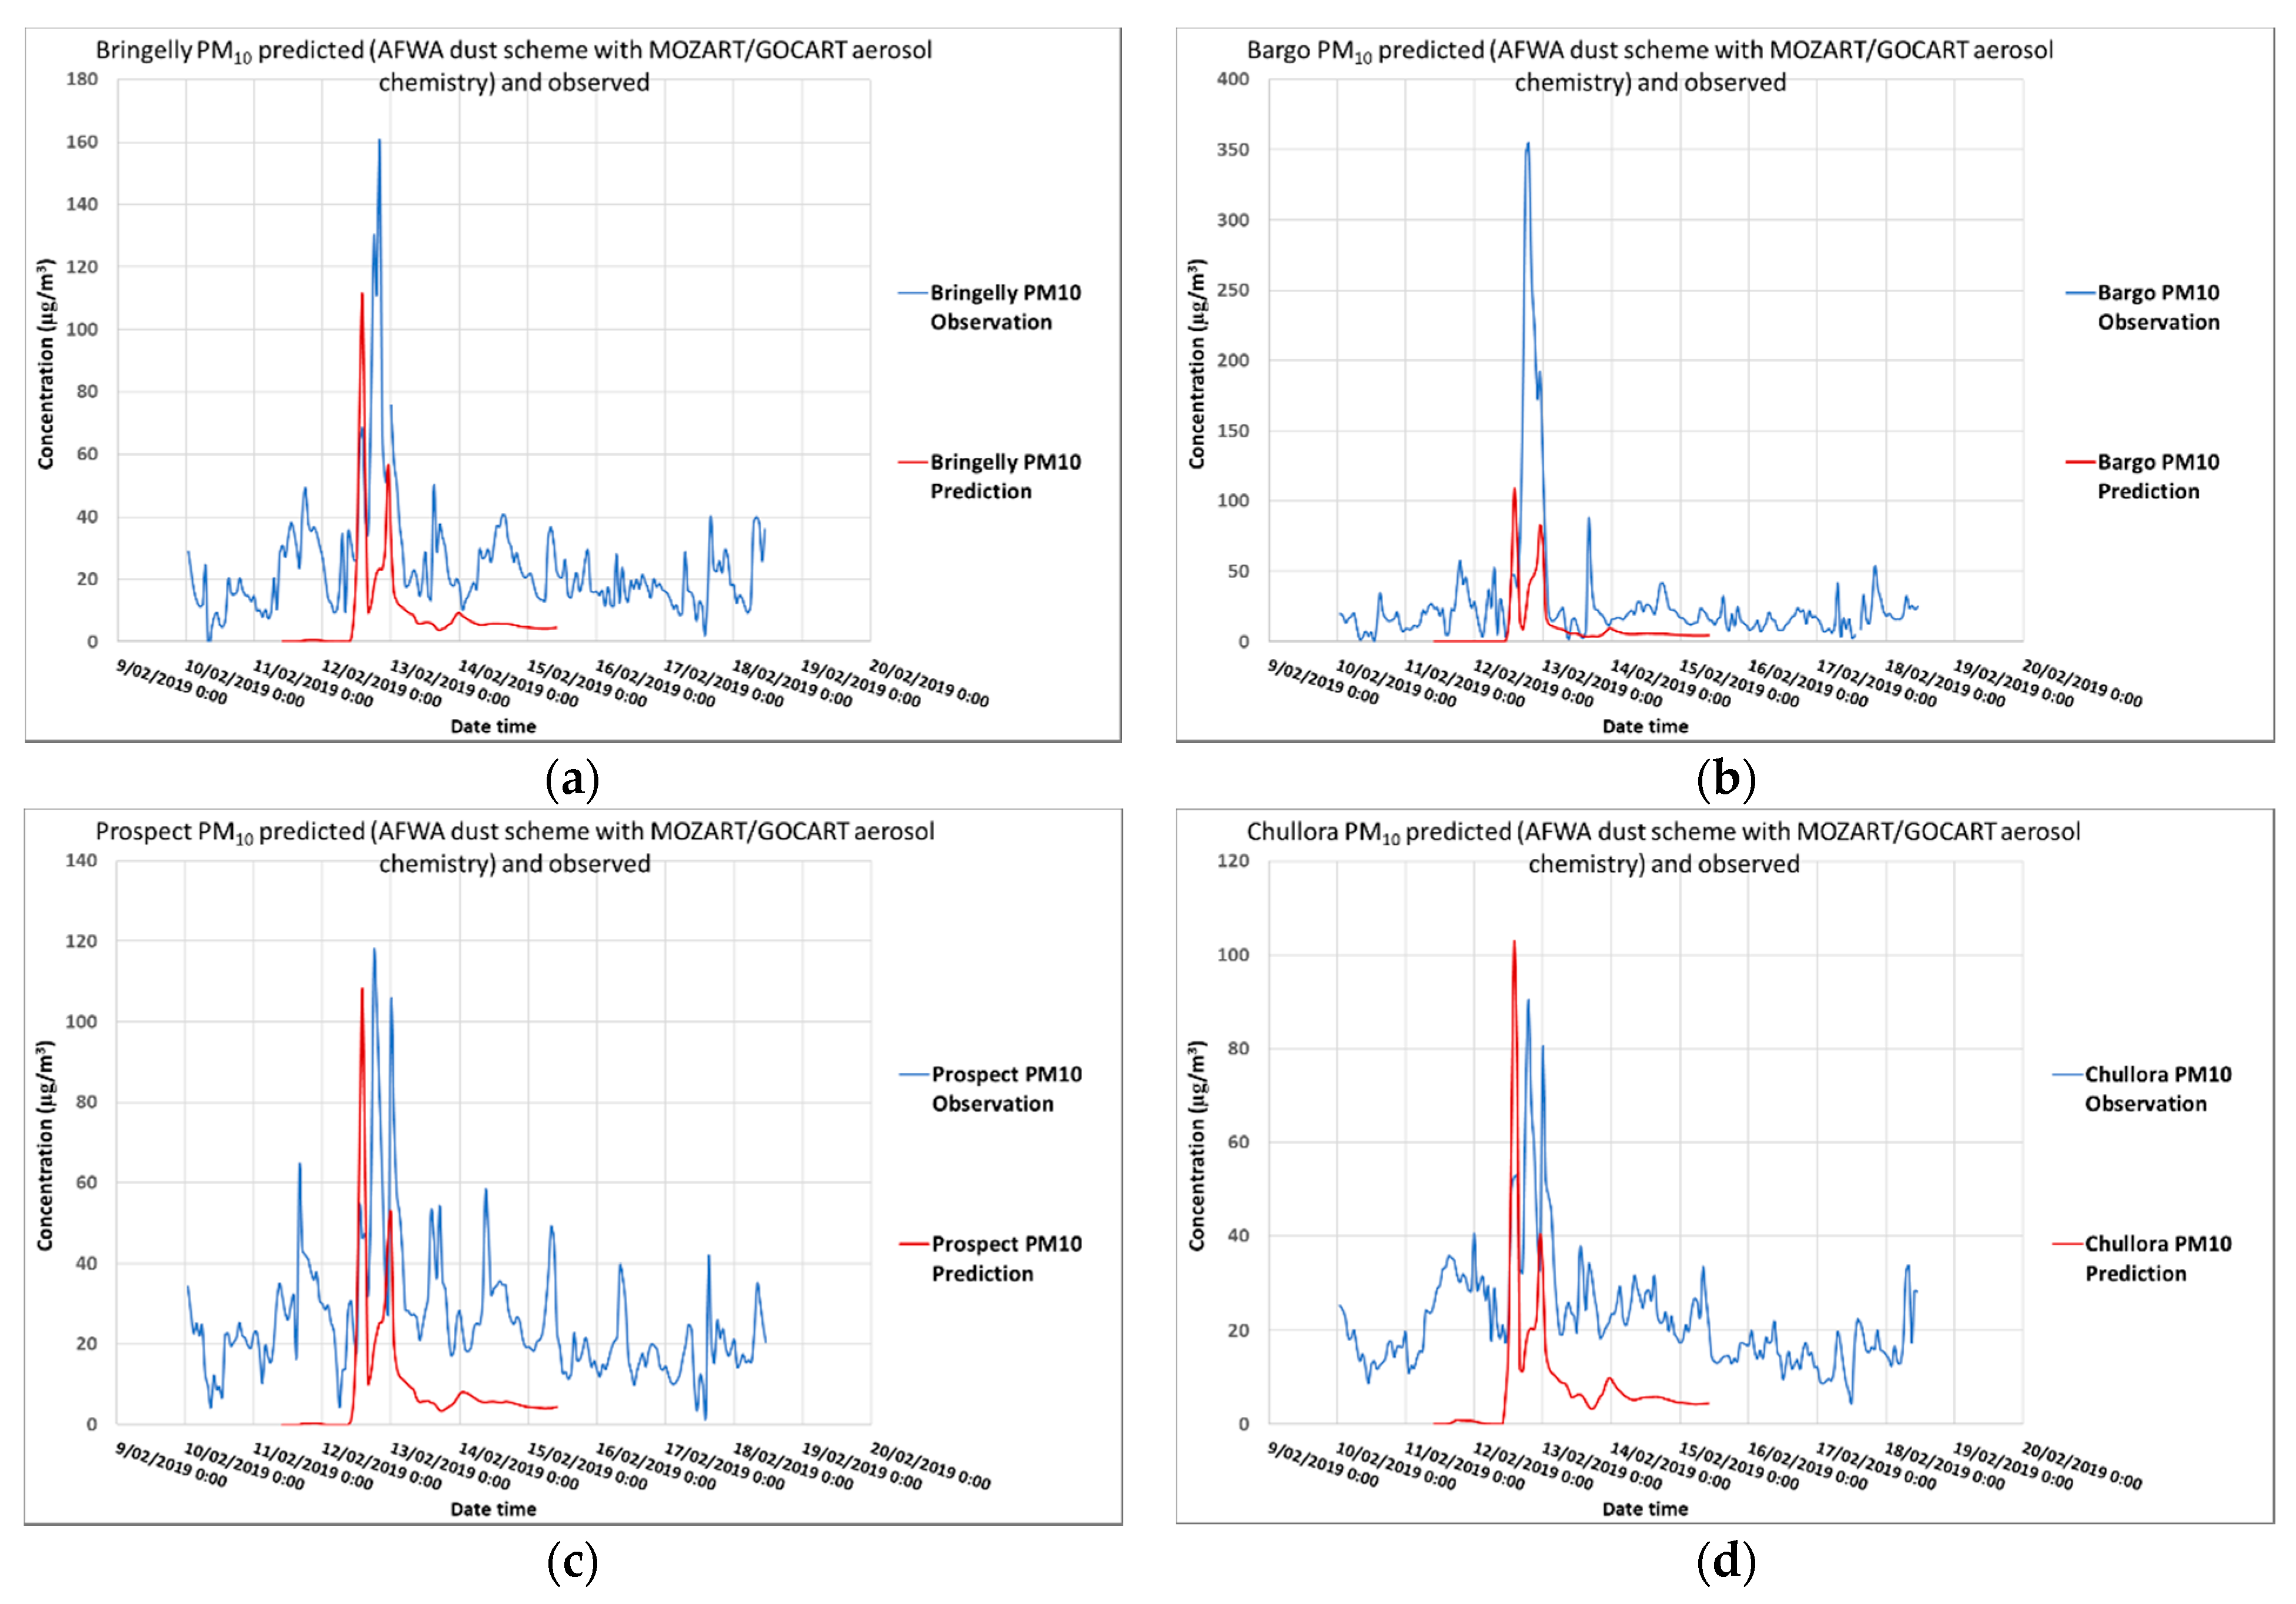
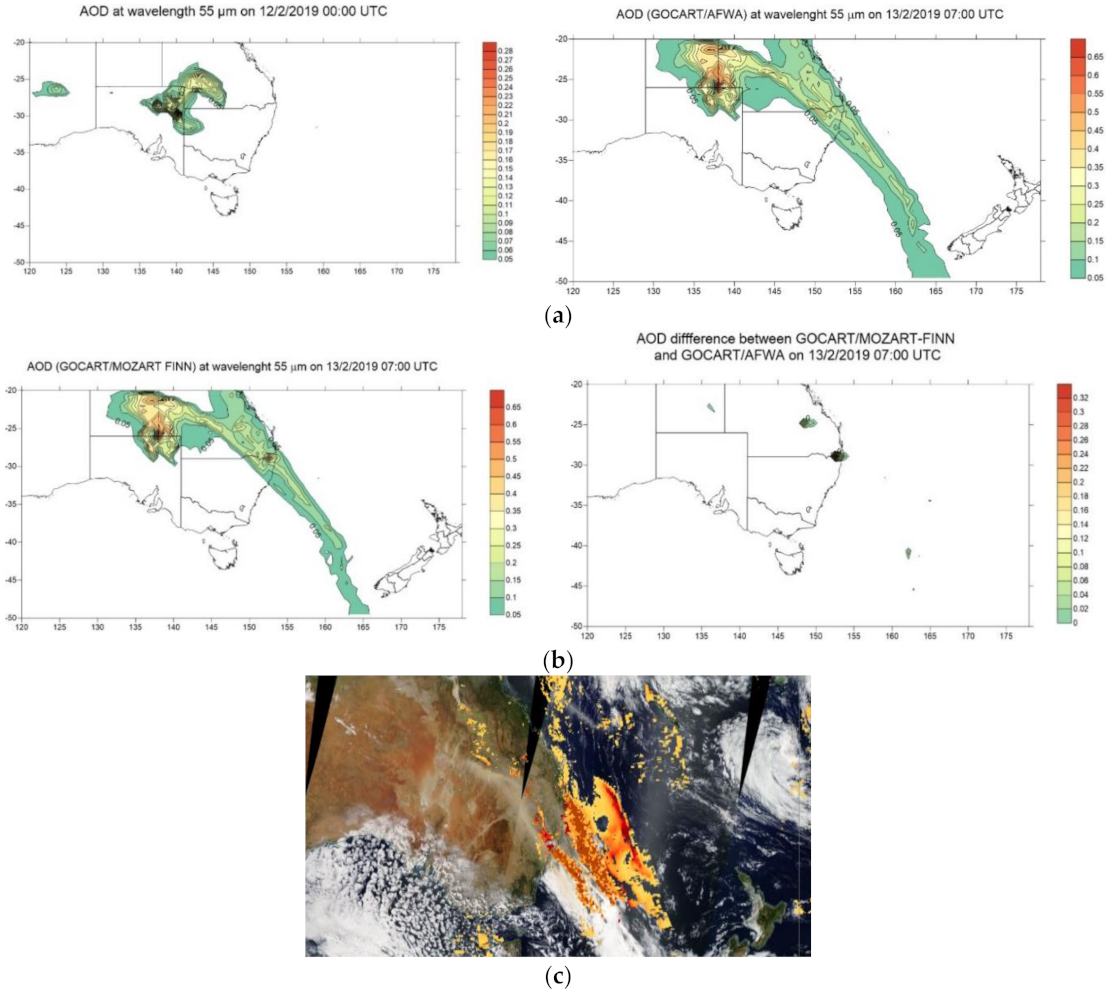
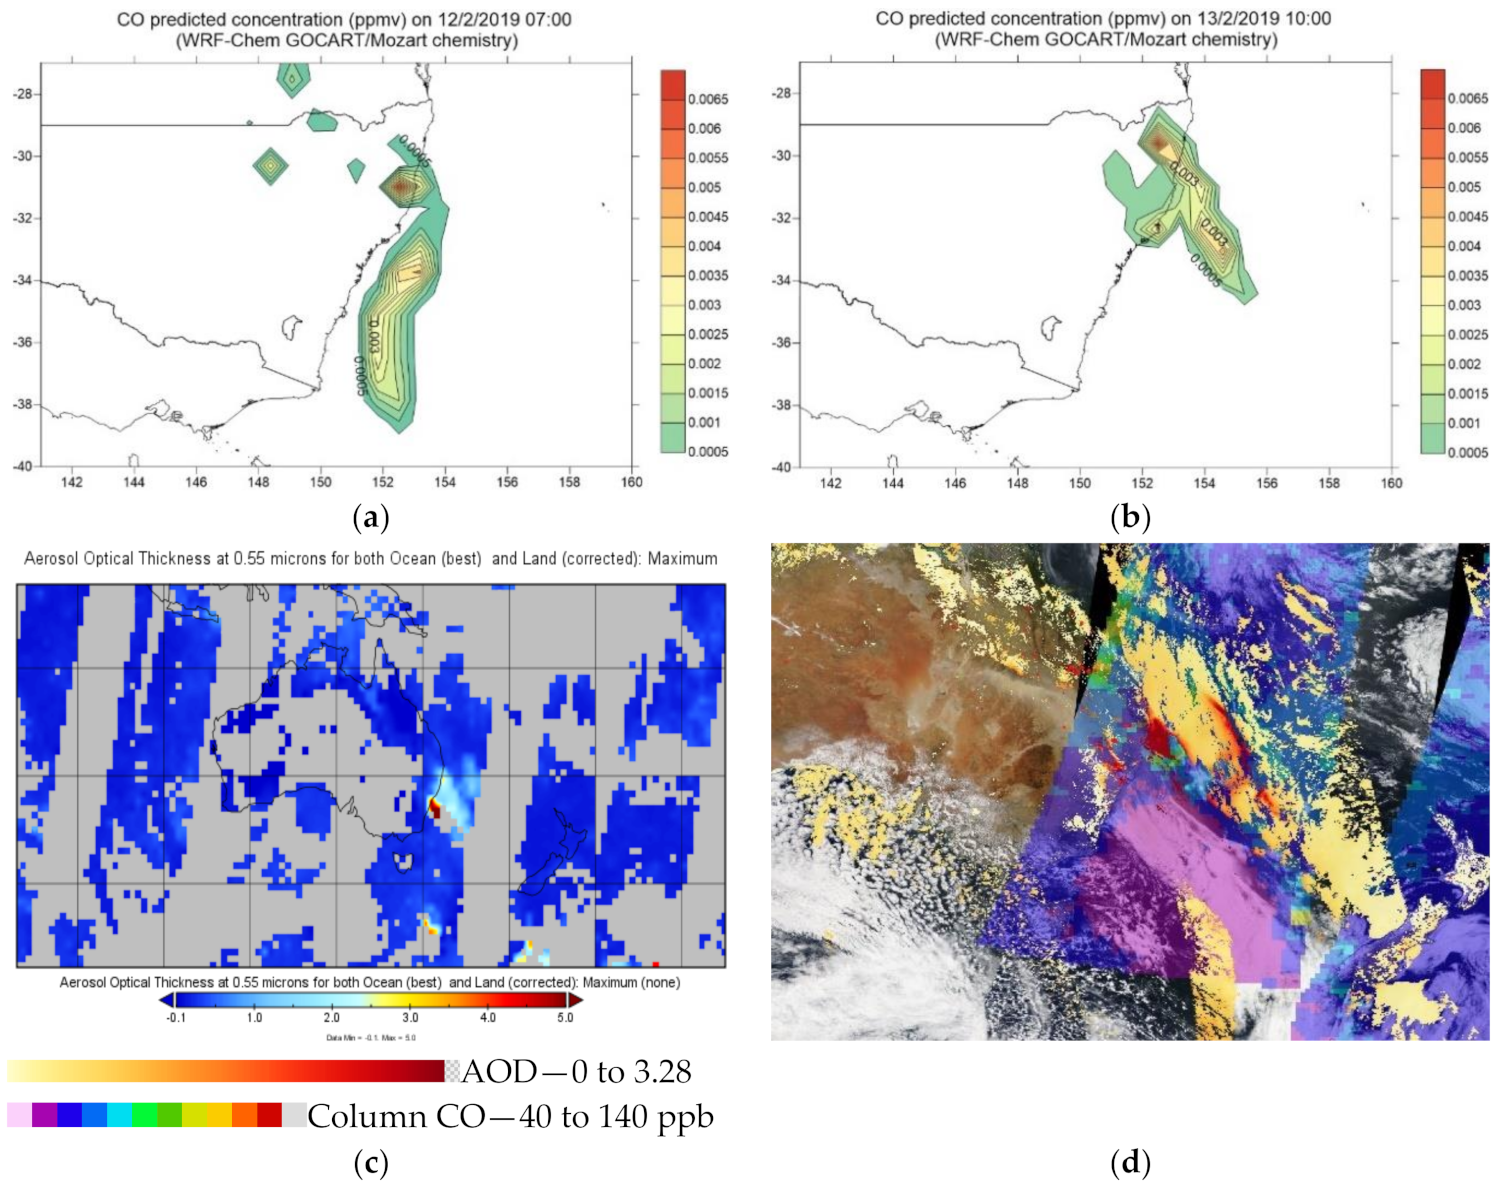
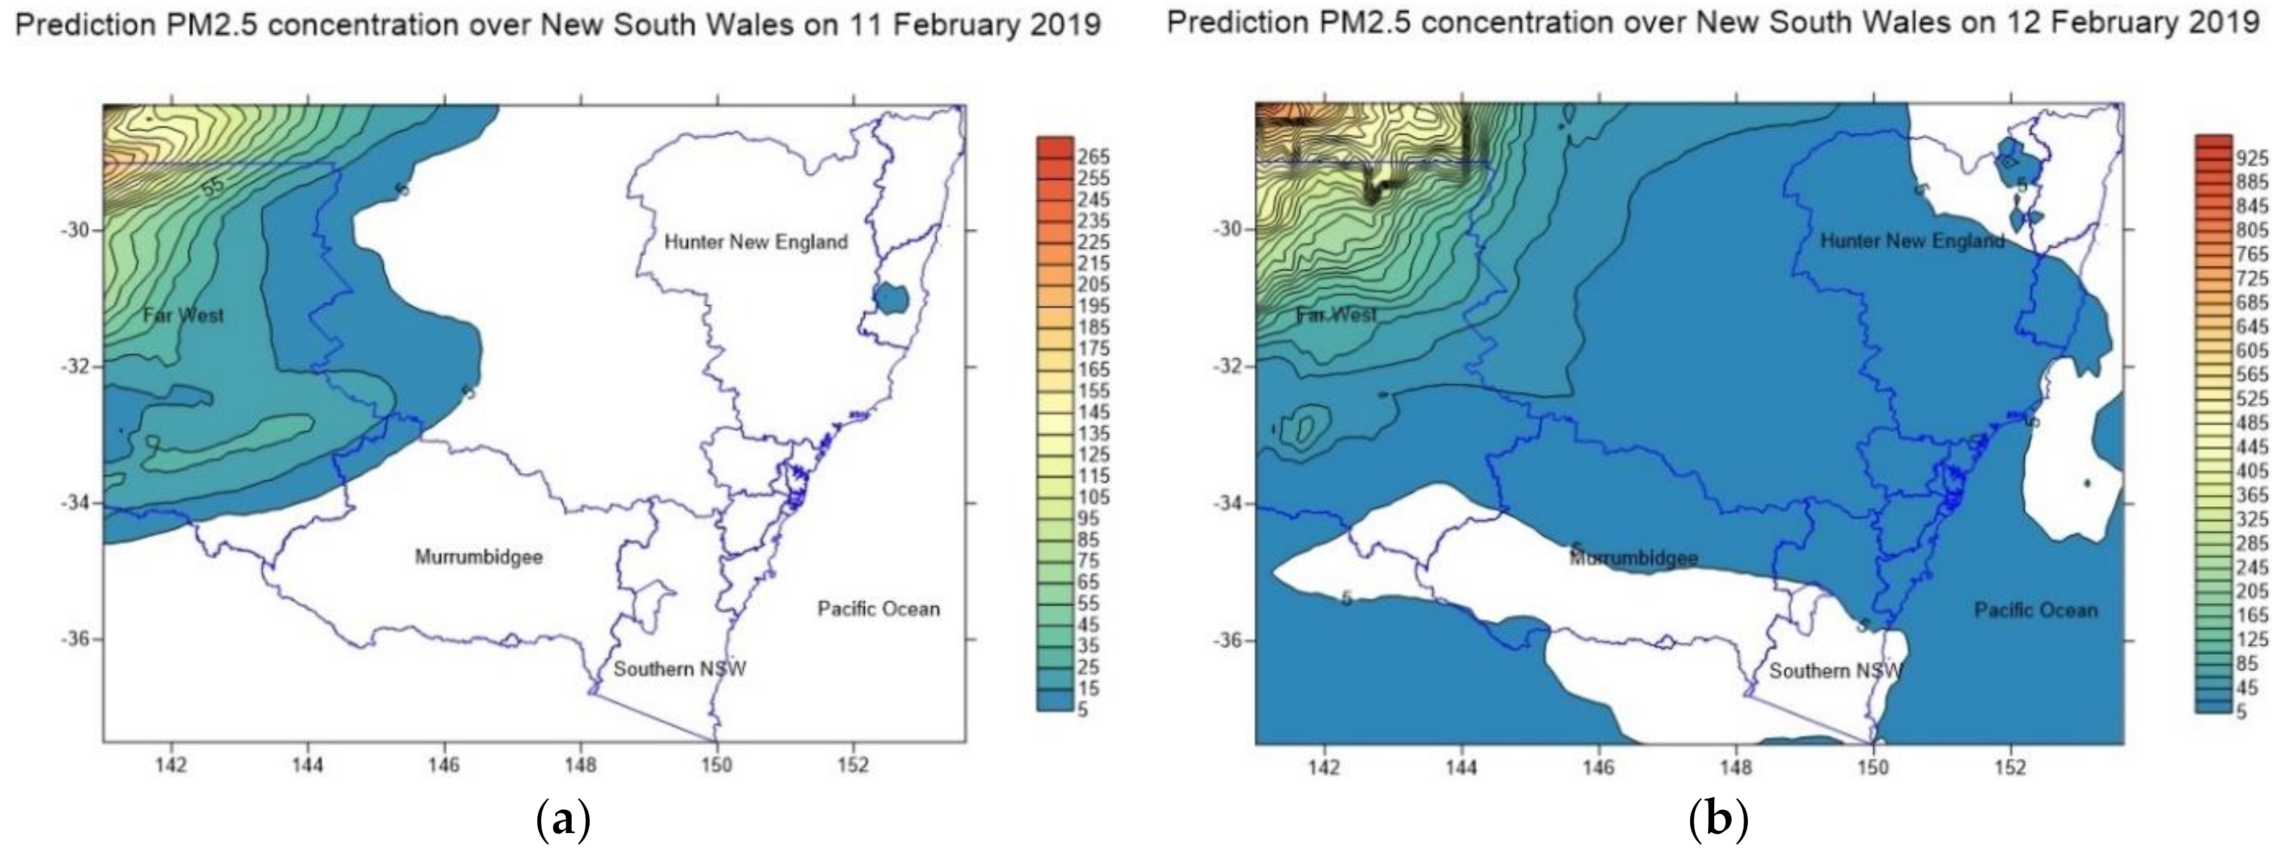
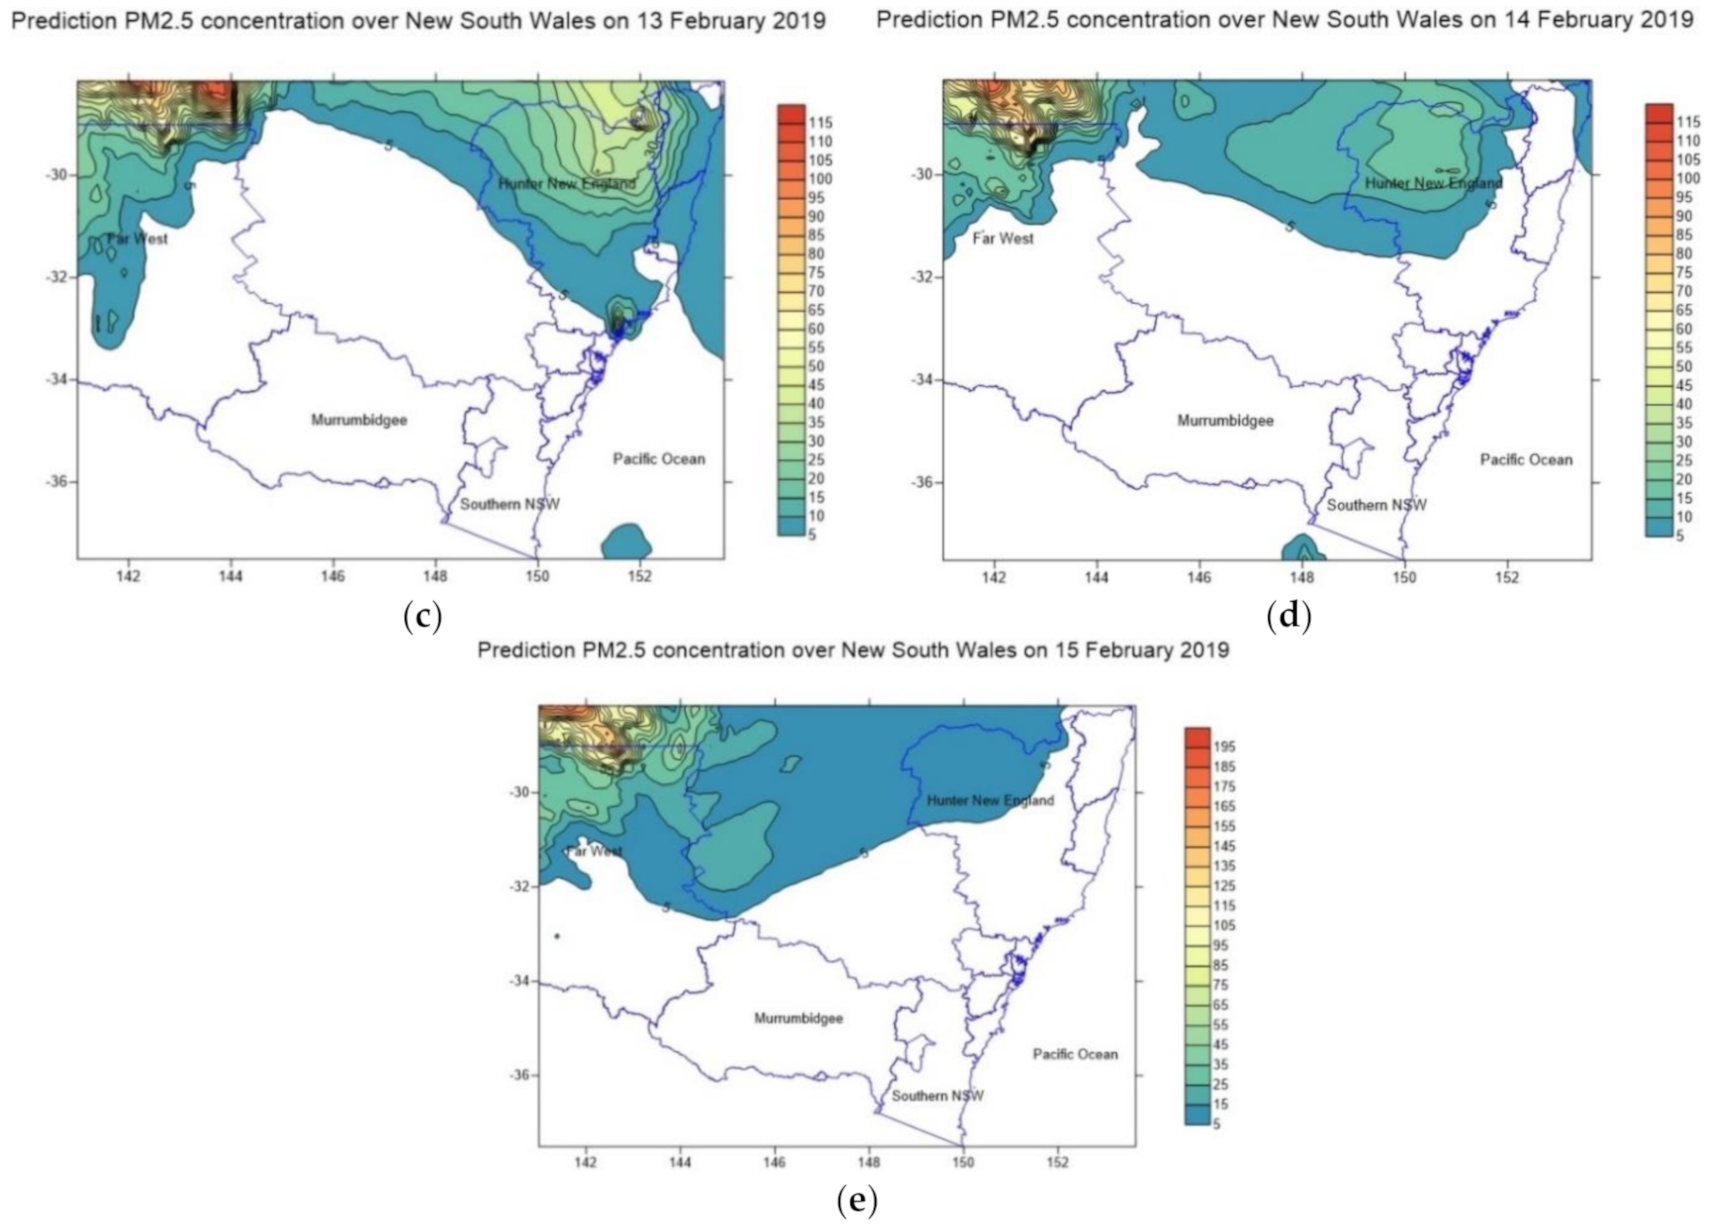
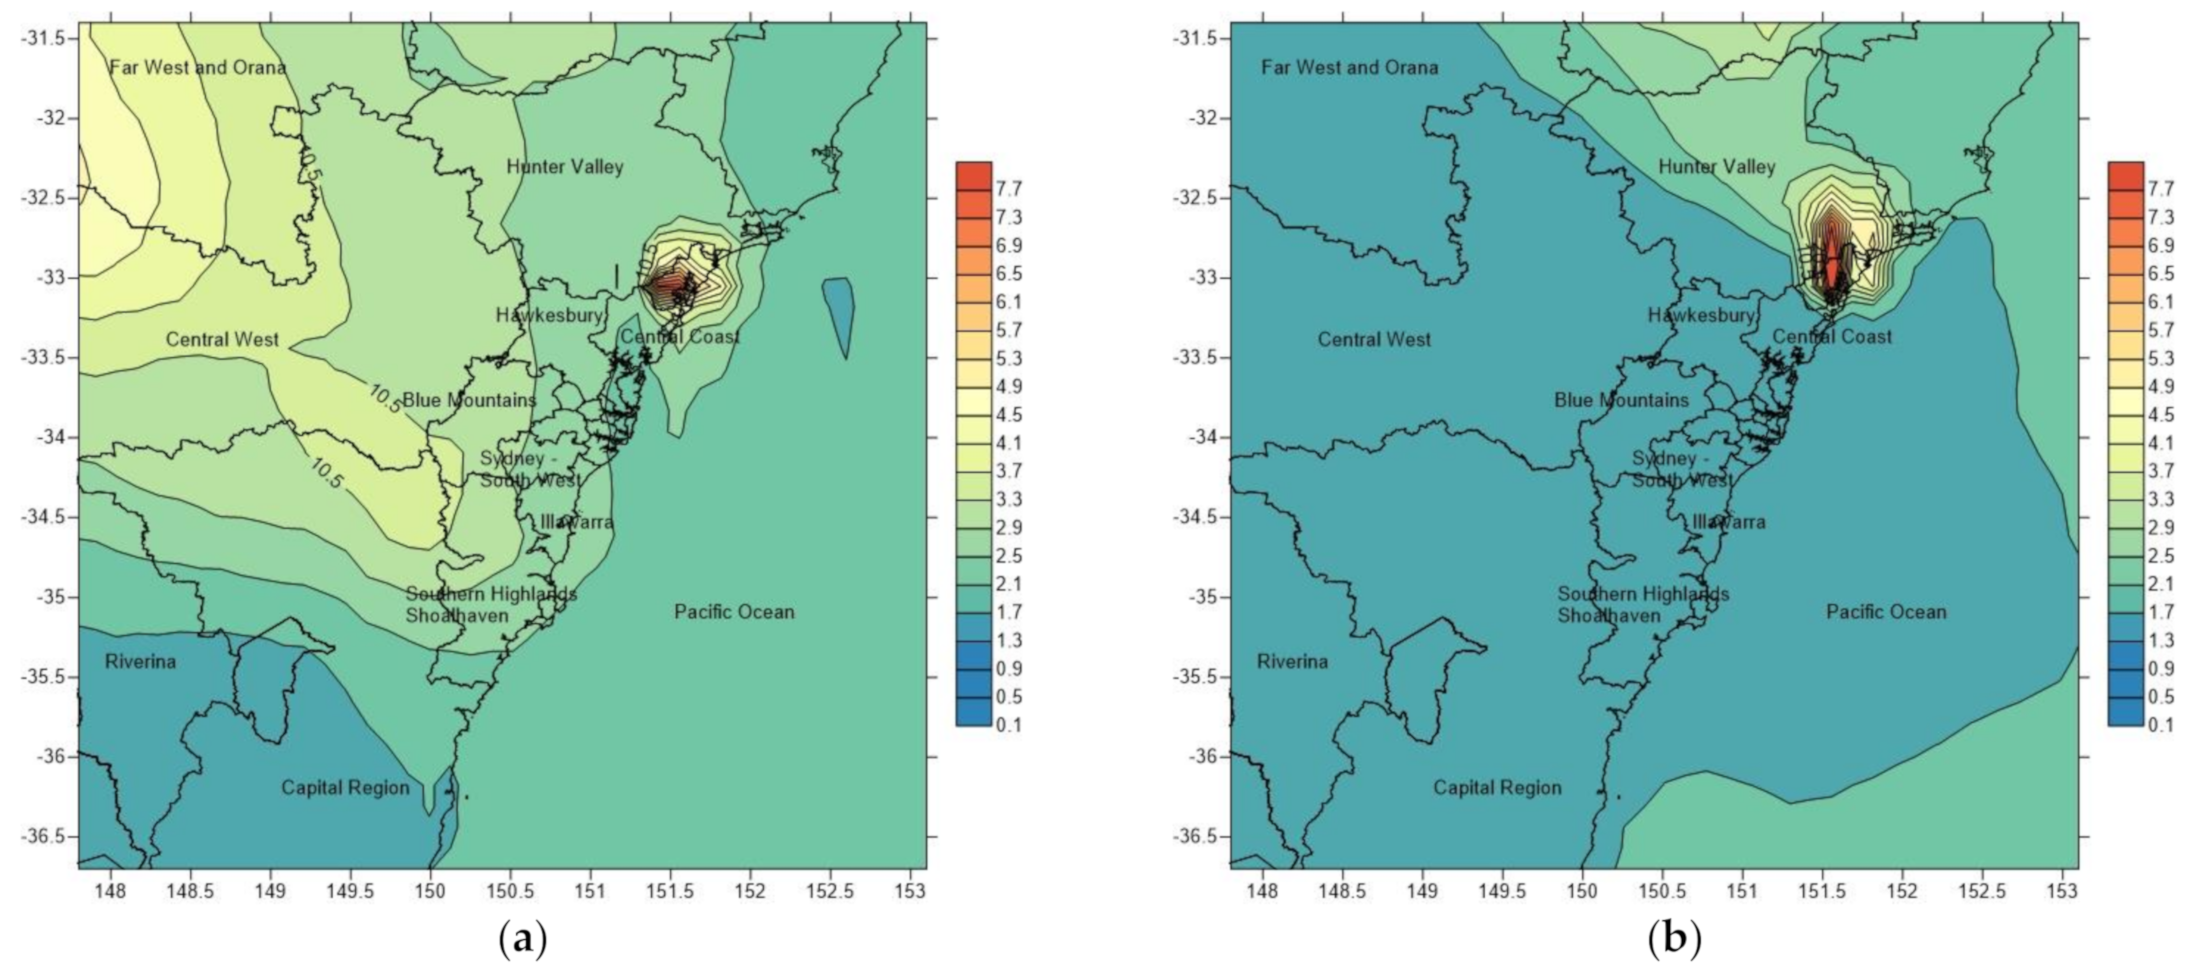
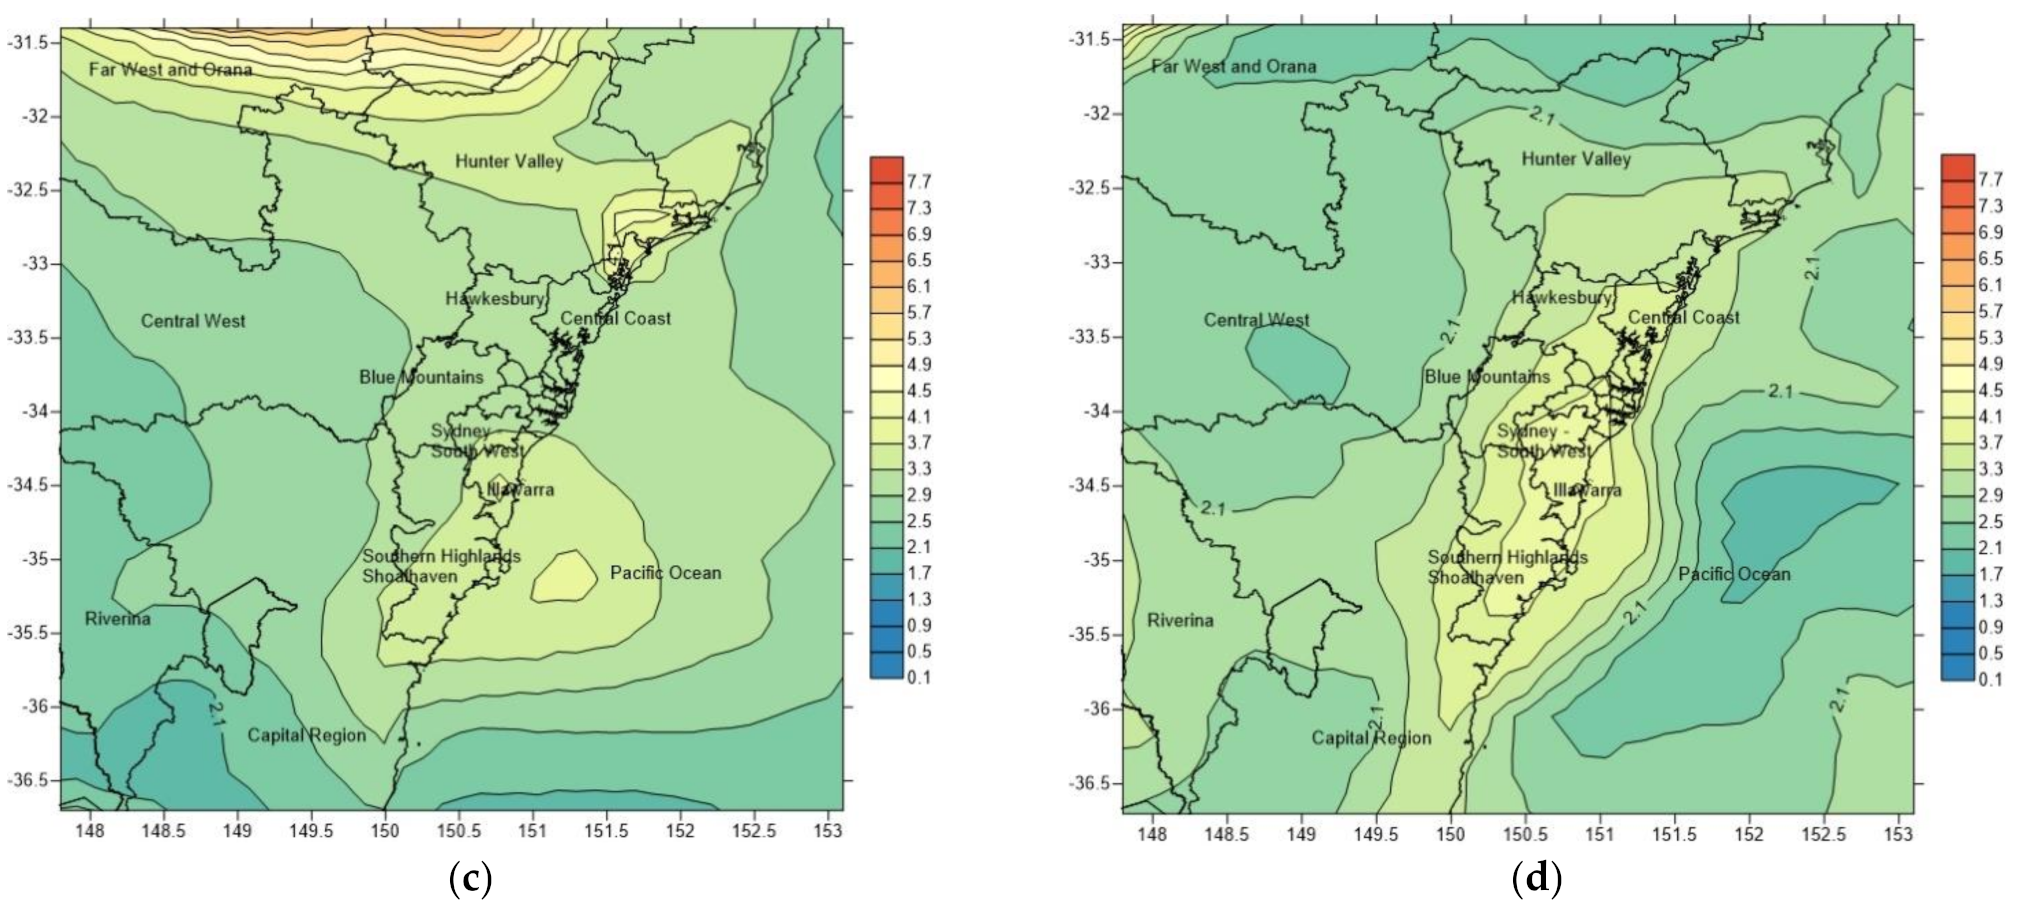
3.1. Impact on Air Quality: WRF-Chem Prediction of PM2.5 and PM10

During the dust storm period from 11 to 15 February 2019, the wind direction was mostly from westerly on 11 and 12 February 2019 then changed to south-westerly and southerly in the following days. Comparison of predicted and observed meteorological data at a number of sites in western NSW was made to confirm the meteorological prediction. Figure S1 in the Supplementary Material shows the wind speed, wind direction and temperature at Broken Hill in the far western NSW, Ivanhoe in mid-western NSW. The predicted wind speed, direction and temperature correspond very well with the observations. And wind speed average was about 6 m/s and maximum wind speed about 12 m/s. The wind direction gradually changed from westerly to south-westerly and southerly at these sites. This is a typical pattern for the passage of cold fronts across NSW [45]. At sites in the northeast NSW such as Gunnedah and Moree, the predicted and observation patterns are similar and are shown in Figure S2 of the Supplementary Material.
The prediction from WRF-Chem of PM10 is compared with observation at DPIE air quality monitoring stations in the Sydney region. The model cell that is nearest to the monitoring station is chosen for extracting the predicted pollutant concentration such as PM2.5 and other meteorological variables such as wind speed and direction at the lowest model level above ground (about 28 m). As shown in Figure 4, there is correspondence between peak observed PM10 concentration at the stations and the WRF-Chem predicted PM10. The highest concentration of PM10 was detected at Bargo on 12 February 2019 19:00 local time (AEST) with concentration of 355 µg/m3. At Prospect and Chullora, the peak concentrations of 104 µg/m3 and 90 µg/m3, respectively, occurred at the same time while at Bringelly, peak concentration of 160 µg/m3 occurred one hour later (12 February 2019 20:00 AEST). As these sites are urban monitoring sites, the observed PM10 include both dust and other local sources while WRF-Chem prediction mainly consists of transported dust as the local emission inventory is not taken into account in our large WRF-Chem modelling domain having grid resolution at 15 km by 15 km. Our focus is on the dust transport and the close timing of the predicted peaks and observed peaks of PM10 at the monitoring sites in the Sydney region. The results indicate that these observed peaks are above the average daily PM10 and are due to the contribution of transported dust.
Outside the Sydney metropolitan areas, there are monitoring stations which form the rural air quality monitoring network as maintained by the Department of Planning, Industry and Environment (DPIE). Details of the operation of this network can be found in [46]. Figure 5 shows the WRF-Chem prediction of PM10 and PM2.5 as compared to observed data at the Gunnedah and Dubbo sites. The prediction is reasonable at Gunnedah but there are underprediction of peak values at Dubbo.
Of interest is northern NSW on the day of the dust event as there were many wildfires occurring at the same time in this region. The DPIE monitoring stations provided observed data that can provide an understanding of the effect of both these sources on the air quality in this region. On the 13 February 2019, there was smoke and dust at the same time in the New England area (see Figure 1). The smoke plume was blown between Tamworth and Armidale. Coffs Harbour was affected by both dust and smoke. The 13–14 February 2019 is a good case study of dust and fire occurring at the same time, a rare occurrence. The monitoring data of PM10 and PM2.5 at Armidale provide information on the effect of air quality from dust and wildfire smoke. It will be shown that Armidale was mostly affected by smoke.
In northern NSW, there were also wildfires occurring during the dust storm period 11–15 February 2019 (red hot spots in Figure 1c). The emission from wildfires is therefore considered by using the Fire Inventory from NCAR (FINN). This emission database contains fire emission data of 1 km resolution derived from FIRMS hotspots. These data are usually provided on a daily basis (archived yearly or monthly data) and can be downloaded and are then converted into WRF emission input files. The “base” fire emission datasets are available for three chemical mechanisms, GEOS-CHEM, MOZART-4 and SAPR99. The inclusion of fire emission requires using MOZART gas-phase chemistry in conjunction with GOCART and AFWA dust options in WRF-Chem.
The predicted AODs at 0.55 µm for the 12 to 13 February 2019 00:00 UTC using GOCART aerosol chemistry and AFWA dust scheme without and with wildfires based on FINN emission data are shown in Figure 6. There is a small difference between the AODs predicted using WRF-Chem with FINN emission from fires (GOCART/MOZART chemistry + AFWA dust scheme) and without fires (GOCART aerosol chemistry + AFWA dust scheme). However, the contribution from fires to AOD is rather small and is confined in the vicinities of the fires and offshore as shown in Figure 6b. The high value of AOD mostly concentrated in the Tasman sea on the 13 February 2019, as shown in Figure 6c, and is mainly due to dust with fire emission contribution to the AOD further south.
Compared with the AOD derived from Deep Blue (land) and Dark Target (ocean) algorithms from satellite observations, the AOD prediction from WRF-Chem models are similar and corresponded with the AOD MODIS observations.
The predicted AOD from WRF-Chem GOCART/AFWA MOZART and FINN model on 13 February 2019 at 07 UTC together with AOD from MODIS observation on this day are shown in Figure 6b,c. There is a correspondence between predicted and observed AOD patterns, especially above the Tasman sea. Note that the observed AOD is a composite of Terra and Aqua measurements taken when the satellites pass above the area once per day (one daytime and one night-time). The difference in predicted AOD from WRF-Chem without wildfires (GOCART/AFWA) and with wildfires (GOCART/MOZART FINN) is not significant as shown in Figure 6b. This means that the contribution to AOD in the Tasman sea from wildfires in northern NSW is small compared to dust. This is confirmed by observed CALIOP lidar vertical aerosol structure which indicates that aerosol types consist mostly of dust, marine and dusty marine with some elements of smoke aerosols high above [26]. The contribution from wildfires to AOD is mostly limited to the vicinities of the fires with negligible contribution to AOD above the Tasman sea.
Among the pollutants emitted from fires is CO (Carbon Monoxide) which is considered a marker for fires. Even though the AOD contributed by fires is much less than the dust, the CO plume as predicted from WRF-Chem can show the extent of the fire plumes and corresponds to observed column AOD and CO as shown in Figure 7.
The observed data at DPIE monitoring stations provided additional information in understanding the effect of both these sources on the air quality in this region. The smoke plume was visible between Tamworth and Armidale and the city of Coffs Harbour on the coast was affected by both dust and smoke. Figure S3 in the Supplementary Material shows the prediction and observation of PM2.5 and PM10 at Tamworth and Armidale in northern NSW. At Tamworth, the predicted PM2.5 and PM10 accurately predicted at the time of the peak but underestimate the observed peak values. At Armidale, the prediction is better than that at Tamworth and the prediction is closer to observed peak concentration. Note that at Armidale, there are double peaks of observed PM2.5 and PM10 concentrations and the prediction from WRF-Chem with MOZART/GOCART aerosol chemistry and AFWA dust option also has double peak concentration. Tamworth PM10 peak concentration is 600 µg/m3 (at 13 February 2019 16:00) which is about three times greater than the Armidale peak concentration of ~200 µg/m3 at 13 February 2019 19:00. Tamworth PM2.5 peak concentration is 63.2 µg/m3 (13 February 2019 16:00) which is a third less than the peak PM2.5 concentration at Armidale of 79.5 µg/m3 at 13 February 2019 19:00.
The prediction of PM2.5 and PM10 due to the dust storm and wildfires in northern NSW during the period of 11–15 February 2019 is less than the observed data at the monitoring stations in northern NSW, especially the peak values. In the metropolitan area of Sydney and at other stations (such as Gunnedah), the predicted values are comparable to observed data. The spatial predicted pattern is in line with satellite observation as shown in Figure 7.

3.2. Impact on Health

Based on the daily average of predicted air quality due to the dust storm over the WRF domain, the impact of February 2019 dust-generated storm of PM2.5 on the population health can be estimated in term of health endpoints such as mortality, respiratory and cardiac disease hospitalisation. Here we focus on NSW as the state is the most affected by the dust storm and the health statistical data are available from the Department of Health, NSW. The PM2.5 daily average concentrations over NSW and Sydney due to dust storm as predicted from WRF-Chem model for the five days from 11 to 15 February 2019 are shown in Figure 8 and Figure 9. The progress of the dust storm and its PM2.5 loading across the state can be seen from these spatial plots. At the first stage, the dust storm mainly affected central Australia and far west NSW (Figure 8a), then on the 12 February, the dust storm affected nearly the whole of NSW (Figure 8b). At the last stage, the dust storm only affected far west NSW, northern NSW and south-western Queensland from the 13 to 15 February 2019 (Figure 8c–e). In the Greater Metropolitan Region of Sydney (GMR) and neighbouring LGAs, the days that most affected the PM2.5 concentration were 12, 14 and 15 February 2019 (Figure 9a,c,d).

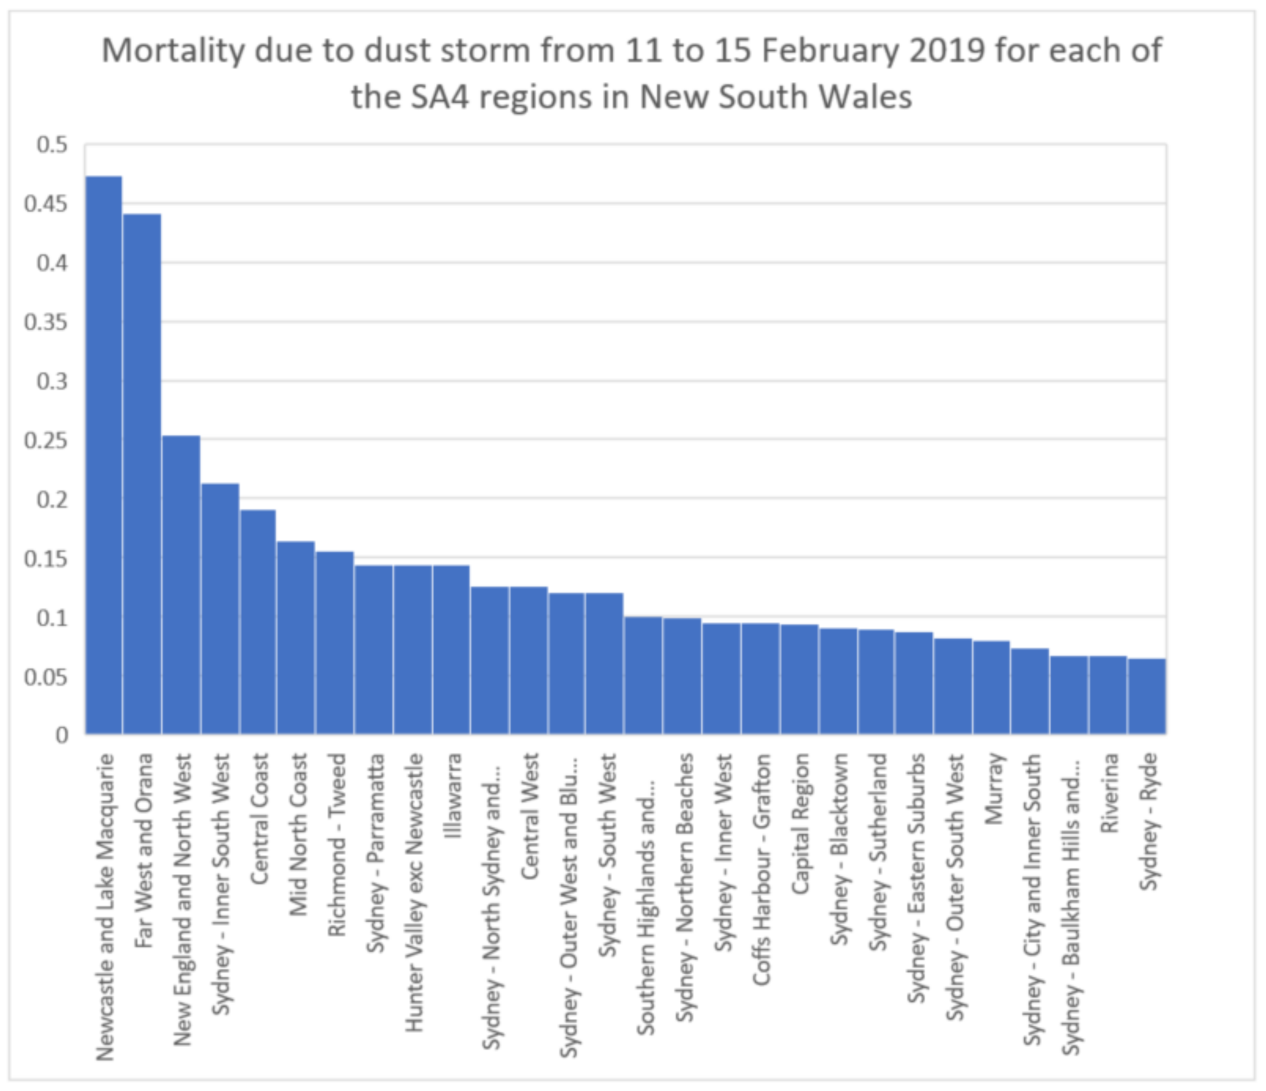
3.2.1. Mortality Impact

Table 1 and Figure 10 show the impact of the dust storm on each of the SA4 (Statistical Area, Level 4) regions in NSW in term of estimated number of premature death due to the 5 days dust storm period of 11 to 15 February 2019. The top five regions which are most affected are Newcastle and Lake Macquarie, Far West and Orana, New England and North West, Sydney—Inner South West and Central Coast. All these regions have higher PM2.5 average PM2.5 concentration than others. Even though Far West and Orana region has the highest average of PM2.5 daily mean, it has a lower population of 116,795 which is about a third smaller than Newcastle and Lake Macquarie, Central Coast and a fifth smaller than Sydney—Inner South West. Note that the New England and Far West region was also affected by wildfires in Northern NSW which is accounted for in WRF-Chem, especially on 13 February 2019 as shown in Figure 7. The total effect on estimated premature mortality across NSW due to dust storm is about four people (1.46 lci, 4, 6.54 uci) (lci = lower confidence interval and uci = upper confidence interval).

3.2.2. Respiratory Diseases Hospitalisation

Table S1 and Figure S4 in the Supplementary Material show the estimated number of people hospitalised due to respiratory diseases as the result of the five day dust storm period. The top five regions with the highest number of people affected are Far West and Orana, Newcastle and Lake Macquarie, Sydney Inner South West, New England and North West and Sydney—Paramatta. The region of Central Coast is displaced to 11th position as the incidence rate of respiratory diseases is less than those of other regions and the region of Far West and Orana has relatively higher incidence rate of respiratory disease hospitalisation compared to mortality rate than that of Newcastle and Lake Macquarie region. The estimated total number of people hospitalised due to respiratory diseases associated with the dust storm and wildfires across NSW is about 161 people (119 lci, 161, 213 uci).

3.2.3. Cardiac Diseases Hospitalisation

Similarly, the effect of dust storm and wildfires on cardiac diseases hospitalisation is presented in Table S2 and Figure S5 in the Supplementary Material. The top five regions which were most affected by the dust storm and wildfires in terms of impact on cardiac diseases hospitalisation are Far West and Oriana, Newcastle and Lake Macquarie, New England and North West, Sydney—Inner South West and Sydney—South West. The region Sydney—Paramatta is relegated to the sixth position after Sydney—South West. The estimated total number of people hospitalised for cardiac diseases is about seven (1.30 lci, 6.98, 15.42 uci).

4. Discussion

This study uses WRF-Chem to simulate the dust storm in February 2019 across eastern Australia as well as wildfires that occurred in the north coast of NSW. The results showed that the wildfires’ impact on air quality and therefore health is much less than that of this dust storm. CALIPSO data, above central Australia on 11 February 2019 from 4:27 to 4:40 UTC, showed that the dust cloud was approximately 1500 km long and extended from western NSW near the border with Victoria to western Queensland [26]. We used an AFWA dust scheme in which saltation bombardment as well as the disintegration of aggregates was considered. As compared to observed values, the prediction of air pollutants such as PM10 and PM2.5 from WRF-Chem air quality model with AFWA dust scheme at a number of stations, including those which were affected by wildfires, is reasonably good in term of the timing of the peaks as measured at the stations and the magnitude of the underestimation of predicted peaks is not too overtly high.
Rizza et al., 2017 [47], in their study of dust event in the central Mediterranean in May 2014, used WRF-Chem with GOCART chemistry and dust scheme based on Shao-2001 simple dust emission scheme and anthropogenic emission data from EDGAR global dataset, have found that the model produced reasonable prediction as compared to observed AOD from MODIS satellite and AOD sun photometer from AERONET sites. As for surface PM10 and PM2.5 prediction, when compared to a few ground monitoring sites, the peak values are overpredicted in their study. In our case, underprediction often occurred at the sites, especially in the metropolitan region of Sydney. This is also partly because the local emission is not included in the EDGAR global emission dataset which also has low resolution.
With respect to using a particular dust emission scheme in WRF-Chem, we have chosen AFWA extension to GOCART in our study. A number of other studies using WRF-Chem to model AOD from dust storms have used the AFWA and UoC extensions to GOCART [48,49,50]. While used to investigate dust extinction (AOD) over the Sahara Desert in North Africa rather than Australia, Crippa et al., 2016 [37] modelled these coefficients and particle vertical profile in summer 2006 using GOCART, AFWA and UoC in WRF-Chem. They found that all the schemes broadly reproduce the observed spatiotemporal distribution of dust content and extinction, but some differences in extent and intensity between the schemes and observations. All schemes reproduced daily variation of major dust events observed in AERONET, but do not capture spatial distribution of maxima as well as that observed by CALIOP lidar vertical profile. They suggested that significant differences between schemes could be due to calculation of threshold wind speed in each scheme. This was also suggested by [51] in their study of comparison of simulated dust produced by three dust-emission schemes in WRF-Chem for the dust event in the Arabian Peninsula on 25 January 2010. They concluded that the AFWA scheme most closely matched the observed dust plume and differences between the schemes could largely be traced to differences in how each calculate the threshold wind speed.
Nikfal et al., 2018 [49] used the all three different schemes of dust emission (GOCART, AFWA, and UoC) and the same GSF dust source function based on topography in WRF-Chem to study the April 2015 dust event around the Persian Gulf in the Middle East. They compared the predicted PM10 and PM2.5 of the three dust schemes with observation at three monitoring sites and the spatial distribution of particle concentration prediction with METOSAT satellite images. The UoC dust scheme showed very low values of dust concentrations at the sites while the original GOCART showed the highest over-estimation. The AFWA dust scheme showed better time series estimation with observation at the sites and better spatial distribution of predicted concentration of particles when compared with satellite images.
The underprediction of peak PM2.5 at Armidale in New England region of northern NSW, while predicting the peak PM10 at the same site is reasonable. We suggest that this is due to the underestimation of emission from biomass burning. The wildfires in the New England region were intense although the majority of the aerosol present in the area was dust, not smoke. Cuchiara et al., 2017 [52] in the study of transport of pollutants due to wildfires in Chile using WRF-Chem with FINN emission found that there was underprediction of ozone. They suggested that the underestimation of NO and/or NO from wildfire emission estimations in FINN was due to a large number of small fires that are too small for the 1 km resolution of FINN to detect or uncertainties and inaccuracies in the parameterisations and fuel loadings and land cover identifications. However, in their study, the overprediction of the wind speed at some sites can also contribute to the underprediction of ozone rather than the underestimation of wildfire emission. For dust emission sources, the current erodibility map in WRF-Chem covers most of the 6 regions of dust sources as shown in Figure 3a. However, some sources in the Mallee-Western Riverina region, which consisted of agricultural and disturbed lands in the border area of NSW and Victoria, are not included in WRF-Chem model and therefore underprediction of PM10 or PM2.5 can occur when compared with observed data at some monitoring sites. Nabavi et al., 2017 [50], in their study of sensitivity of WRF-Chem predictions to dust source function specification in West Asia, found that the use of Ginoux Source Function (Equation (2)) can cause large uncertainty in AOD prediction and suggested a modified Dust Source Function (called West Asia Source Function) based on more detailed information of dust distribution from satellite images in this region. The DSF should not be static and should change seasonally with variation in vegetation or soil bareness as, during drought period, parts of the landscape that are not topographically low, such as western NSW and the Mallee region, have reduced ground cover, and hence become dust sources temporarily.
Note that as the predicted daily average of PM2.5 and PM10 does not exactly match the observed data measured at some points (monitoring stations) in the domain, the reported results here across the domain have some uncertainties due to the model and emission estimate errors. Nevertheless, we report here the estimated health impact to compare the relativity of the effect of dust storms in different Local Government Area (LGA) or regions in NSW. Local areas in the western NSW are mostly impacted in terms of particle concentration and exposure. There are also uncertainties in the epidemiological effect of dust on health as expressed by Equations (8) and (9). The Relative Risk (RR) are different in various studies. Al-Taiar and Thalib 2014 [53], in their study of the short-term effect of dust storms on the risk of mortality due to respiratory, cardiovascular and all-causes in Kuwait, have reported that there was no significant association between dust storm events and same-day respiratory mortality. That is, the RR is less and close to 1. However, for morbidity rather than mortality, in the previous study by the same authors, dust storms were significantly associated with an increased risk of same-day asthma and respiratory admission, with adjusted relative risk of 1.07 (95% CI: 1.02–1.12) and 1.06 (95% CI: 1.04–1.08) based on 10 µg/m3 increase in concentration of PM10. Barnett et al., 2012 [54] reported that there was an increase in emergency admission of 39% for one day storm event but no increase in respiratory hospital admission in Brisbane, Australia during a dust storm event originating from Central Australia in September 2009. One of the reasons given was that most people were prepared, implemented their asthma plans and sheltered indoors during the dust storm and this mitigated the effect of dust exposure. In a study by [55], they reported that there was no association of the 1998 Gobi Desert dust storm in Asia with respiratory admission in British Columbia due to the low impact from long range transport of dust. As for mortality, Ostro et al., 1999 [56] reported there is association between dust events generating PM10 and coarse particles and short-term mortality in Coachella Valley, California study while Schwartz et al., 1999 [57] showed that there was no association in their study of dust effect due to coarse particles on health in Spokane (U.S). However, for fine particles such as PM2.5, the association is stronger. In addition, the differences in the results reported by various authors are mainly due to the difference values of RR calculated for PM10 or PM2.5. Zhang et al., 2016 [58] in their meta study of desert dust effect on human health from literature also found that, for respiratory and circulatory mortality, both positive and negative associations have been reported for PM10, but only positive association was reported between PM2.5–10 (particulate matter of size between 2.5 and 10 µm) and mortality as well as between PM2.5 and mortality. It is clear, that fine rather than coarse particulate is associated with mortality. Our study uses fine particulate PM2.5 to assess the impact of desert dust on exposed population.
Khaniabadi et al., 2017 [22], in their study of the dust impact on health in Iran due to desert storms in Iraq and Saudi Arabia, found that during one-year period (2015–2016), the number of excess cases of COPD (chronic obstructive pulmonary disease) and respiratory mortality due to Middle East dust storm events were 78 and 6 persons in the city of Ilam (Iran) with a population of 172,213. This can be compared to our results, for the whole NSW population of ~7.7 million, of mortality and respiratory hospitalisation of 4 and 161 people, respectively, for one dust event in February 2019. They use AirQ2.2.3 software, developed by the World Health Organization (WHO) to assess the health impact on the population of Ilam exposed to PM10 concentration. The AirQ method, based on Relative Risk (RR) and the baseline incidence rate, is similar to that used in our study. They used the RR values for PM10 based on WHO and APHEA-2 (Air Pollution and Health—a European Approach) studies of 1.008 for COPD (morbidity) and 1.013 for respiratory mortality. While Johnston et al., 2011 [19] derived for PM10 the value of 1.16 (95%CI: 1.03–1.30) with a three-day lag for mortality in Sydney, Australia. This is much higher than 1.013 in the [22] study. The choice of RR values has a major effect on the results of the health endpoint impact.
Dust storm or bushfires are mostly natural events although intensity of the events can increase due to human activities which change or modify the natural landscape. As such, it is difficult to predict and formulate measures to minimise the impact on air quality and health impact as compared to measures to improve air quality in metropolitan areas and reduce anthropogenic emission. Nevertheless, we attempt here to estimate the health impact of the dust storm in February 2019 to assess the contribution of a large dust storm event to mortality and morbidity on exposed population in NSW. The impact of this event on health endpoints in terms of people affected are approximately four premature deaths, 161 respiratory disease hospitalisations and seven cardiovascular disease hospitalisations. These effects are similar in magnitude to those effects due to a fire event near Sydney in May 2016 with three premature deaths and seven cardiac disease hospitalisations [44]. One notable difference is the higher respiratory diseases hospitalisation in this dust event (161) compared to fire event (24). There are a number of air quality management plans such as Action for Air in NSW or various air quality plans in many places in the world using tools such as the Regional Integrated Assessment Tool (RIAT+) to deal with anthropogenic emission [59]. However, the ability to improve the prediction of natural events such as dust storms can significantly increase the accuracy and ability to assess the health impact on exposed population and hence can allow the policy makers in environment and health organisation to formulate and implement procedures to minimize the exposure and associated health impact when dust storm events are forecasted. Modelling tools such as WRF-Chem or WRF-CMAQ that have this capability will play an important role in this effort.

5. Conclusions

We have conducted simulation of dust emission and wildfires smoke transport and their impact on air quality and health on exposed population in NSW during the 11–15 February 2019. The dust sources were predominately from the western parts of Queensland and NSW and the desert areas of South Australia. Wildfire smoke sources were confined to northern NSW. The simulation results using WRF-Chem and observed data on ground and by satellites showed that transport of dust affected air quality in many places in NSW as detected by DPIE air quality monitoring stations. In northern NSW, where wildfires occurred during this period, simulation of both dust and wildfires emission and analysis of observation data from CALIOP lidar showed that aerosols of both sources were carried to the Tasman Sea, but dust dominated the aerosol clouds. The WRF-Chem model was shown to be reasonably accurate and a useful tool to study the impact of dust storm event on air quality and health.
The impact on health endpoints across the state of NSW by the dust storm event in February 2019 are estimated to cause four premature deaths, 161 respiratory disease hospitalisations and seven cardiovascular disease hospitalisations based on model prediction of PM2.5 concentration, the Relative Risk (RR) from published epidemiological studies and the 2016 distribution of population in NSW with the assumption that all is exposed equally to the predicted ambient pollutant at the location.

Supplementary Materials

The following are available online at https://www.mdpi.com/2073-4433/12/2/141/s1, Figure S1: Predicted and observed wind speed, wind direction and temperature at Gunnedah and Moree; Figure S2: Estimated mortality (number of people premature death due to elevated PM2.5 in each SA4 census district in NSW) caused by dust storm and wildfires for the period from 11 to 15 February 2019; Figure S3: Estimated number people hospitalised for respiratory diseases due to elevated PM2.5 in each SA4 census district in NSW caused by dust storm for the period from 11 to 15 February 2019; Figure S4: Estimated number people hospitalised for cardiac diseases due to elevated PM2.5 in each SA4 census district in NSW caused by dust storm and wildfires for the period from 11 to 15 February 2019; Table S1: Impact of dust storm from 11 to 15 February 2019 on mortality in each of the SA4 regions in the NSW. The units are number of persons except for PM2.5 the unit is μg/m3 (*) the value designates the average over all SA4 regions of the 5-days PM2.5 mean of daily average; Table S2: Impact of dust storm from 11 to 15 February 2019 on respiratory diseases hospitalisation in each of the SA4 regions in the NSW. The units are number of persons except for PM2.5 the unit is μg/m3 (*) the value designates the average over all SA4 regions of the 5-days PM2.5 mean of daily average; Table S3: Impact of dust storm from 11 to 15 February 2019 on cardiac diseases hospitalisation in each of the SA4 regions in the NSW. The units are number of persons except for PM2.5 the unit is μg/m3 (*) the value designates the average over all SA4 regions of the 5-days PM2.5 mean of daily average.

Author Contributions

Conceptualisation, H.N.D., J.L., and E.A.; methodology, H.N.D., E.A., S.W. (Sean Watt), G.M., I.H. and S.W. (Stephen White); data procurement: D.S., E.A., C.C.; formal analysis, H.N.D., E.A., C.C., S.W. (Sean Watt), D.S. and L.T.-C.C.; investigation, H.N.D., E.A., C.C., S.W. (Sean Watt) and S.W. (Stephen White); writing—original draft preparation, H.N.D., S.W. (Sean Watt), J.L. and S.W. (Stephen White); visualisation, H.N.D., E.A., C.C.; supervision, H.N.D., M.A. and M.R.; and project administration, H.N.D., M.R., and M.A. All authors have read and agreed to the published version of the manuscript.

Funding

This research received no external funding.

Data Availability Statement

Not applicable.

Acknowledgments

Analyses and visualisations, where they are indicated in the paper, were produced with the Giovanni online data system, developed and maintained by the NASA GES DISC, and the CALIPSO satellite products from NASA Langley Research Center (http://www-calipso.larc.nasa.gov/products/lidar/browse_images/production/). We thank Stephan Heidenreich and Joanne Brady (DPIE) and the DustWatch volunteers for their continued assistance with the Rural Air Quality network maintenance.

Conflicts of Interest

The authors declare no conflict of interest.

References

  1. Middleton, N. Desert dust hazards: A global review. Aeolian Res. 2017, 24, 53–63. [Google Scholar] [CrossRef]
  2. Chan, Y.; McTainsh, G.; Leys, J.; McGowan, H.; Tews, E. Influence of the 23 October 2002 dust storm on the air quality of four Australian cities. Water Air Soil Pollut. 2005, 164, 329–348. [Google Scholar] [CrossRef]
  3. Leys, J.; Heidenreich, S.; Strong, C.; McTainsh, G.; Quigley, S. PM10 concentrations and mass transport during “Red Dawn”—Sydney 23 September 2009. Aeolian Res. 2011, 3, 327–342. [Google Scholar] [CrossRef] [Green Version]
  4. Raupach, M.; McTainsh, G.; Leys, J. Estimates of dust mass in recent major dust storms. Aust. J. Soil Water Conserv. 1994, 7, 20–24. [Google Scholar]
  5. Gorbushina, A.; Kort, R.; Schulte, A.; Lazarus, D.; Schnetger, B.; Brumsack, H.; Broughton, W.J.; Favet, J. Life in Darwin’s dust: Intercontinental transport and survival of microbes in the nineteenth century. Environ. Microbiol. 2007, 9, 2911–2922. [Google Scholar] [CrossRef] [PubMed]
  6. Ke-Yi, C. The Northern Path of Asian Dust Transport from the Gobi Desert to North America. Atmos. Ocean. Sci. Lett. Daqi He Haiyang Kexue Kuaibao 2010, 3, 155–159. [Google Scholar] [CrossRef] [Green Version]
  7. Griffin, D.; Kellogg, C. Dust storms and their impact on ocean and human health: Dust in earth’s atmosphere. EcoHealth 2004, 1, 284–295. [Google Scholar] [CrossRef]
  8. Calvo, E.; Pelejero, C.; Logan, G.; de Deckker, P. Dust-induced changes in phytoplankton composition in the Tasman Sea during the last four glacial cycles. Paleoceanography 2004, 19. [Google Scholar] [CrossRef] [Green Version]
  9. Shaw, E.; Gabric, A.; McTainsh, G. Impacts of aeolian dust deposition on phytoplankton dynamics in Queensland coastal waters. Mar. Freshw. Res. 2008, 59, 951–962. [Google Scholar] [CrossRef]
  10. Bhattachan, A.; D’Odorico, P. Can land use intensification in the Mallee, Australia increase the supply of soluble iron to the Southern Ocean? Nat. Sci. Rep. 2014, 4, 6009. [Google Scholar] [CrossRef] [Green Version]
  11. Gabric, A.J.; Cropp, R.; McTainsh, G.; Butler, H.; Johnston, B.M.; O’Loingsigh, T.; van Tran, D. Tasman Sea biological response to dust storm events during the austral spring of 2009. Mar. Freshw. Res. 2016, 67, 1090–1102. [Google Scholar] [CrossRef] [Green Version]
  12. Garrison, V.; Majewski, M.; Foreman, W.; Genualdi, S.; Mohammed, A.; Simonich, S.M. Persistent organic contaminants in Saharan dust air masses in West Africa, Cape Verde and the eastern Caribbean. Sci. Total Environ. 2014, 468–469, 530–543. [Google Scholar] [CrossRef] [PubMed]
  13. Leys, J.; McTainsh, G. Dust and nutrient deposition to riverine environments of south-eastern Australia. Z. Geomorphol. Suppl. 1999, 116, 59–76. [Google Scholar]
  14. Lenes, J.; Prospero, J.; Landing, W.; Virmani, J.; Walsh, J. A model of Saharan dust deposition to the eastern Gulf of Mexico. Mar. Chem. 2012, 134–135, 1–9. [Google Scholar] [CrossRef]
  15. Braun-Fahrlander, C.; Riedler, J.; Herz, U.; Eder, W.; Waser, M.; Grize, L.; Maisch, S.; Carr, D.J.J.; Gerlach, F.; Bufe, A.; et al. Environmental exposure to endotoxin and its relation to asthma in school-age children. N. Engl. J. Med. 2002, 347, 869–877. [Google Scholar] [CrossRef] [Green Version]
  16. McTainsh, G.; Chan, Y.; McGowan, H.; Leys, J.; Tews, K. The 23rd October 2002 dust storm in eastern Australia: Characteristics and meteorological conditions. Atmos. Environ. 2005, 39, 1227–1236. [Google Scholar] [CrossRef]
  17. Reynolds, R.; Cattle, S.; Moskowitz, B.; Goldstein, H.; Yauk, K.; Flagg, C.; Berquó, T.; Kokaly, R.; Morman, S.; Breit, G. Iron oxide minerals in dust of the Red Dawn event in eastern Australia, September 2009. Aeolian Res. 2014, 15, 1–13. [Google Scholar] [CrossRef]
  18. Rutherford, S.; Clark, E.; McTainsh, G.; Simpson, R.; Mitchell, C. Characteristics of rural dust events shown to impact on asthma severity in Brisbane, Australia. Int. J. Biometeorol. 1999, 42, 217–225. [Google Scholar] [CrossRef]
  19. Johnston, F.; Hanigan, I.; Henderson, S.; Morgan, G.G.; Bowman, D. Extreme air pollution events from bushfires and dust storms and their association with mortality in Sydney, Australia 1994–2007. Environ. Res. 2011, 111, 811–816. [Google Scholar] [CrossRef]
  20. Merrifield, A.; Schindeler, S.; Jalaludin, B.; Smith, W. Health effects of the September 2009 dust storm in Sydney, Australia: Did emergency department visits and hospital admissions increase? Environ. Health 2013, 12, 32. [Google Scholar] [CrossRef] [Green Version]
  21. Bener, A.; Abdulrazzaq, Y.; Al-Mutawwa, J.; Debuse, P. Genetic and environmental factors associated with asthma. Hum. Biol. 1996, 68, 405–414. [Google Scholar] [PubMed]
  22. Khaniabadi, Y.; Daryanoosh, S.; Amrane, A.; Polosa, R.; Hopke, P.K.; Goudarzi, G.; Mohammadi, M.J.; Sicard, P.; Armin, H. Impact of Middle Eastern Dust storms on human health. Atmos. Pollut. Res. 2017, 8, 606–613. [Google Scholar] [CrossRef]
  23. Thalib, L.; Al-Taiar, A. Dust storms and the risk of asthma admissions to hospitals in Kuwait. Sci. Total Environ. 2012, 433, 347–351. [Google Scholar] [CrossRef] [PubMed]
  24. Kim, H.; Kim, D.; Kim, H.; Yi, S. Relationship between mortality and fine particles during Asian dust, smog–Asian dust, and smog days in Korea. Int. J. Environ. Health Res. 2012, 22, 518–530. [Google Scholar] [CrossRef] [PubMed]
  25. Zhang, Q.; Zhang, J.; Yang, Z.; Zhang, Y.; Meng, Z. Impact of PM2.5 derived from dust events on daily outpatient numbers for respiratory and cardiovascular diseases in Wuwei, China. Procedia Environ. Sci. 2013, 18, 290–298. [Google Scholar] [CrossRef] [Green Version]
  26. Nguyen, H.; Riley, M.; Leys, J.; Salter, D. Dust Storm Event of February 2019 in Central and East Coast of Australia and Evidence of Long-Range Transport to New Zealand and Antarctica. Atmosphere 2019, 10, 653. [Google Scholar] [CrossRef] [Green Version]
  27. Rea, G.; Paton-Walsh, C.; Turquety, S.; Cope, M.; Griffith, D. Impact of the New South Wales fires during October 2013 on regional air quality in eastern Australia. Atmos. Environ. 2016, 131, 150–163. [Google Scholar] [CrossRef] [Green Version]
  28. Ma, S.; Zhang, X.; Gao, C.; Tong, D.Q.; Xiu, A.; Wu, G.; Cao, X.; Huang, L.; Zhao, H.; Zhang, S.; et al. Multi-model simulations of springtime dust storms in East Asia: Implications of an evaluation of four commonly used air quality models (CMAQ v5.2.1, CAMx v6.50, CHIMERE v2017r4, and WRF-Chem v3.9.1). Geosci. Model Dev. Discuss. 2019. [Google Scholar] [CrossRef] [Green Version]
  29. Chen, S.; Zhao, C.; Qian, Y.; Leung, L.R.; Huang, J.; Huang, Z.; Bi, J.; Zhang, W.; Shi, J.; Yang, L.; et al. Regional modeling of dust mass balance and radiative forcing over East Asia using WRF-Chem. Aeolian Res. 2014. [Google Scholar] [CrossRef]
  30. Chen, S.; Yan, T.; Zhang, X.; Zhang, G.; Feng, T.; Zhao, D.; Zang, Z.; Liao, S.; Ma, X.; Jiang, N.; et al. Dust modeling over East Asia during the summer of 2010 using the WRF-Chem model. J. Quant. Spectrosc. Radiat. Transf. 2018, 213, 1–12. [Google Scholar] [CrossRef]
  31. Segersson, D.; Eneroth, K.; Gidhagen, L.; Johnasson, C.; Omstedt, G.; Nylén, A.E.; Forsberg, B. Health Impact of PM10, PM2.5 and Black Carbon exposure due to different source sectors in Stockholm, Gothenburg and Umea, Sweden. Int. J. Environ. Res. Public Health 2017, 14, 742. [Google Scholar] [CrossRef] [PubMed] [Green Version]
  32. O’Loingsigh, T.; Chubb, T.; Baddock, M.; Kelly, T.; Tapper, N.J.; de Deckker, P.; McTainsh, G. Sources and pathways of dust during the Australian “Millennium Drought” decade. J. Geophys. Res. Atmos. 2017, 122, 1246–1260. [Google Scholar] [CrossRef] [Green Version]
  33. Ginoux, P.; Chin, M.; Tegen, I.; Prospero, J.M.; Holben, B.; Dubovik, O.; Lin, S.-J. Sources and distributions of dust aerosols simulated with the GOCART model. J. Geophys. Res. Atmos. 2001, 106, 20255–20273. [Google Scholar] [CrossRef]
  34. Marticorena, B.; Bergametti, G. Modeling the atmospheric dust cycle. Part 1: Design of a soil-derived dust emission scheme. J. Geophys. Res. Atmos. 1995, 100, 16415–16430. [Google Scholar] [CrossRef] [Green Version]
  35. Marticorena, B.; Bergametti, G.; Aumont, B.; Callot, Y.; N’Doumé, C.; Legrand, M. Modeling the atmospheric dust cycle: 2. Simulation of Saharan dust sources. J. Geophys. Res. Atmos. 1997, 102, 4387–4404. [Google Scholar] [CrossRef]
  36. LeGrand, S.; Polashenski, C.; Letcher, T.; Creighton, G.A.; Peckham, S.E.; Cetola, J.D. The AFWA dust emission scheme for the GOCART aerosol model in WRF-Chem v3.8.1. Geosci. Model Dev. 2019, 12, 131–166. [Google Scholar] [CrossRef] [Green Version]
  37. Crippa, P.; Castruccio, S.; Archer-Nicholls, S.; Lebron, G.B.; Kuwata, M.; Thota, A.; Sumin, S.; Butt, E.; Wiedinmyer, C.; Spracklen, D.V. Population exposure to hazardous air quality due to the 2015 fires in Equatorial Asia. Sci. Rep. 2016, 6, 37074. [Google Scholar] [CrossRef] [Green Version]
  38. Archer-Nicholls, S.; Carter, E.; Kumar, R.; Xiao, Q.; Liu, Y.; Frostad, J.; Forouzanfar, M.H.; Cohen, A.; Brauer, M.; Baumgartner, J.; et al. The Regional Impacts of Cooking and Heating Emissions on Ambient Air Quality and Disease Burden in China. Environ. Sci. Technol. 2016, 50, 9416–9423. [Google Scholar] [CrossRef]
  39. Hvidtfeldt, U.; Sørensen, M.; Geels, C.; Ketzel, M.; Khan, J.; Tjønneland, A.; Overvad, K.; Brandt, J.; Raaschou-Nielsen, O. Long-term residential exposure to PM2.5, PM10, black carbon, NO2, and ozone and mortality in a Danish cohort. Environ. Int. 2019, 123, 265–272. [Google Scholar] [CrossRef]
  40. Liu, C.; Chen, R.; Sera, F.; Vicedo-Cabrera, A.; Guo, Y.; Tong, S.; Coelho, M.S.; Saldiva, P.H.; Lavigne, E.; Matus, P.; et al. Ambient particulate air pollution and daily mortality in 652 Cities. N. Engl. J. Med. 2019, 381, 705–715. [Google Scholar] [CrossRef]
  41. WHO (World Health Organization). Health Risks of Air Pollution in Europe—HRAPIE Project Recommendations for Concentration–Response Functions for Cost–Benefit Analysis of Particulate Matter, Ozone and Nitrogen Dioxide. 2013. Available online: https://www.euro.who.int/__data/assets/pdf_file/0006/238956/Health_risks_air_pollution_HRAPIE_project.pdf (accessed on 22 January 2021).
  42. Delfino, R.J.; Brummel, S.; Wu, J.; Stern, H.; Ostro, B.; Lipsett, M.; Winer, A.; Street, D.H.; Zhang, L.; Tjoa, T.; et al. The relationship of respiratory and cardiovascular hospital admissions to the southern California wildfires of 2003. Occup. Environ. Med. 2009, 66. [Google Scholar] [CrossRef] [PubMed] [Green Version]
  43. Horsley, J.; Broome, R.; Johnston, F.; Cope, M.; Morgan, G. Health burden associated with fire smoke in Sydney, 2001–2013. Med. J. Aust. 2018, 208, 309–310. [Google Scholar] [CrossRef] [PubMed]
  44. Nguyen, H.; Trieu, T.; Cope, M.; Azzi, M.; Morgan, G. Modelling Hazardous Reduction Burnings and Bushfire Emission in Air Quality Model and Their Impacts on Health in the Greater Metropolitan Region of Sydney. Environ. Modeling Assess. 2020, 25. [Google Scholar] [CrossRef]
  45. Baddock, M.C.; Parsons, K.; Strong, C.L.; Leys, J.F.; McTainsh, G.H. Drivers of Australian dust: A case study of frontal winds and dust dynamics in the lower Lake Eyre Basin. Earth Surf. Process. Landf. 2015, 40, 1982–1988. [Google Scholar] [CrossRef] [Green Version]
  46. Leys, J.; Strong, C.; Heidenreich, S.; Koen, K. Where She Blows! A Ten Year Dust Climatology of Western New South Wales Australia. Geosciences 2018, 8, 232. [Google Scholar] [CrossRef] [Green Version]
  47. Rizza, U.; Bernaba, F.; Miglietta, M.; Mangia, C.; di Liberto, L.; Dionisi, D.; Costabile, F.; Grasso, F.; Gobbi, G.P. WRF-Chem model simulations of a dust outbreak over the central Mediterranean and comparison with multi-sensor desert dust observations. Atmos. Chem. Phys. 2017, 17, 93. [Google Scholar] [CrossRef] [Green Version]
  48. Chaibou, A.; Ma, X.; Kumar, K.; Jia, H. Evaluation of dust extinction and vertical profiles simulated by WRF-Chem with CALIPSO and AREONET over North Africa. J. Atmos. Sol. Terr. Phys. 2019, 199, 105213. [Google Scholar] [CrossRef]
  49. Nikfal, A.; Raadatabadi, A.; Sehatkashani, S. Investigation of dust schemes in the model WRF/Chem. J. Air Pollut. Health 2018, 3, 1–8. [Google Scholar]
  50. Nabavi, S.; Haimberger, L.; Samini, C. Sensitivity of WRF-chem predictions to dust source function specification in West Asia. Aeolian Res. 2017, 24, 115–131. [Google Scholar] [CrossRef]
  51. Letcher, T.; Legrand, S. A comparison of simulated dust produced by three dust-emission schemes in WRF-Chem: Case-study assessment. Environ. Sci. 2018. [Google Scholar] [CrossRef]
  52. Cuchiara, G.; Rappenglück, B.; Rubio, M.; Lissi, E.; Gramsch, E.; Garreaud, R. Modeling study of biomass burning plumes and their impact on urban air quality; a case study of Santiago de Chile. Atmos. Environ. 2017, 166, 79–91. [Google Scholar] [CrossRef]
  53. Al-Taiar, A.; Thalib, L. Short-term effect of dust storms on the risk of mortality due to respiratory, cardiovascular and all-causes in Kuwait. Int. J. Biometeorol. 2014, 58, 69–77. [Google Scholar] [CrossRef] [PubMed]
  54. Barnett, A.; Fraser, J.; Munck, L. The effects of the 2009 dust storm on emergency admissions to a hospital in Brisbane, Australia. Int. J. Biometeorol. 2012, 56, 719–726. [Google Scholar] [CrossRef] [PubMed] [Green Version]
  55. Bennett, C.; McKendry, I.; Kelly, S. Impact of the 1998 Gobi dust event on hospital admissions in the Lower Fraser Valley, British Columbia. Sci. Total Environ. 2006, 366, 918–925. [Google Scholar] [CrossRef]
  56. Ostro, B.; Hurley, S.; Lipsett, M. Air pollution and daily mortality in the Coachella Valley, California: A study of PM10 dominated by coarse particles. Environ. Res. 1999, 81, 231–238. [Google Scholar] [CrossRef]
  57. Schwartz, J.; Norris, G.; Larson, T.; Sheppard, L.; Claiborne, C.; Koenig, J. Episodes of high coarse particle concentrations are not associated with increased mortality. Environ. Health Perspect. 1999, 107, 339–342. [Google Scholar] [CrossRef]
  58. Zhang, X.; Zhao, L.; Tong, D.; Wu, G.; Dan, M.; Teng, B. A systematic review of global desert dust and associated human health effects. Atmosphere 2016, 7, 158. [Google Scholar] [CrossRef] [Green Version]
  59. Relvas, H.; Miranda, A.; Carnevale, C.; Maffeis, G.; Turrini, E.; Volta, M. Optimal air quality policies and health: A multi-objective nonlinear approach. Environ. Sci. Pollut. Res. 2017, 24, 13687–13699. [Google Scholar] [CrossRef]
Figure 1. Extent of dust cloud as detected by satellites: (a) aerosol subtype vertical profile as derived from CALIOP measurements on 11 February 2019 from 4:27 to 4:40 UTC with CALIPSO satellite path above central Australia (b) Extent of dust cloud (red line) as measured by CALIPSO satellite on 11 February 2019 4:27 to 4:40 UTC. (c) MODIS Terra satellite image on 13 February 2019 of the dust cloud and hot spots (red) of wildfires in the northern New South Wales (NSW) area and the locations of the main towns and cities (yellow dots) (d) Maximum AOD Deep Blue Terra MOD08-D3 for the 13 February 2019 (source: Figure 6 in Nguyen et al., 2019) [26].
Atmosphere 12 00141 g001aAtmosphere 12 00141 g001b
Figure 2. Location of some of DPIE air quality monitoring stations with dust particle measurements (a) and the WRF-Chem modelling domain (b).
Atmosphere 12 00141 g002
Figure 3. (a) Six dust source regions as of O’Loingsigh et al., 2017 [32]: (1) Northern Simpson desert (2) Queensland Channel Country (3) Lake Eyre and South Simpson desert ephemeral lakes region (4) South Strzelecki desert and Lake Frome sub basin (5) Lake Torrens and Gairdner region (6) Mallee and Western Riverina regions. (b) Vegetation cover (%) for February 2019 in Australia (source: http://www-data.wron.csiro.au/remotesensing/MODIS/products/public/v310/australia/monthly/cover/).
Atmosphere 12 00141 g003
Figure 4. WRF-Chem predicted PM10 from dust transport and observed PM10 from air quality monitoring sites, Bringelly (a), Bargo (b), Prospect (c) and Chullora (d) in the Sydney region.
Atmosphere 12 00141 g004
Figure 5. Comparison of PM10 and PM2.5 as observed and prediction from WRF-Chem at Gunnedah (a,b) and Dubbo (c,d).
Atmosphere 12 00141 g005
Figure 6. (a) Predicted AOD on 12 February 2019 at 00:00 UTC and 13 February 2019 at 07:00 UTC with GOCART aerosol chemistry + AFWA dust scheme. (b) Predicted AOD 13 February 2019 at 07:00 with GOCART/AFWA/MOZART and FINN model and difference in predicted AOD from WRF-Chem without wildfires (GOCART/AFWA) and with wildfires (GOCART/AFWA/MOZART FINN). (c) AOD derived from MODIS Aqua/Terra satellite observation (3 km land and ocean) on 13 February 2019 3:50 UTC (Aqua) and 12 February 2019 23:30 UTC (Terra).
Atmosphere 12 00141 g006
Figure 7. (a) WRF-Chem predicted Carbon Monoxide (CO) surface concentration (ppmv) at 12 February 2019 07:00 and (b) 13 February 2019 10:00 due to wildfires in New England area. (c) Maximum Aerosol Optical Depth (AOD) on 13 February 2019 3:50 UTC from MYD08-E3 (Aqua) satellite product and (d) combined AOD from ascending Aqua 3 km land and ocean on 13 February 2019 3:50UTC with daily night column CO from descending Aqua/Airs (greenish and bluish colours) on 13 February 2019 14:45 UTC.
Atmosphere 12 00141 g007
Figure 8. Daily average concentration of PM2.5 across NSW, generated from the dust storm event, as predicted by WRF-Chem model on 11 (a), 12 (b), 13 (c), 14 (d) and 15 February 2019 (e).
Atmosphere 12 00141 g008aAtmosphere 12 00141 g008b
Figure 9. Daily average PM2.5 predicted concentration due to dust storm in Sydney and neighbouring Local Government Areas (LGAs) on 12 (a), 13 (b), 14 (c) and 15 February 2019 (d).
Atmosphere 12 00141 g009aAtmosphere 12 00141 g009b
Figure 10. Estimated mortality (number of people premature death due to elevated PM2.5 in each SA4 census district in NSW) caused by dust storm and wildfires for the period from 11 to 15 February 2019.
Atmosphere 12 00141 g010
Table 1. Impact of dust storm from 11 to 15 February 2019 on mortality in each of the SA4 regions in the NSW. The units are number of persons except for PM2.5 the unit is µg/m3 (*) the value designates the average over all SA4 regions of the 5-days PM2.5 mean of daily average.
SA4 NamePopulation5-Days PM2.5 Mean of Daily Mean (µg/m3)Attrib_mort_lciAttrib_mort_meanAttrib_mort_uci
Central Coast 335,3093.450.070.190.31
Sydney—Baulkham Hills and Hawkesbury 235,0833.420.020.070.11
Sydney—Blacktown 350,3563.380.030.090.15
Sydney—City and Inner South 337,0693.290.030.070.12
Sydney—Eastern Suburbs 285,4183.280.030.090.14
Sydney—Inner South West 598,4543.410.080.210.35
Sydney—Inner West 308,2683.370.030.100.16
Sydney—North Sydney and Hornsby 424,9063.280.050.130.21
Sydney—Northern Beaches 266,3443.260.040.100.16
Sydney—Outer South West 269,2723.600.030.080.13
Sydney—Outer West and Blue Mountains 314,8483.750.040.120.20
Sydney—Parramatta 467,1613.390.050.140.24
Sydney—Ryde 190,1613.320.020.070.11
Sydney—South West 421,6923.540.040.120.20
Sydney—Sutherland 225,4273.420.030.090.15
Hunter Valley exc Newcastle 269,6684.260.050.140.23
Illawarra 303,7013.640.050.140.23
Newcastle and Lake Macquarie 370,1828.250.170.470.77
Capital Region 224,2882.890.030.090.15
Central West 210,7624.020.050.130.21
Coffs Harbour—Grafton 138,9044.260.030.090.16
Far West and Orana 116,79522.890.160.440.73
Mid North Coast 216,0023.770.060.160.27
Murray 117,7834.380.030.080.13
New England and North West 185,7879.060.090.250.41
Richmond—Tweed 245,1643.820.060.160.25
Riverina 159,7943.030.020.070.11
Southern Highlands and Shoalhaven 150,6763.620.040.100.16
All SA4 regions7,739,2744.61 (*)1.464.006.54
Publisher’s Note: MDPI stays neutral with regard to jurisdictional claims in published maps and institutional affiliations.

