Article

Classification of the Circulation Patterns Related to Strong Dust Weather in China Using a Combination of the Lamb–Jenkinson and k-Means Clustering Methods

1
State Key Laboratory of Severe Weather & Institute of Artificial Intelligence for Meteorology, Chinese Academy of Meteorological Sciences, Beijing 100081, China
2
Department of Atmospheric and Oceanic Sciences & Institute of Atmospheric Sciences, Fudan University, Shanghai 200433, China
3
National Meteorological Center, China Meteorological Administration, Beijing 100081, China
*
Author to whom correspondence should be addressed.
Atmosphere 2021, 12(12), 1545; https://doi.org/10.3390/atmos12121545
Submission received: 13 October 2021 / Revised: 17 November 2021 / Accepted: 17 November 2021 / Published: 23 November 2021
(This article belongs to the Section Meteorology)

Abstract

:
Sand and dust storms (SDSs) cause major disasters in northern China. They have serious impacts on human health, daily life, and industrial and agricultural production, in addition to threatening the regional ecological environment and social economy. Based on meteorological observational data and the European Centre for Medium-Range Weather Forecasts (ECMWF) ERA5 dataset for spring 2000–2021, we used the Lamb–Jenkinson circulation classification method to classify the three major areas influencing SDSs in northern China. We also used the k-means clustering method to classify the overall circulation pattern in northern China. Our results show that the circulation types favoring SDSs in the southern basin of Xinjiang are southwesterly winds (SW), cyclones (C), and anticyclones (A). The circulation types favoring SDSs in western Inner Mongolia and southern Mongolia are northwesterly winds (NW), northerly winds (N), cyclones (C), and anticyclones (A). The circulation types favoring SDSs in central Inner Mongolia are northwesterly winds (NW), northerly winds (N), southwesterly winds (SW), and anticyclones (A). The 500 hPa and surface circulation patterns in China can be divided into nine types. Among them, five dominant circulation patterns favor strong SDSs: a cold high-pressure region and cold front (T1), a Mongolian cyclone (T2), a mixed type of Mongolian cyclone and cold front (T3), a thermal depression and cold front (T5), and a cold front (T8). During 2000–2004, the T8 circulation pattern occurred most frequently as the main influencing circulation. From 2005 to 2010, the T3 and T8 circulation patterns dominated. Circulation patterns T1 and T3 dominated during 2011–2015 and 2016–2020, respectively. We analyzed the main circulation patterns for four SDS events occurring in 2021 by combining the Lamb–Jenkinson and k-means methods. The SDS events in 2021 were closest to the T3 circulation pattern and were mainly influenced by Mongolian cyclones and surface cold fronts. The main propagation paths were westerly and northwesterly.

1. Introduction

Sand and dust storms (SDSs) frequently occur in arid and semi-arid areas as a result of specific meteorological conditions in desert ecological environments [1]. The total amount of surface dust globally is estimated to be about 1000–3000 Tg·a−1, of which 8–36 Tg are suspended in the atmosphere [2,3]. There are four major sources of dust globally: north Africa, Central Asia, North America, and Australia. Dust in Asia mainly originates from the deserts of China and Mongolia, which release about 800 Tg of dust particles into the atmosphere each year, accounting for > 50% of the total atmospheric dust [4,5,6,7]. Sandstorms are a major weather disaster in northern China and have both direct and indirect effects on the regional climate, atmospheric environment, ecological system, social and economic activities, and human health. Northern China is an important source of dust in Central Asia. The surface of this region is exposed, and there are many loose materials. With frequent winds in winter and spring, it is easy for this dust to rise into the atmosphere [8,9]. Dust in northern China not only causes direct harm within the region, but it also has a profound impact on the global climate system through transport via atmospheric circulation patterns.
There have been many studies of the main circulation patterns and synoptic systems during SDSs. Swap et al. [10] showed that the development of dust storms is influenced by a variety of meteorological factors. When suitable macro-meteorological factors and subsurface conditions are both present, favorable circulation patterns and synoptic systems are also required to generate SDSs. A significant decrease in dust weather in northern China in the mid-1980s was related to a decrease in the number of cyclones in northern China during the same period [11]. The distribution and frequency of SDSs are related to the large-scale atmospheric circulation, including the polar vortex, cold air activity, and surface pressure field [12,13,14]. In spring, dust from Asia is transported into the North Pacific by westerlies at 500 hPa. Recent observations of the Asian dust network indicate that the East Asian vortex formed by the ridge of westerlies at 500 hPa is the key driver for the transport of dust over long distances [15,16].
Atmospheric circulation patterns generally determine the type and variation of the global and regional weather and climate. A defined region is generally controlled by several specific atmospheric circulation patterns, and it is important to classify the typical circulation patterns influencing dust weather. At present, studies on dust weather circulation mainly rely on weather maps, meteorological data, and synoptic principles for subjective classification. For example, Brazel et al. [17] classified sandstorm events in Arizona from 1965 to 1980 and identified four different weather patterns that caused sand storms: cold front type, convective type, tropical disturbance type, and upper cut-off low type. Pauley et al. [18] concluded that topographically closely linked leeward slope troughs and topographically forced surface winds formed near steep terrain are all suitable for the formation of dust storms. In addition, the strong pressure gradients of cyclonic systems are also favorable for the formation of dust storms.
These subjective classifications of circulation patterns are intuitive and have a clear physical significance, but these methods rely only on human experience and are highly subjective. The common objective typing methods in meteorology are empirical orthogonal function and principal components analysis methods, but these methods are applied to meteorological data series of different lengths to obtain different typing results, limiting their use in practical operations. The Lamb–Jenkinson scheme is an objective classification method for the synoptic circulation [19]. The Lamb–Jenkinson scheme was proposed by Lamb et al. [20] and later developed by Jenkinson et al. [21] into a relatively mature method of circulation typing. This method requires only a small amount of calculation, and its classification results have clear synoptic implications, so it is widely used. The classification results can be used to study basic meteorological elements, such as temperature and precipitation, and can also be used to study the relationship between the diffusion of atmospheric pollution and circulation patterns [22,23,24]. Using the Lamb–Jenkinson atmospheric circulation typing method to quantitatively classify the circulation types of the daily mean sea-level pressure (SLP) field can better represent the regional circulation in China. However, the variation in circulation patterns is different in different regions, so regional differences and high-level circulation patterns need to be taken into consideration [21,25].
There have been few studies of the objective classification of sand and dust weather in northern China. We used the Lamb–Jenkinson objective circulation classification method to classify the circulation patterns in the main dust regions of northern China. We used the k-means clustering method to classify the circulation patterns in the northern region using upper atmosphere and surface circulation field data and to analyze the dominant circulation patterns and their temporal and spatial variations in northern China in the spring. These circulation classification results will help in understanding the weather patterns favoring SDSs and help in their forecast.

2. Data and Methods

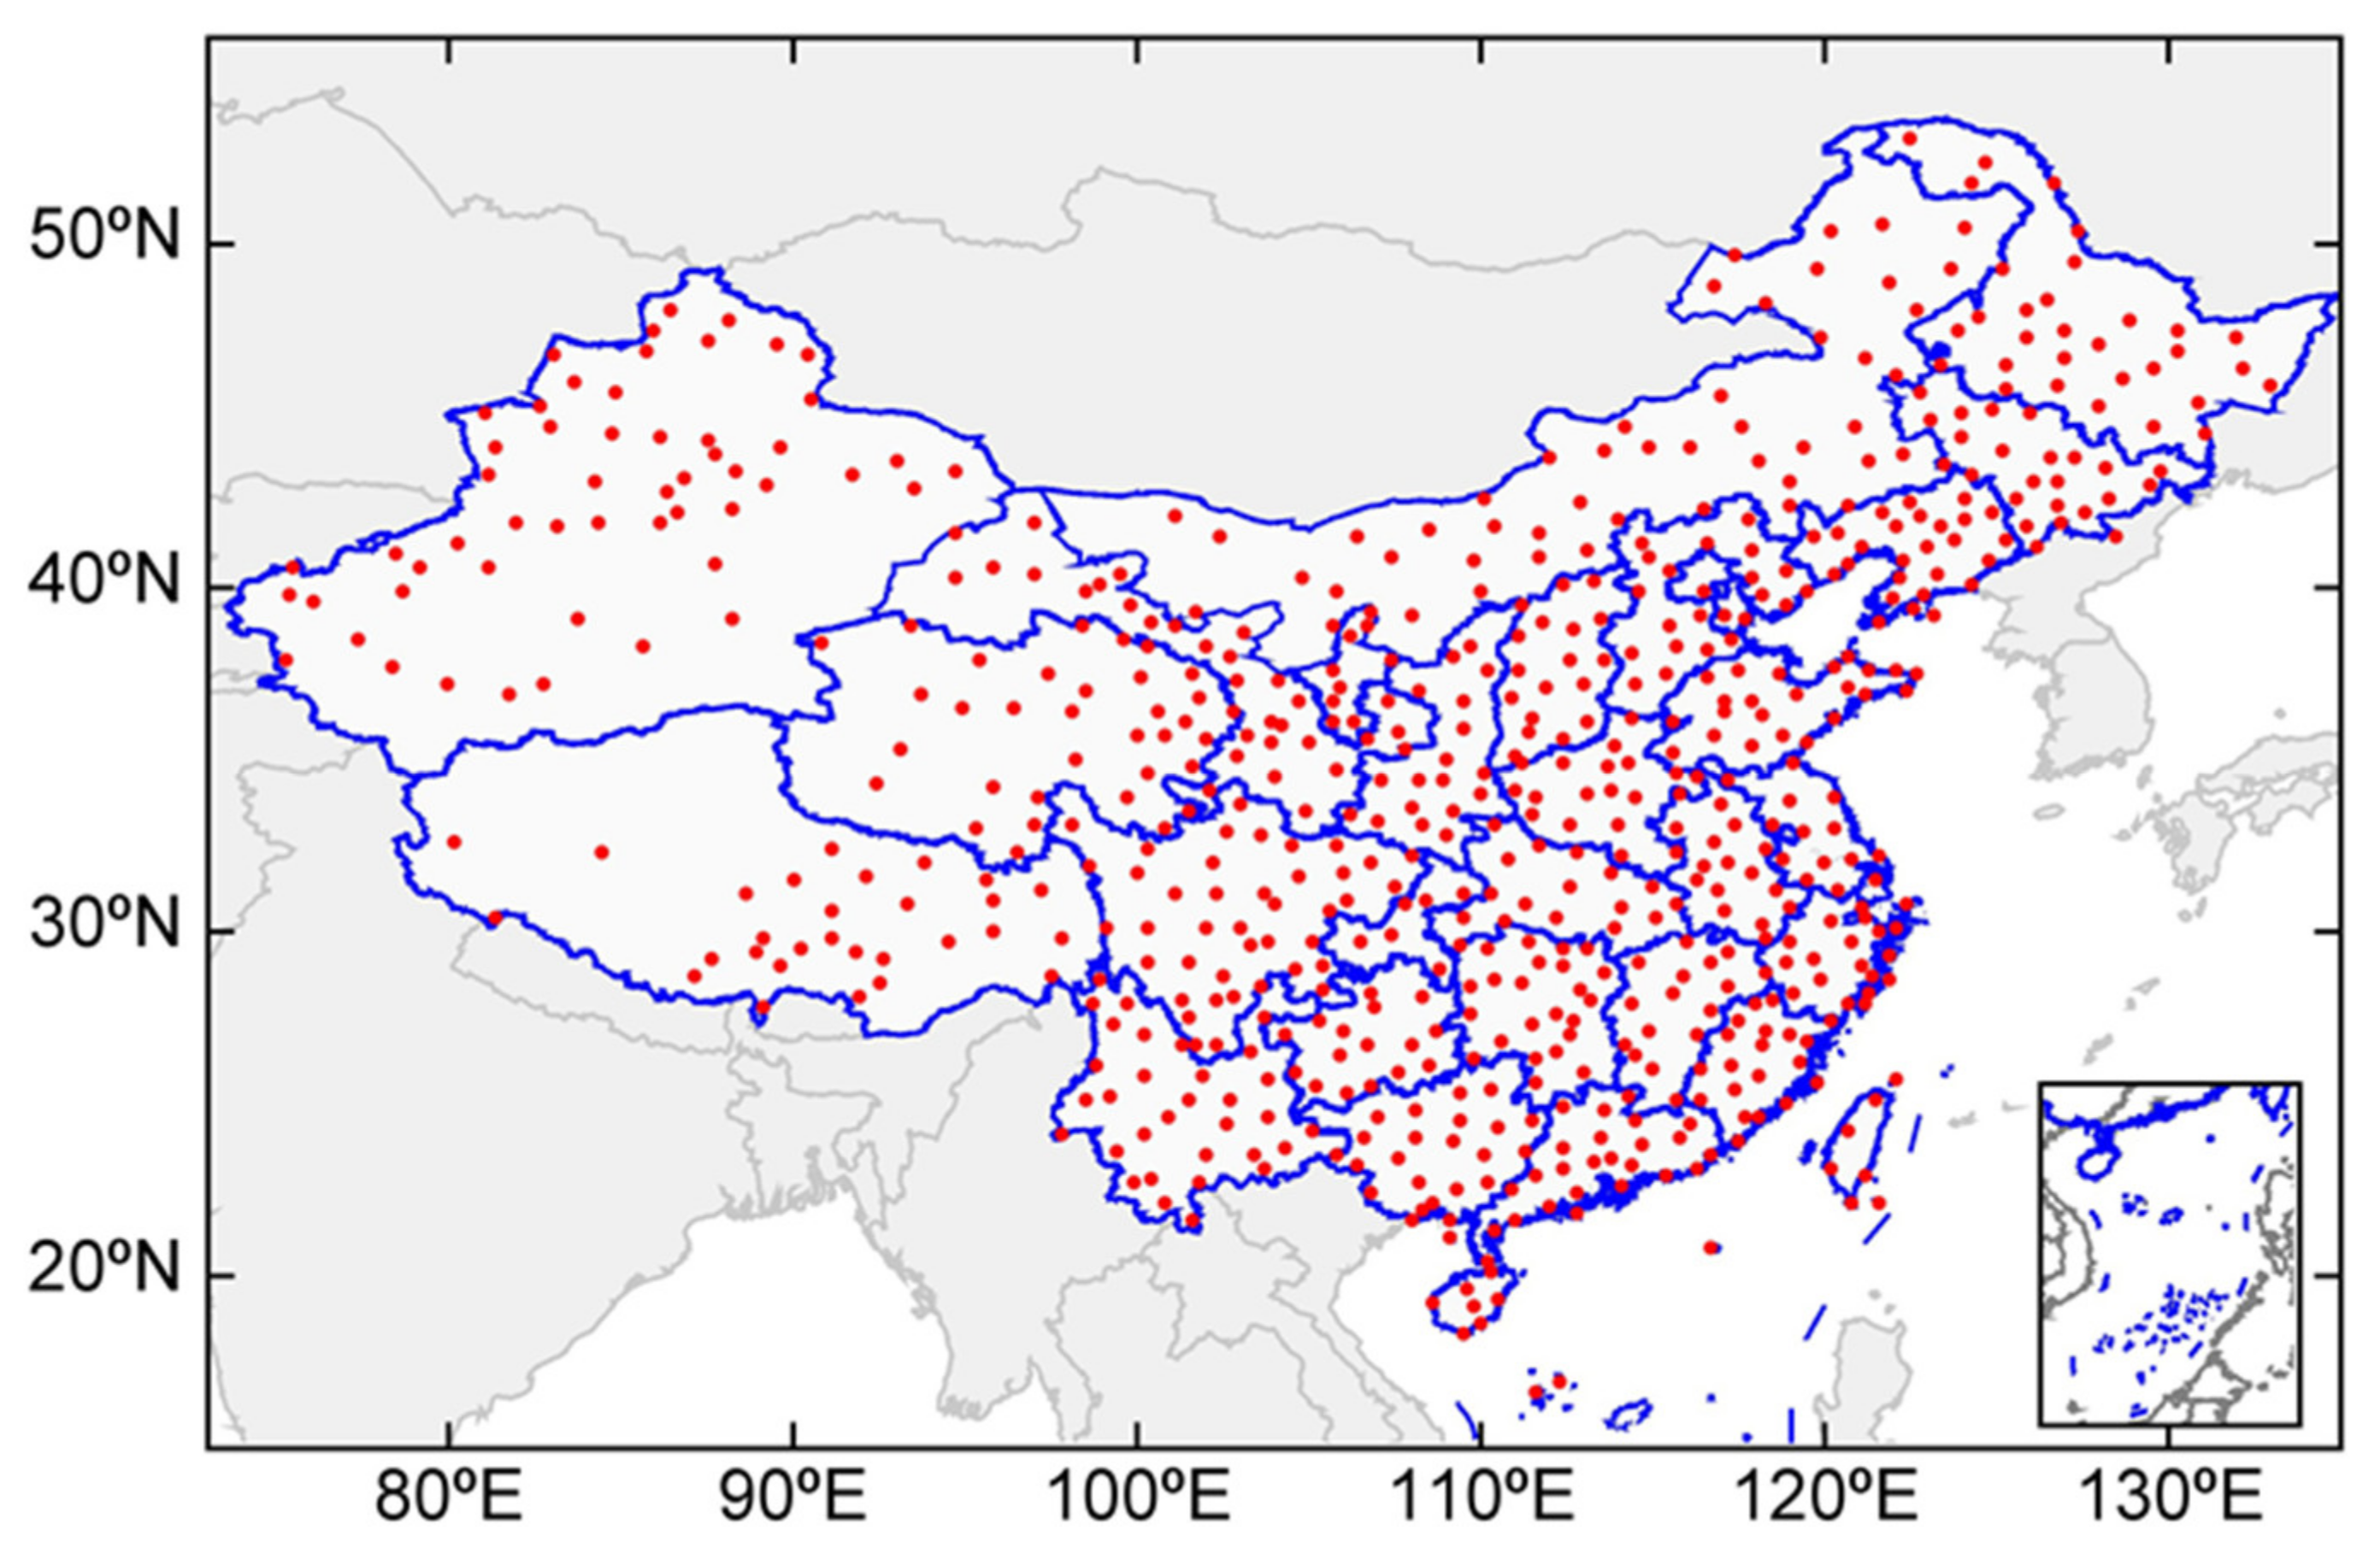
2.1. Meteorological Data

We used the dust storm thematic dataset (V1.0), a daily station observational dataset from the National Meteorological Information Center. This dataset includes the daily occurrences of floating dust, blowing sand, and dust storms at 2474 stations. We selected data from 673 national standard ground stations (Figure 1) with higher observational quality for this study. Because the dust and sand dataset are only collated up to 2018, the data from 2018 to 2021 were supplemented using Meteorological Information Comprehensive Analysis and Process System (MICAPS) ground-based total element observations to fuse the final daily dust storm dataset from 2000 to 2021. Based mainly on the horizontal visibility and wind speed at a single observation station (Table 1), the China Meteorological Administration classifies sand and dust weather at a single station into five levels: floating dust, blowing sand, SDS, severe SDS, and extreme severe SDS [26].
A regional floating dust or blowing sand event refers to a weather process in which five or more adjacent stations record floating dust or blowing dust at the same observation time. For regional SDS, severe SDS, or extreme severe SDS events, the corresponding sand and dust weather is recorded in at least three adjacent stations at the same observation time. If two or more levels are reached at the same time, the most severe level will be recorded [26]. Because the most SDS events in northern China occur in spring [27], this paper focuses on the upper air and surface circulation type classifications of SDS events (regional SDS, regional severe SDS, and regional extreme severe SDS) in spring (March to May).

2.2. Reanalysis Data

The ERA5 is the fifth generation European Centre for Medium-Range Weather Forecasts (ECMWF) reanalysis dataset for the global climate and weather, and it covers the time period from 1950 to the present day [28]. We used the geopotential height and temperature at 500 hPa, the U and V wind components at 500 hPa, the SLP, and the 10 m U and V wind components for the upper air and surface circulation classifications. All the selected data were from spring 2000 to spring 2021 with a resolution of (0.25° × 0.25°).

2.3. Objective Circulation Classification

2.3.1. Lamb–Jenkinson Scheme

Figure 2 shows the spatial distribution of the annual average number of spring SDS days in China from 2000 to 2020 and the grid division of the Lamb–Jenkinson scheme. The main regions affecting north China are distributed in the southern Xinjiang basin (37–42° N, 76–90° E), western Inner Mongolia and southern Mongolia (38–45° N, 97–110° E), and the center of Inner Mongolia (42–45° N, 114–118° E). We used the Lamb–Jenkinson scheme with central points A (40° N, 85° E), B (40° N, 105° E), and C (45° N, 115° E) of the three main dust regions as the centers (red asterisk in Figure 2); 16 grid points were taken for every 5° of latitude and 10° of longitude to cover each area. The six circulation indices of the geostrophic wind (u, v, V) and vorticity (ξu, ξν, ξ) at the center were calculated using the SLP at 16 grid points in each region, as in Equations (1)–(6) [24].
u = 1 2 [ p 12 + p 13 p 4 p 5 ]
v = 1 4 1 cos α p ( 5 ) + 2 p 9 + p 13 p 14 2 p 8 p ( 12 )
V = u 2 + v 2
ξ u = - u y 1 2 sin α sin α 1 p 15 + p 16 p 8 p 9
1 2 sin α sin α 1 p 8 + p 9 p 1 p ( 2 )
ξ u = v x = 1 4 1 2 cos 2 α p 6 + 2 p 10 + p 14 p 5 2 p 9 p 13 + 2 p 7 + p 11 p 4 2 p 8 p 12
ξ = ξ u + ξ v
where p n is the SLP at the nth grid point. α ,   α 1   ,   and   α 2 are the latitudes of p 8 , p 12 ,   and   p 14 , respectively. V is the geostrophic wind, and u and v are the latitudinal and longitudinal components of the geostrophic wind, respectively. ξ is the geostrophic vorticity, ξu is the longitudinal gradient of u, and ξν is the latitudinal gradient of v. According to the relationship between the ground-rotating wind speed, wind direction, and ground-rotating vorticity, the circulation types were classified into three major categories of airflow type, rotation type, and mixed type, which were then subdivided into 27 circulation types (Table 2).
The results obtained by the Lamb–Jenkinson method have a clear physical meaning. For example, if the circulation type of a region is UD, then the circulation in the region is undefined; the directional flow types (N, NE, E, SE, S, SW, W, NW) were characterized by the direction of wind. N means that the region is controlled by a northerly geostrophic flow; the rotational flow is divided into two categories, which can either be cyclonic (C) or anticyclonic (A); the mixed type would include A-hybrid types (AN, ANE, AE, ASE, AS, ASW, AW, ANW) and C-hybrid types (CN, CNE, CE, CSE, CS, CSW, CW, CNW). CN means that the area is controlled by a low-pressure system under the influence of northerly winds, and so on [24,29].

2.3.2. k-Means

There were a total of 1932 days in spring from 2000 to 2020. Because meteorological data have high dimensions, we first normalized the data and then reduced the dimensionality of the data into five principal components by PCA, retaining 91% of the cumulative variance of the original data to obtain a (1932 × 5) data matrix [30]. This method projects the high-dimensional data space into a low-dimensional data space to reduce the dimensionality retention, while retaining most of the variance information of the original data. The principal component variables are orthogonal, which removes the redundant information in the original data and better reflects the data characteristics. The k-means clustering method is the simplest and most commonly used clustering algorithm based on the squared error criterion. The algorithm takes k as the parameter and divides n samples into k categories so that the sum of squares within the group is less than the sum of squares between groups. The intra-class similarity is therefore high, and the inter-class similarity is low [31,32]. The k-means clustering method is adopted to classify the principal components obtained in the first step and the specific number of classifications is determined by the standard function. The steps in the clustering are as follows. (1) Randomly select k samples as the initial clustering center. (2) Calculate the Euclidean distance between each sample and each center, and then assign the samples to the category with the shortest distance. (3) Calculate the average value of each category as the cluster center, and then calculate the distance between each sample and each center. The sample is then reassigned to the category with the shortest distance. (4) Repeat step (3) until the clustering center does not change. (5) Obtain the clustering results as the output.

3. Results

3.1. Results of Lamb–Jenkinson Scheme

3.1.1. Surface Circulation Types in the Three Main Areas Influenced by Dust

To better study the types of surface circulation when sandstorms occur, it is first necessary to understand the characteristics of the circulation patterns in northern China in the spring. Based on the ECMWF ERA5 SLP reanalysis data, the Lamb–Jenkinson circulation classification method was used to analyze the daily circulation types of the southern Xinjiang basin (37–42° N, 76–90° E), western Inner Mongolia and southern Mongolia (38–45° N, 97–110° E), and central Inner Mongolia (42–45° N, 114–118° E). Figure 3 shows the frequency of the 27 circulation types in each region.
The results show that the important circulation types in the southern Xinjiang basin are the C (25.23%), A (14.59%), W (12.07%), SW (7.90%), and CW (6.38%) types, whereas in western Inner Mongolia and southern Mongolia they are the C (23.40%), A (7.90%), N (7.29%), NW (6.99%), and E (6.99%) types, and in the center of Inner Mongolia they are the C (13.1%), SW (10.6), N (10.3%), W (9.1), NW (8.8%), and A (8.20%) types. We used the ratio P1/P2 to analyze the frequency of SDSs under the different circulation types. P1 is the proportion of SDS days under a certain circulation type, and P2 is the proportion of SDS days under all circulation types. When P1/P2 < 1, this means that SDSs are less likely to occur when that circulation type is present. When P1/P2 > 1, SDSs are more likely to occur. The main types of circulation in the southern Xinjiang basin prone to SDSs are SW, A, and C. The circulation types that are prone to SDSs in western Inner Mongolia and southern Mongolia are NW, N, A, and C. The circulation types that are mainly prone to SDSs in the center of Inner Mongolia are NW, N, SW, and A.

3.1.2. Annual Variation of the Dominant Circulation Pattern in the Area Influenced by Dust

Figure 4 shows the annual variation of the dominant circulation pattern with time in the southern basin of Xinjiang, western and southern Inner Mongolia, and the center of Inner Mongolia during 2000–2020. For SDSs in the southern Xinjiang basin, the SW pattern dominates in 2000, the C pattern mainly dominates from 2002 to 2013, and the region is mainly influenced by the A pattern from 2014 to 2020. The year with the highest occurrence of SDSs is 2002, with a total of 20 days. SDSs in western Inner Mongolia and southern Mongolia are mainly influenced by the A pattern in the years 2000, 2011, 2012, 2016, and 2017, whereas C is the dominant circulation pattern in other years. The number of SDS days of all four circulations is highest in 2000–2001, with a total of 33 days. N and C are the main patterns in the central region of Inner Mongolia during the study period. The SW pattern dominates in 2004, 2009, and 2014, whereas the NW pattern is the main influence in 2017 and 2019.
In conclusion, the influence of surface cyclones and anticyclonic systems is dominant in northern China from 2000 to 2020, and the order of importance of main influencing types in each region changes with the year. The number of SDS days in China also fluctuates with the year, indicating that the circulation type has an important influence on the number of SDSs.

3.2. Results of k-Means Method

3.2.1. Dominant Circulation Patterns and Their Characteristics

Based on the ERA5 reanalysis dataset, we determined nine circulation types using PCA dimensionality reduction combined with the k-means clustering method to calculate the SLP field, the 10 m wind field, the 500 hPa height wind field, and the temperature field from 2000 to 2020. Figure 5 shows the distribution of the 500 hPa height field, the wind field, and the temperature field under the nine different circulation types, and Figure 6 shows the distribution of the SLP field and the 10 m wind field under the nine different circulation types. The probability in the upper left-hand corner of the figures indicates the ratio of the number of days of strong dusty weather in the circulation type to the total number of days in the circulation type. Among them, T1, T2, T3, T5, and T8 have a higher probability of occurrence. We define the circulation type with the higher probability of occurrence of SDSs as the dominant circulation type. We then analyzed the upper air and surface circulation types of these five dominant circulation patterns.
The number of days of SDSs under the T1 circulation type is 42, accounting for 17.50% of the total number of days with this circulation type. At 500 hPa, it can lead to the development of a high-pressure ridge in the Ural Mountains, with the trough line located north of Xinjiang. There is a strong northwesterly airflow after the trough, and the temperature trough lags behind the height trough. This means that the low trough continues to develop and deepen and gradually presses southward; the area in front of the trough appears in northwest Xinjiang in windy weather. At the same time, the ground-level cold front is located in the northwestern part of northern Xinjiang along the national border. The main body of the cold high-pressure region is located around the Aral Sea, Lake Baikal and the central Xinjiang cyclone exists, and the Hexi Corridor is at the bottom of the cyclone. The cold front seen after the pressure gradient is very large and is accompanied by high winds and dust storms; the cold front ahead of the strong thermal low-pressure area is conducive to the formation of convective instability. The main propagation path of this pattern type is westerly and northwesterly, and the main influencing system is the cold high-pressure region and the cold front. SDSs originate in Mongolia, western Inner Mongolia, or southern Xinjiang in China, guided by the northwesterly or westerly airflow, and affect northwest and north China in a southeasterly or easterly direction; they sometimes also affect the western and southern part of northeast China.
The number of days with SDSs under the T2 circulation type is 27, accounting for 16.27% of the total number of this type. At 500 hPa, the cross-trough is located in the West Siberian Plain. The trough is wide; the high-pressure ridge is located in the area east of the Ural Mountains, and the high-altitude front is located in the west of Mongolia. Most of Mongolia is in front of the high-altitude trough and is influenced by the strong northwesterly airflow in front of the ridge after the trough. The cold air in Siberia is therefore constantly transported from northwest to southeast. A Mongolian cyclone with a central value of 1007.5 hPa is generated near Ulaanbaatar after an increase in the ground wind speed. SDS weather occurs in western and southern Mongolia and in central and western Inner Mongolia. The main propagation path of this type of sand and dust weather is northwesterly, the main impact system for Mongolian cyclones. SDS weather mainly originates in western Inner Mongolia or Mongolia, guided by the northwesterly airflow. The main body of SDSs occur from northwest to southeast and mainly affects northwest and northern China.
The number of days with SDSs under the T3 circulation type is 69, accounting for 26.04% of the total number of this type. At 500 hPa, the high-pressure ridge is located in the Ural Mountains, with a strong northerly airflow in front of the ridge. The high-altitude cold vortex is located near Western Siberia, accompanied by a cold center of −40 °C. The high-altitude trough at the bottom of the cold vortex extends to western Inner Mongolia, with obvious cold advection after the trough. The temperature trough lags behind the altitude trough; the high-altitude trough deepens and develops, with dusty weather in the region near western Inner Mongolia. The ground-level cold high-pressure region is located in central Xinjiang, with a central value of 1032.5 hPa. The ground-level cold front behind the Mongolian cyclone is located in western Inner Mongolia, with a central value of 995 hPa. There is a variable pressure gradient near the Mongolian cyclone, and windy and dusty weather occurs in central and western Inner Mongolia. The main propagation path of SDSs is westward and northwestward, the main impact system for the Mongolian cyclone and cold front. SDSs originate in western Inner Mongolia or southern Xinjiang and Mongolia, and they are guided by a northwesterly or westerly airflow, mainly affecting northwest and north China.
The number of days with SDSs under the T5 circulation type is 39, accounting for 20.41% of the total number of this type. At 500 hPa, the trough line is located in the northern region of Lake Balkhash and the high-pressure ridge extends from Lake Balkhash to near Lake Baikal while tilting to the northeast, with a strong northwesterly airflow in front of the ridge. The ground-level cold high-pressure region is located in Mongolia, and the warm low-pressure region is located in South Xinjiang–Ningxia. The cold front is located from the center of northeastern Xinjiang to Inner Mongolia. The ground-level warm low-pressure region blocks the movement of the ground-level cold high-pressure region, which makes the pressure gradient before and after the cold front increase rapidly, triggering SDSs in the northern South Xinjiang basin, western Inner Mongolia, central and western Gansu, and northern Ningxia. The main propagation path of this type of SDS weather is westward and northwestward. The main impact of the system for the ground-level thermal low-pressure region and cold front, via the northwesterly and westerly airflows, mainly affects China’s southern basins, western Inner Mongolia, central and western Gansu, northern Ningxia, and other places.
The number of days with SDSs under the T8 circulation type is 80, accounting for 31.37% of the total number of this type. At 500 hPa, the ridge is located in northern Xinjiang, and there is a transverse trough in the Altai Mountains. Mongolia to northern China is mostly controlled by a northwesterly airflow in front of the ridge. The upper part of the frontal area is located in western Mongolia and northwestern Inner Mongolia, and there is strong cold advection near the frontal area. Western Inner Mongolia is under a northwesterly airflow behind the trough. The temperature trough is located in western Inner Mongolia and lags behind the height trough. The upper trough continues to deepen and develop, and the upper front presses south, causing an outbreak of strong cold air that leads to strong dust weather. The surface cold front is located in the western Hetao region. North Gansu and northwest Inner Mongolia are affected by the northwesterly gale behind the cold front, resulting in strong dust weather. The main propagation path of this type of dust weather is northwest, and the main influencing system is the cold front. Dust weather generally originates in western Inner Mongolia or Mongolia. The main body of dust is under the guidance of the northwesterly airflow, from the northwest to the southeast direction of movement or, alternatively, first to a southeasterly direction of movement and then, with contraction of the cyclone northward, to a northeasterly direction of movement, mainly affecting northwest and north China.

3.2.2. Variation of the Dominant Circulation Pattern over Time

We analyzed the changes in the number of SDS days in the five dominant circulation patterns over time. Figure 7 shows that the total number of SDS days influenced by the dominant circulation pattern was relatively frequent during 2000–2010, but decreased significantly during 2011–2018, before increasing again during 2019–2020. During 2000–2004, the T8 circulation type occurred with the highest frequency as the main influencing circulation; the T3, T5, and T1 circulation types occurred with the least frequency and the T2 circulation type had the least influence. In other words, in the early 2000s, China was mainly affected by cold fronts, and the main propagation path was northwesterly. This type of dust weather usually has a high intensity, a wide area of influence, a fast propagation speed, and has disastrous consequences.
From 2005 to 2010, the T3 and T8 circulation types dominated, followed by the T1 and T5 circulation types. The T2 circulation type had the least influence and was mainly influenced by the Mongolian cyclone and the cold front. From 2011–2015, the T1 circulation type was dominant; the T5, T8, and T3 circulation types were less important, and the T2 circulation type did not occur. This period was mainly influenced by a cold high-pressure region, the main propagation path was westward and northwest, and the overall frequency of SDSs decreased. From 2016 to 2020, SDSs were mainly influenced by the T3 circulation type; the T2, T5, and T8 circulation types were second, and the T1 circulation type did not occur. This period was mainly influenced by the Mongolian cyclone and cold front and the main propagation path for dust and sand was westerly. The strong dust and sandy weather were increased compared with 2011–2015. In summary, the number of SDS events in China and the configuration of the upper air and surface circulation types have a close relationship. Changes in the dominant circulation type in different years directly affect the frequency and propagation of SDSs in northern China in spring.

3.3. Results of Dominant SDS Circulation Patterns in 2021

Four SDS events occurred in China in spring 2021 (13–18 March, 27 March–1 April, 14–16 April, and 6 May–8 May) for a total of 18 days, showing a significant increase from the eight days in 2020. The Lamb–Jenkinson and k-means clustering methods were used to classify the main circulation patterns in these four SDS events. Figure 8 shows the frequency of the 27 circulation types in the southern Xinjiang basin (37–42° N, 76–90° E), western Inner Mongolia and southern Mongolia (38–45° N, 97–110° E), and central Inner Mongolia (42–45° N, 114–118° E). The results show that the most important circulation types in the southern Xinjiang basin were C (33.33%), CW (16.67%), SW (16.67%), W (11.11%), and AE (11.11%). The C, CW, and SW circulation types favor SDSs. The most important circulation types in western Inner Mongolia and southern Mongolia are C (27.77%), CE (11.11%), E (11.11%), and CNW (11.11%). Among these, the C, CE, and E types are more likely to cause SDSs. The most important circulation types in central Inner Mongolia are C (33.33%), C (16.67%), CN (11.11%), and E (11.11%). Among these, the C, N, and CN types are more likely to cause SDSs.
We analyzed the typical circulation in the upper atmosphere, and at the surface, during four SDS events in 2021 (Figure 9 and Figure 10). Shortwave trough activity was common at 500 hPa; western Mongolia was behind the shortwave trough, and dust was transported to China under the guidance of the northwesterly airflow. Strong cold advection intruded into central and western Inner Mongolia, and the temperature trough was behind the height trough. The upper trough deepened and developed, and dust weather broke out. Mongolian cyclones and cold fronts developed and affected northern China.
We compared the physical fields of four SDS events with the centroid of each major circulation type and found that they were closest to the centroid of the T3 circulation type. The Lamb–Jenkinson scheme showed that cyclonic circulation was dominant in all regions. The SDS events in 2021 were therefore mainly influenced by both Mongolian cyclones and the surface cold front. The main propagation path was westerly and northwesterly. The SDSs originated in Mongolia and were guided by the westerly and northwesterly air flows. The main body of dust moved to the east, affecting northwest and north China and the west and south of northeast China.

4. Conclusions

We used two objective circulation classification methods (the Lamb–Jenkinson scheme and the k-means clustering method) to analyze the dominant circulation patterns in northern China during spring 2000–2020. We analyzed the spatial and temporal variations of the circulation patterns at high altitudes and at ground level for SDS events. We then verified and analyzed the SDS events in 2021 by combining these two methods. We obtained the following conclusions:
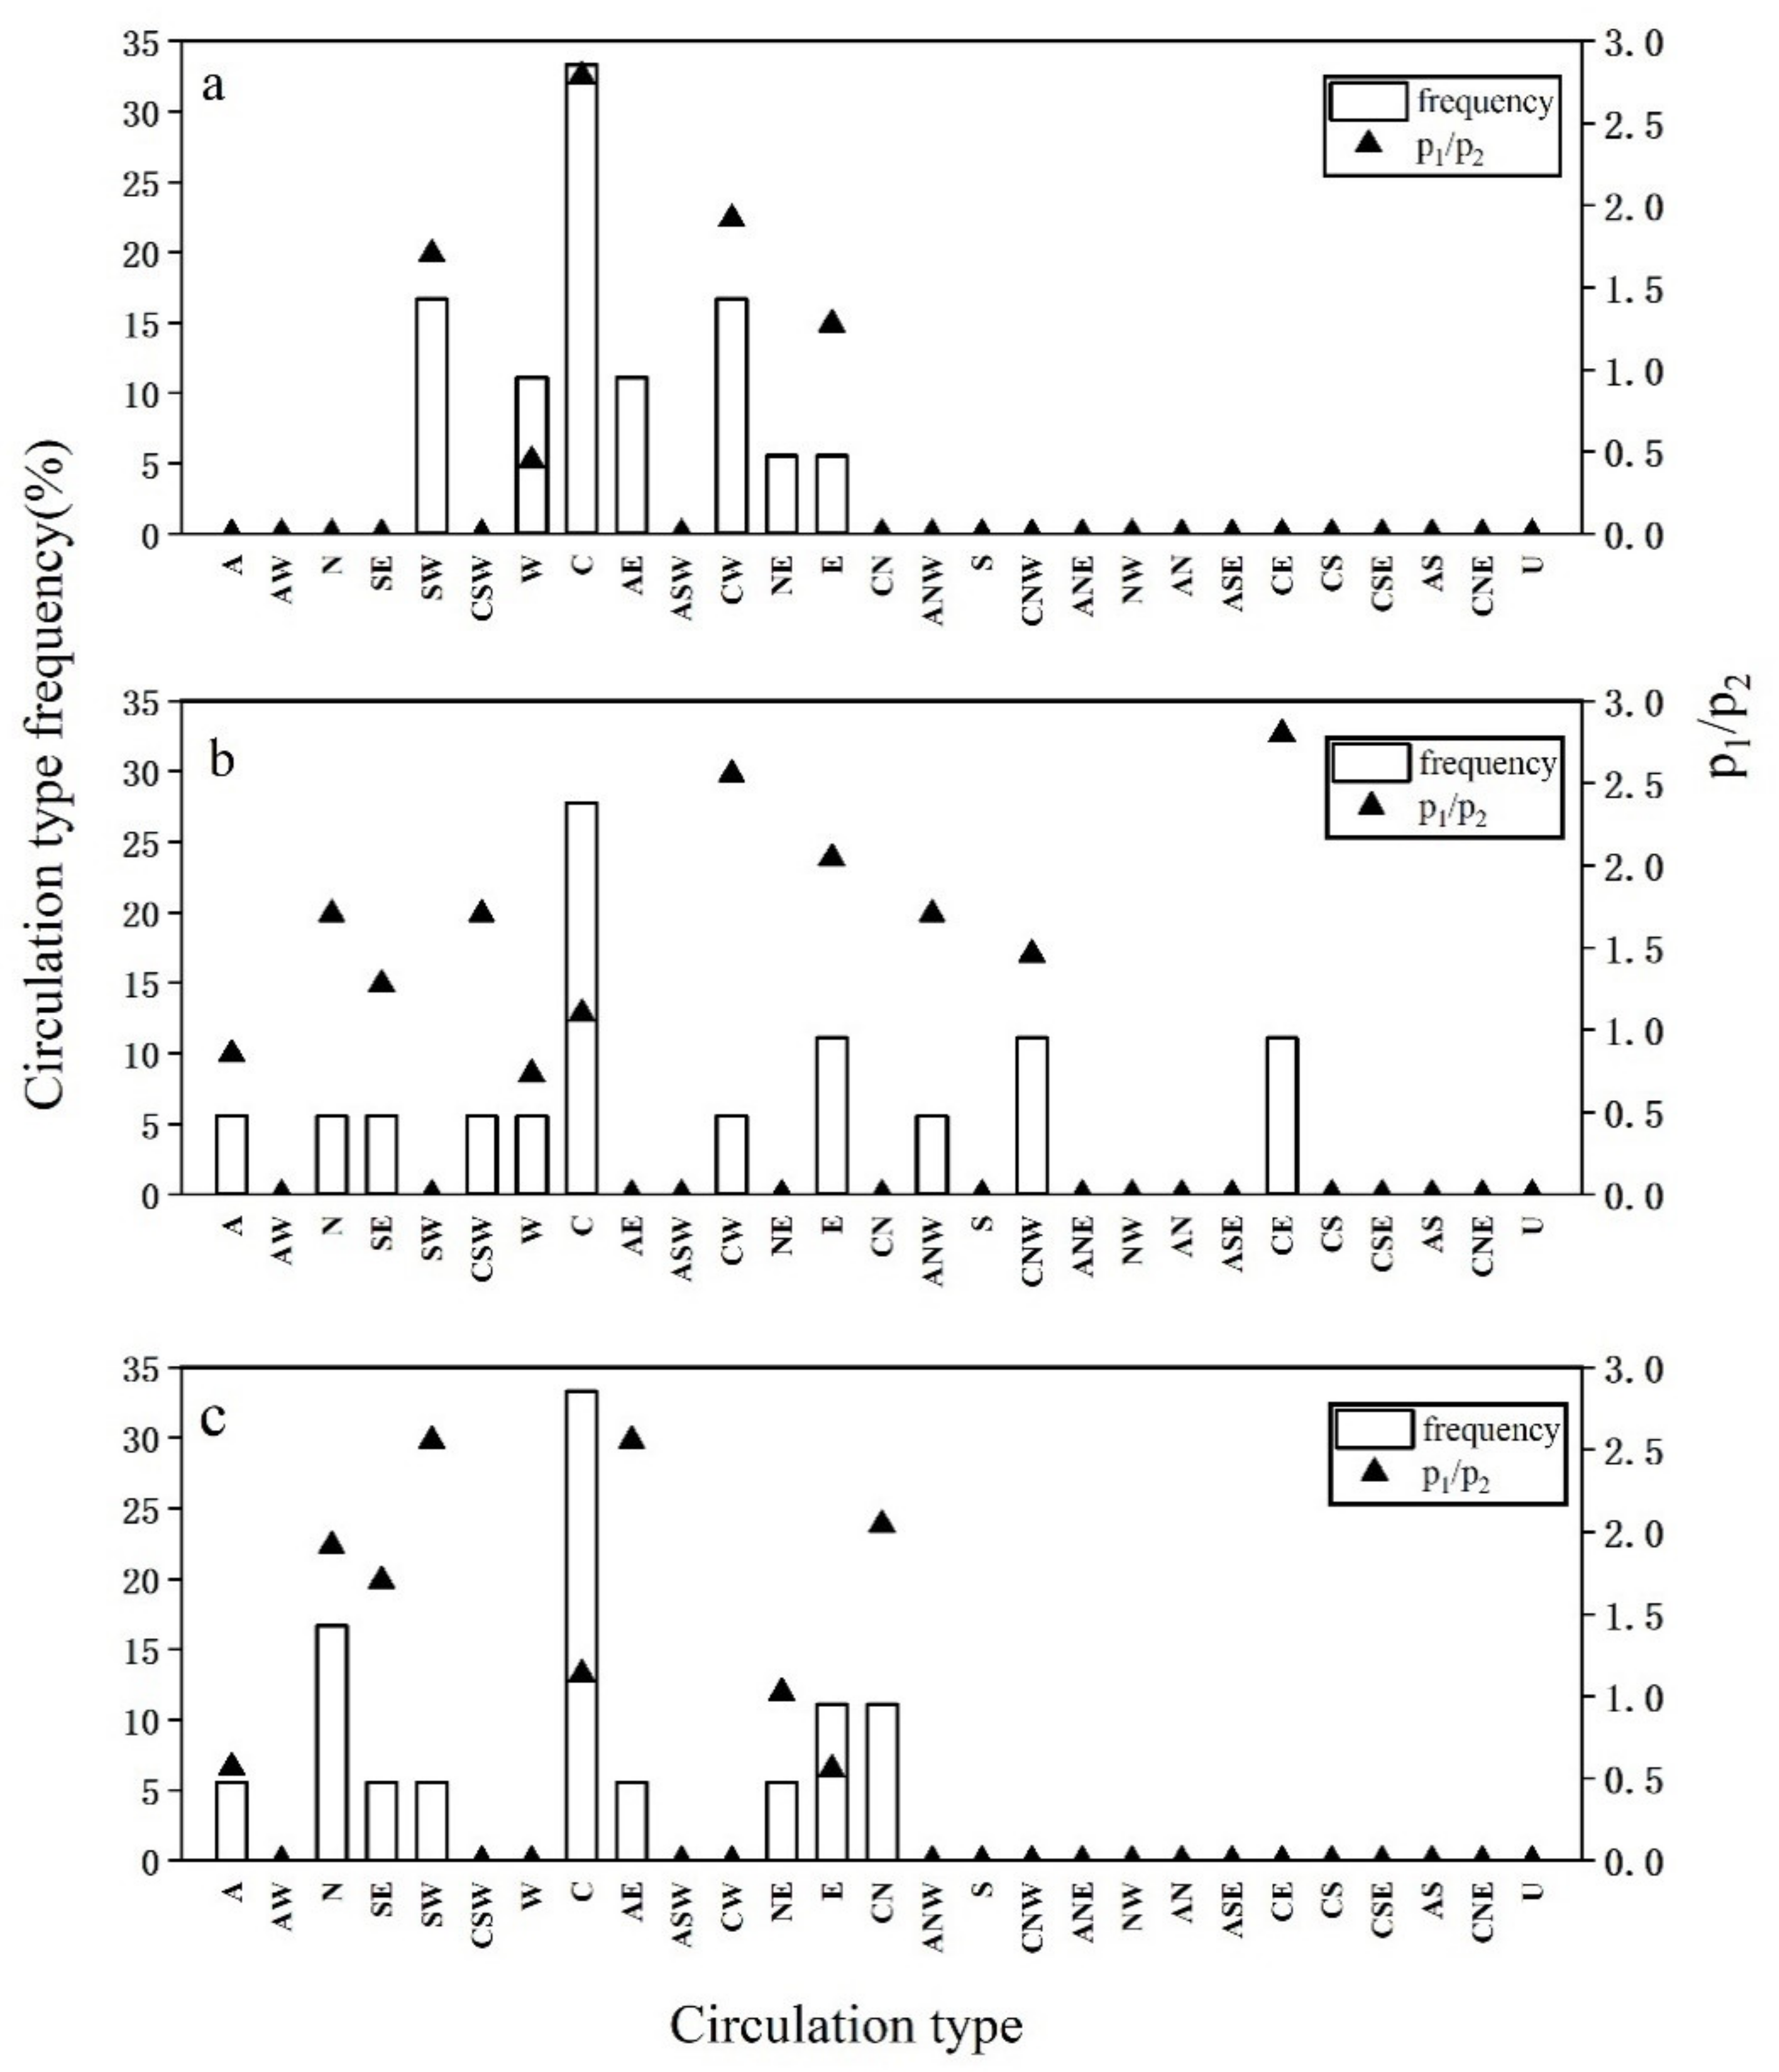
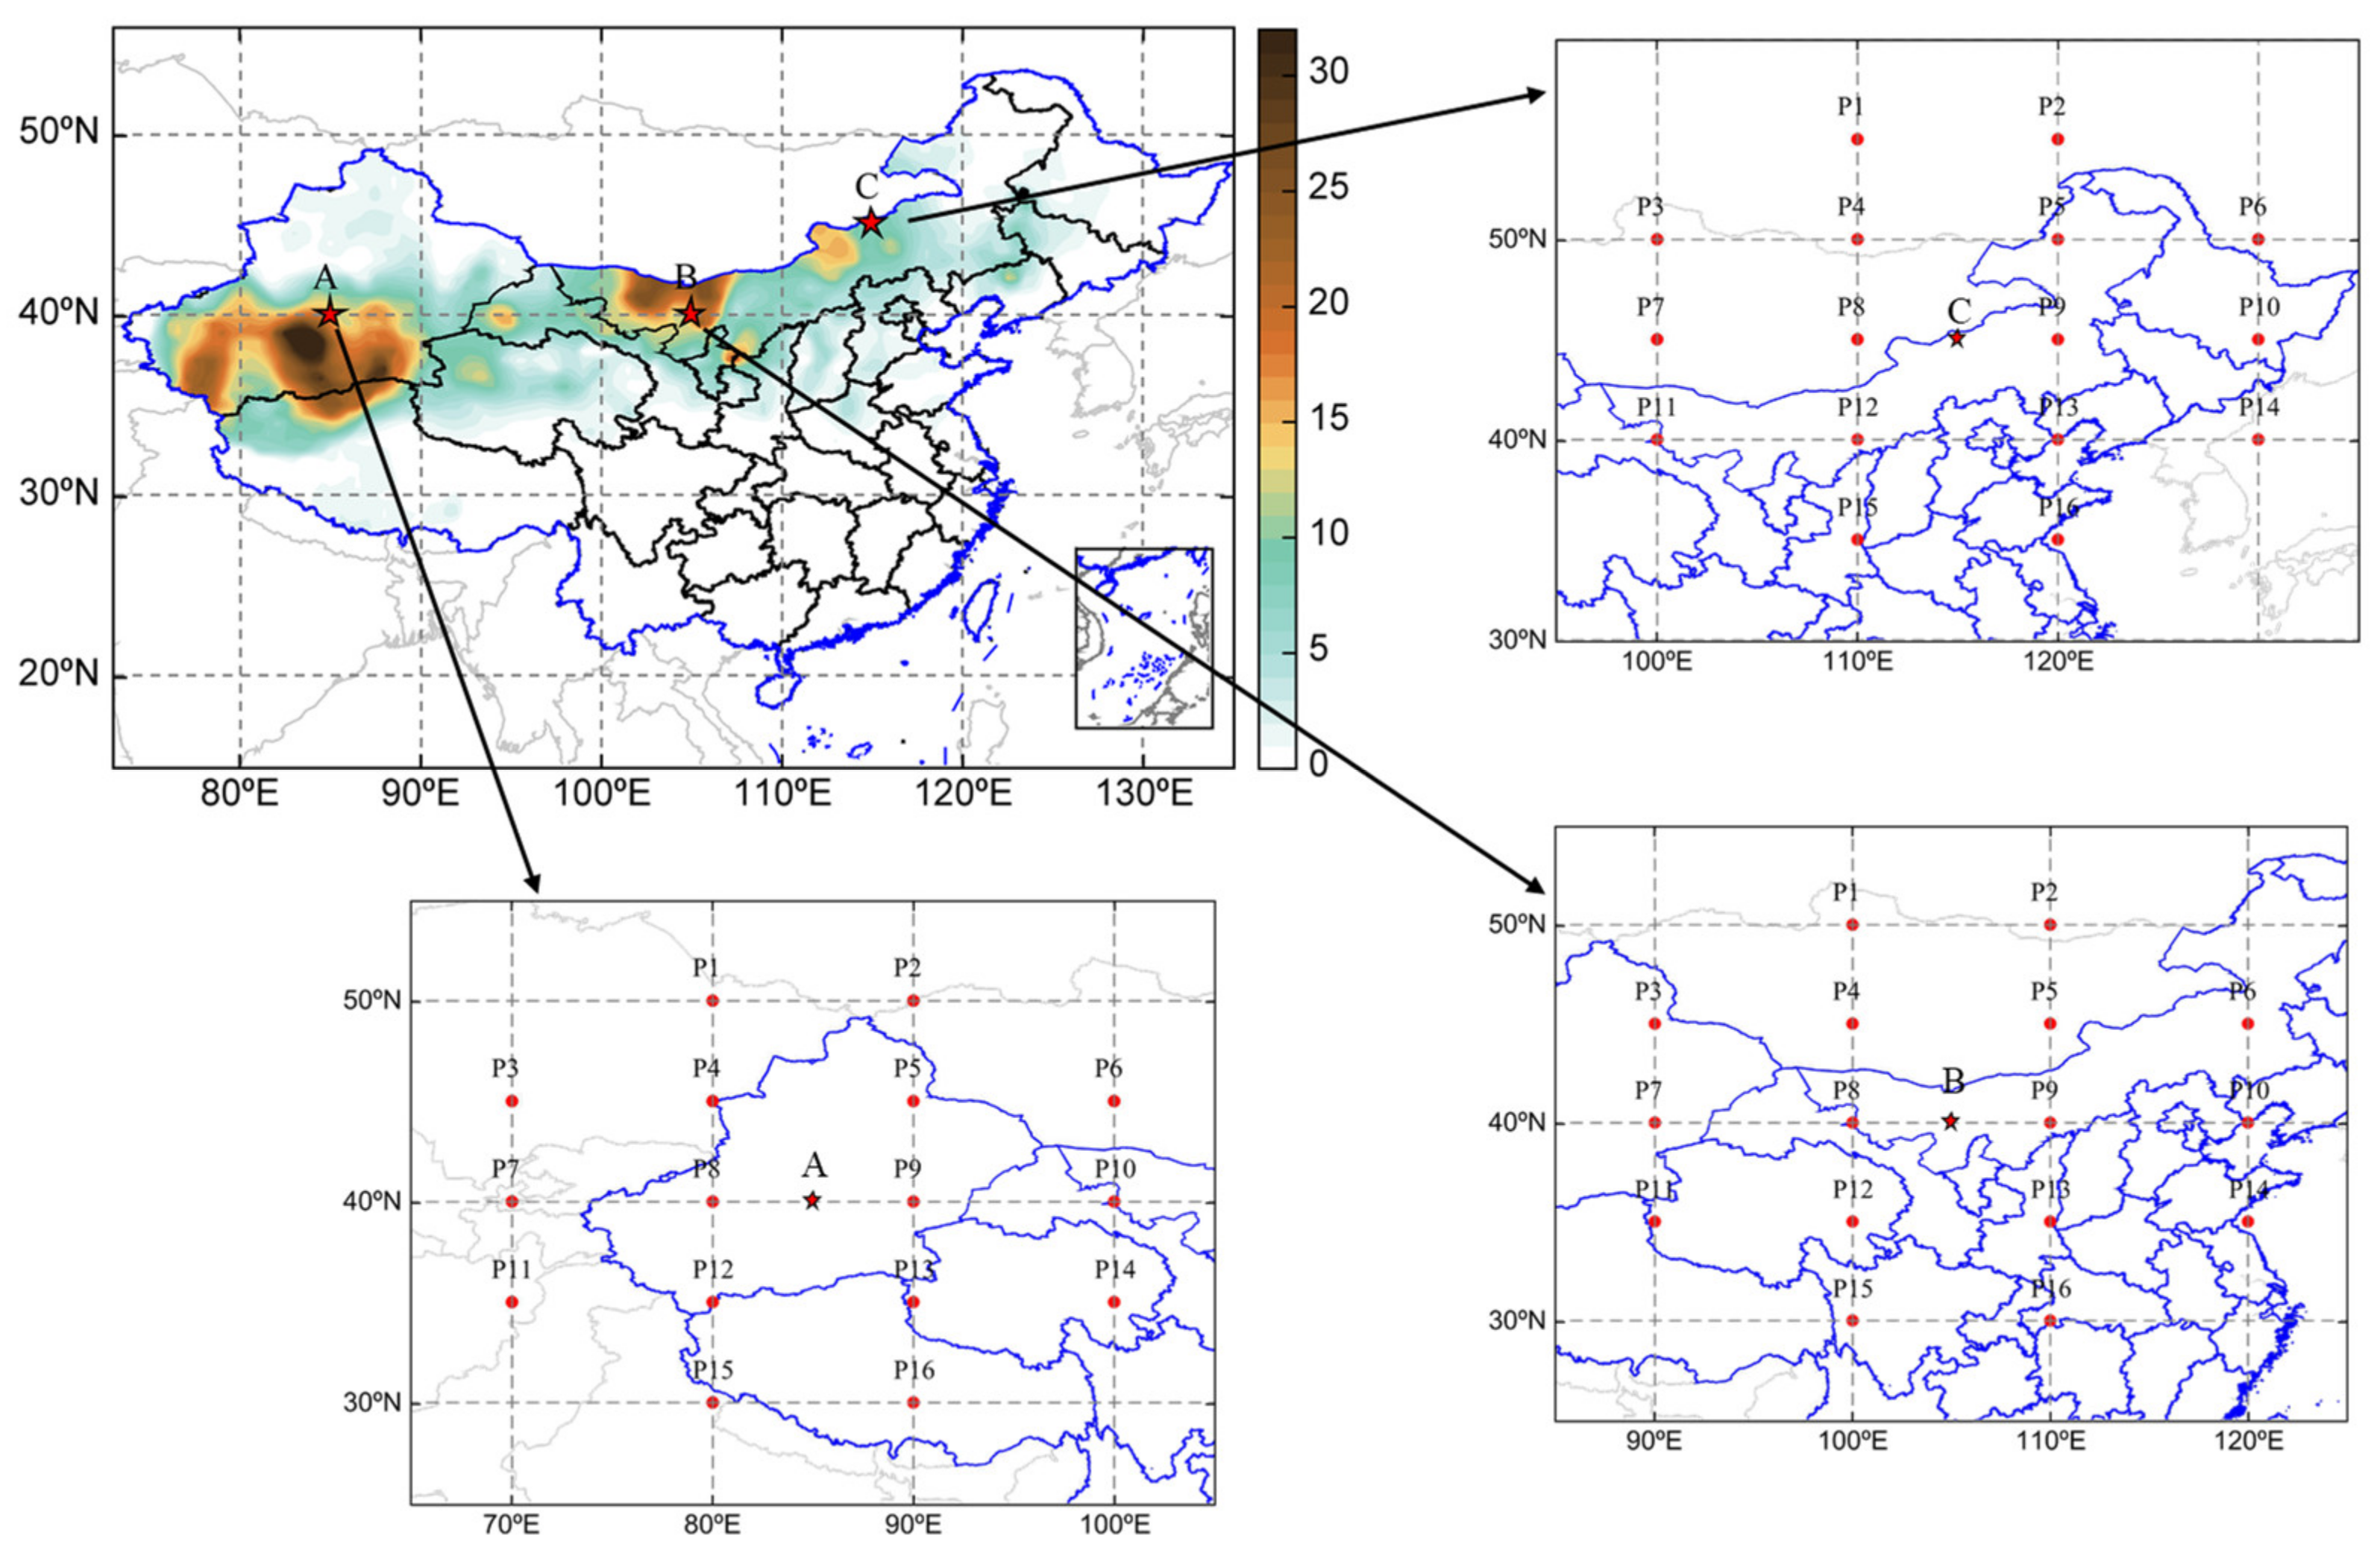
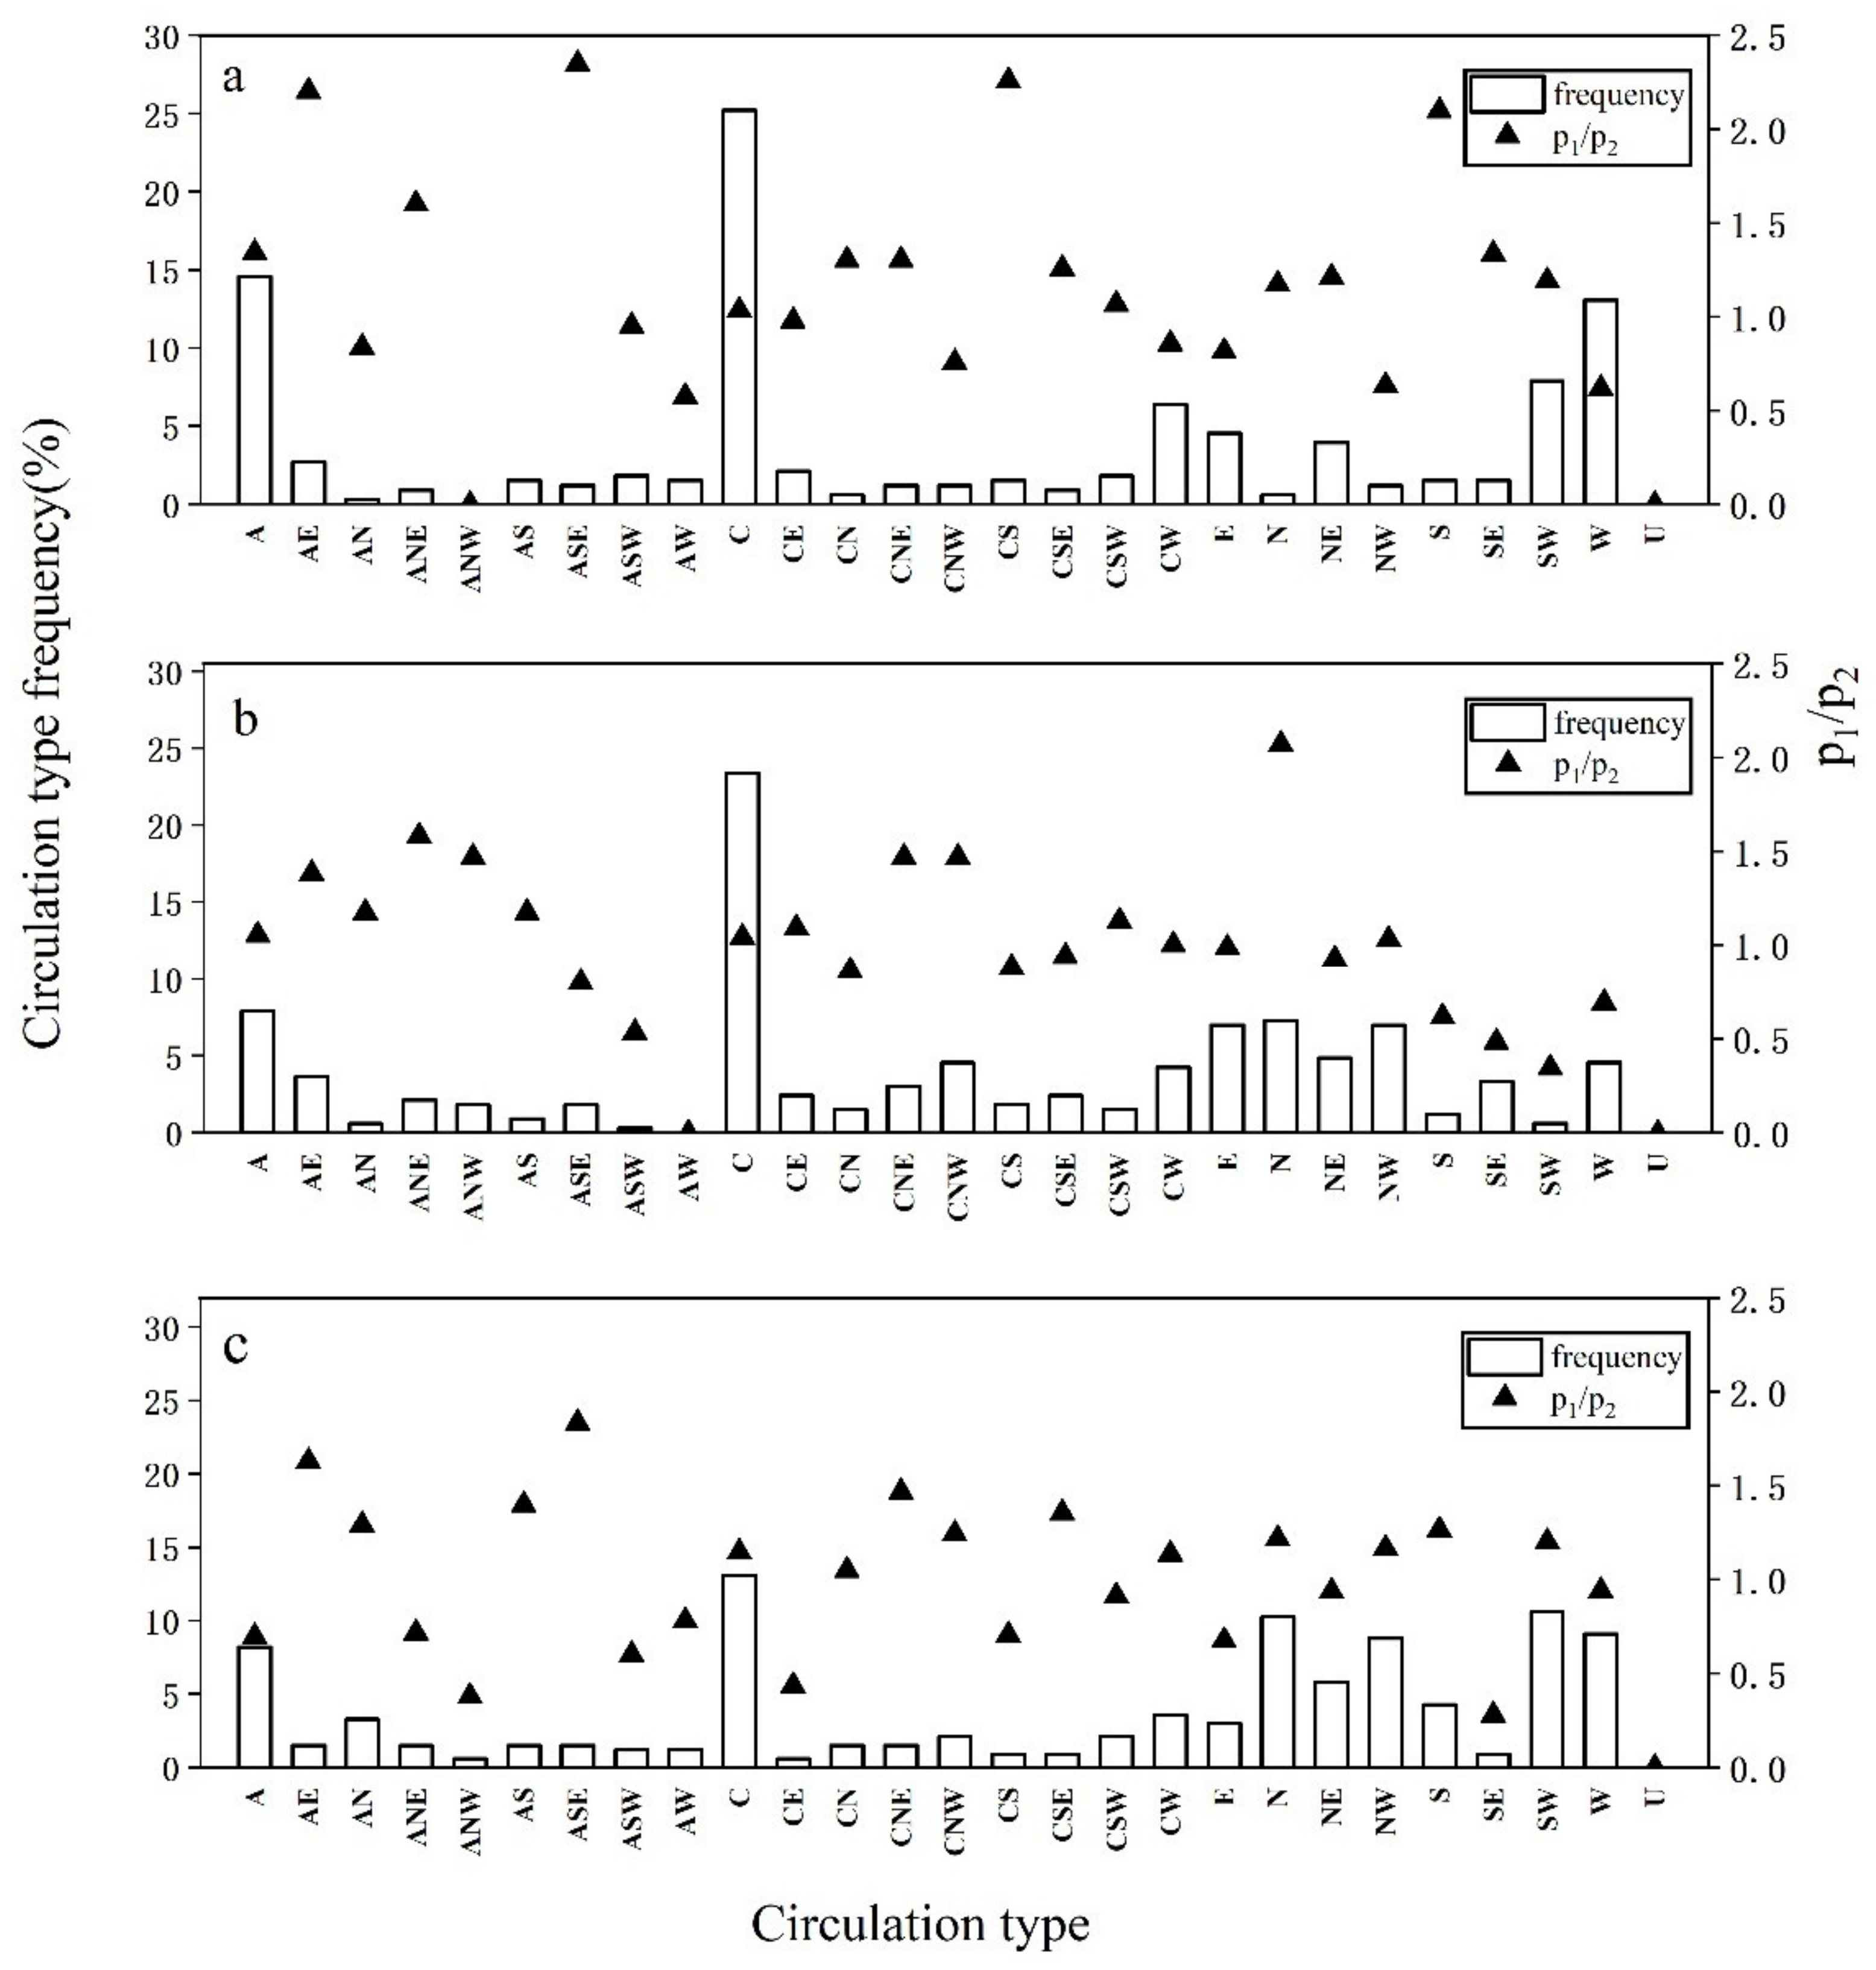
  • The Lamb–Jenkinson scheme was used to classify the circulation patterns in the southern Xinjiang basin, western Inner Mongolia and southern Mongolia, and the center of Inner Mongolia. The results showed that the main circulation patterns in the southern Xinjiang basin were the W, A, C, SW, and CW types, whereas the circulation patterns favoring SDSs were the SW, A, and C types. The main circulation patterns in western Inner Mongolia and southern Mongolia were the N, NW, E, A, and C types. The circulation patterns in these regions that favored SDSs were the NW, N, A, and C types. The main circulation patterns in Inner Mongolia were the SW, W, NW, A, and C types, and the circulation patterns that favored SDSs were the SW, N, SW, and A types.
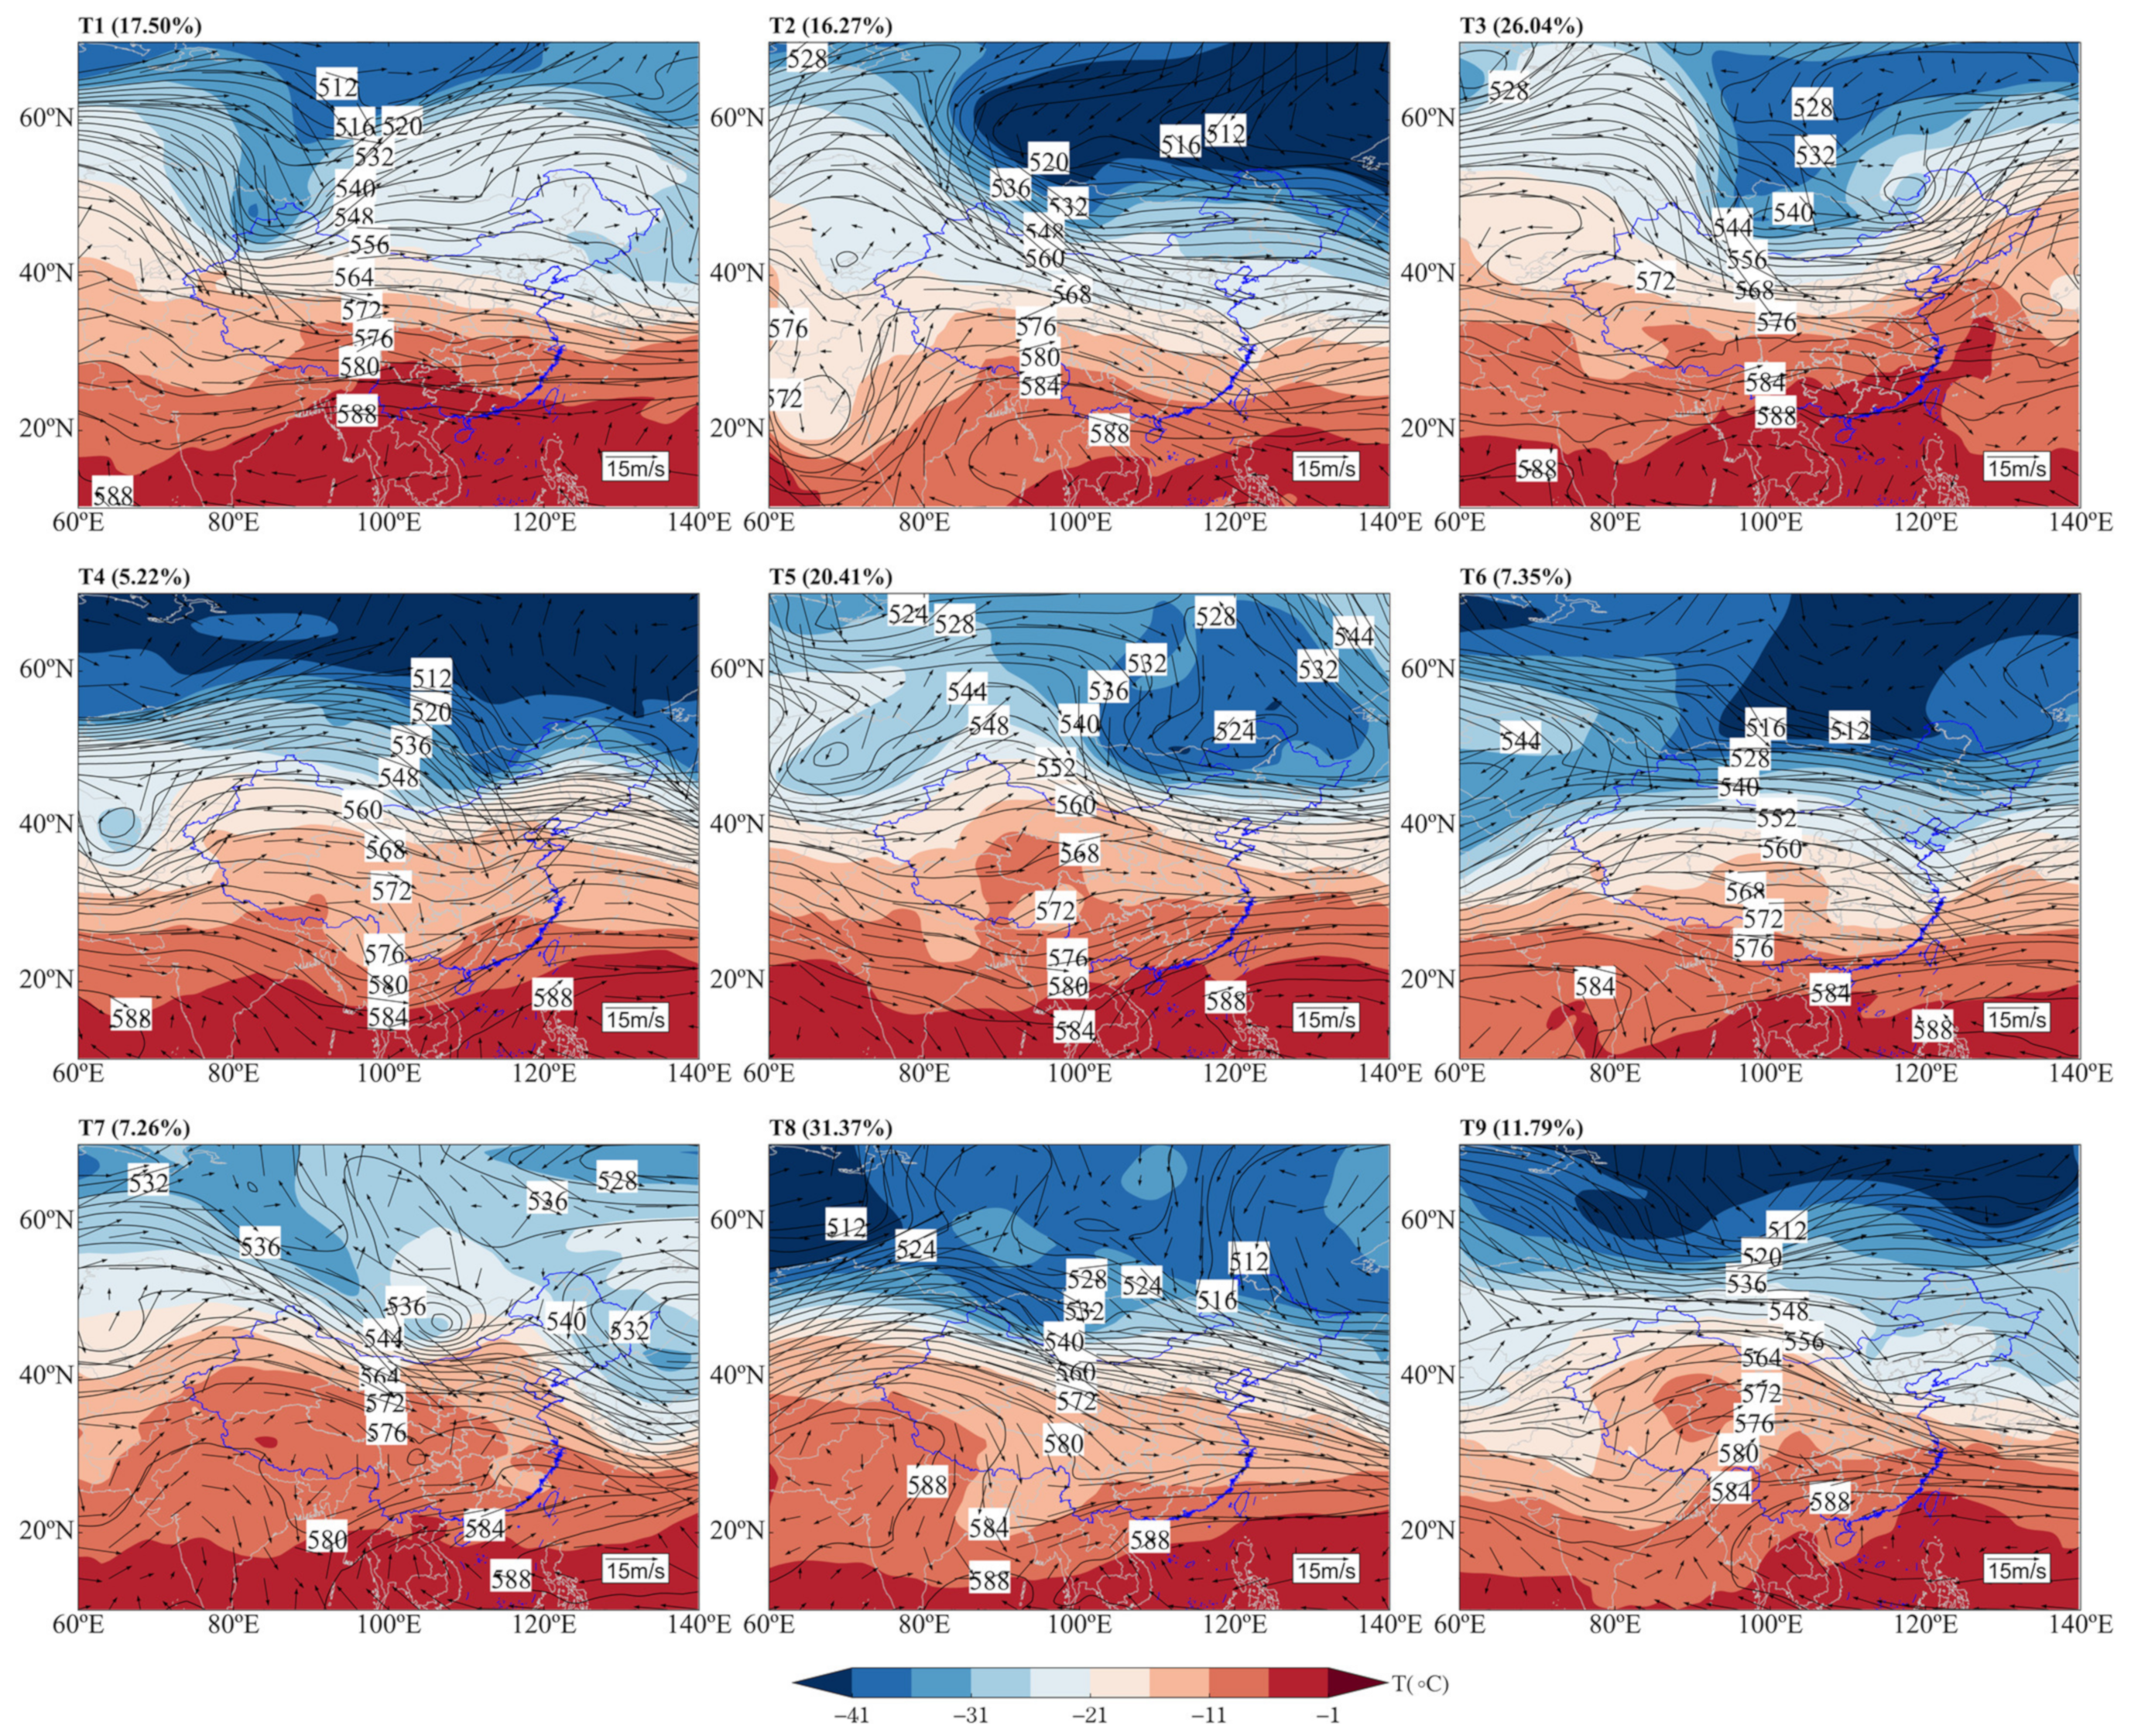
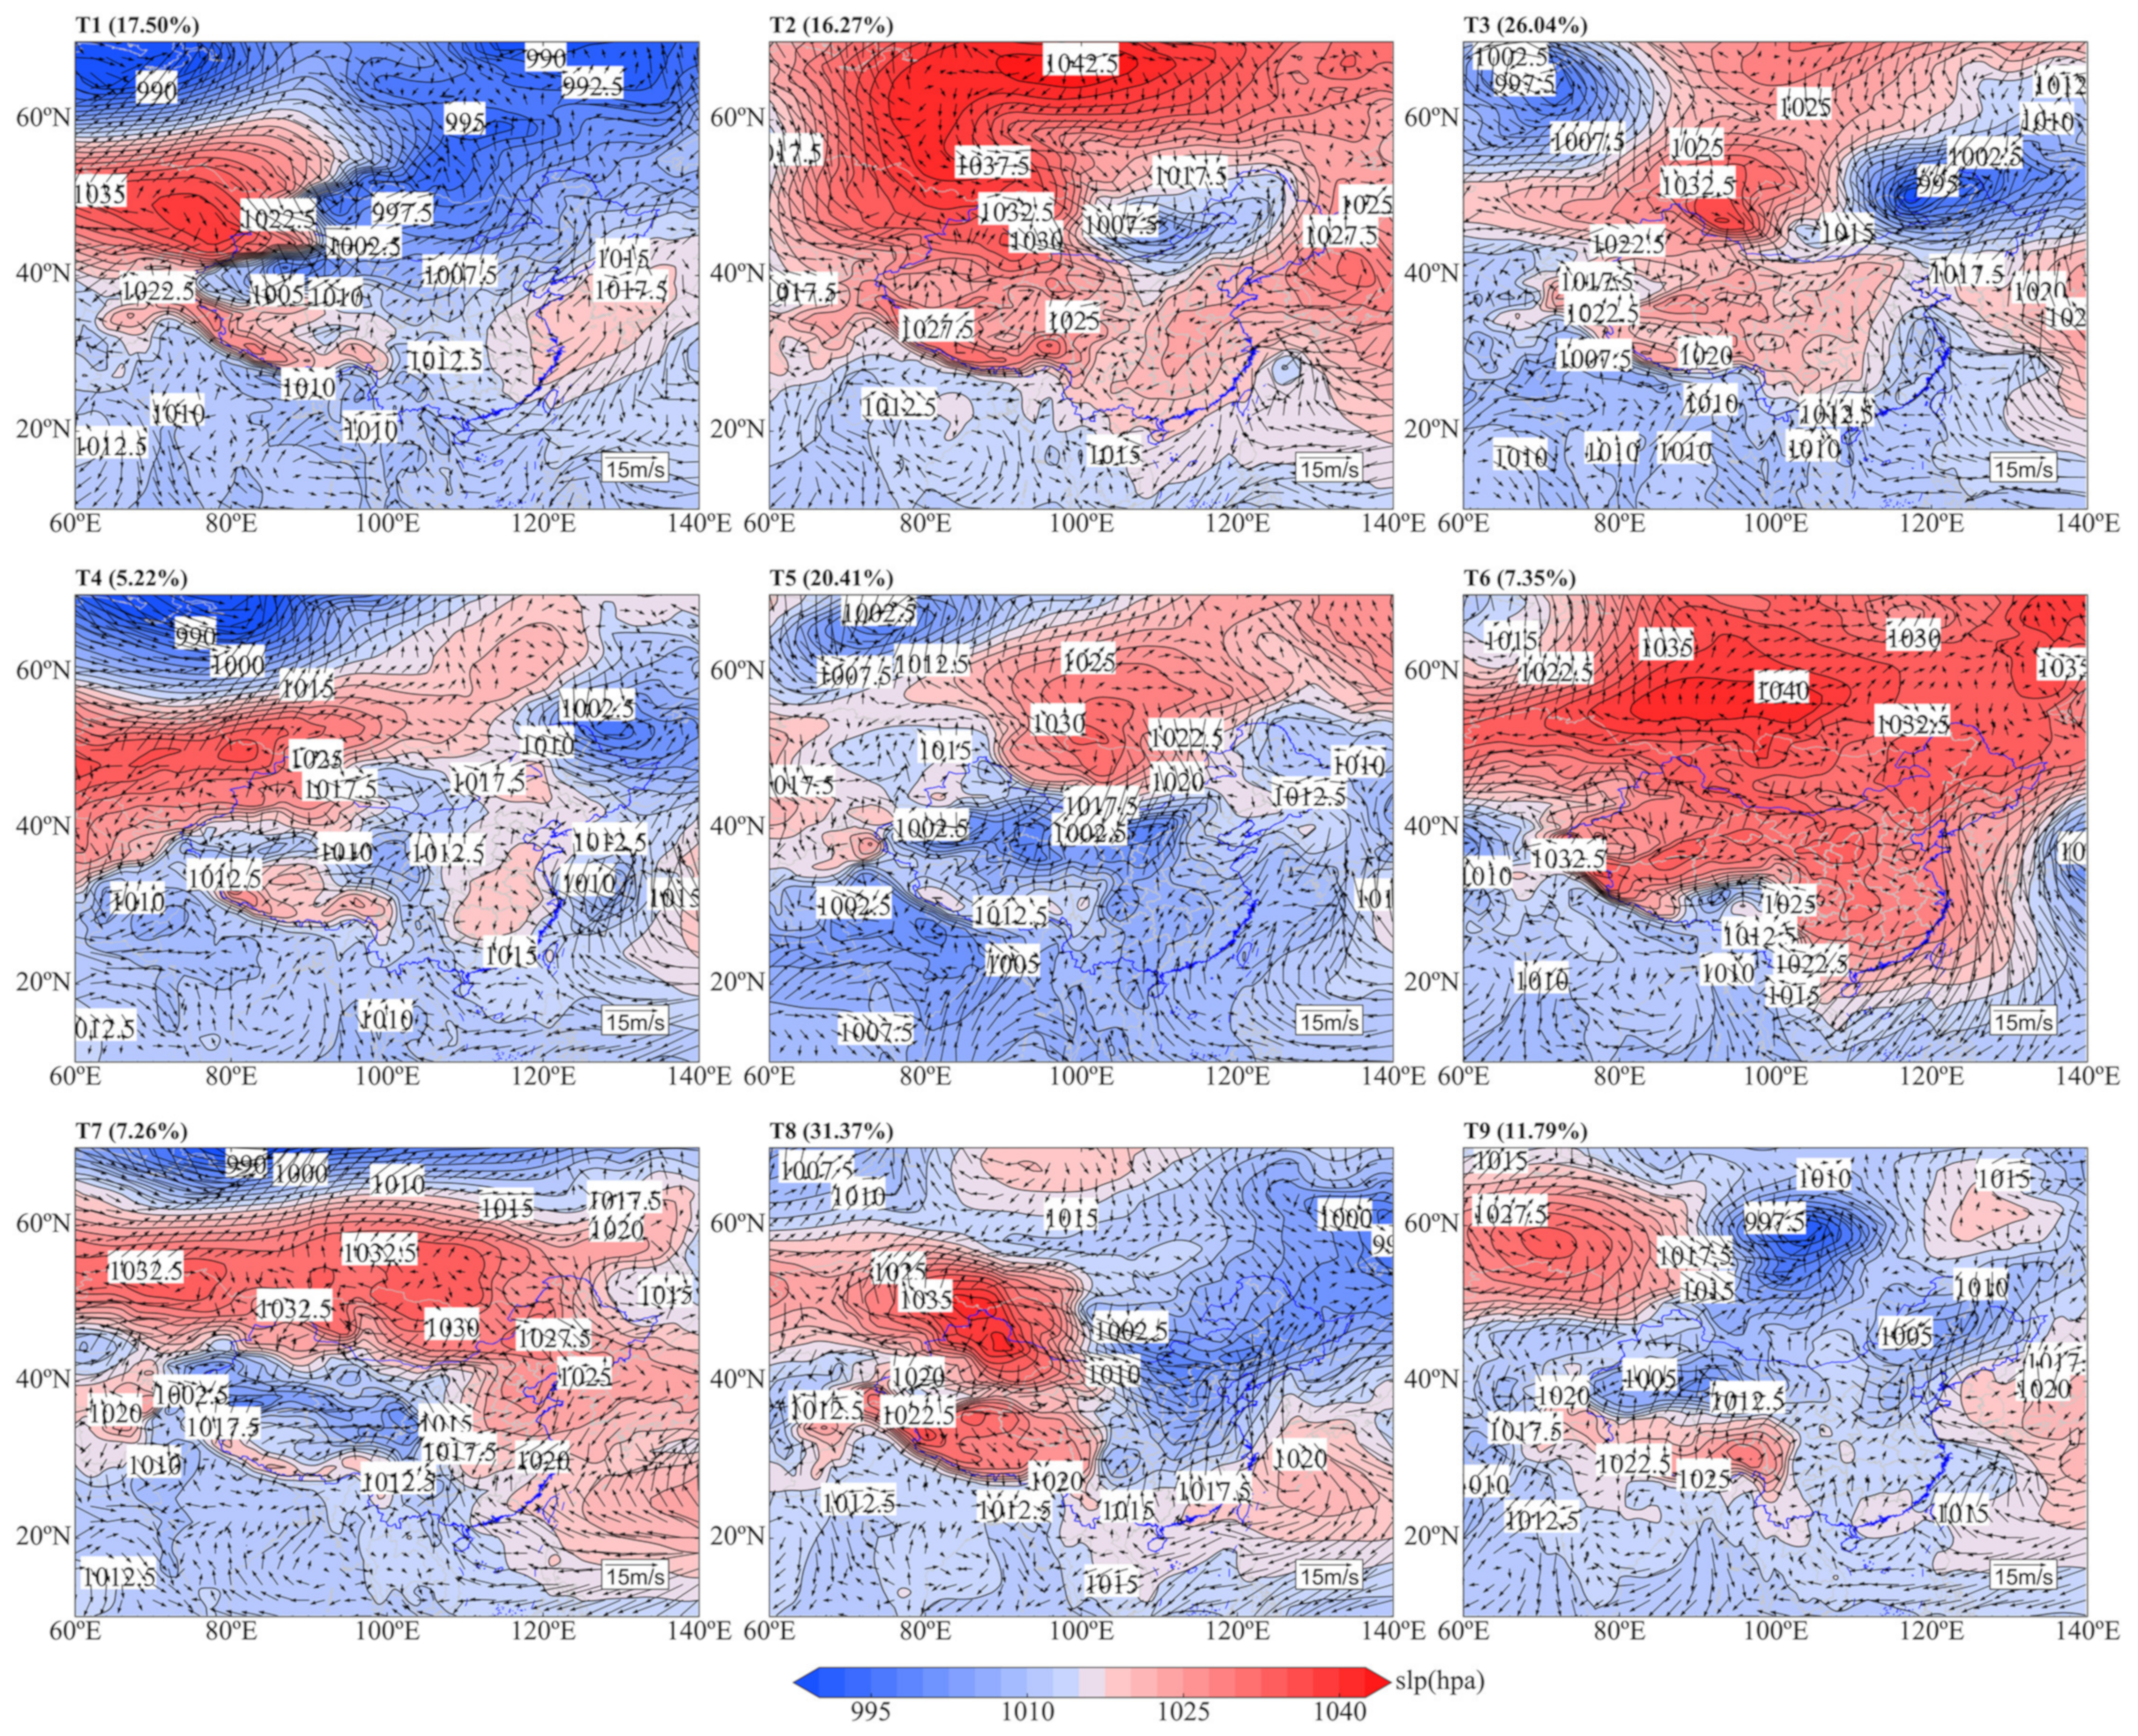
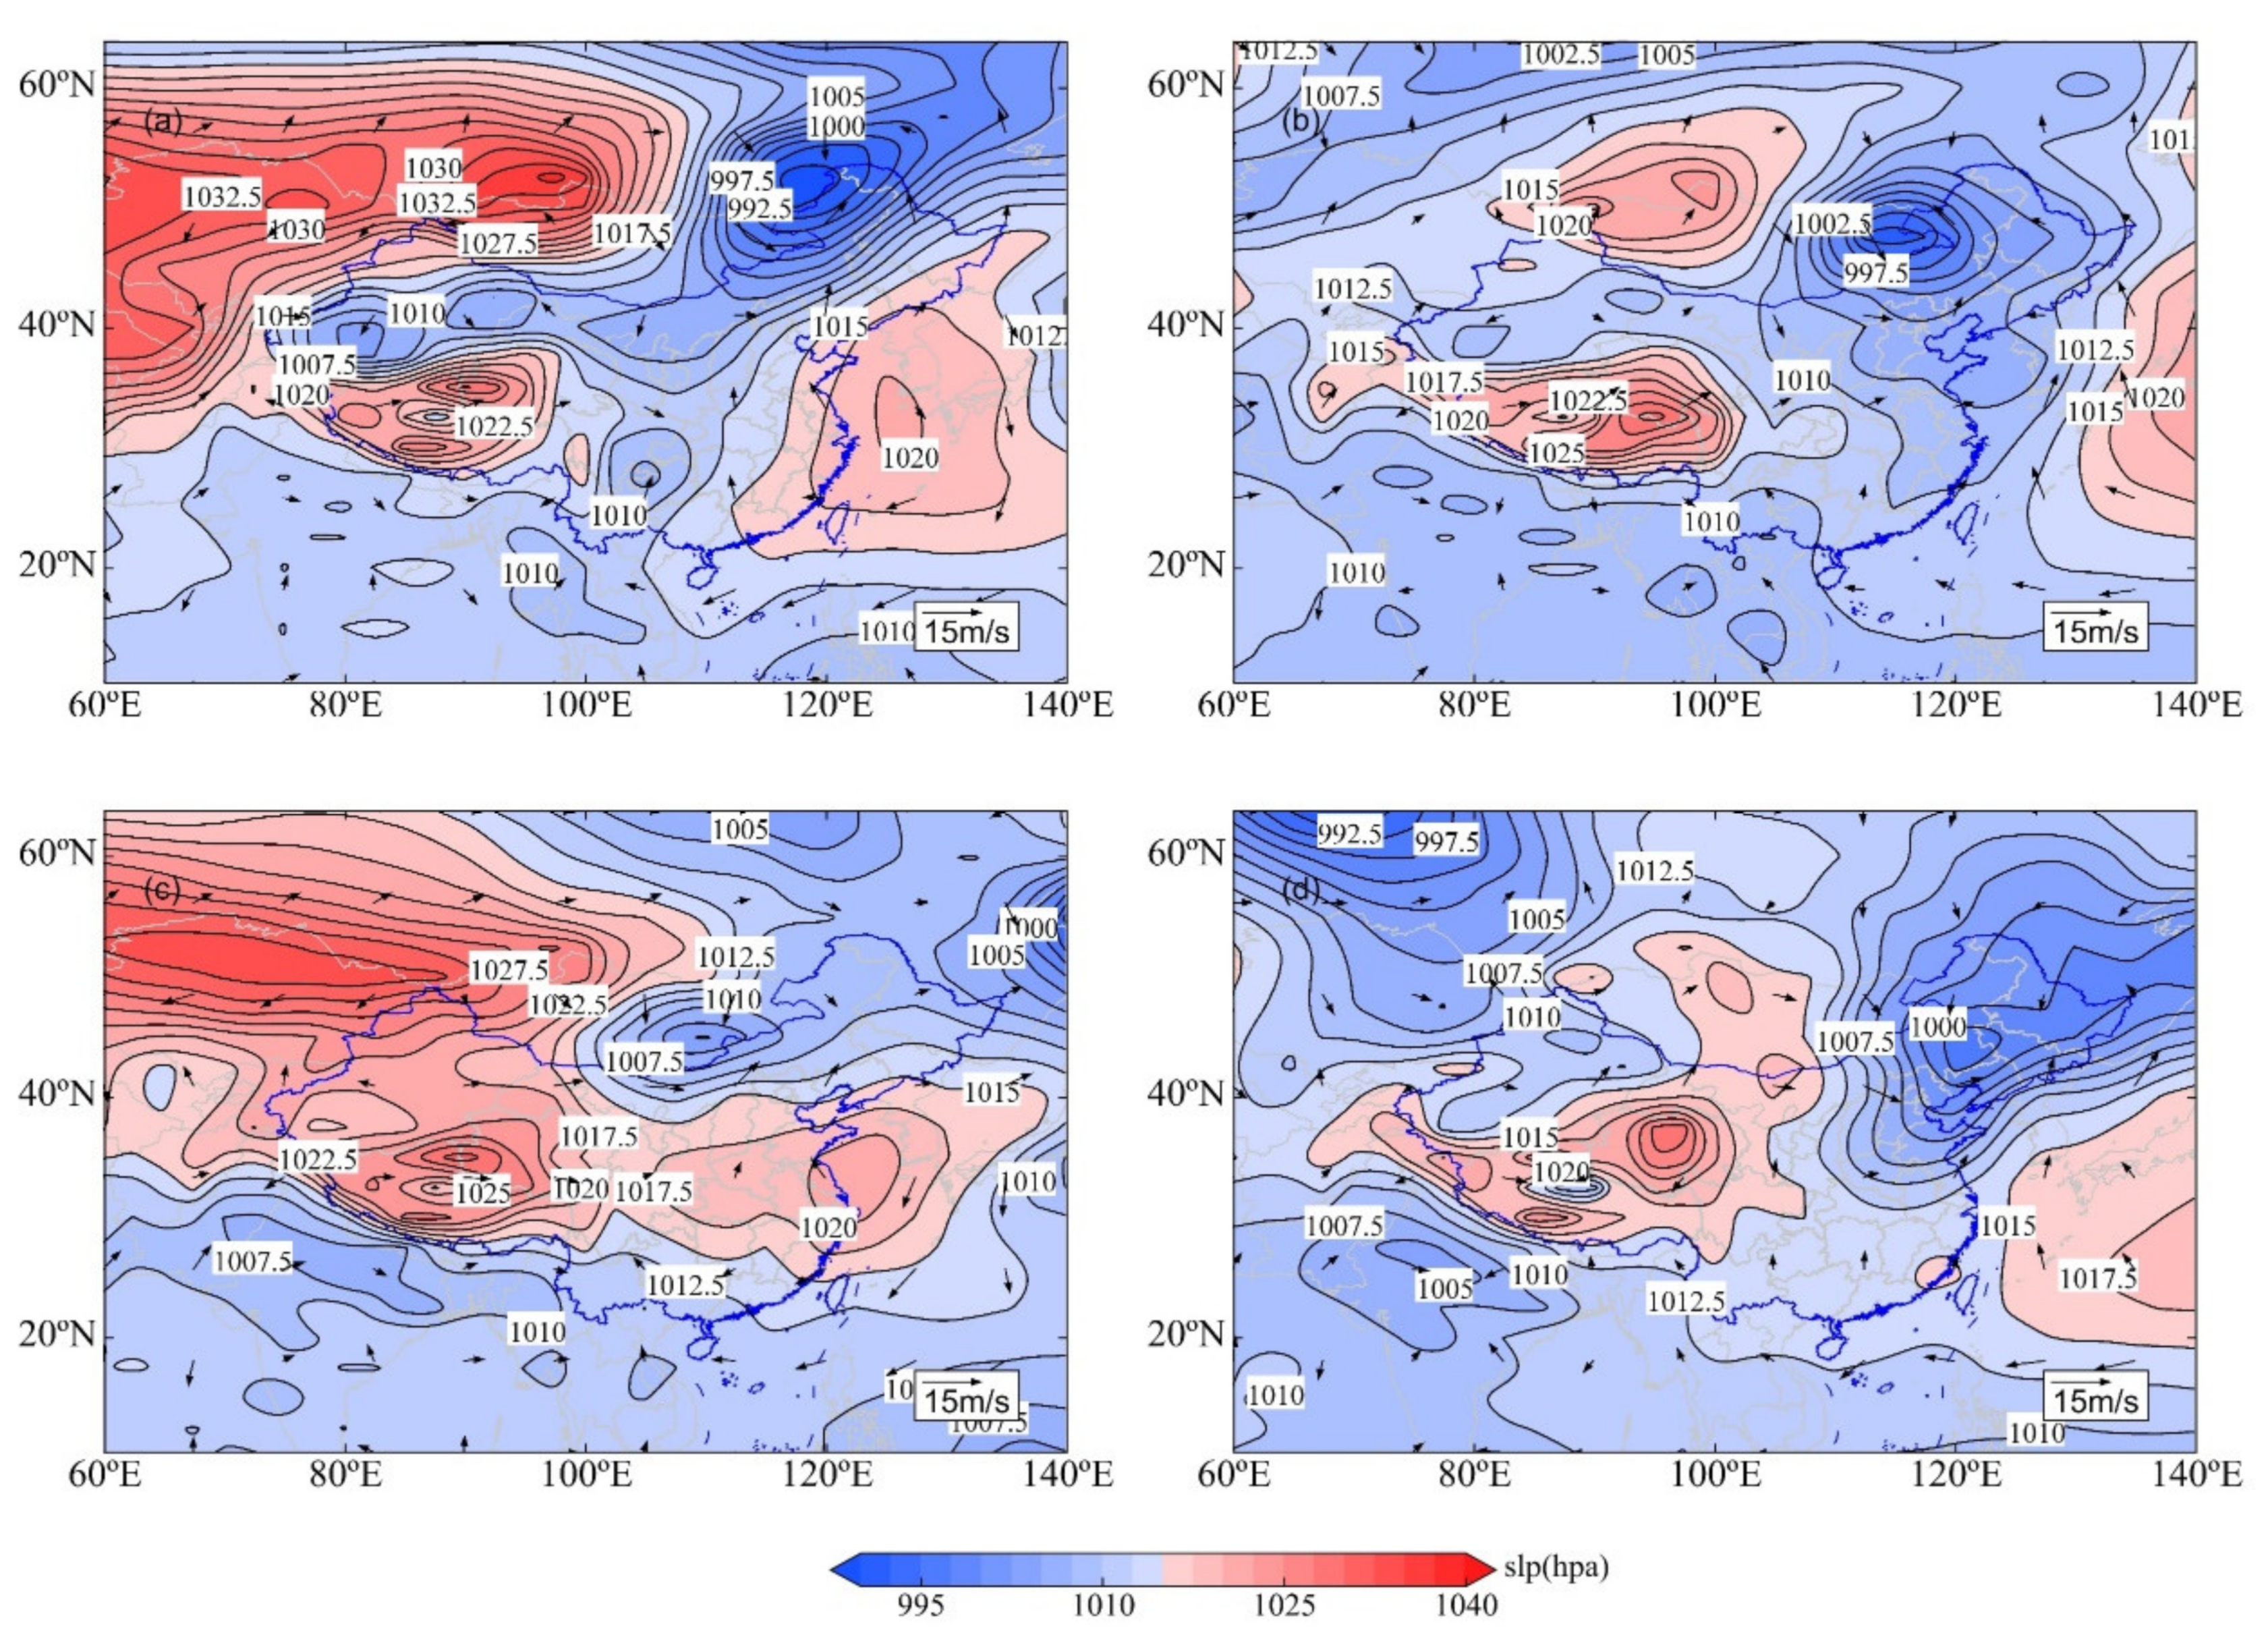
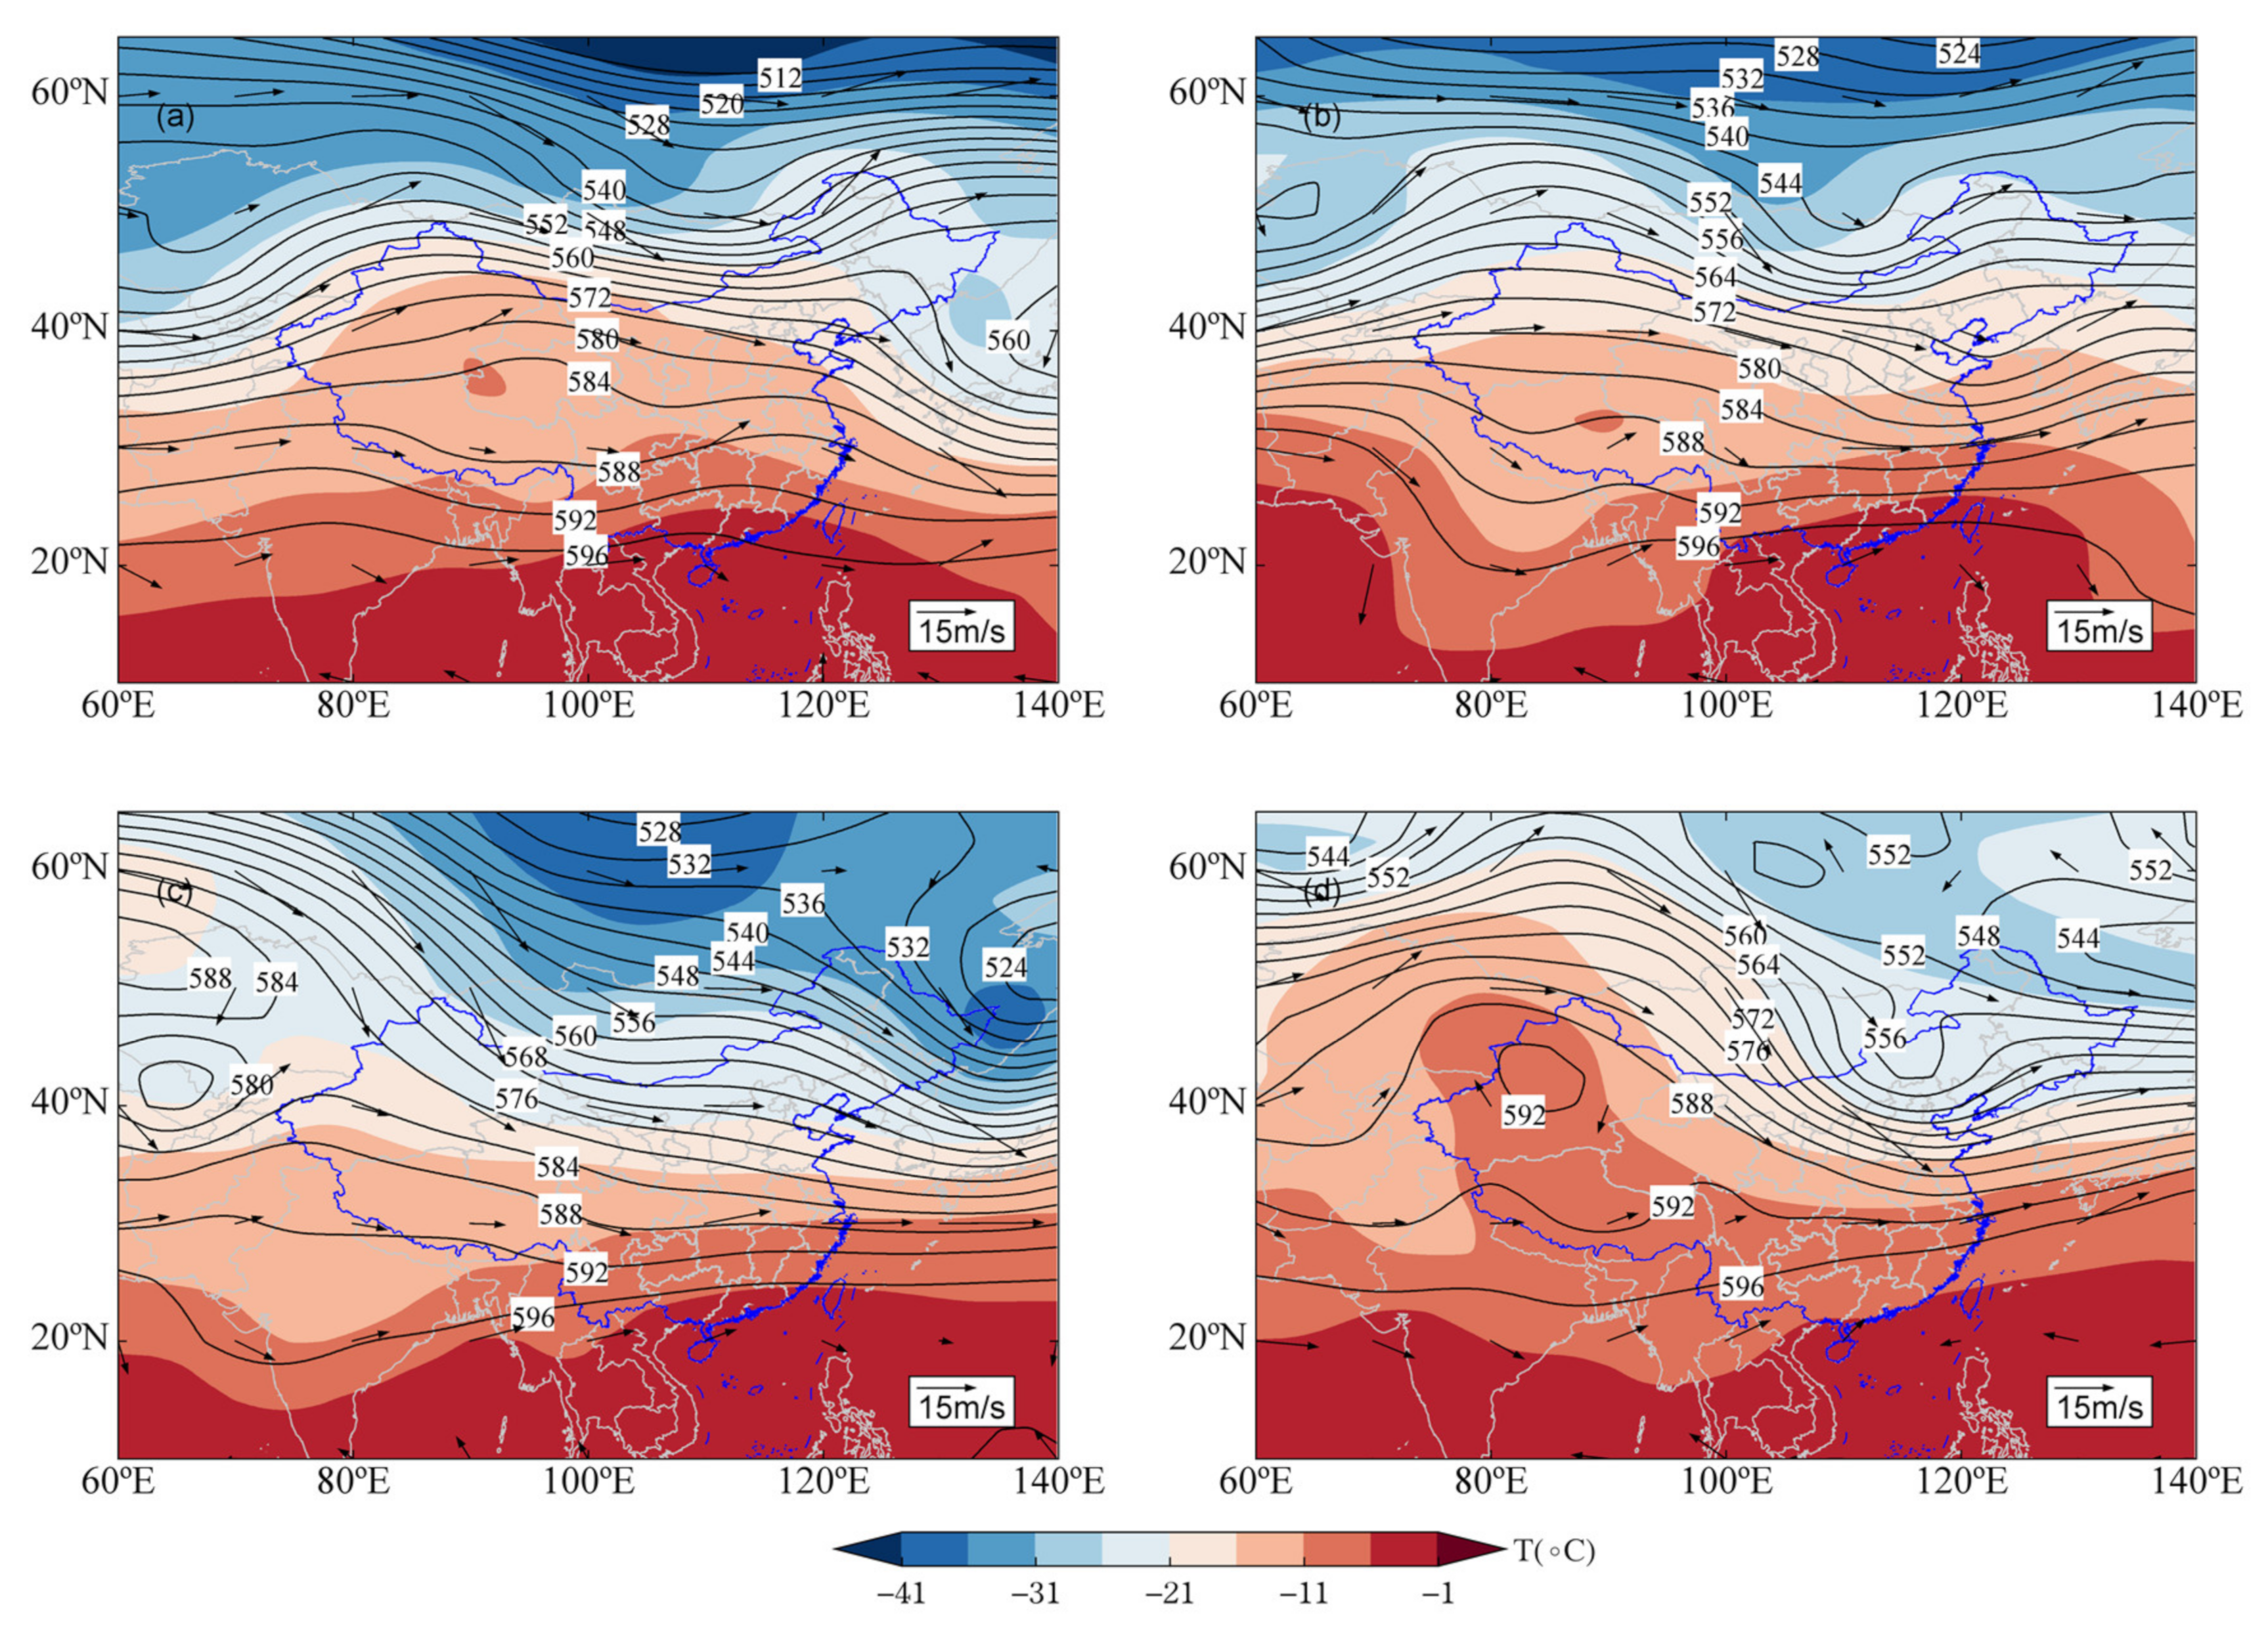
  • The k-means clustering method was used to calculate the spring SLP, 10 m wind, and height, wind and, temperature fields at 500 hPa from 2000 to 2020 to determine nine types of circulation patterns. The T1, T2, T3, T5, and T8 patterns were the dominant circulation types with occurrence probabilities of 17.50, 16.27, 26.04, 20.41, and 31.37%. Analysis of the five circulation types showed that the influencing system of the T1 circulation pattern was an area of cold high pressure and a cold front at ground level; the main propagation path of SDSs was westerly and northwesterly. The main influencing system for the T2 circulation pattern was the Mongolian cyclone, and the main propagation path of this type of SDS was northwesterly. The main influencing system of the T3 circulation type was the Mongolian cyclone and cold front, and the main propagation path was westerly and northwesterly. The main influencing system for the T5 circulation pattern was the ground-level thermal low-pressure region and cold front, and the main propagation path was westerly and northwesterly. The main influencing system for the T8 circulation pattern was the cold front, and the main propagation path of this type of dusty weather was northwesterly.
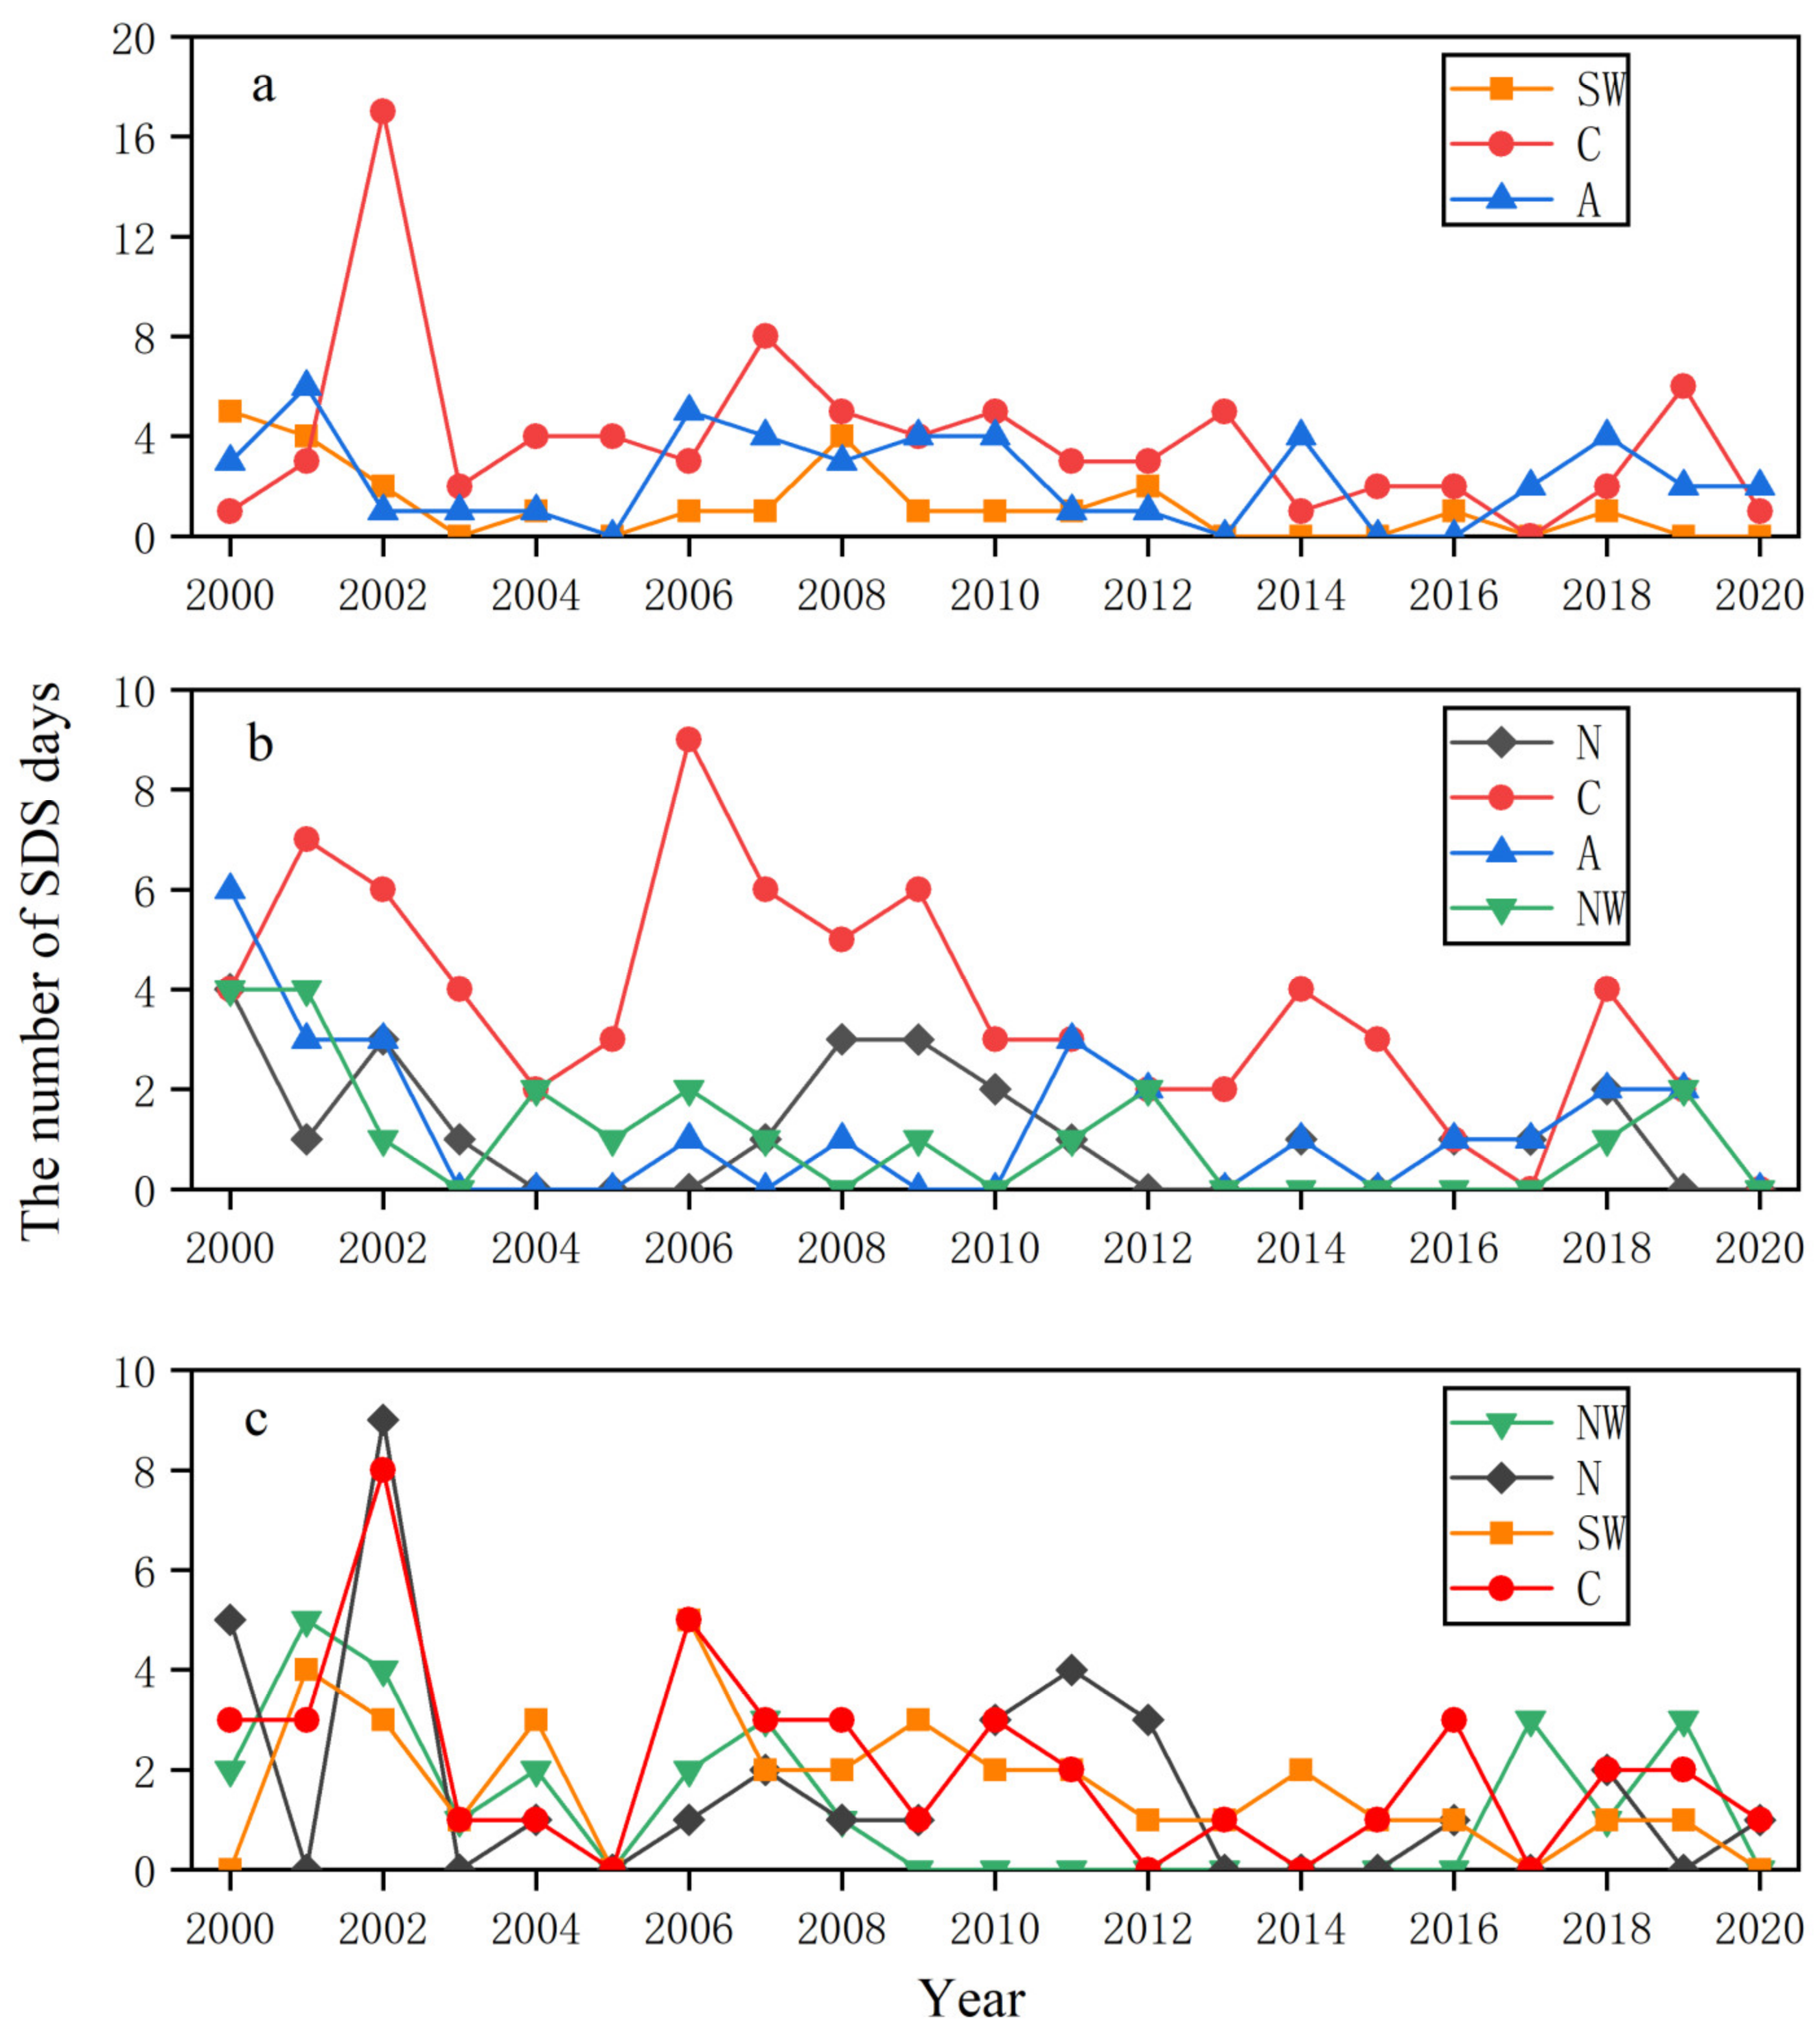
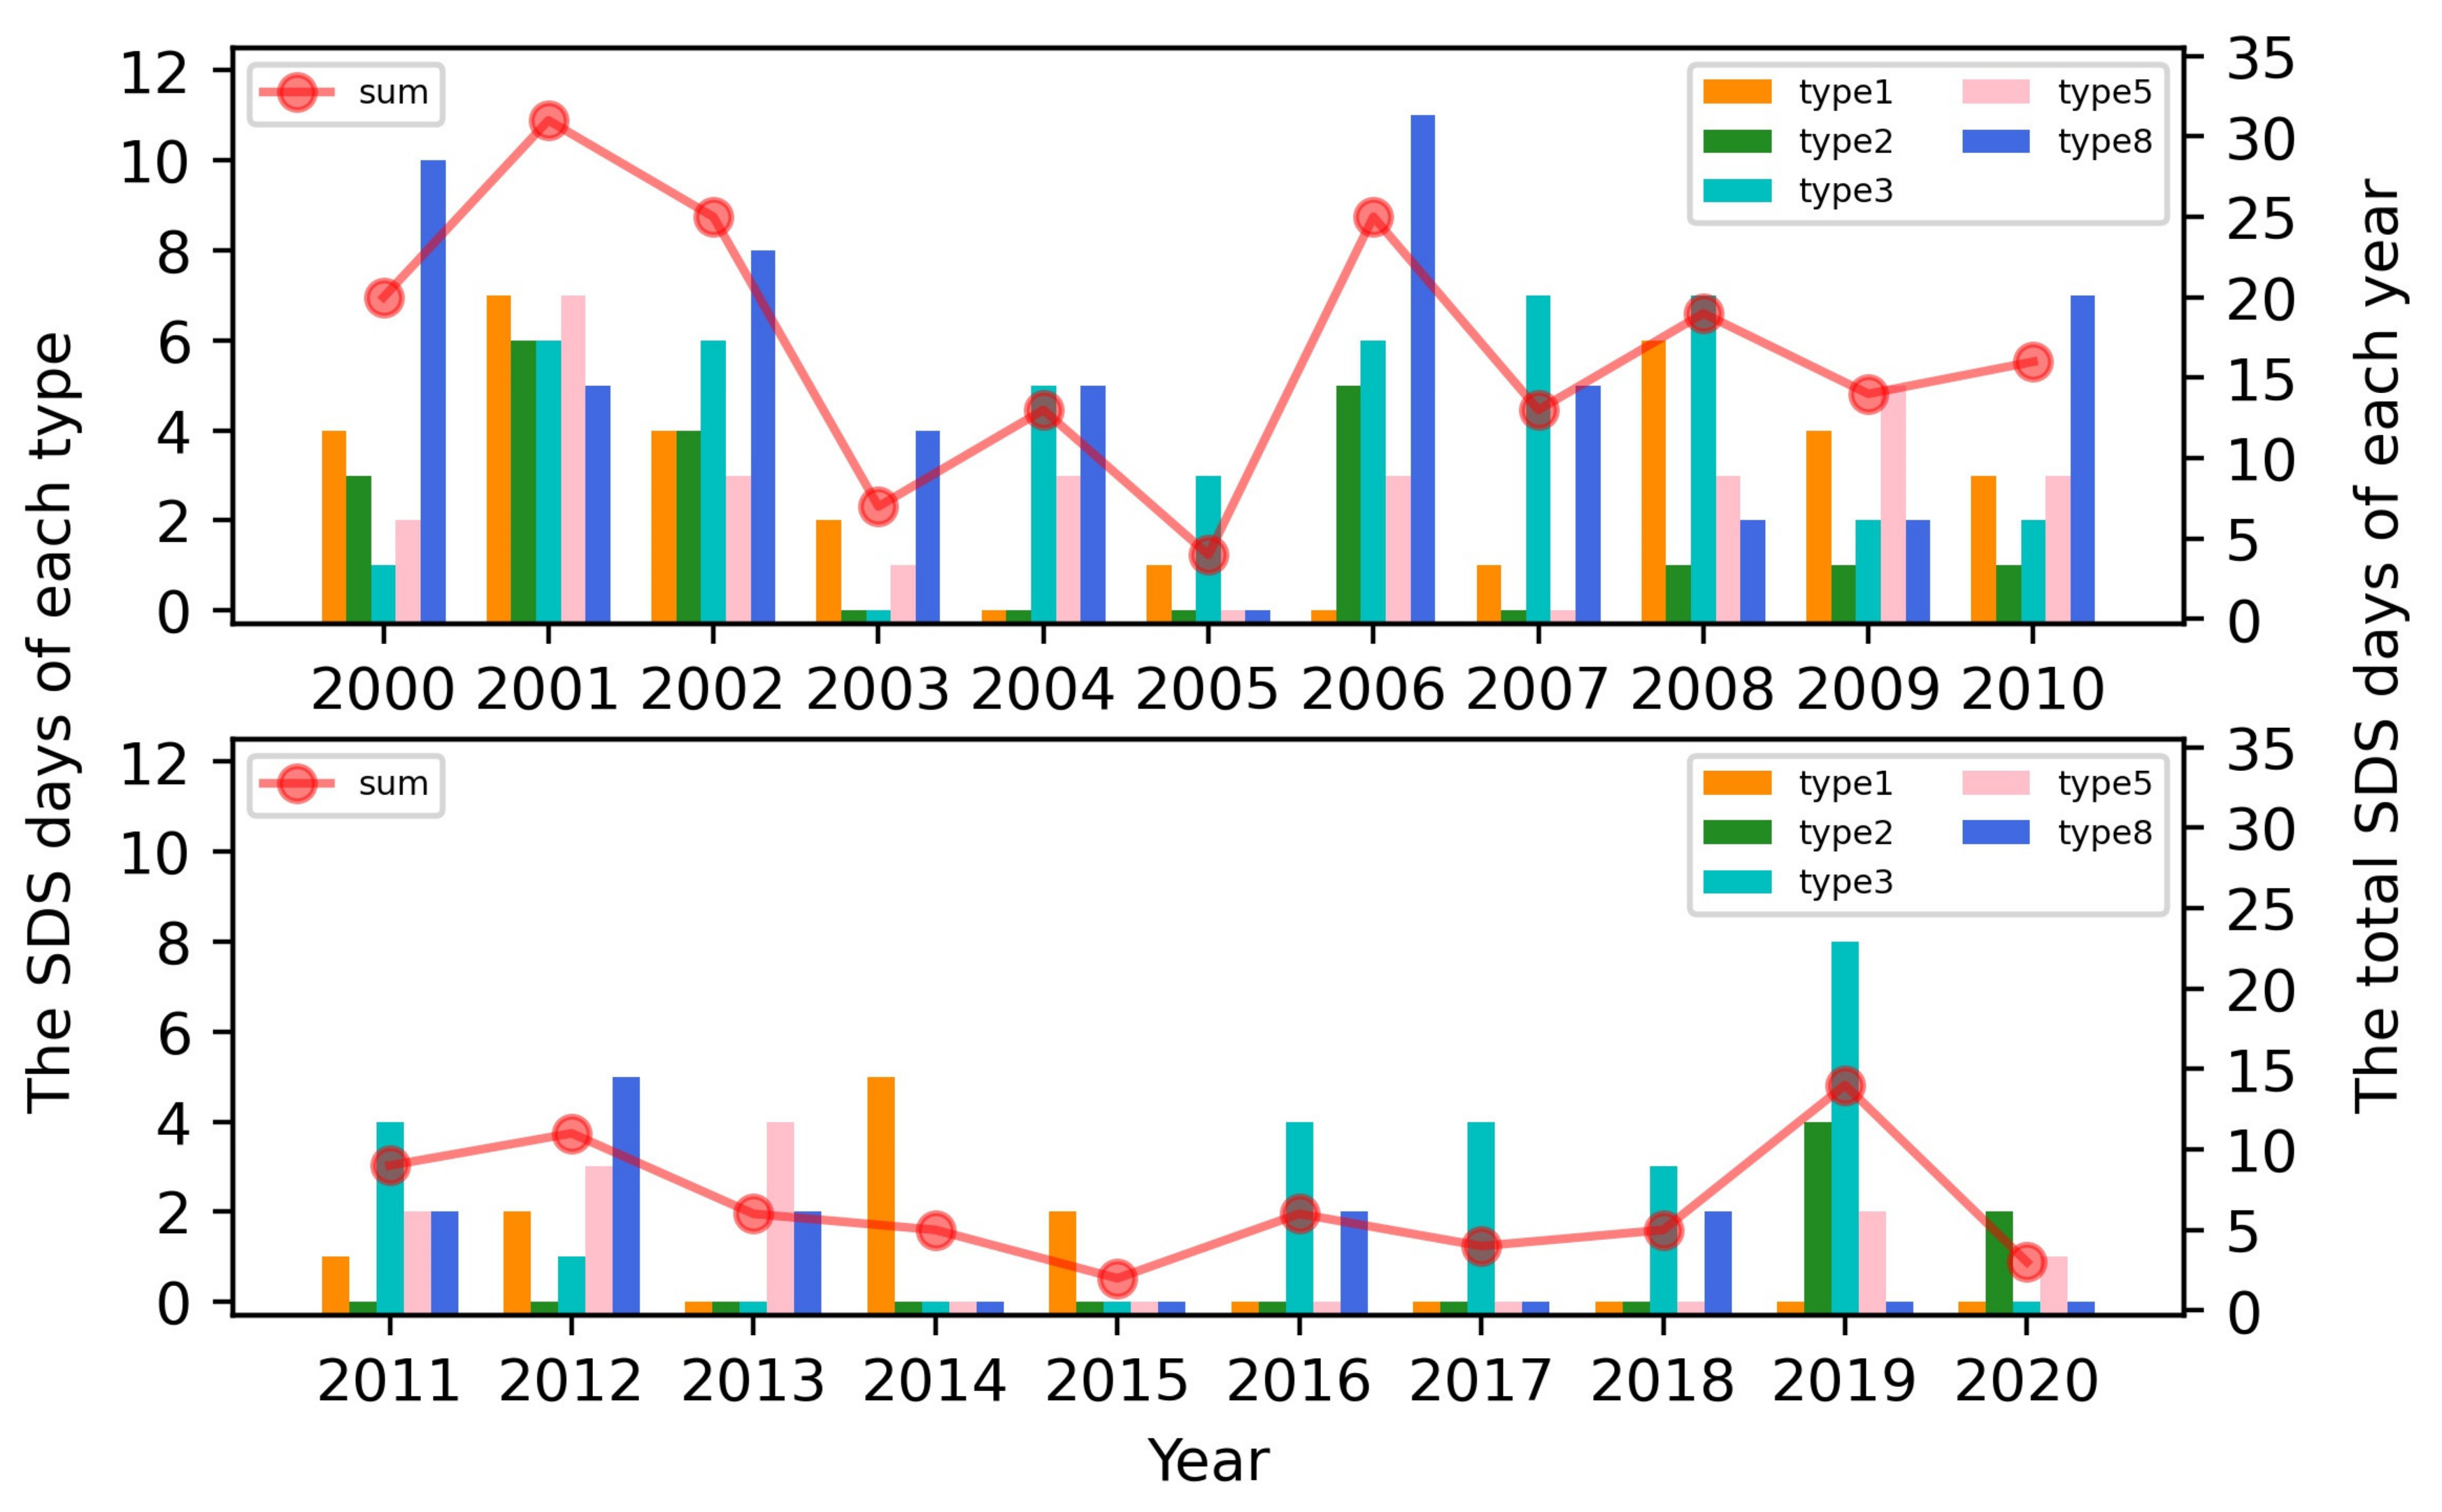
  • Based on the analysis of the variation of the number of days of SDS in spring in China, with time for the five dominant circulation patterns, we found that the occurrence of SDSs influenced by the dominant circulation pattern was more frequent from 2000 to 2010. From 2000 to 2005, the occurrence frequency of SDSs was the highest for the T8 circulation pattern—that is, China was mainly affected by the cold front circulation type, which mainly spread along a northwesterly path. This kind of dust weather usually has a high intensity, wide area of impact, rapid propagation speed, and leads to disastrous weather events. From 2006 to 2010, the T3 and T8 circulation types dominated and were mainly influenced by the Mongolian cyclone and cold front. SDSs mainly spread along a west-northwesterly path, so dust weather was more frequent in this period. From 2011 to 2015, the T1 circulation pattern was dominant and was mainly affected by a cold high-pressure region. The main propagation path was west-northwest, and the occurrence frequency of SDSs decreased overall. From 2016 to 2020, the T3 circulation type dominated and was mainly influenced by the Mongolian cyclone and cold front. Dust mainly spread along a westward path, and the number of SDSs increased compared with the period from 2011 to 2015.
  • The main circulation patterns of four SDS processes in 2021 were analyzed using a combination of the Lamb–Jenkinson and k-means methods. The SDS events in 2021 were closest to the T3 circulation pattern and were mainly influenced by both the Mongolian cyclone and the surface cold front. The main propagation path was westerly and northwesterly. The SDSs originated in Mongolia and were guided by westerly and northwesterly air flows. The main body of dust moved to the east, affecting northwest and north China, and the west and south of northeast China.

Author Contributions

Data curation, Y.W. and X.Z.; conceptualization, Z.Y. and Y.W.; formal analysis, Z.Y.; visualization, Z.Y., W.C. and Y.W.; funding acquisition, Y.W.; investigation, Z.Y., Y.W. and B.G.; methodology, Z.Y., Y.W. and X.Z.; software, Y.W.; writing—original draft, Z.Y.; writing—review and editing, Y.W., H.C. and B.Z. All authors have read and agreed to the published version of the manuscript.

Funding

This research was supported by grants from the NSFC Major Project (42090030), the National Key Research and Development Program (2019YFC0214601), the Basic Creative Research Fund of Huafeng Meteorological Media Group (CY—J2020001), and the CAMS project (2020Z011).

Institutional Review Board Statement

Not applicable.

Informed Consent Statement

Not applicable.

Data Availability Statement

ERA-5: https://cds.climate.copernicus.eu/cdsapp#!/home (accessed on 15 November 2021).

Acknowledgments

Most figures in this study were produced by the open-source software of MeteoInfo (http://www.meteothink.org (accessed on 15 November 2021)).

Conflicts of Interest

The authors declare no conflict of interest.

References

  1. Goudie, A.S.; Middleton, N.J. The changing frequency of dust storms through time. Clim. Chang. 1992, 20, 197–225. [Google Scholar] [CrossRef]
  2. Tegen, I.; Fung, I. Modeling of mineral dust in the atmosphere: Sources, transport, and optical thickness. J. Geophys. Res. 1994, 99, 22897–22914. [Google Scholar] [CrossRef]
  3. Zender, C.S.; Miller, R.L.; Tegen, I. Quantifying mineral dust mass budgets: Terminology, constraints, and current estimates. Eos Trans. Am. Geophys. Union 2004, 85, 509–512. [Google Scholar] [CrossRef]
  4. Ge, Y.; Abuduwaili, J.; Ma, L.; Wu, N.; Liu, D. Potential transport pathways of dust emanating from the playa of Ebinur Lake, Xinjiang, In arid northwest China. Atmos. Res. 2016, 178–179, 196–206. [Google Scholar] [CrossRef]
  5. Lee, E.H.; Sohn, B.J. Recent increasing trend in dust frequency over Mongolia and Inner Mongolia regions and its association with climate and surface condition change. Atmos. Environ. 2011, 45, 4611–4616. [Google Scholar] [CrossRef]
  6. Chen, S.; Huang, J.; Kang, L.; Wang, H.; Ma, X.; He, Y.; Yuan, T.; Yang, B.; Huang, Z.; Zhang, G. Emission, transport, and radiative effects of mineral dust from the Taklimakan and Gobi deserts: Comparison of measurements and model results. Atmos. Chem. Phys. 2017, 17, 2401–2421. [Google Scholar] [CrossRef] [Green Version]
  7. Zhang, X.Y.; Arimoto, R.; An, Z.S. Dust emission from Chinese desert sources linked to variations in atmospheric circulation. J. Geophys. Res. Atmos. 1997, 102, 28041–28047. [Google Scholar] [CrossRef]
  8. Yassin, M.F.; Almutairi, S.K.; Al-Hemoud, A. Dust storms backward Trajectories’ and source identification over Kuwait. Atmos. Res. 2018, 212, 158–171. [Google Scholar] [CrossRef]
  9. Al-Hemoud, A.; Al-Sudairawi, M.; Neelamanai, S.; Naseeb, A.; Behbehani, W. Socioeconomic effect of dust storms in Kuwait. Arab. J. Geosci. 2017, 10, 18. [Google Scholar] [CrossRef]
  10. Swap, R.; Garstang, M.; Greco, S.; Talbot, R.; Kållberg, P. Saharan dust in the Amazon Basin. Tellus B 1992, 44, 133–149. [Google Scholar] [CrossRef] [Green Version]
  11. Qian, W.; Tang, X.; Quan, L. Regional characteristics of dust storms in China. Atmos. Environ. 2004, 38, 4895–4907. [Google Scholar] [CrossRef]
  12. Qian, W.; Quan, L.; Shi, S. Variations of the dust storm in China and its climatic control. J. Clim. 2002, 15, 1216–1229. [Google Scholar] [CrossRef]
  13. Zhao, C.; Dabu, X.; Li, Y. Relationship between climatic factors and dust storm frequency in Inner Mongolia of China. Geophys. Res. Lett. 2004, 31, 10–12. [Google Scholar] [CrossRef]
  14. Yang, B.; Bräuning, A.; Zhang, Z.; Dong, Z.; Esper, J. Dust storm frequency and its relation to climate changes in Northern China during the past 1000 years. Atmos. Environ. 2007, 41, 9288–9299. [Google Scholar] [CrossRef]
  15. Uematsu, M.; Duce, R.A.; Prospero, J.M.; Chen, L.; Merrill, J.T.; McDonald, R.L. Transport of mineral aerosol from Asia over the North Pacific ocean. J. Geophys. Res. 1983, 88, 5343–5352. [Google Scholar] [CrossRef]
  16. Murayama, T.; Sugimoto, N.; Uno, I.; Kinoshita, K.; Aoki, K.; Hagiwara, N.; Liu, Z.; Matsui, I.; Sakai, T.; Shibata, T.; et al. Ground-based network observation of Asian dust events of April 1998 in east Asia. J. Geophys. Res. Atmos. 2001, 106, 18345–18359. [Google Scholar] [CrossRef] [Green Version]
  17. Brazel, A.J.; Nickling, W.G. The relationship of weather types to dust storm generation in Arizona (1965–1980). J. Climatol. 1986, 6, 255–275. [Google Scholar] [CrossRef]
  18. Pauley, P.M.; Baker, N.L.; Barker, E.H. An Observational Study of the “Interstate 5” Dust Storm Case. Bull. Am. Meteorol. Soc. 1996, 77, 693–720. [Google Scholar] [CrossRef]
  19. Jones, P.D.; Hulme, M.; Briffa, K.R. A comparison of Lamb circulation types with an objective classification scheme. Int. J. Climatol. 1993, 13, 655–663. [Google Scholar] [CrossRef]
  20. Lamb, H.H. Types and spells of weather around the year in the British Isles: Annual trends, seasonal structure of the year, singularities. Q. J. R. Meteorol. Soc. 1950, 76, 393–429. [Google Scholar] [CrossRef]
  21. Huang, M.; Gao, Z.; Miao, S.; Xu, X. Characteristics of sea breezes over the Jiangsu coastal area, China. Int. J. Climatol. 2016, 36, 3908–3916. [Google Scholar] [CrossRef]
  22. Liu, Y.; He, J.; Lai, X.; Zhang, C.; Zhang, L.; Gong, S.; Che, H. Influence of atmospheric circulation on aerosol and its optical characteristics in the pearl river delta region. Atmosphere 2020, 11, 288. [Google Scholar] [CrossRef] [Green Version]
  23. Chen, D. A monthly circulation climatology for Sweden and its application to a winter temperature case study. Int. J. Climatol. 2000, 20, 1067–1076. [Google Scholar] [CrossRef]
  24. Liao, W.; Wu, L.; Zhou, S.; Wang, X.; Chen, D. Impact of Synoptic Weather Types on Ground-Level Ozone Concentrations in Guangzhou, China. Asia-Pacific J. Atmos. Sci. 2021, 57, 169–180. [Google Scholar] [CrossRef]
  25. Brisson, E.; Demuzere, M.; Kwakernaak, B.; Van Lipzig, N.P.M. Relations between atmospheric circulation and precipitation in Belgium. Meteorol. Atmos. Phys. 2011, 111, 27–39. [Google Scholar] [CrossRef]
  26. China Meteorological Administration (CMA). Classification of Sand and Dust Storm Weather. (GB/T 20480–2017). 2017. Available online: http://www.cmastd.cn/standardView.jspx?id=2378 (accessed on 15 November 2021). (In Chinese).
  27. Wang, Y.; Stein, A.F.; Draxler, R.R.; de la Rosa, J.D.; Zhang, X. Global sand and dust storms in 2008: Observation and HYSPLIT model verification. Atmos. Environ. 2011, 45, 6368–6381. [Google Scholar] [CrossRef]
  28. Muñoz-Sabater, J.; Dutra, E.; Agustí-Panareda, A.; Albergel, C.; Arduini, G.; Balsamo, G.; Boussetta, S.; Choulga, M.; Harrigan, S.; Hersbach, H.; et al. ERA5-Land: A state-of-the-art global reanalysis dataset for land applications. Earth Syst. Sci. Data 2021, 13, 4349–4383. [Google Scholar] [CrossRef]
  29. Xie, Y.; Zhi, X. Impact of COVID-19 Lockdown and Atmospheric Circulation on the Air Quality in Wuhan During Early 2020. E3S Web Conf. 2021, 299, 02011. [Google Scholar] [CrossRef]
  30. He, J.; Gong, S.; Zhou, C.; Lu, S.; Wu, L.; Chen, Y.; Yu, Y.; Zhao, S.; Yu, L.; Yin, C. Analyses of winter circulation types and their impacts on haze pollution in Beijing. Atmos. Environ. 2018, 192, 94–103. [Google Scholar] [CrossRef] [Green Version]
  31. Tian, W.; Zheng, Y.; Yang, R.; Ji, S.; Wang, J. A Survey on Clustering based Meteorological Data Mining. Int. J. Grid Distrib. Comput. 2014, 7, 229–240. [Google Scholar] [CrossRef]
  32. Arroyo, Á.; Herrero, Á.; Tricio, V.; Corchado, E. Analysis of meteorological conditions in Spain by means of clustering techniques. J. Appl. Log. 2017, 24, 76–89. [Google Scholar] [CrossRef]
Figure 1. Locations of the 673 standard ground weather stations in China.
Atmosphere 12 01545 g001
Figure 2. Average number of spring SDS days in China from 2000 to 2020, and the grid points of the three main regions of influence (A, B, C).
Atmosphere 12 01545 g002
Figure 3. Frequency of each circulation type and its ratio P1/P2 in (a) the southern Xinjiang basin, (b) western Inner Mongolia and southern Mongolia, and (c) the center of Inner Mongolia in spring from 2000 to 2020.
Atmosphere 12 01545 g003
Figure 4. Annual variation of dominant circulation pattern in (a) the southern Xinjiang basin, (b) western Inner Mongolia and southern Mongolia, and (c) the center of Inner Mongolia in spring from 2000 to 2020.
Atmosphere 12 01545 g004
Figure 5. Distribution of the 500 hPa height field, the wind field, and the temperature field of the nine circulation types in the spring from 2000 to 2020.
Atmosphere 12 01545 g005
Figure 6. Distribution of the SLP field and the 10 m wind field of the nine circulation types in spring from 2000 to 2020.
Atmosphere 12 01545 g006
Figure 7. Annual distribution of the number of SDS days under the dominant circulation types.
Atmosphere 12 01545 g007
Figure 8. Frequency of each circulation type, and the P1/P2 ratio in (a) the southern Xinjiang basin, (b) western Inner Mongolia and southern Mongolia, and (c) the center of Inner Mongolia in the spring 2021.
Atmosphere 12 01545 g008
Figure 9. Distribution of the 500 hPa height field, wind field, and temperature field during four SDS events ((a) 13–18 March, (b) 27 March–1 April, (c) 14–16 April, and (d) 6 May–8 May) in spring 2021.
Atmosphere 12 01545 g009
Figure 10. Distribution of the SLP field and 10 m wind field during four SDS events ((a) 13–18 March, (b) 27 March–1 April, (c) 14–16 April, and (d) 6 May–8 May) in spring 2021.
Atmosphere 12 01545 g010
Table 1. Wind speed and visibility in sand and dust weather.
Floating DustBlowing DustSDSSevere SDSExtreme Severe SDS
Wind speed (m/s)≤3.0>3.0>3.0>3.0>3.0
Visibility (km)<101–100.5–10.020–0.5<0.050
Table 2. Circulation types based on the Lamb–Jenkinson scheme.
| ξ | V
(Directional Flow)
| ξ | 2 V
(Rotational Flow)
V | ξ | 2 V
(Mixed Type)
V < 6   and   ξ < 6
(Undefined)
N(north),
NE (northeast),
E(east),
SE (southeast),
S(south),
SW (southwest),
W(west),
NW (northwest)
A(anticyclonic),
C(cyclonic)
AN (anticyclonic north),
ANE (anticyclonic northeast),
AE (anticyclonic east),
ASE (anticyclonic southeast),
AS (anticyclonic south),
ASW (anticyclonic southwest),
AW (anticyclonic west),
ANW (anticyclonic northwest),
CN (cyclonic north),
CNE (cyclonic northeast),
CE (cyclonic east),
CSE (cyclonic southeast),
CS (cyclonic south),
CSW (cyclonic southwest),
CW (cyclonic west),
CNW (cyclonic northwest)
UD (undefined)
Publisher’s Note: MDPI stays neutral with regard to jurisdictional claims in published maps and institutional affiliations.

