
Characteristics of Atmospheric Inorganic Nitrogen Wet Deposition in Coastal Urban Areas of Xiamen, China

 ,
, 
Abstract
:1. Introduction
2. Methods and Materials
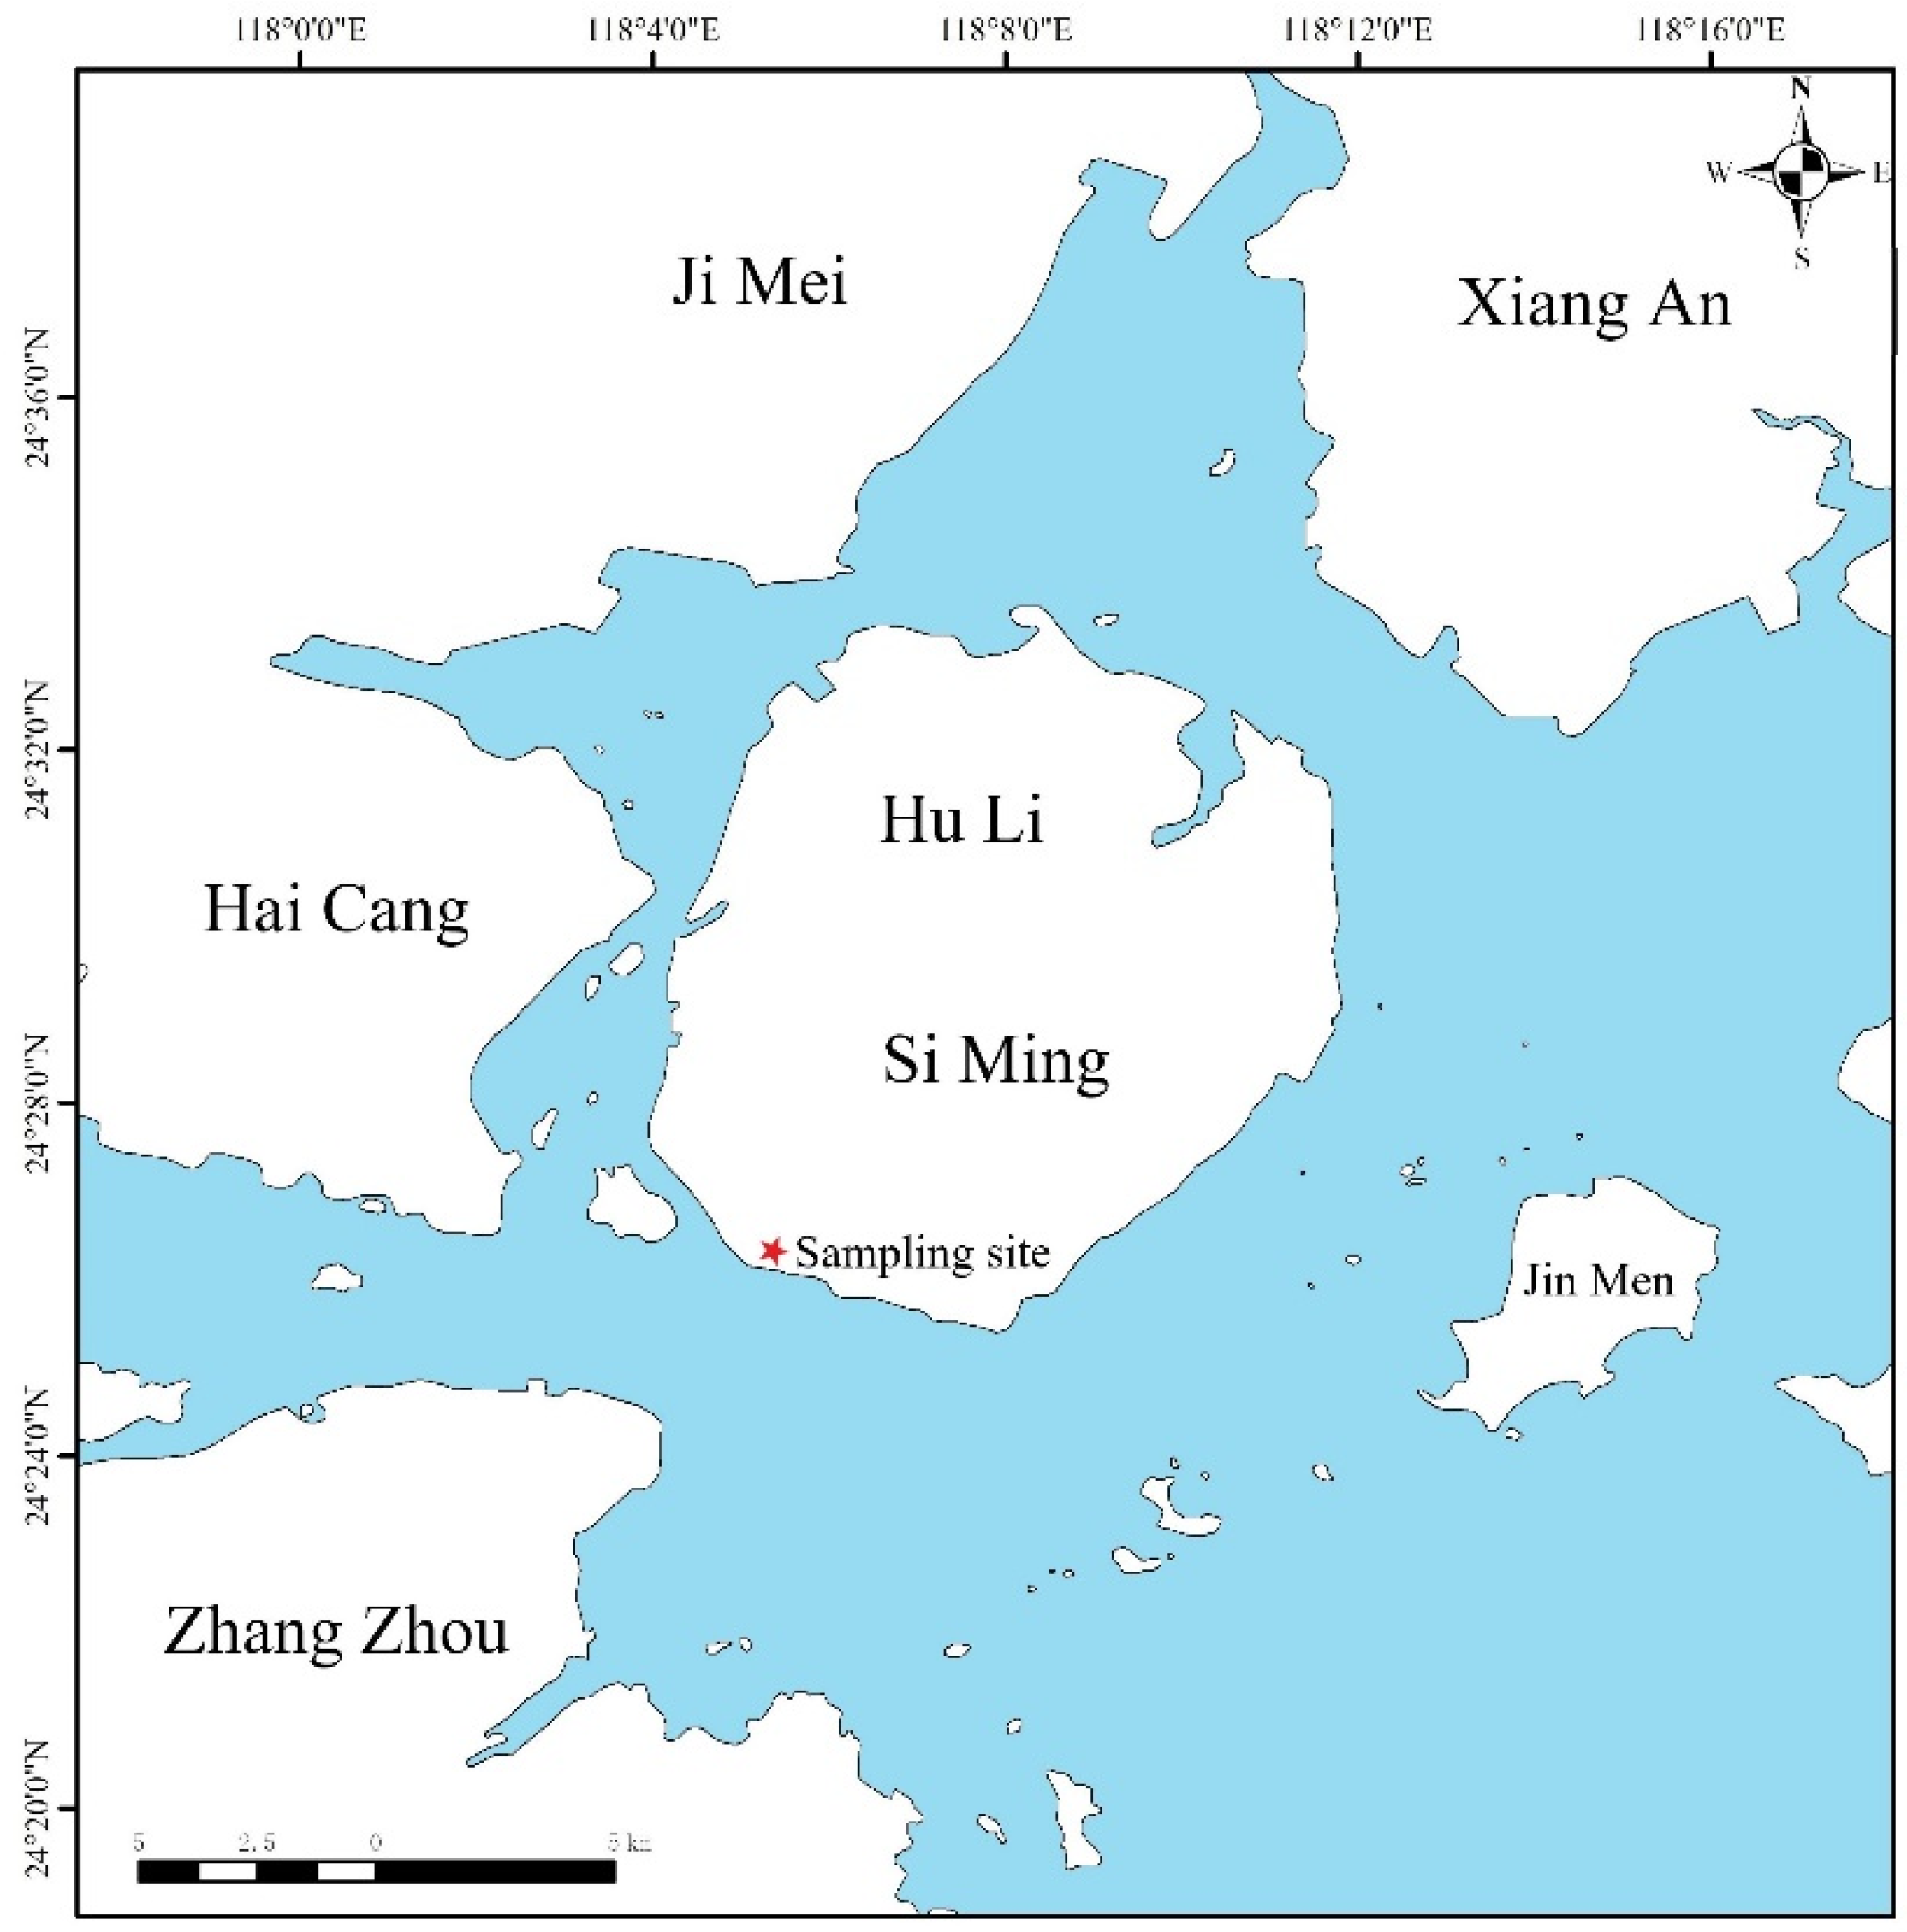
2.1. Sampling Site
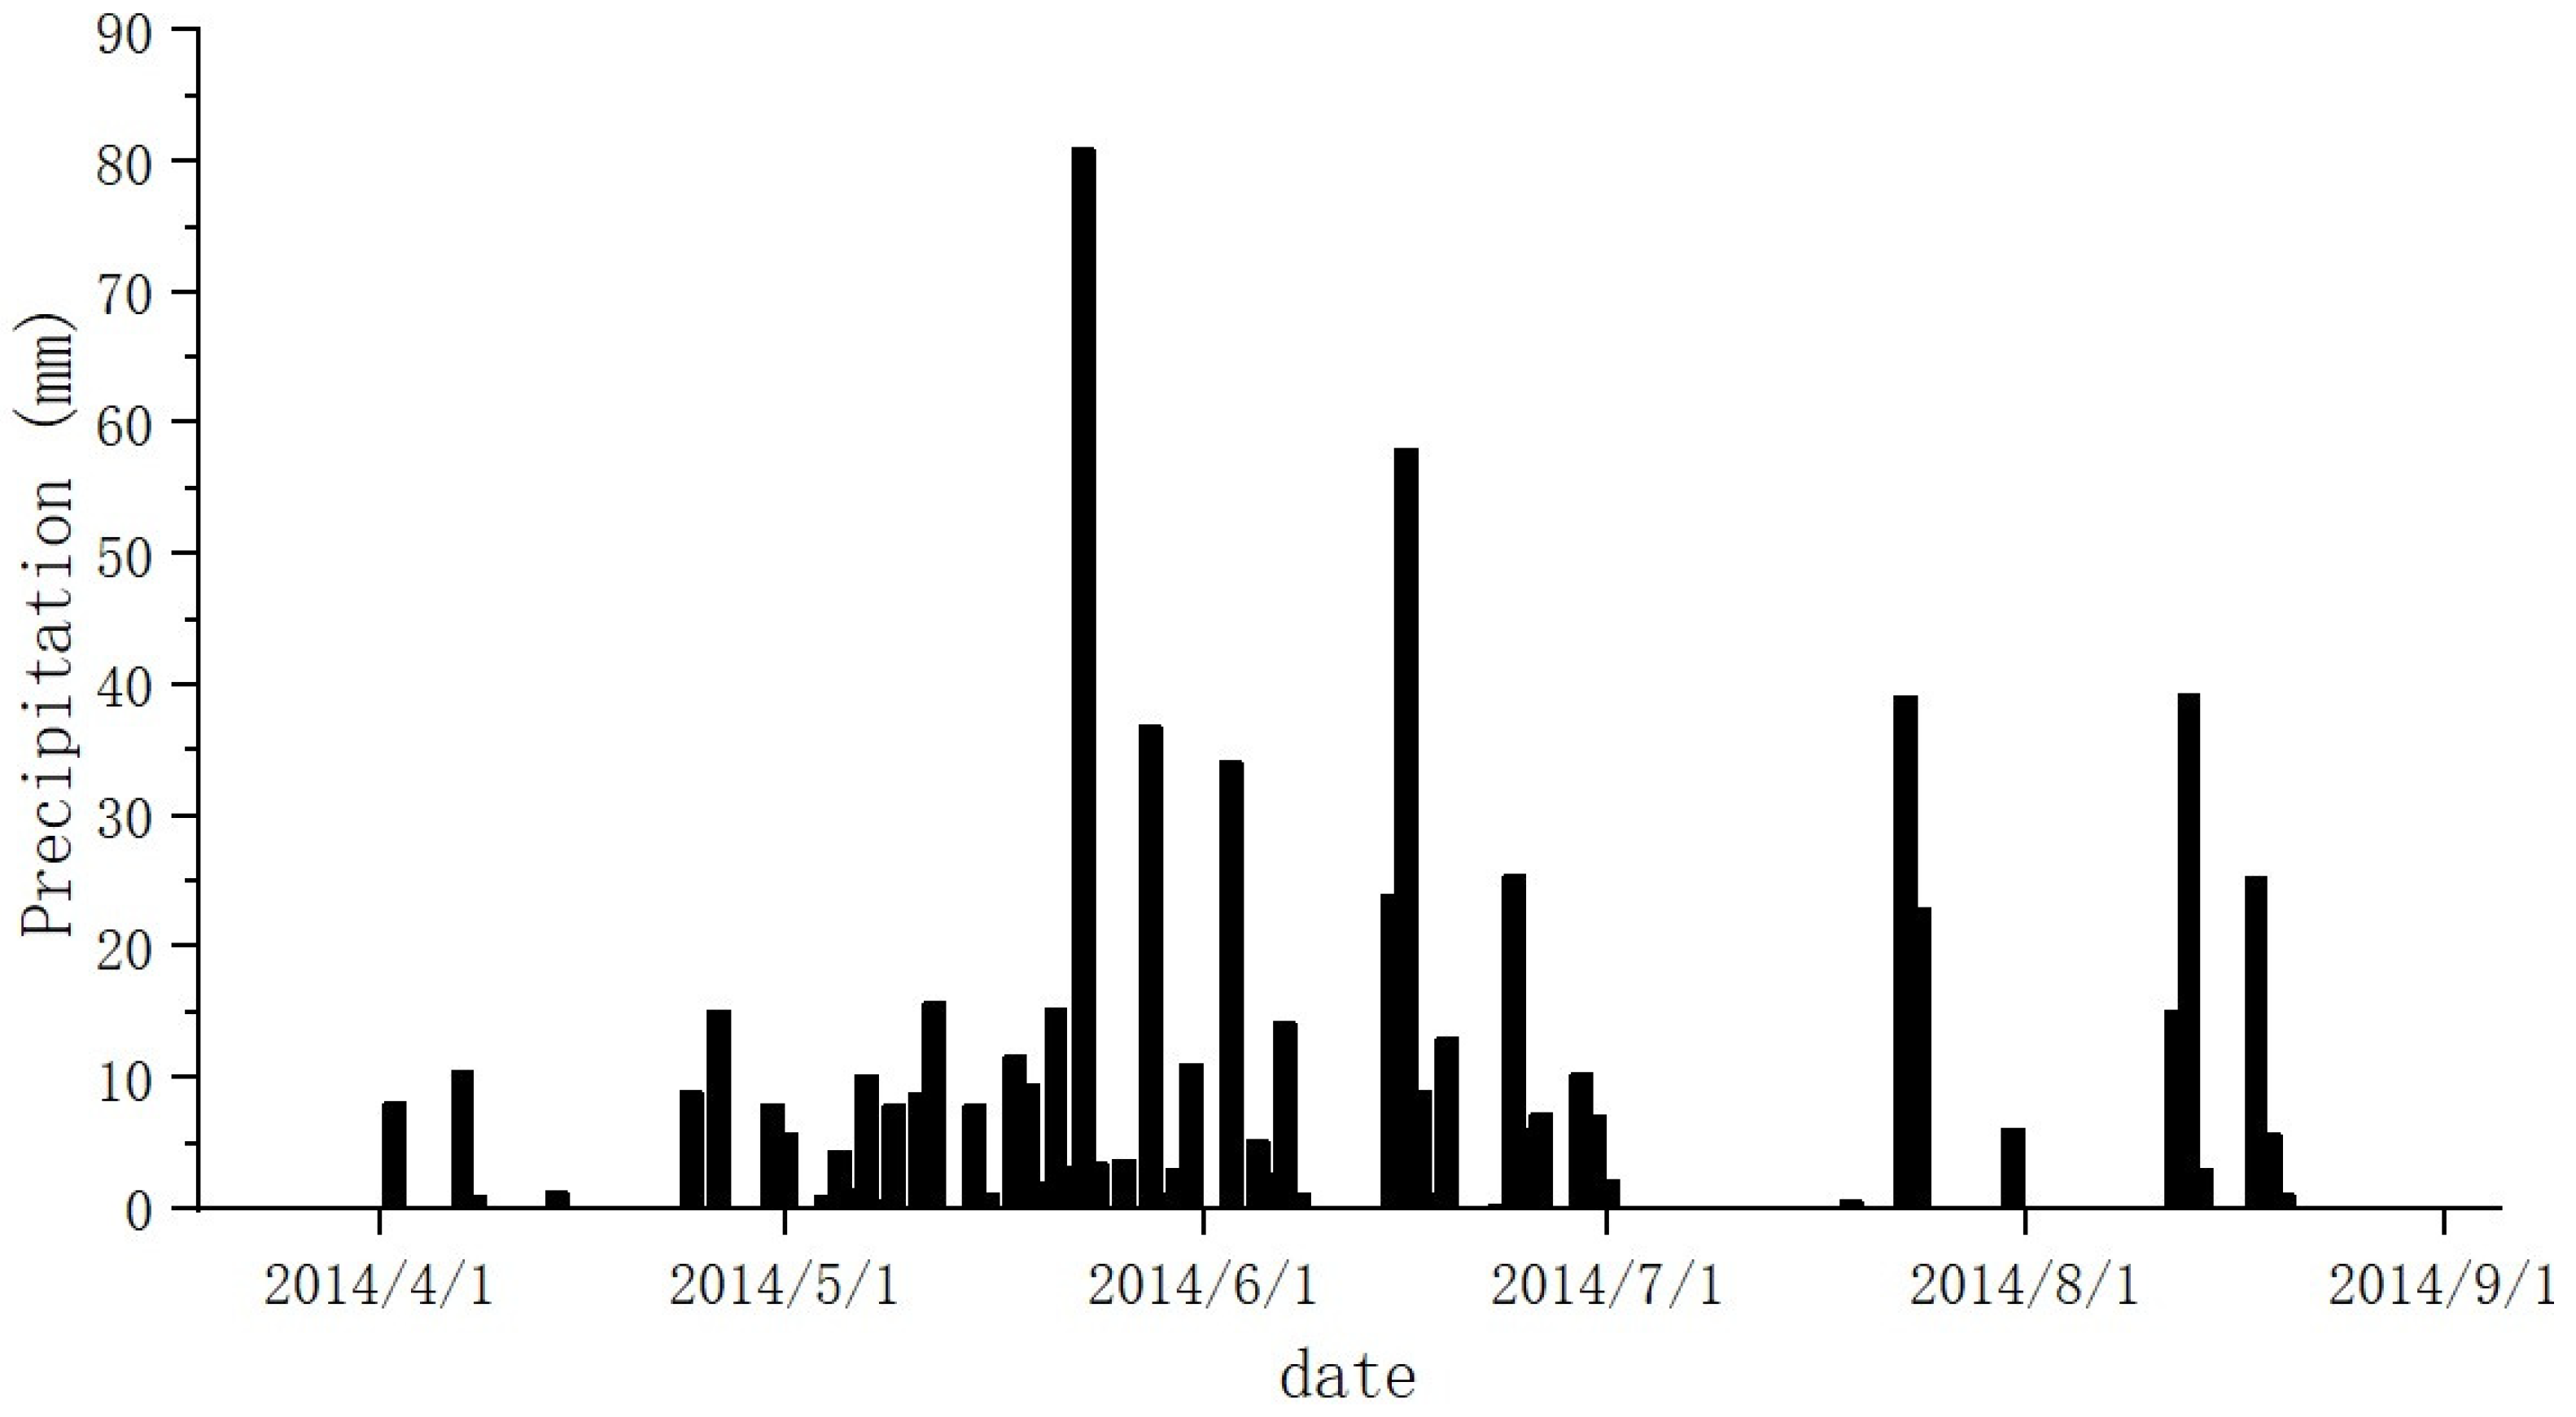
2.2. Precipitation
2.3. Sample Apparatus and Methods
2.4. Data Processing
2.4.1. PMF (Positive Matrix Factorization) Source Resolution Method
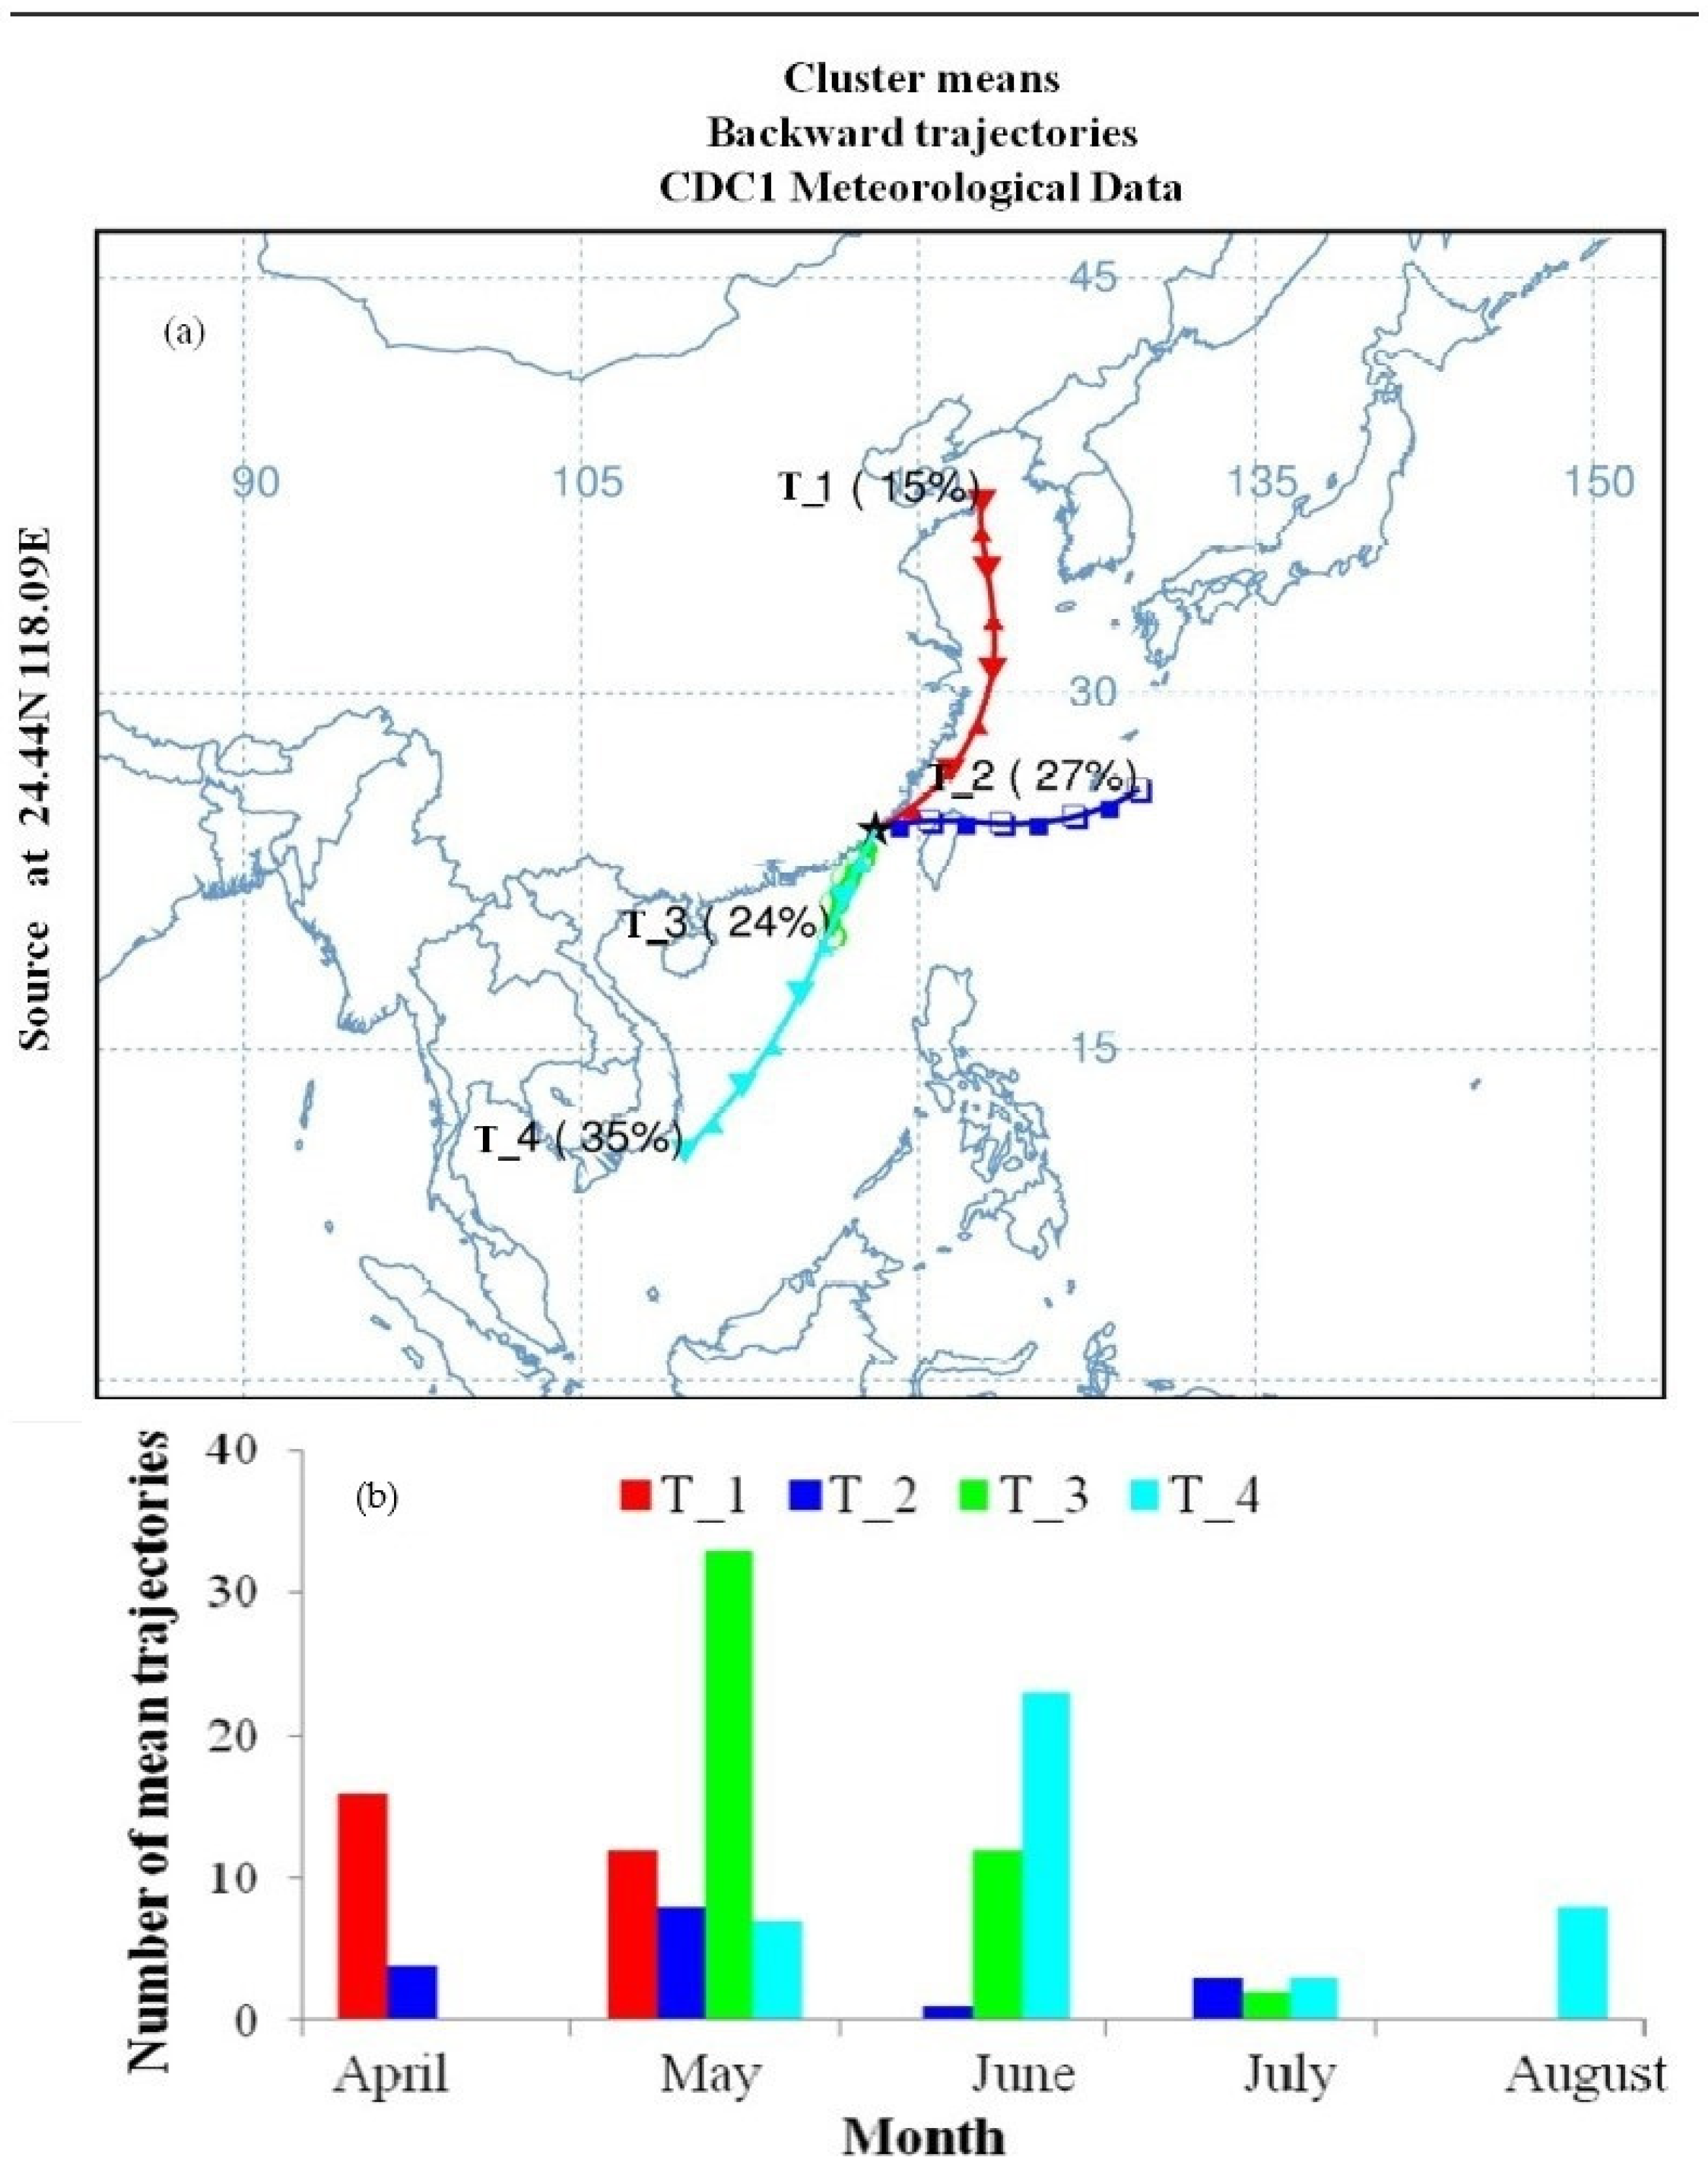
2.4.2. Air Mass Trajectory Analysis (HYSPLIT)
3. Results and Discussion
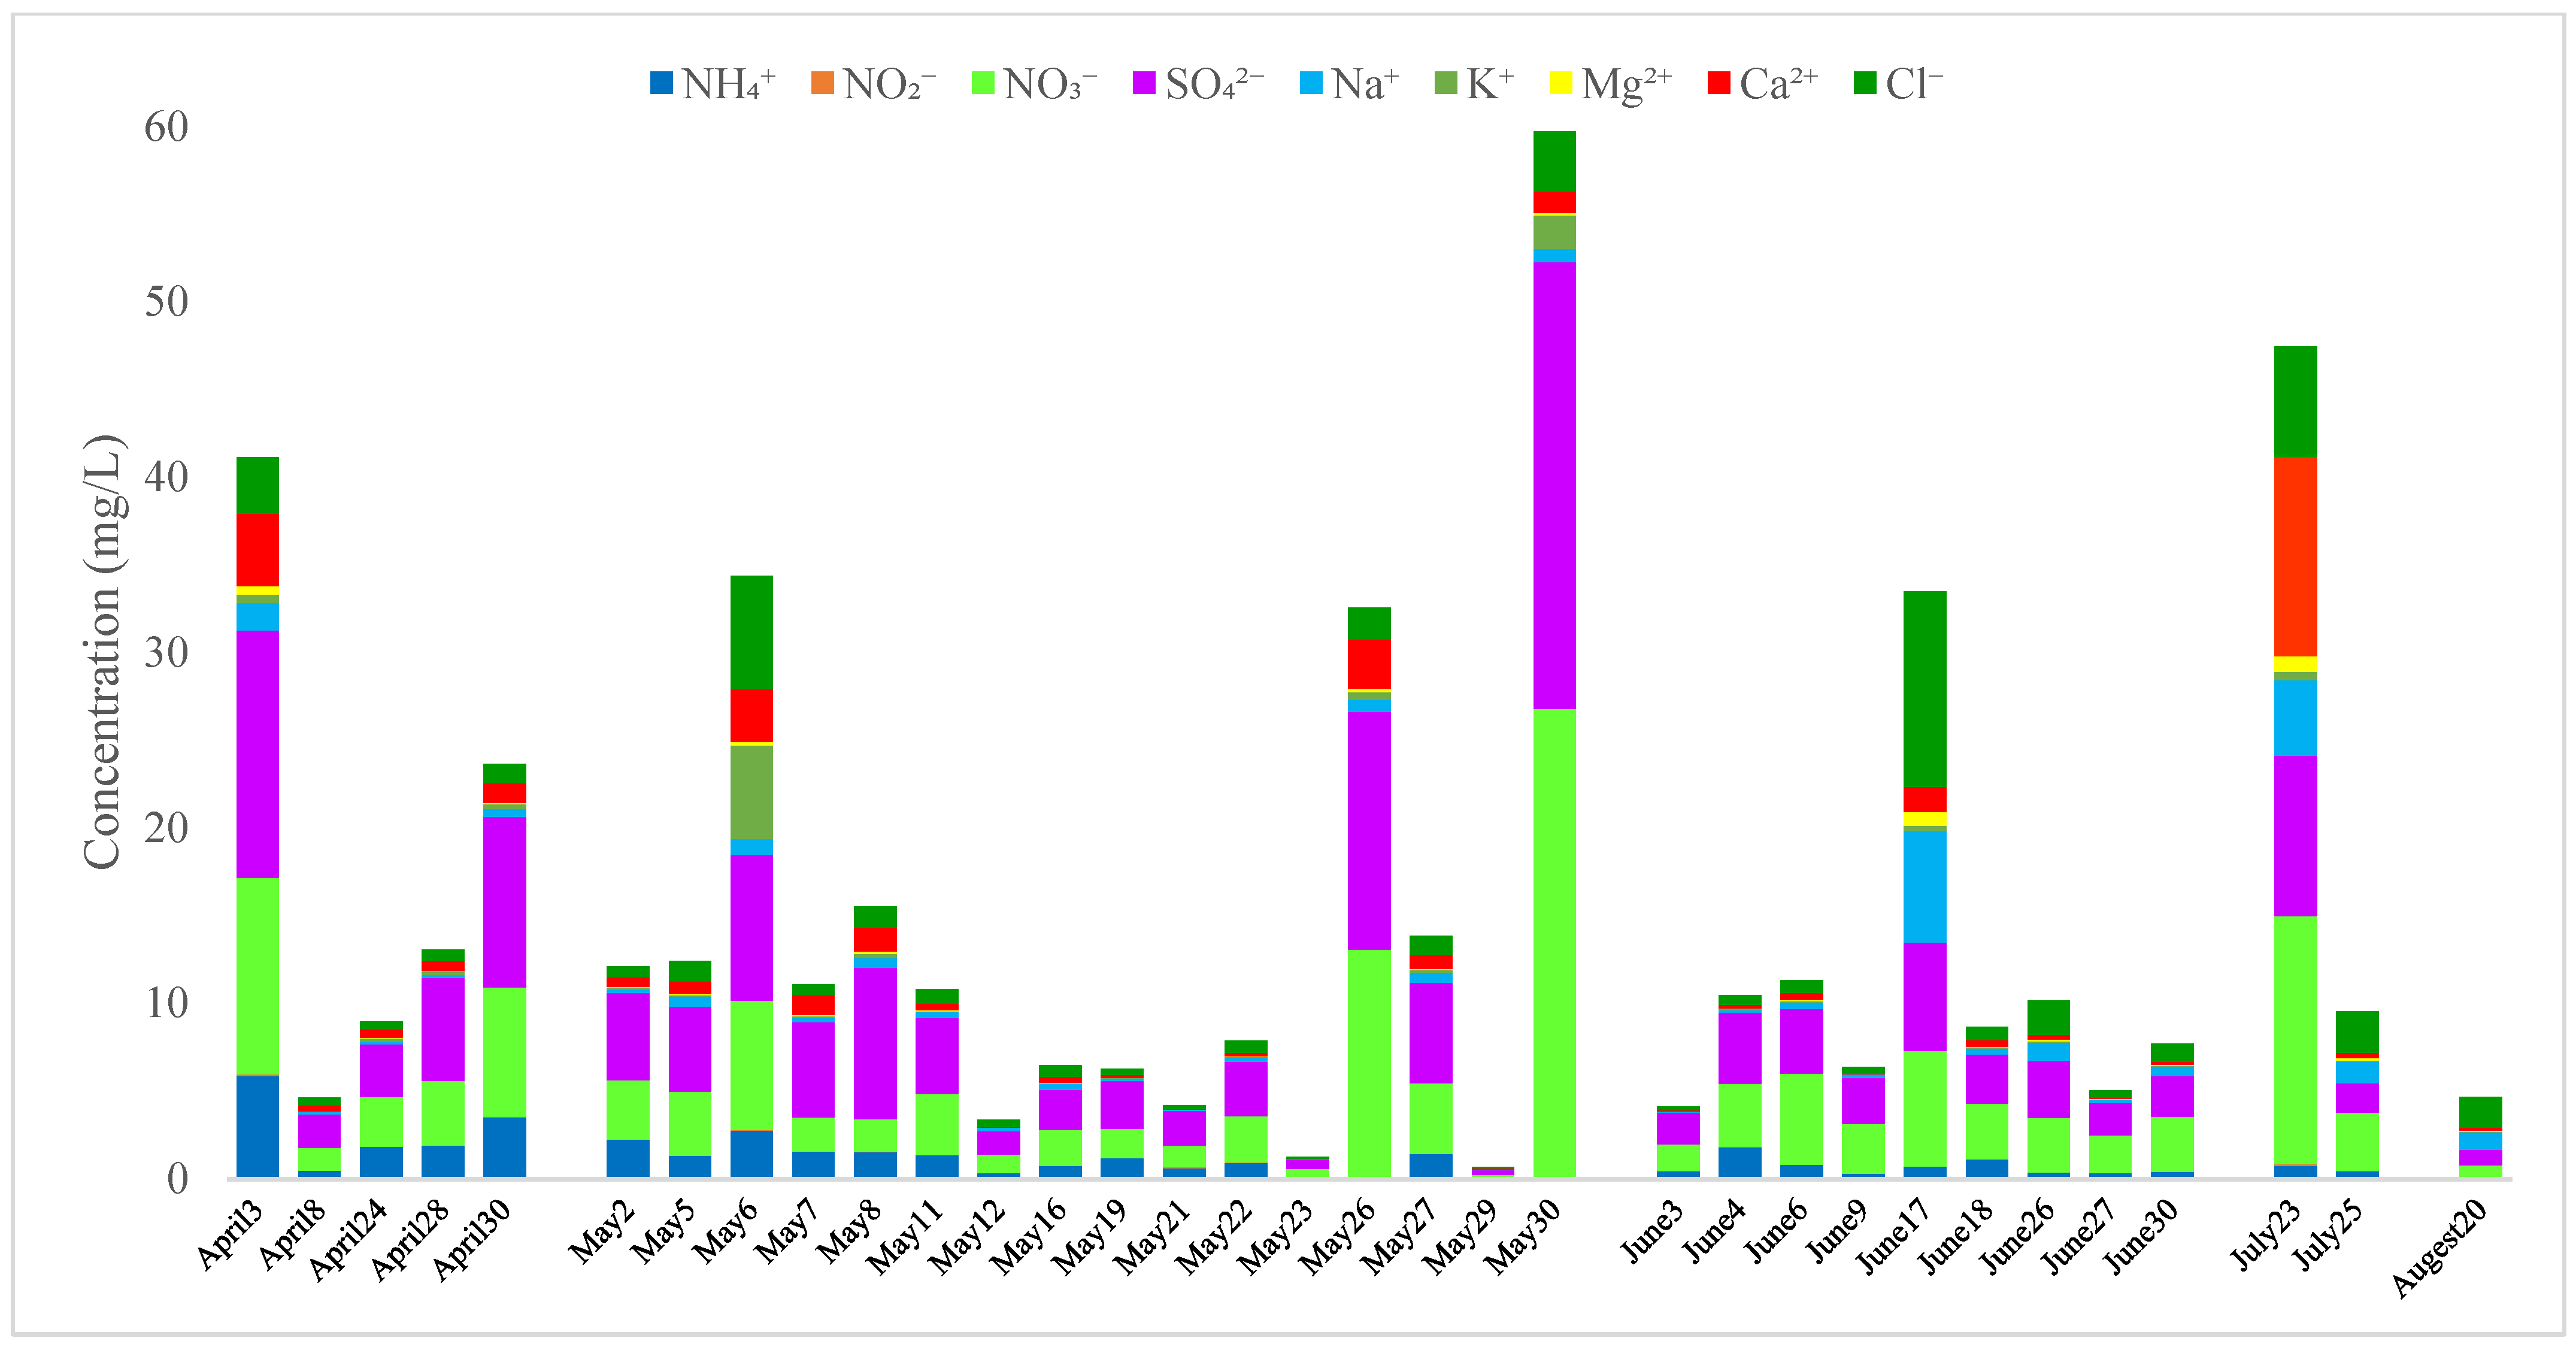
3.1. Characteristics, Concentrations, and Monthly Variations of Water-Soluble Ions
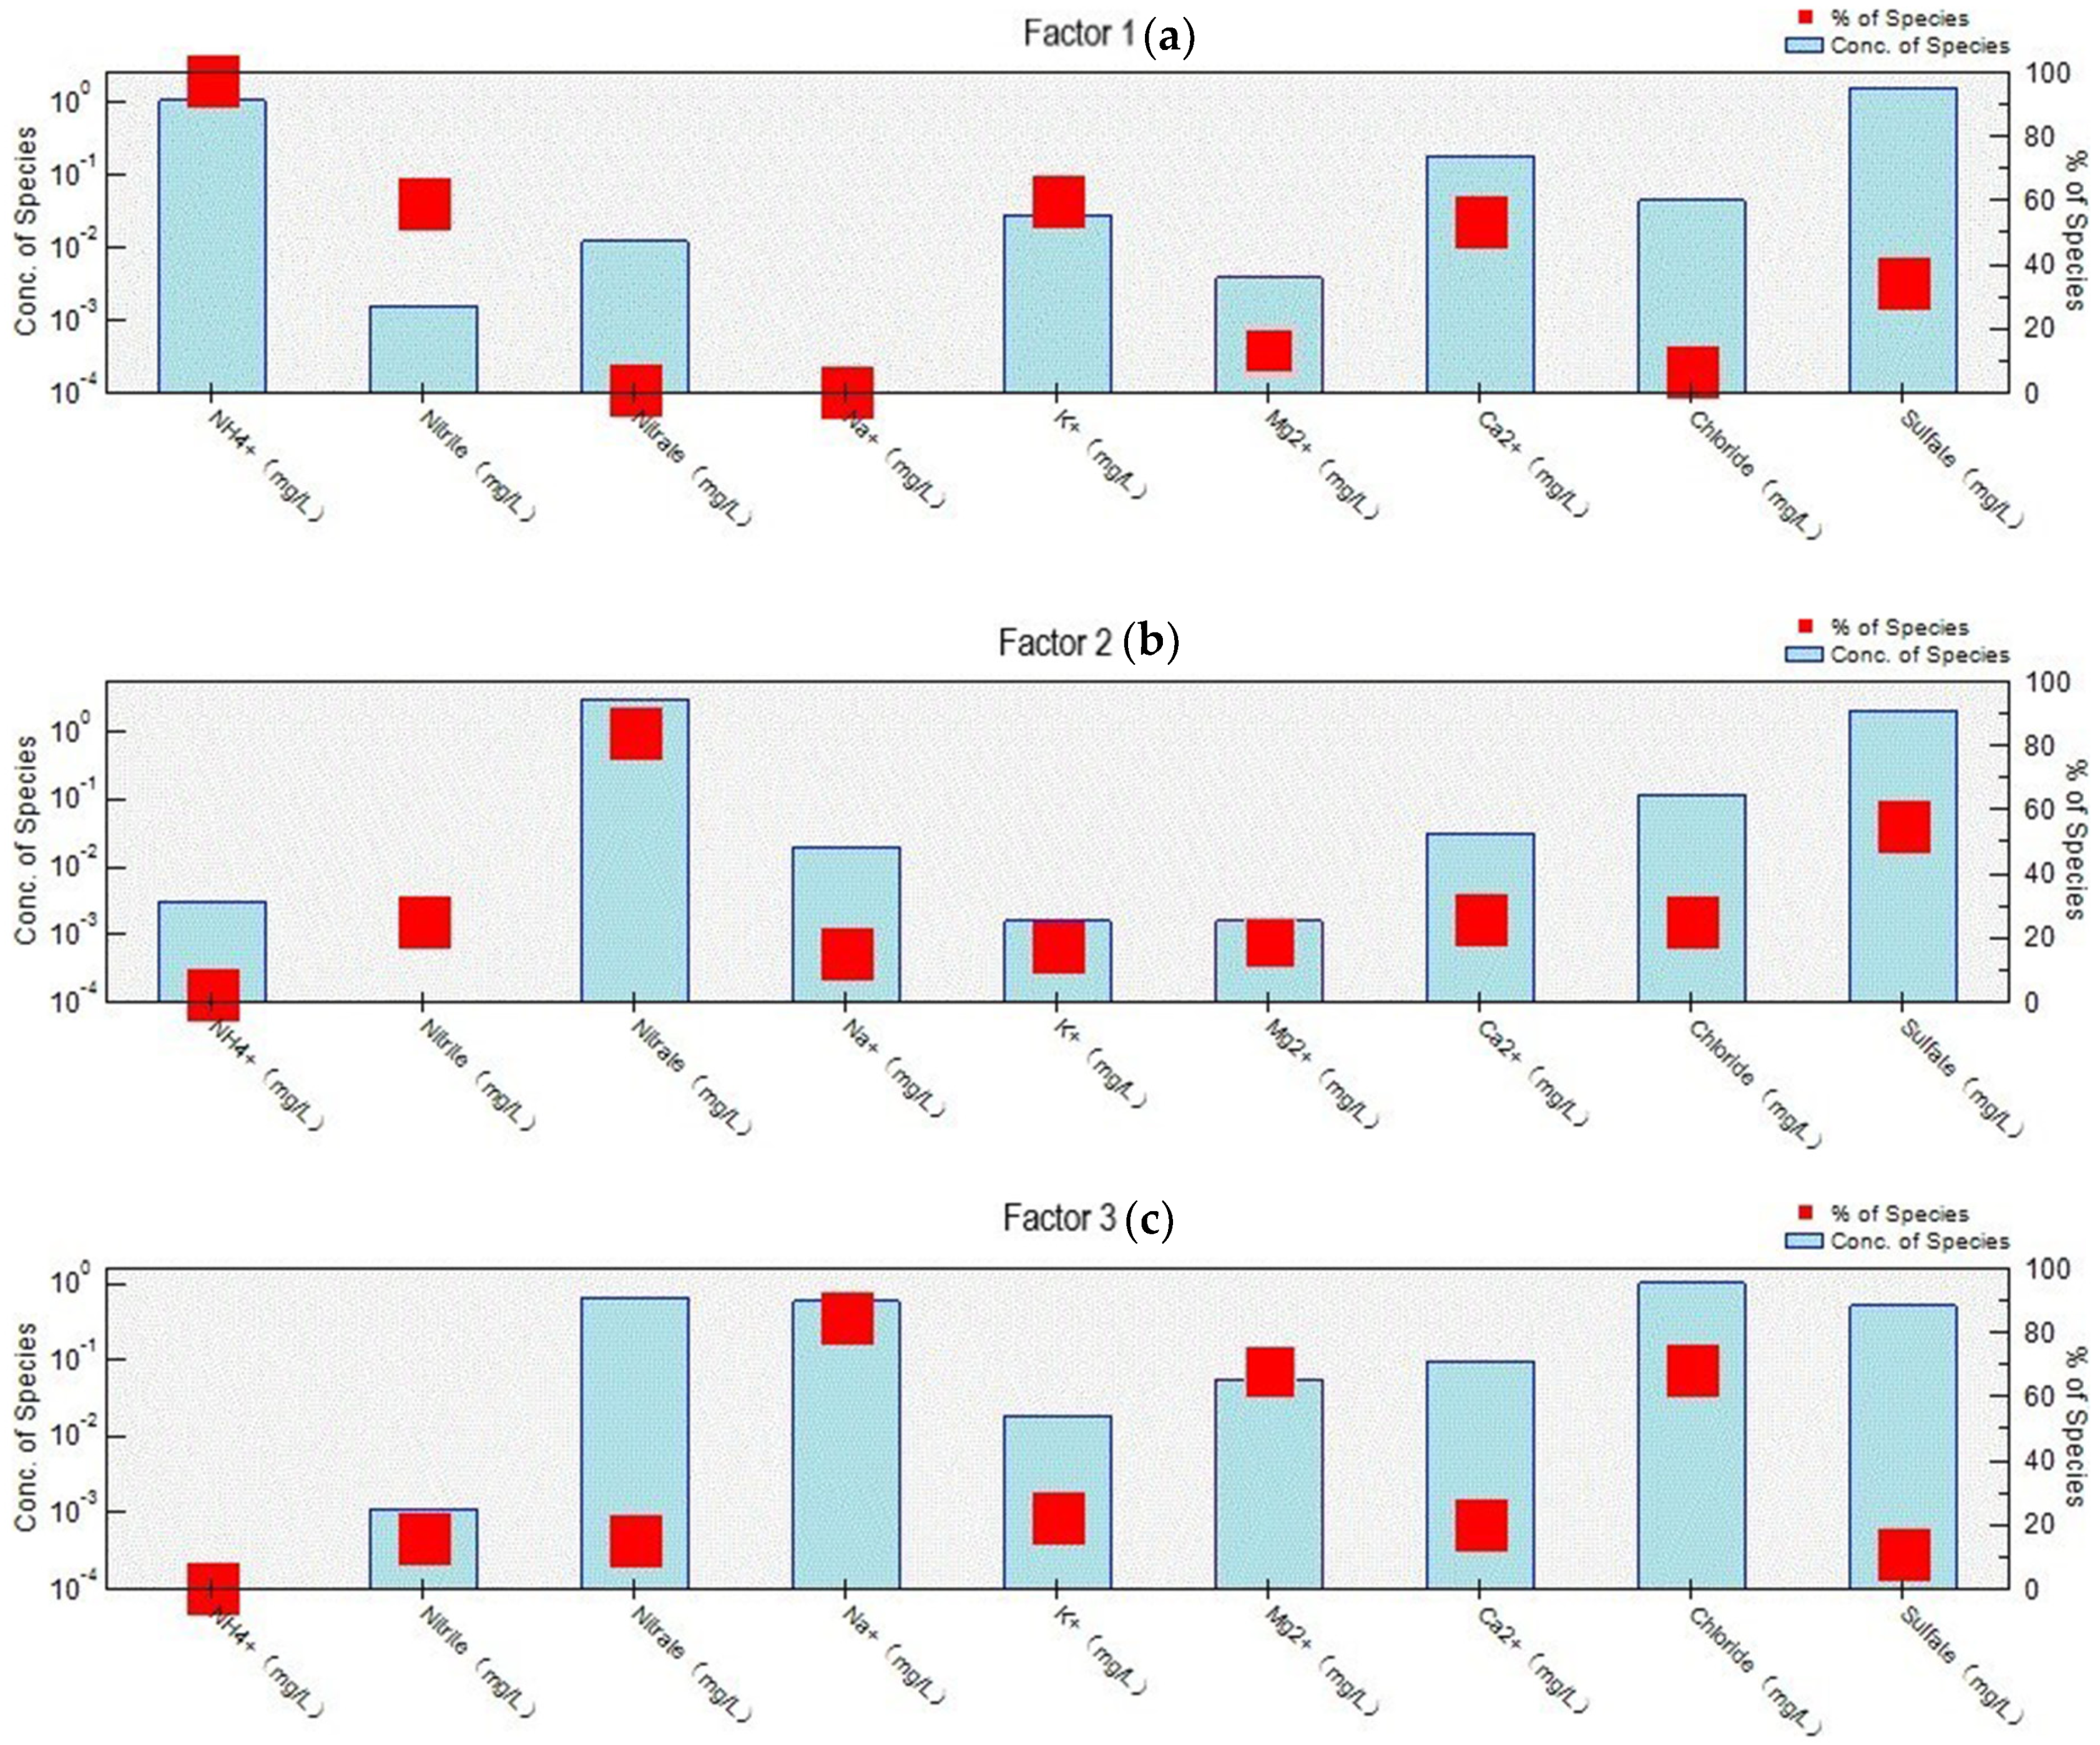
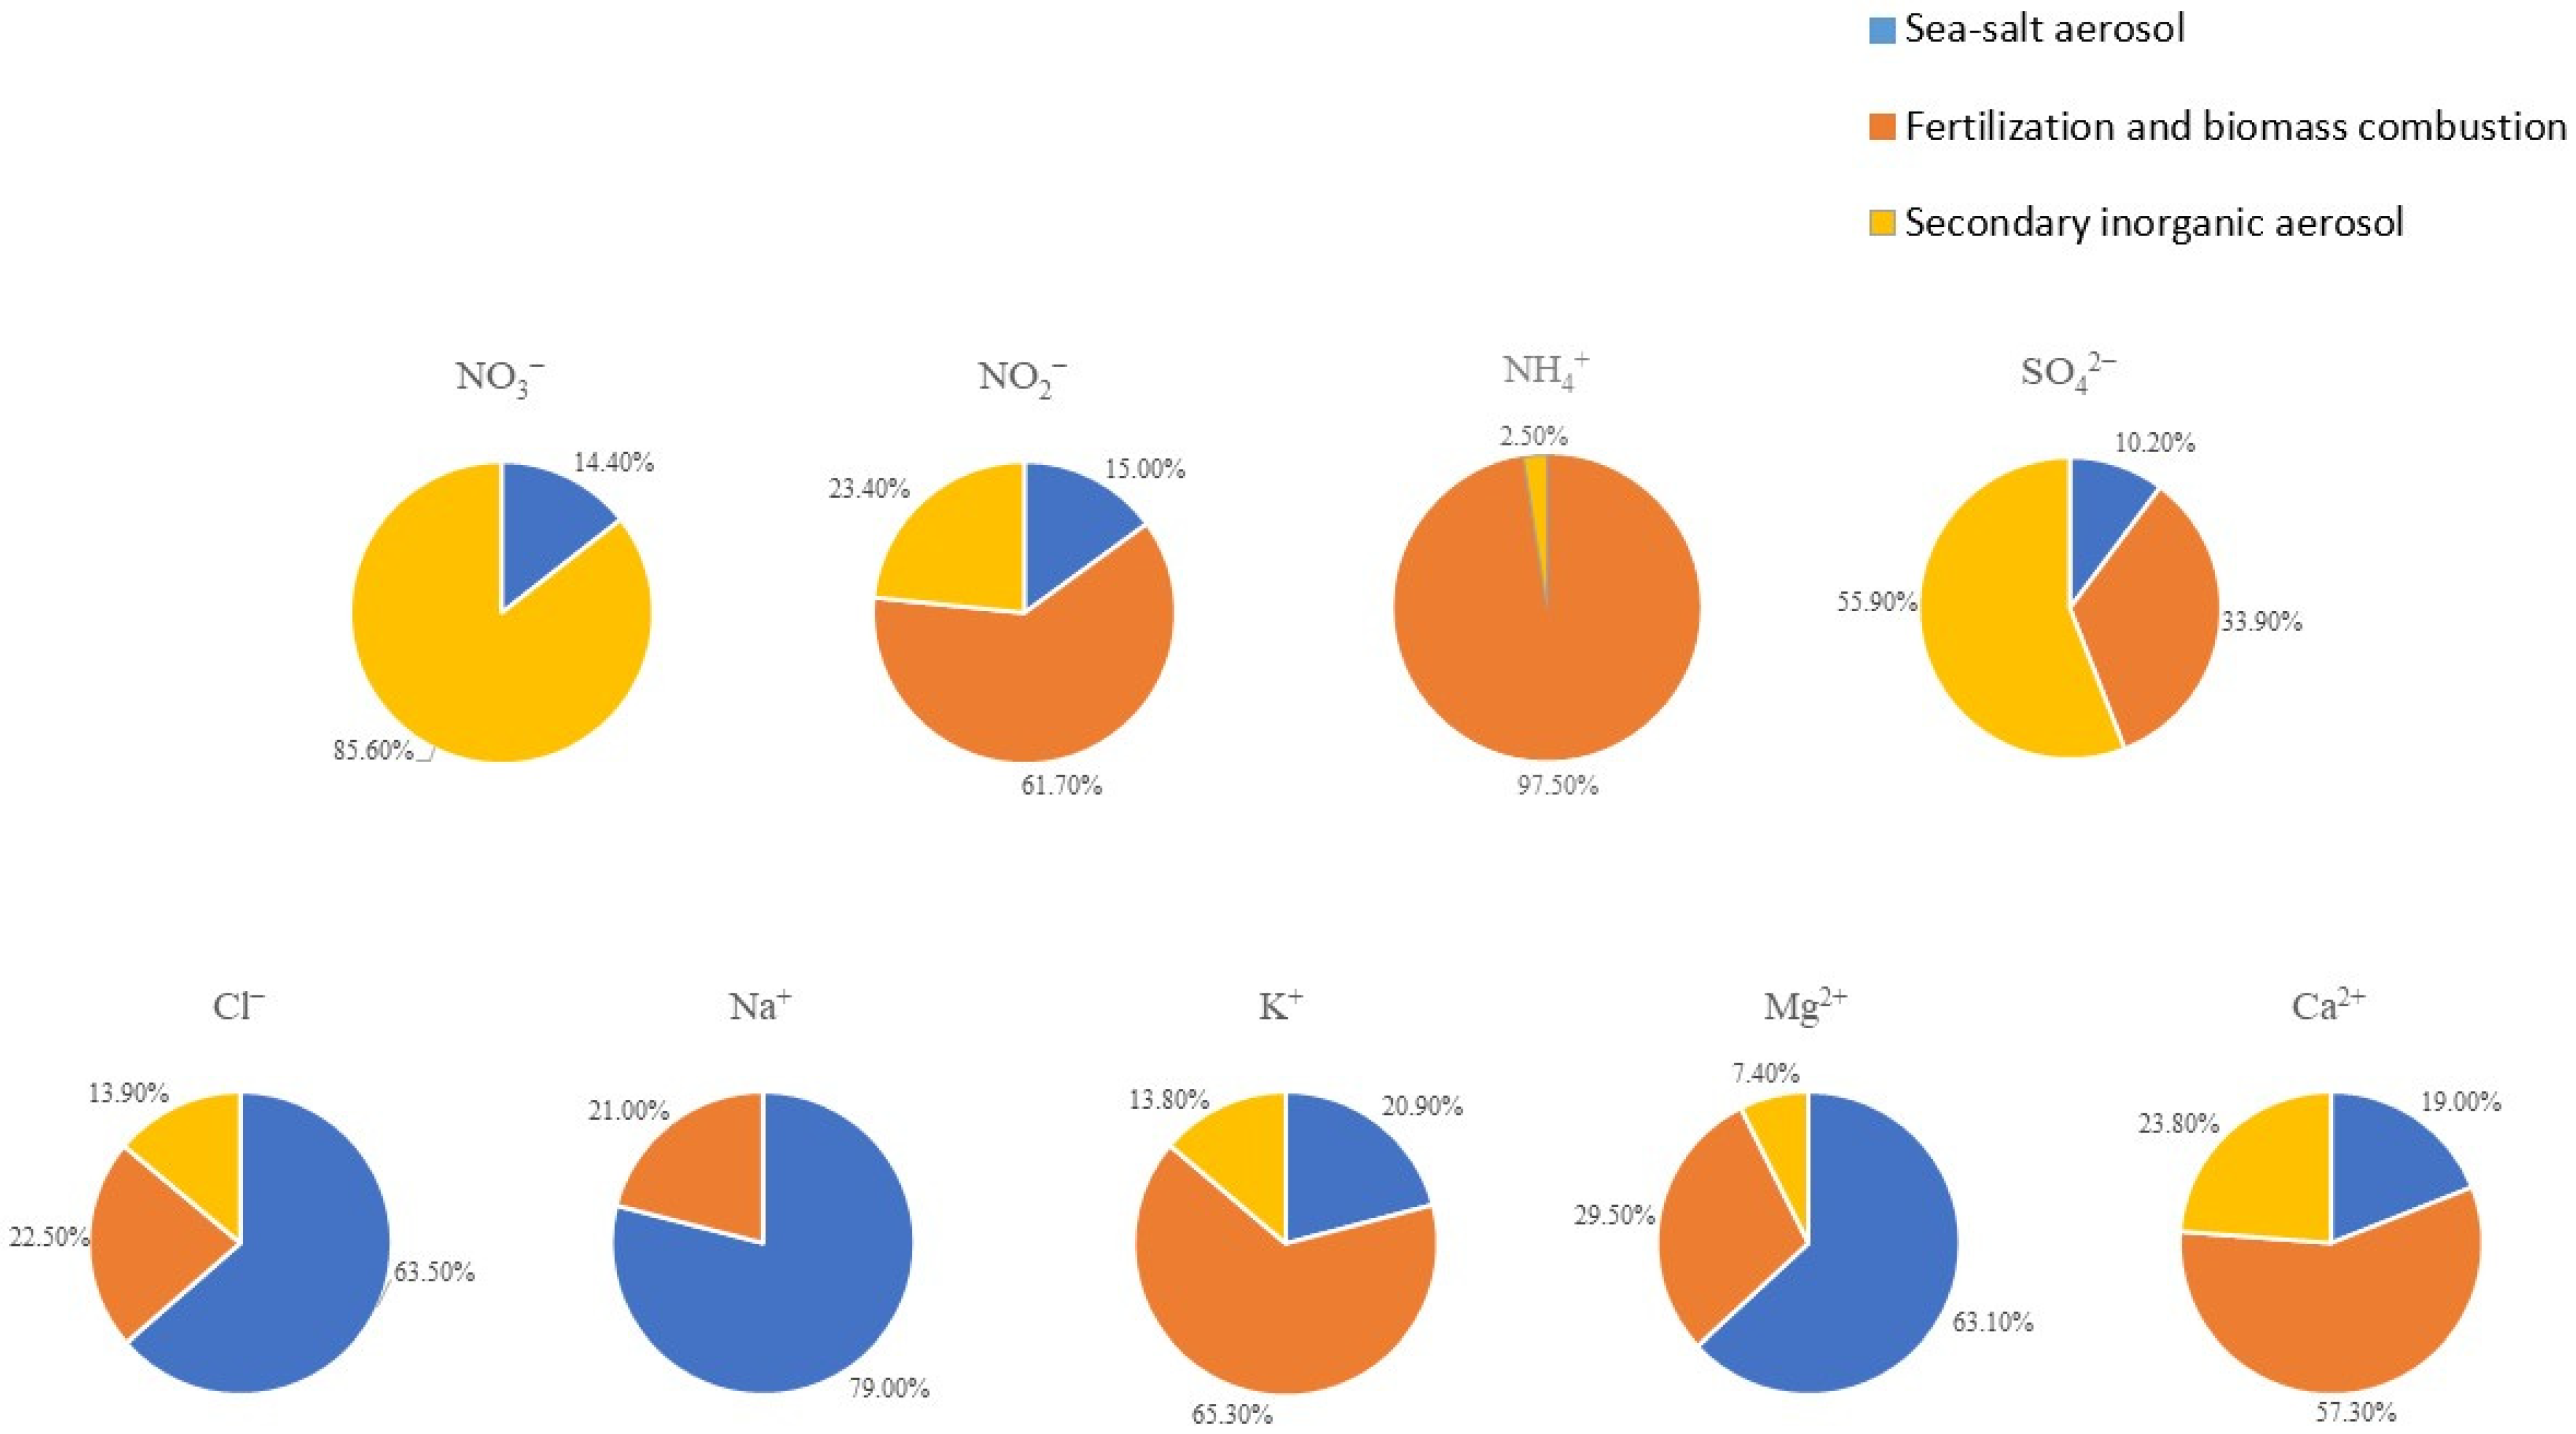
3.2. Sources of Fine Particles Using PMF
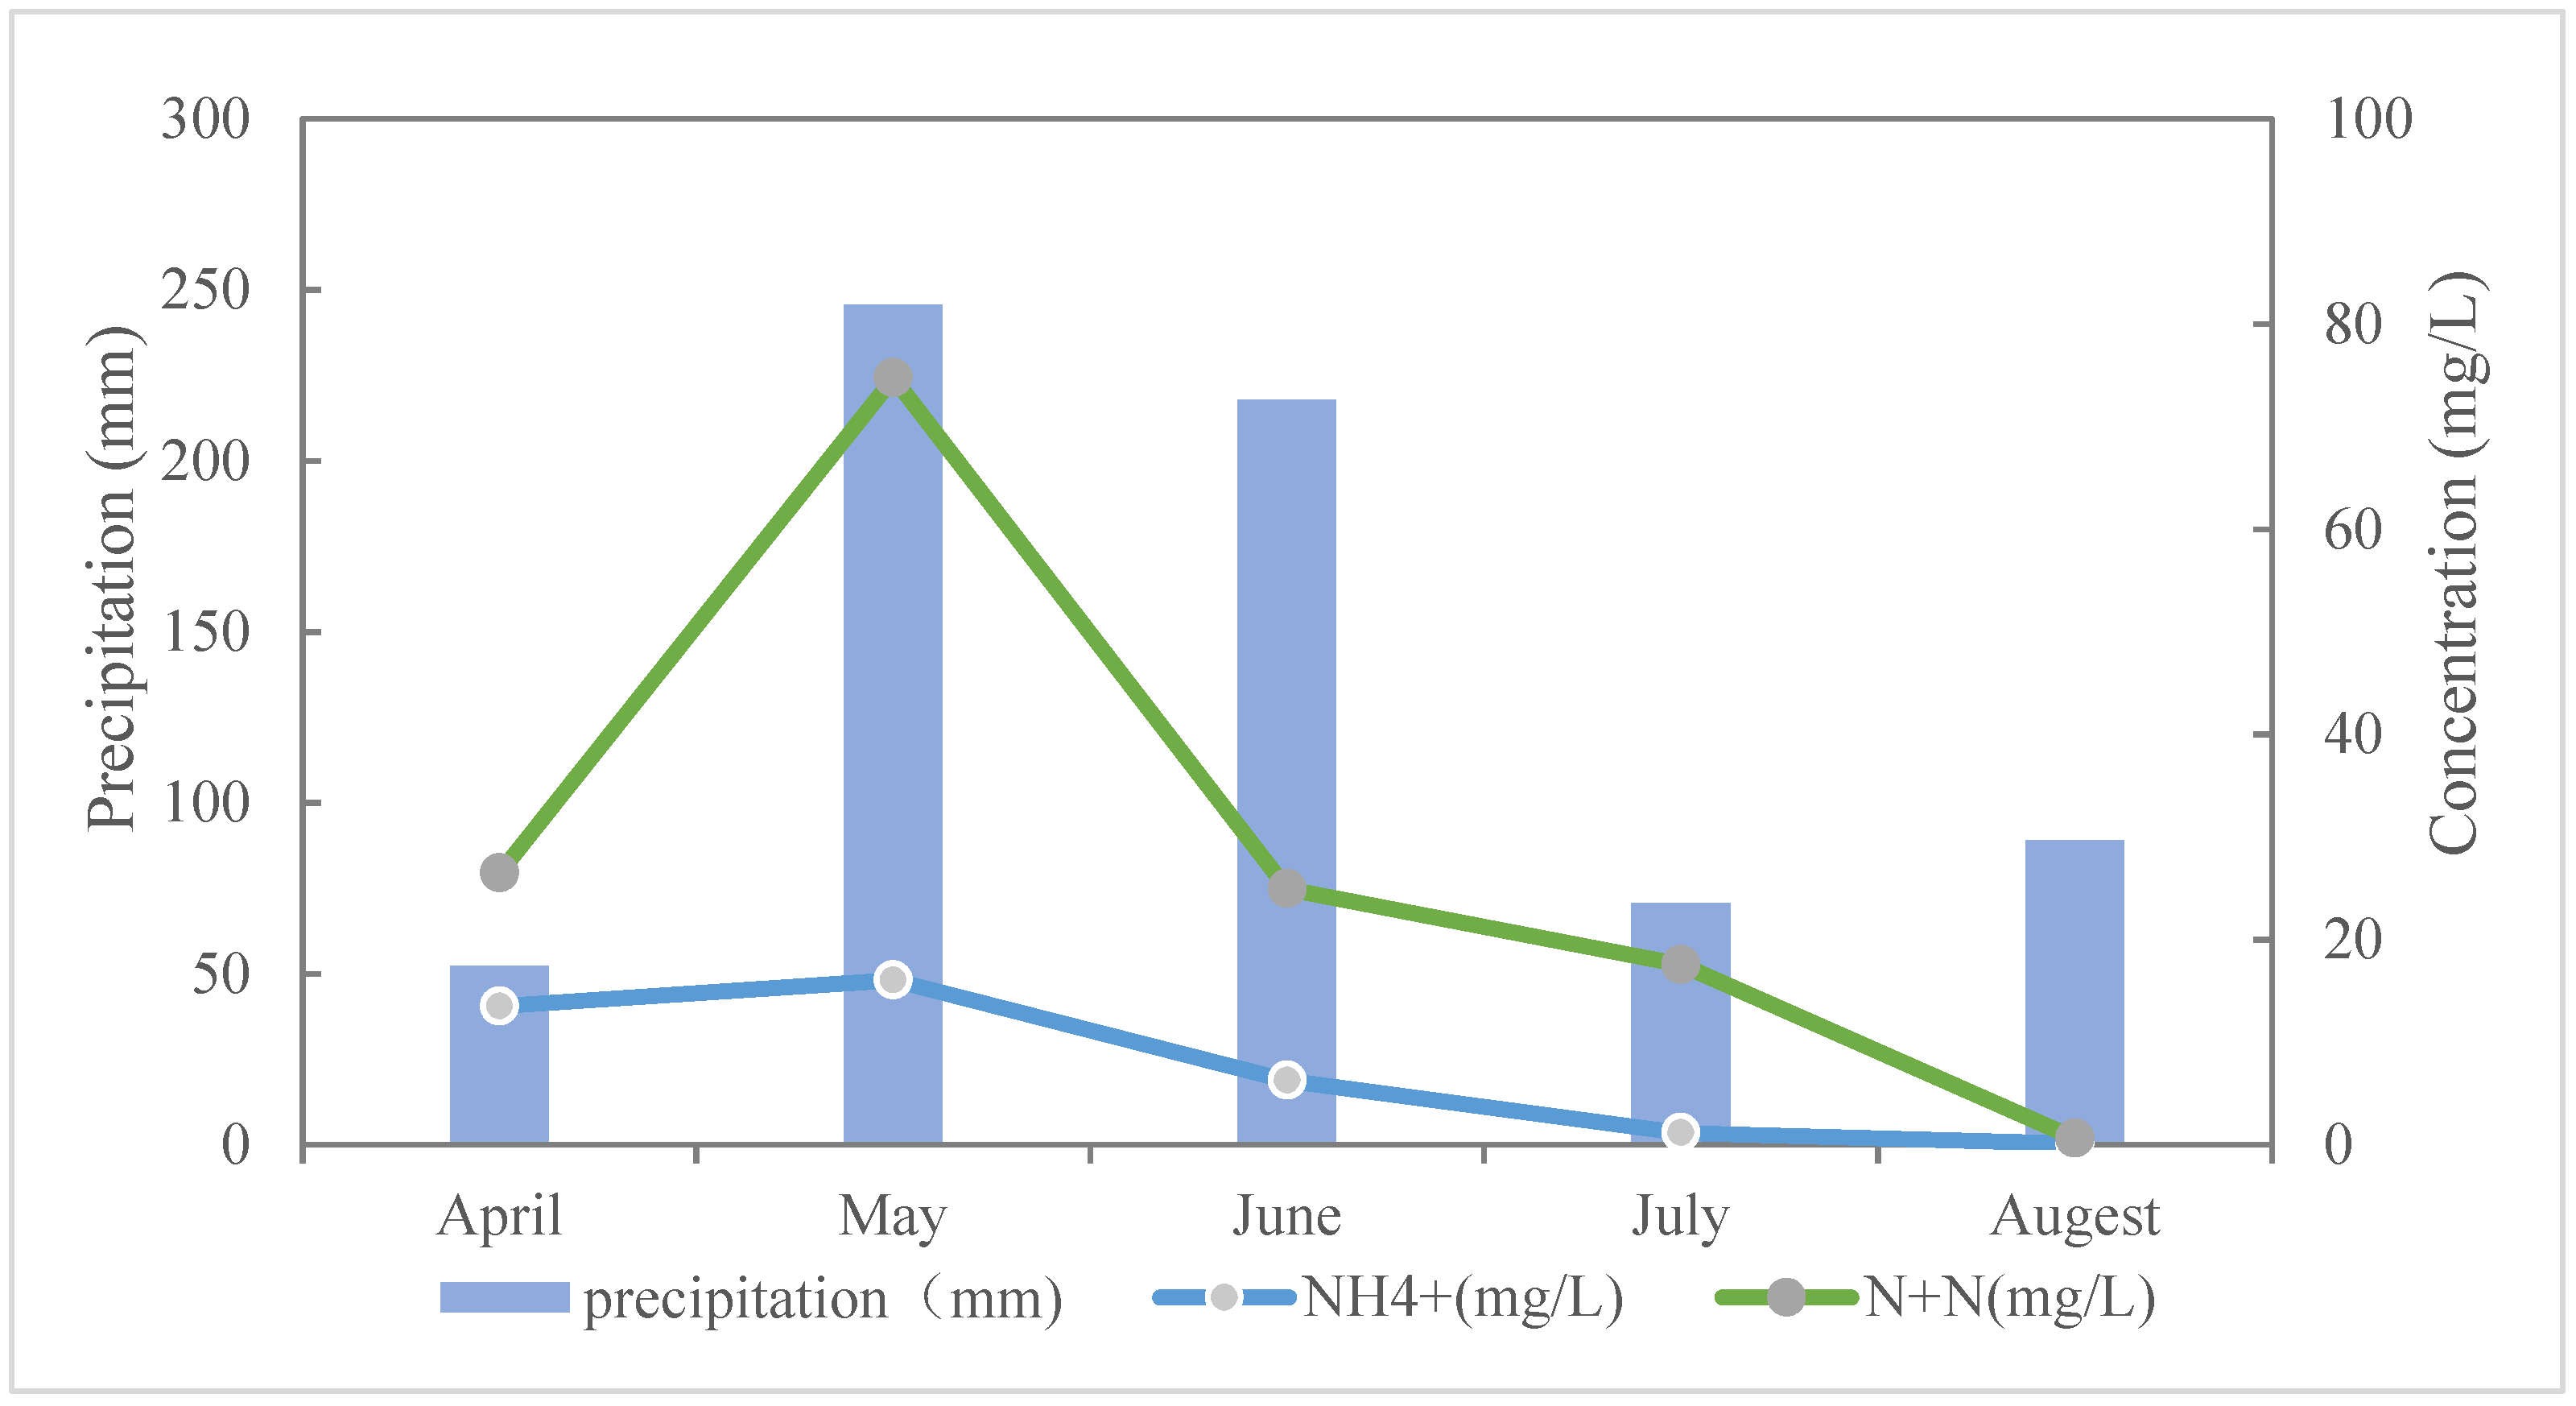
3.3. Nitrogen Wet Deposition
3.4. Wet N DepositionFlux
3.4.1. Calculated Flux Values
3.4.2. Calculated Flux Values for Coastal Areas of China
4. Conclusions
Author Contributions
Funding
Institutional Review Board Statement
Informed Consent Statement
Data Availability Statement
Acknowledgments
Conflicts of Interest
References
- Ti, C.; Xia, Y.; Pan, J.; Gu, G.; Yan, X. Nitrogen budget and surface water nitrogen load in Changshu: A case study in the Taihu Lake region of China. Nutr. Cycl. Agroecosyst. 2011, 91, 55. [Google Scholar] [CrossRef]
- Johansen, A.M.; Duncan, C.; Reddy, A.; Swain, N.; Sorey, M.; Nieber, A.; Agren, J.; Lenington, M.; Bolstad, D.; Samora, B.; et al. Precipitation chemistry and deposition at a high-elevation site in the Pacific Northwest United States (1989–2015). Atmos. Environ. 2019, 212, 221–230. [Google Scholar] [CrossRef]
- Streets, D.G.; Bond, T.C.; Carmichael, G.R.; Fernandes, S.D.; Fu, Q.; He, D.; Klimont, Z.; Nelson, S.M.; Tsai, N.Y.; Wang, M.Q.; et al. An inventory of gaseous and primary aerosol emissions in Asia in the year 2000. J. Geophys. Res. Atmos. 2003, 108. [Google Scholar] [CrossRef]
- Yu, W.T.; Jiang, C.M.; Ma, Q.; Xu, Y.G.; Zou, H.; Zhang, S.C. Observation of the nitrogen deposition in the lower Liaohe River Plain, Northeast China and assessing its ecological risk. Atmos. Res. 2011, 101, 460–468. [Google Scholar] [CrossRef]
- Russell, K.M.; Galloway, J.N.; Macko, S.A.; Moody, J.L.; Scudlark, J.R. Sources of nitrogen in wet deposition to the Chesapeake Bay region. Atmos. Environ. 1998, 32, 2453–2465. [Google Scholar] [CrossRef]
- Fenn, M.E.; Bytnerowicz, A.; Schilling, S.L.; Vallano, D.M.; Zavaleta, E.S.; Weiss, S.B.; Morozumi, C.; Geiser, L.H.; Hanks, K. On-road emissions of ammonia: An underappreciated source of atmospheric nitrogen deposition. Sci. Total Environ. 2018, 625, 909–919. [Google Scholar] [CrossRef] [Green Version]
- Decina, S.M.; Hutyra, L.R.; Templer, P.H. Hotspots of nitrogen deposition in the world’s urban areas: A global data synthesis. Front. Ecol. Environ. 2020, 18, 92–100. [Google Scholar] [CrossRef] [Green Version]
- Peretti, M.; Piñeiro, G.; Fernández Long, M.E.; Carnelos, D.A. Influence of the precipitation interval on wet atmospheric deposition. Atmos. Environ. 2020, 237, 117580. [Google Scholar] [CrossRef]
- Huang, P.; Zhang, J.; Zhu, A.; Xin, X.; Zhang, C.; Ma, D. Atmospheric deposition as an important nitrogen load to a typical agroecosystem in the Huang-Huai-Hai Plain. 1. Measurement and preliminary results. Atmos. Environ. 2011, 45, 3400–3405. [Google Scholar] [CrossRef]
- Xu, W.; Wen, Z.; Shang, B.; Dore, A.J.; Tang, A.; Xia, X.; Zheng, A.; Han, M.; Zhang, L.; Zhao, Y.; et al. Precipitation chemistry and atmospheric nitrogen deposition at a rural site in Beijing, China. Atmos. Environ. 2020, 223, 117253. [Google Scholar] [CrossRef]
- Huang, Z.; Wang, S.; Zheng, J.; Yuan, Z.; Ye, S.; Kang, D. Modeling inorganic nitrogen deposition in Guangdong province, China. Atmos. Environ. 2015, 109, 147–160. [Google Scholar] [CrossRef]
- Shen, J.; Li, Y.; Liu, X.; Luo, X.; Tang, H.; Zhang, Y.; Wu, J. Atmospheric dry and wet nitrogen deposition on three contrasting land use types of an agricultural catchment in subtropical central China. Atmos. Environ. 2013, 67, 415–424. [Google Scholar] [CrossRef]
- Lu, C.; Tian, H. Half-century nitrogen deposition increase across China: A gridded time-series data set for regional environmental assessments. Atmos. Environ. 2014, 97, 68–74. [Google Scholar] [CrossRef]
- Wu, S.-P.; Zhang, Y.-J.; Schwab, J.J.; Li, Y.-F.; Liu, Y.-L.; Yuan, C.-S. High-resolution ammonia emissions inventories in Fujian, China, 2009–2015. Atmos. Environ. 2017, 162, 100–114. [Google Scholar] [CrossRef]
- Wu, S.P.; Zhu, H.; Liu, Z.; Dai, L.H.; Zhang, N.; Schwab, J.J.; Yuan, C.S.; Yan, J.P. Nitrogen isotope composition of ammonium in PM(2.5) in the Xiamen, China: Impact of non-agricultural ammonia. Environ. Sci. Pollut. Res. Int. 2019, 26, 25596–25608. [Google Scholar] [CrossRef]
- Li, Y.; Cui, S.; Gao, B.; Tang, J.; Huang, W.; Huang, Y. Modeling nitrogen flow in a coastal city—A case study of Xiamen in 2015. Sci. Total Environ. 2020, 735, 139294. [Google Scholar] [CrossRef]
- Zhang, Y.; Wu, S.-Y. Fine Scale Modeling of Agricultural Air Quality over the Southeastern United States Using Two Air Quality Models. Part II. Sensitivity Studies and Policy Implications. Aerosol Air Qual. Res. 2013, 13, 1475–1491. [Google Scholar] [CrossRef] [Green Version]
- Backes, A.M.; Aulinger, A.; Bieser, J.; Matthias, V.; Quante, M. Ammonia emissions in Europe, part II: How ammonia emission abatement strategies affect secondary aerosols. Atmos. Environ. 2016, 126, 153–161. [Google Scholar] [CrossRef] [Green Version]
- Fu, X.; Wang, S.; Xing, J.; Zhang, X.; Wang, T.; Hao, J. Increasing Ammonia Concentrations Reduce the Effectiveness of Particle Pollution Control Achieved via SO2 and NOX Emissions Reduction in East China. Environ. Sci. Technol. Lett. 2017, 4, 221–227. [Google Scholar] [CrossRef]
- Wang, S.; Yan, Y.; Yu, R.; Shen, H.; Hu, G.; Wang, S. Influence of pollution reduction interventions on atmospheric PM2.5: A case study from the 2017 Xiamen. Atmos. Pollut. Res. 2021, 12, 101137. [Google Scholar] [CrossRef]
- Sun, L.; Zhang, X.; Zheng, J.; Zheng, Y.; Yuan, D.; Chen, W. Mercury concentration and isotopic composition on different atmospheric particles (PM10 and PM2.5) in the subtropical coastal suburb of Xiamen Bay, Southern China. Atmos. Environ. 2021, 261, 118604. [Google Scholar] [CrossRef]
- Zhao, S.; Chen, L.; Yan, J.; Chen, H. Characterization of lead-containing aerosol particles in Xiamen during and after Spring Festival by single-particle aerosol mass spectrometry. Sci. Total Environ. 2017, 580, 1257–1267. [Google Scholar] [CrossRef]
- Zhao, S.; Chen, L.; Yan, J.; Shi, P.; Li, Y.; Li, W. Characteristics of Particulate Carbon in Precipitation during the Rainy Season in Xiamen Island, China. Atmosphere 2016, 7, 140. [Google Scholar] [CrossRef] [Green Version]
- Norris, G.; Duvall, R.; Brown, S.; Bai, S. EPA Positive Matrix Factorization (PMF) 5.0 Fundamentals and User Guide. 2014. Available online: https://www.epa.gov/sites/default/files/2015-02/documents/pmf_5.0_user_guide.pdf (accessed on 10 September 2021).
- Chang, D.; Wang, Z.; Guo, J.; Li, T.; Liang, Y.; Kang, L.; Xia, M.; Wang, Y.; Yu, C.; Yun, H.; et al. Characterization of organic aerosols and their precursors in southern China during a severe haze episode in January 2017. Sci. Total Environ. 2019, 691, 101–111. [Google Scholar] [CrossRef] [PubMed]
- Wu, S.-P.; Dai, L.-H.; Wei, Y.; Zhu, H.; Zhang, Y.-J.; Schwab, J.J.; Yuan, C.-S. Atmospheric ammonia measurements along the coastal lines of Southeastern China: Implications for inorganic nitrogen deposition to coastal waters. Atmos. Environ. 2018, 177, 1–11. [Google Scholar] [CrossRef]
- Duan, F.; Liu, X.; Yu, T.; Cachier, H. Identification and estimate of biomass burning contribution to the urban aerosol organic carbon concentrations in Beijing. Atmos. Environ. 2004, 38, 1275–1282. [Google Scholar] [CrossRef]
- Roth, B.; Okada, K. On the modification of sea-salt particles in the coastal atmosphere. Atmos. Environ. 1998, 32, 1555–1569. [Google Scholar] [CrossRef]
- AzadiAghdam, M.; Braun, R.A.; Edwards, E.-L.; Bañaga, P.A.; Cruz, M.T.; Betito, G.; Cambaliza, M.O.; Dadashazar, H.; Lorenzo, G.R.; Ma, L.; et al. On the nature of sea salt aerosol at a coastal megacity: Insights from Manila, Philippines in Southeast Asia. Atmos. Environ. 2019, 216. [Google Scholar] [CrossRef]
- Zheng, L.; Chen, W.; Jia, S.; Wu, L.; Zhong, B.; Liao, W.; Chang, M.; Wang, W.; Wang, X. Temporal and spatial patterns of nitrogen wet deposition in different weather types in the Pearl River Delta (PRD), China. Sci. Total Environ. 2020, 740, 139936. [Google Scholar] [CrossRef]
- Hara, H. Acid deposition chemistry in Asia, Europe, and North America. Prog. Nucl. Energy 1998, 32, 331–338. [Google Scholar] [CrossRef]
- Fakhraei, H.; Driscoll, C.T.; Renfro, J.R.; Kulp, M.A.; Blett, T.F.; Brewer, P.F.; Schwartz, J.S. Critical loads and exceedances for nitrogen and sulfur atmospheric deposition in Great Smoky Mountains National Park, United States. Ecosphere 2016, 7, e01466. [Google Scholar] [CrossRef]
- Heng, Z. Study on Pollution Characteristics and Sources of Ammonia and Atmospheric Nitrogen Deposition Flux in Xiamen Bay. Master’s Thesis, Xiamen University, Xiamen, China, 2019. Available online: https://oversea.cnki.net/KCMS/detail/detail.aspx?dbcode=CMFD&dbname=CMFD202002&filename=1019064510.nh&uniplatform=NZKPT&v=3x5tH%25mmd2BbNTR2yBo902x3N8tPhHuZHp1bUMmWhUyr0aHgMwS%25mmd2BSNpUZ18cPajg7gdtJ (accessed on 10 September 2021).
- Park, G.-H.; Lee, S.-E.; Kim, Y.-I.; Kim, D.; Lee, K.; Kang, J.; Kim, Y.-H.; Kim, H.; Park, S.; Kim, T.-W. Atmospheric deposition of anthropogenic inorganic nitrogen in airborne particles and precipitation in the East Sea in the northwestern Pacific Ocean. Sci. Total Environ. 2019, 681, 400–412. [Google Scholar] [CrossRef] [PubMed]
- Leng, Q.; Cui, J.; Zhou, F.; Du, K.; Zhang, L.; Fu, C.; Liu, Y.; Wang, H.; Shi, G.; Gao, M.; et al. Wet-only deposition of atmospheric inorganic nitrogen and associated isotopic characteristics in a typical mountain area, southwestern China. Sci. Total Environ. 2018, 616–617, 55–63. [Google Scholar] [CrossRef]
- Qi, J.H.; Shi, J.H.; Gao, H.W.; Sun, Z. Atmospheric dry and wet deposition of nitrogen species and its implication for primary productivity in coastal region of the Yellow Sea, China. Atmos. Environ. 2013, 81, 600–608. [Google Scholar] [CrossRef]
- Zhang, Y.; Liu, X.J.; Fangmeier, A.; Goulding, K.T.W.; Zhang, F.S. Nitrogen inputs and isotopes in precipitation in the North China Plain. Atmos. Environ. 2008, 42, 1436–1448. [Google Scholar] [CrossRef]
- Luo, X.S.; Liu, P.; Tang, A.H.; Liu, J.Y.; Zong, X.Y.; Zhang, Q.; Kou, C.L.; Zhang, L.J.; Fowler, D.; Fangmeier, A.; et al. An evaluation of atmospheric Nr pollution and deposition in North China after the Beijing Olympics. Atmos. Environ. 2013, 74, 209–216. [Google Scholar] [CrossRef]
- Zhao, X.; Yan, X.; Xiong, Z.; Xie, Y.; Xing, G.; Shi, S.; Zhu, Z. Spatial and Temporal Variation of Inorganic Nitrogen Wet Deposition to the Yangtze River Delta Region, China. Water Air Soil Pollut. 2009, 203, 277–289. [Google Scholar] [CrossRef]
- Jia, G.; Chen, F. Monthly variations in nitrogen isotopes of ammonium and nitrate in wet deposition at Guangzhou, south China. Atmos. Environ. 2010, 44, 2309–2315. [Google Scholar] [CrossRef]
- Xie, Y.; Xiong, Z.; Xing, G.; Yan, X.; Shi, S.; Sun, G.; Zhu, Z. Source of nitrogen in wet deposition to a rice agroecosystem at Tai lake region. Atmos. Environ. 2008, 42, 5182–5192. [Google Scholar] [CrossRef]
- Kuang, F.; Liu, X.; Zhu, B.; Shen, J.; Pan, Y.; Su, M.; Goulding, K. Wet and dry nitrogen deposition in the central Sichuan Basin of China. Atmos. Environ. 2016, 143, 39–50. [Google Scholar] [CrossRef]
- Chang, C.-T.; Wang, C.-P.; Huang, J.-C.; Wang, L.-J.; Liu, C.-P.; Lin, T.-C. Trends of two decadal precipitation chemistry in a subtropical rainforest in East Asia. Sci. Total Environ. 2017, 605–606, 88–98. [Google Scholar] [CrossRef]
- Du, E.; de Vries, W.; Galloway, J.N.; Hu, X.; Fang, J. Changes in wet nitrogen deposition in the United States between 1985 and 2012. Environ. Res. Lett. 2014, 9, 095004. [Google Scholar] [CrossRef]
- Holland, E.A.; Braswell, B.H.; Sulzman, J.; Lamarque, J.-F. Nitrogen Deposition onto The United States and Western Europe: Synthesis of Observations and Models. Ecol. Appl. 2005, 15, 38–57. [Google Scholar] [CrossRef] [Green Version]
- Fenn, M.E.; Bytnerowicz, A.; Liptzin, D. Nationwide Maps of Atmospheric Deposition Are Highly Skewed When Based Solely on Wet Deposition. BioScience 2012, 62, 621. [Google Scholar]
- Greaver, T.L.; Sullivan, T.J.; Herrick, J.D.; Barber, M.C.; Baron, J.S.; Cosby, B.J.; Deerhake, M.E.; Dennis, R.L.; Dubois, J.-J.B.; Goodale, C.L.; et al. Ecological effects of nitrogen and sulfur air pollution in the US: What do we know? Front. Ecol. Environ. 2012, 10, 365–372. [Google Scholar] [CrossRef]
- Vet, R.; Artz, R.S.; Carou, S.; Shaw, M.; Ro, C.-U.; Aas, W.; Baker, A.; Bowersox, V.C.; Dentener, F.; Galy-Lacaux, C.; et al. A global assessment of precipitation chemistry and deposition of sulfur, nitrogen, sea salt, base cations, organic acids, acidity and pH, and phosphorus. Atmos. Environ. 2014, 93, 3–100. [Google Scholar] [CrossRef]


| Wet Deposition | ||||
|---|---|---|---|---|
| Month | NH4+ | NO3− | NO2− | N + N |
| Apr | 96.7 | 54.8 | 0.3 | 55.2 |
| May | 76.5 | 507.5 | 0.9 | 508.4 |
| Jun | 99.8 | 200.9 | 0.3 | 201.2 |
| Jul | 22.3 | 46.0 | 0.5 | 46.5 |
| Aug | 3.0 | 4.6 | 0.1 | 4.7 |
| Total | 298.4 | 813.9 | 2.1 | 815.9 |
| Average | 59.7 | 162.8 | 0.4 | 163.2 |
| Source | NH4+ | N + N | Location | Sampling Periods |
|---|---|---|---|---|
| [31] | 20.6–19.6 | 12.6–8.6 * | PRD (Pearl River Delta) region | 2010 to 2017 |
| [19] | 12.99 | 7.68 | Jiao Zhou Bay, Yellow Sea | 2015 to 2016 |
| [40] | 25.1 | 27.4 * | Guangzhou | 2008 |
| [33] | 1.96–3.78 | 2.38–3.36 | East Sea | March 2014 to February 2016 |
Publisher’s Note: MDPI stays neutral with regard to jurisdictional claims in published maps and institutional affiliations. |
© 2021 by the authors. Licensee MDPI, Basel, Switzerland. This article is an open access article distributed under the terms and conditions of the Creative Commons Attribution (CC BY) license (https://creativecommons.org/licenses/by/4.0/).
Share and Cite
Feng, Y.; Zhao, S.; Wang, S.; Lin, Q.; Luo, Y.; Xu, S.; Yang, H.; Shi, J.; Zhang, M.; Jiao, L.; et al. Characteristics of Atmospheric Inorganic Nitrogen Wet Deposition in Coastal Urban Areas of Xiamen, China. Atmosphere 2021, 12, 1447. https://doi.org/10.3390/atmos12111447
Feng Y, Zhao S, Wang S, Lin Q, Luo Y, Xu S, Yang H, Shi J, Zhang M, Jiao L, et al. Characteristics of Atmospheric Inorganic Nitrogen Wet Deposition in Coastal Urban Areas of Xiamen, China. Atmosphere. 2021; 12(11):1447. https://doi.org/10.3390/atmos12111447
Chicago/Turabian StyleFeng, Yao, Shuhui Zhao, Shanshan Wang, Qi Lin, Yang Luo, Suqing Xu, Hang Yang, Jun Shi, Miming Zhang, Liping Jiao, and et al. 2021. "Characteristics of Atmospheric Inorganic Nitrogen Wet Deposition in Coastal Urban Areas of Xiamen, China" Atmosphere 12, no. 11: 1447. https://doi.org/10.3390/atmos12111447
APA StyleFeng, Y., Zhao, S., Wang, S., Lin, Q., Luo, Y., Xu, S., Yang, H., Shi, J., Zhang, M., Jiao, L., & Yan, J. (2021). Characteristics of Atmospheric Inorganic Nitrogen Wet Deposition in Coastal Urban Areas of Xiamen, China. Atmosphere, 12(11), 1447. https://doi.org/10.3390/atmos12111447