Article

Climatology and Formation Environments of Severe Convective Windstorms and Tornadoes in the Perm Region (Russia) in 1984–2020

by
Andrey Shikhov
1,2,
Alexander Chernokulsky
2,3,*,
Nikolay Kalinin
1,
Alexey Bykov
1 and
Evgeniya Pischalnikova
1,4
1
Faculty of Geography, Perm State University, 614068 Perm, Russia
2
A.M. Obukhov Institute of Atmospheric Physics, Russian Academy of Sciences, 119017 Moscow, Russia
3
Institute of Geography, Russian Academy of Sciences, 119017 Moscow, Russia
4
Perm Center for Hydrometeorology and Environmental Monitoring, 614030 Perm, Russia
*
Author to whom correspondence should be addressed.
Atmosphere 2021, 12(11), 1407; https://doi.org/10.3390/atmos12111407
Submission received: 28 August 2021 / Revised: 21 October 2021 / Accepted: 22 October 2021 / Published: 26 October 2021
(This article belongs to the Special Issue Meteorological Extrema and Storm Simulations in Eurasia)

Abstract

:
Severe convective windstorms and tornadoes regularly hit the territory of Russia causing substantial damage and fatalities. An analysis of the climatology and formation environments of these events is essential for risk assessments, forecast improvements and identifying of links with the observed climate change. In this paper, we present an analysis of severe convective windstorms, i.e., squalls and tornadoes reported between 1984 and 2020 in the Perm region (northeast of European Russia), where a local maximum in the frequency of such events was previously found. The analysed database consists of 165 events and includes 100 squalls (convective windstorms), 59 tornadoes, and six cases with both tornadoes and squalls. We used various information to compile the database including weather station reports, damage surveys, media reports, previously presented databases, and satellite images for windthrow. We found that the satellite images of damaged forests are the main data source on tornadoes, but their role is substantially lower for windstorm events due to the larger spatial and temporal scale of such events. Synoptic-scale environments and associated values of convective indices were determined for each event with a known date and time. Similarities and differences for the formation conditions of tornadoes and windstorms were revealed. Both squalls and tornadoes occur mostly on rapidly moving cold fronts or on waving quasi-stationary fronts, associated with low-pressure systems. Analyses of 72-h air parcel backward trajectories shows that the Caspian and Aral Seas are important sources of near-surface moisture for the formation of both squalls and tornadoes. Most of these events are formed within high CAPE and high shear environments, but tornadic storms are generally characterised by a higher wind shear and helicity. We also differentiated convective storms that caused forest damage and those did not. We found the composite parameter WMAXSHEAR is the best discriminator between these two groups. In general, storm events causing windthrow mainly occur under conditions more favourable for deep well-organised convection. Thus, forest damage can be considered as an indicator of the storm severity in the Perm region and in adjacent regions with forest-covered area exceeding 50%.

1. Introduction

Severe convective windstorms and tornadoes are among the most destructive weather events at mid-latitudes [1,2]. They are most frequent in the U.S. [1,3,4], but are commonly observed in other parts of the world, including Europe and Northern Eurasia, where they have been attracting increasing scientific attention [2,3,4,5,6,7].
Over the last two decades, the volume of available information on hazardous convective weather events has progressively increased due to the development of the Internet and widespread use of smartphones and social networks [2,7,8]. In addition, an increasing availability of satellite images from Landsat [9] or those from high-resolution satellites have opened the new opportunities for post-event analyses of windstorms and tornadoes based on forest damage assessment [7,10,11,12,13,14]. Using this variety of sources, the climatologies of tornadoes have been presented for several European [14,15,16,17] and Asian [18,19] countries and the entirety of Europe [8]. The climatology of non-tornadic convective windstorms has also been presented for the whole of Europe [6] and separately for Germany [20] and European Russia [10].
The territory of Russia is regularly affected by severe convective windstorms (squalls) and tornadoes, causing substantial economic loss, fatalities and injuries, and large-scale damage to forests [7,10,11,21]. Particularly, considerable damage and large number of fatalities are associated with both strong tornado outbreaks [22] and non-tornadic convective winds [23]. In general, among the Russian regions, the European part of Russia is characterised by the highest tornado risk [24]; however, strong tornadoes also occur near the Ural Mountains [25,26,27,28].
The environments of formation of squalls and tornadoes in Russia have been studied relatively less than those in Europe and the U.S. Most recent works have focused on single severe squall and tornado events [25,26,27,28,29,30,31,32], or on small samples of the most substantial events [33,34]. In turn, in the U.S. and Europe, many studies on the squall and tornado environments have been performed based on large samples that include hundreds or thousands of events. The so-called convective instability indices are estimated based on atmospheric sounding data [35,36,37], reanalysis data [38,39,40,41], or a combination of these two sources [42,43].
In this study, we present similar analyses for the northeastern part of European Russia which is characterised by a high frequency of squalls and tornadoes [7,10,11,44]. Particularly, we focus on the Perm region that has a relatively high population density, which leads to increase risks associated with hazardous weather events. We present a new dataset of severe convective windstorms and tornadoes from various information sources of storm events and related damage, particularly to forest. We analyse the patterns of synoptic-scale environments and convective indices contributing to the formation of events from this dataset, separately for tornadoes and linear windstorms, and for events with and without forest damage.
This paper is organized as follows: In Section 2, we provide more rationale for region choosing and existent studies for this area. This section also contains the information on structure of storm events database and data sources, and the information on methods that used for analysis of synoptic- and meso-scale formation environments. Section 3 presents the main results of the study including analysis of spatial and temporal distribution of squall and tornado events, storm-related damage characteristics, synoptic-scale environments and ingredients contributing to squall and tornado formation, analysis of backward trajectories. In Section 4, the obtained results are discussed and summarised.

2. Materials and Methods

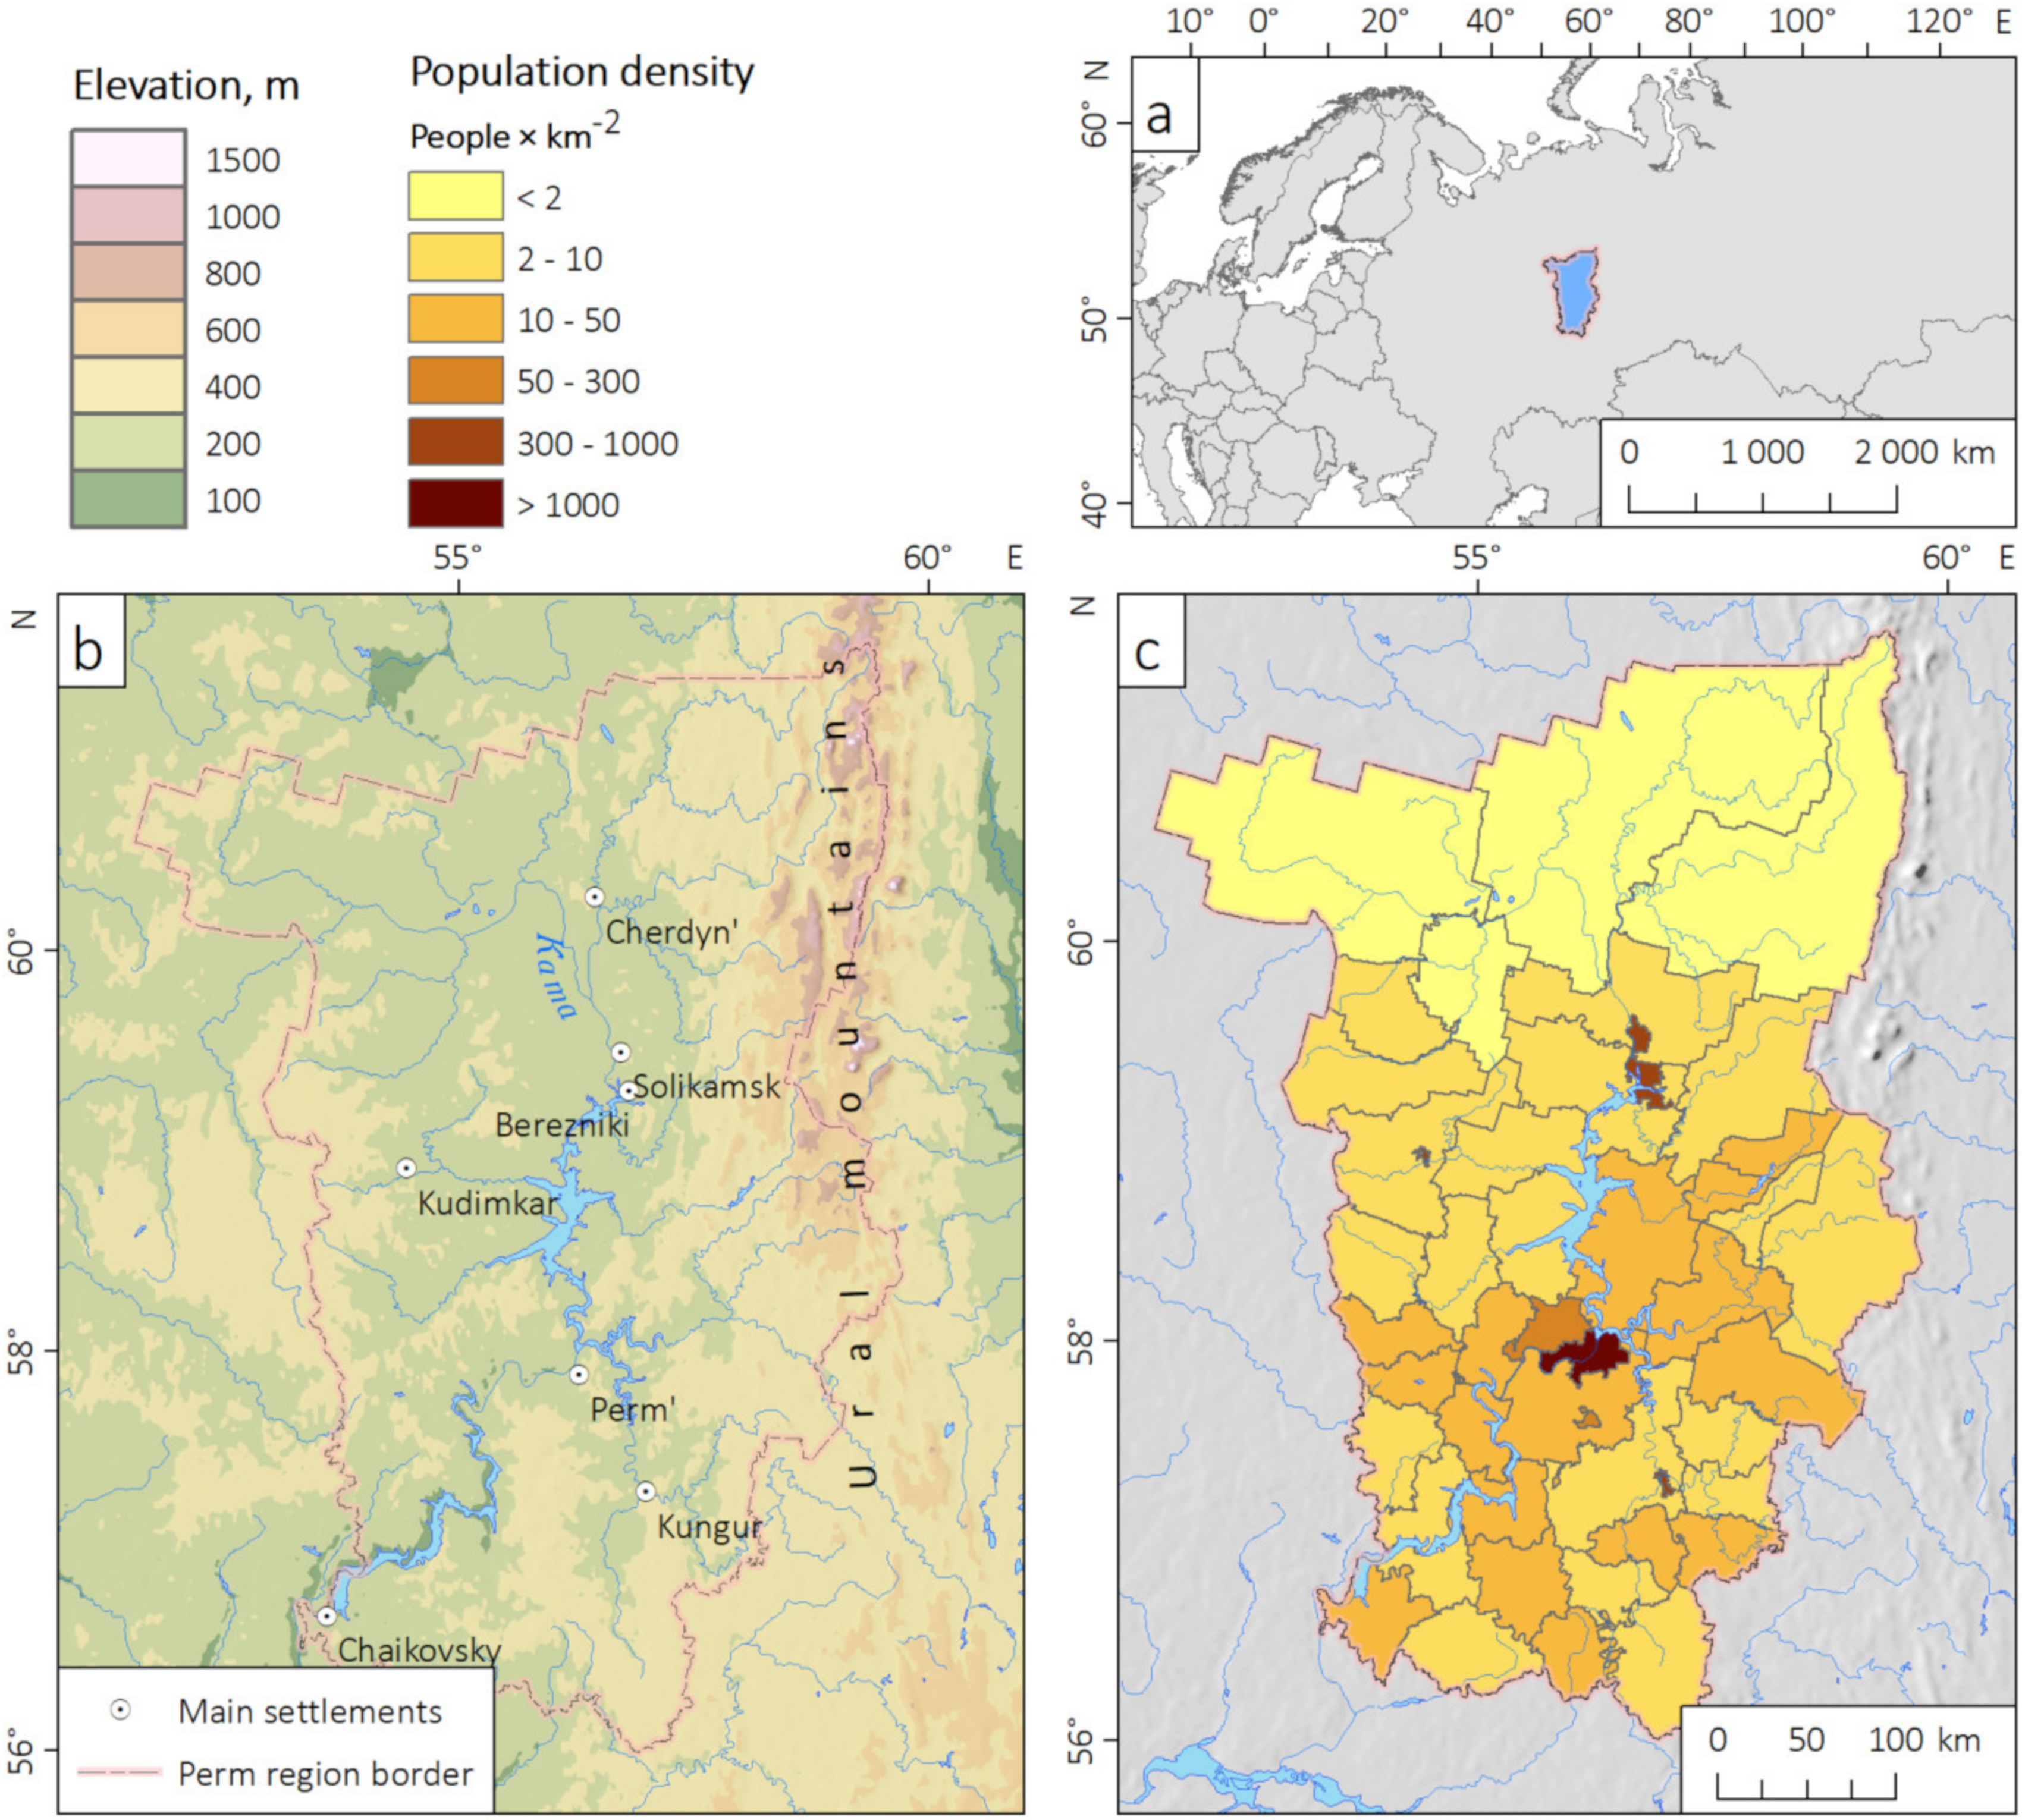
2.1. Region of Study

The Perm region (PR) is located in the eastern part of European Russia (Figure 1). It has an area of 160.6 × 10³ km2 and a population of 2.58 × 10⁶ people [45]. The eastern and central parts of PR are located within the East-European Plain, and the Ural Mountains extend in its eastern part, with a maximum elevation up to 1469 m a.s.l. Forests cover 78% of the region, with the forest-covered area ranging from 40–50% in the southwest to 90% in the northeast [46]. Such a large forested area is favourable for identifying windstorm- and tornado damage tracks based on windthrow data [11]. Evapotranspiration from forested surface in summer season provide an important source of atmospheric moisture [47,48]. The complex topography of Ural Mountains may also contribute to deep convection intensification, while large water bodies (including two large reservoirs, Kamskoe and Votkinskoe, on the Kama River with total area around 3 × 10³ km2) suppress it [49]. This effect is well-pronounced when water surface temperature is substantially lower than air temperature (e.g., in May and June, in daylight hours). The near-surface layer is stabilized over the relatively cold water surface, and convective clouds do not develop [50].
Several studies have addressed the climatology of squalls and tornadoes over the Ural region, including PR. The first such study was presented in 1987 and was based on weather station data and damage surveys [51]. In total, information on nine tornadoes and 63 non-tornadic windstorms, including the characteristics of damage paths (for several events) and synoptic-scale environments have been documented. Among these events, one strong tornado with a damage path width of up to 1.5 km and a path length of up to 25 km, and one non-tornadic windstorm with an extremely long (1000 km) and wide (up to 180 km) damage track have been reported [51]. Later, Lassig and Mocalov [52] compiled a unique database of storm events and related windthrow areas in forests in three Ural regions (including PR) for the period 1965–1996. Their database includes 317 storm events with wind speed ≥ 20 m/s and comprehensive information on windthrow. It was found that the number of storm events substantially varies year-to-year, and most storm events are of a convective origin [52], including the catastrophic windthrow event in the north of PR which occurred on 7 June 1975 [53]. In the last decade, the number of tornado reports in PR has explosively increased, as in other regions of Russia. In particular, 79 tornadoes were reported in PR from 1900–2018 [24]. The study [10] presents data for tornadic and non-tornadic convective windstorms that caused stand-replacing windthrow from 1986–2017 in PR, including 40 tornado-induced and 50 squall-induced windthrow areas. However, many events that cause no stand-replacing windthrow have remained unexplored. The formation environments of convective windstorms and tornadoes in PR also require comprehensive comparative analyses.

2.2. Sources for Events in the Presented Database

We compiled the database of tornadoes and severe convective windstorms in PR for the period 1984–2020. We chose this period because of the availability of Landsat images with 30 m spatial resolution and the database of windthrow events [10]; however, we used a variety of sources to compile the database and perform a verification of each storm event, which were not limited to satellite data. Specifically, we merged the data from weather station reports, damage survey reports provided by the Perm Center for Hydrometeorology and Environmental Monitoring (PCHEM), damage reports from other sources, information from the previously published databases for tornadoes in Russia [24] and stand-replacing windthrow events in European Russia [10] updated for 1984–2020. These reports were attributed to one storm event, if they were related to the same location (for example, a settlement and a weather station located within the 3 km radius), and at the same date and time range (taking into account the time precision for various data sources, which is discussed later in this paper).
The observational network in PR includes 25 weather stations and 51 hydrological and meteorological posts. Weather stations perform observations continuously and provide the data every three hours (so-called routine 3-hourly observations). The maximum wind gust observed during 3-h period is reported in a special section of the SYNOP report, called “the maximum wind gust between observations”. Weather station data are compiled and provided by the All-Russian Research Institute of Hydrometeorological Information—World Data Center (RIHMI-WDC) [54]. We used these data for the entire analysed period (1984–2020). From weather station data, only the reports when wind gusts reached 25 m·s−1, which corresponds to the criteria of a hazardous weather event (squall or strong wind) that is accepted in Russia, were selected [55]. In addition, the information on accompanying weather phenomena (e.g., thunderstorms, rainfall) and synoptic-scale environments to confirm or refute the convective nature of strong wind gusts was analysed.
Many storm events were missed by weather stations but caused substantial property and infrastructure damage. We used following types of damage reports to compile the storm event database for PR: reports provided by the damage surveys of the PCHEM, previously published reports from the storm event databases for Russia, reports obtained from hydrological and meteorological posts, and reports obtained from the media and social networks.
The reports of damage surveys, provided by the PCHEM, are available mainly for the period 2001–2020, and only for several events that occurred before 2001 [56]. They contain not only damage characteristics, but also the information on storm events itself (event type, location, time), according to eye-witness observations and verified with the nearest weather station or weather radar data (if available). The time precision for each event ranges from 10 min to 1−3 h. Damage description for most of events is quite detailed and includes, for example, the degree of damage to roofs, power lines, and trees.
The damage survey reports also include an estimate of wind speed according to the Beaufort Wind Force Scale [57]. However, it has substantial uncertainty, like any estimate of wind speed based on post-event damage analysis performed for a specific location [58], so in our database we provide this information in a special column known as the “estimated intensity” (see supplementary data), as well as intensity of tornadoes. We assigned the upper threshold of corresponding wind speed gradation (e.g., 24 m·s−1 for 9 points, 28 m·s−1 for 10 points, and 32 m·s−1 for 11 points according to the Beaufort scale), since the same values are given in most damage survey reports.
Another substantial limitation of damage survey is that it is performed by the PCHEM only if a corresponding request has been received, e.g., to assess economic losses caused by windstorms or tornadoes. Therefore, the results of damage inspection are incomplete and cover only a small portion of actual storm-related damage.
Other damage reports are usually less detailed. These were obtained from the database compiled by RIHMI-WDC [59] and monthly reviews of hazardous weather events [60]. These databases contain the information on hazardous weather events that caused substantial socio-economic losses in Russia. Storm event locations (e.g., settlement where damage has been reported) and the time of their occurrence (with a precision ranging from 10 min to several hours) are given for each event. However, this information is often incomplete, and we used them only as an additional data source to confirm the event and clarify the damage characteristics. We also used the reports from European Severe Weather Database [61], but they are fragmentary and incomplete for PR, as for other Russian regions [7].
Unlike weather stations, hydrological and meteorological posts in PR reported severe wind gusts only based on post-event damage assessments; therefore, we considered these data also as damage reports. Time of a storm event with these data can be determined only with a day precision and requires clarification with the use of other data sources.
In addition, the reports published in the media and social networks, which contains information on the storm events itself (event type, date and time), and related damage were analysed. We added storm reports to the database, if their degree of wind damage suggested a wind speed reaching 25 m·s−1 or more; this, for example, would’ve resulted in the substantial destruction of roofs (as reported), and/or fatalities and injuries.
The reports from the media and social networks were verified with nearest weather station data, images from meteorological satellites (Meteosat-8/SEVIRI and Terra/Aqua MODIS), or weather radar data. Note, that Meteosat-8/SEVIRI images were available for PR only for the period 2016–2020, when the satellite position had been changed [62]. Weather radar data was available for 1996–2014, when the radar operated in the city of Perm. However, it was an old-type radar (MRL-5), which had a cell size of 4 × 4 km and a viewing radius of 200 km [63]. From 2014 to present, the southwestern part of PR (including the city of Perm) was also observed by Doppler weather radar from the city of Izhevsk (see Figure 1b). Although the northern part of PR was never observed by weather radars, many reports on squalls and tornadoes which occurred in its central and southern parts, were verified with this data.
Each type of aforementioned reports has specific limitations and biases. For instance, the observational network in PR is relatively rare with the average distance between the nearest weather station accounts for 58.8 km. Such network tends to miss local-scale storm events. On the other hand, the reports based on eye-witness observations or damage inspections often do not contain sufficient information on the storm characteristics, e.g., intensity or the time of occurrence. These reports require an additional verification with the use of the data from weather radars or meteorological satellites. It is particularly challenging to determinate exact date and time for storm events that causing only damage to forests [10]. Satellite-derived information on windthrow were used for such analysis.
The data on storm- and tornado-induced forest damage was obtained from the database of stand-replacing windthrow events [10]. Initial version of this database (for 1986–2017) includes 700 windthrow events with stand-replacing forest damage exceeding 5 ha (for tornado-induced windthrow) or 25 ha (for other windthrow), and several characteristics of the weather events that caused windthrow. For the territory of PR, we added 12 windthrow events which occurred from 2018–2020, four events for 1984, and also eight events that occurred between 1986 and 2017 and had previously been missed. We also used information on tornadoes from the dataset [24]. Using satellite data, including Landsat, Sentinel-2, and high-resolution images (HRI), we verified these data and attributed three events to non-tornadic windstorms. We also added two tornadoes which occurred in 2019, and three tornadoes that happened in 1993 (2) and 2009 (1) but had previously been missed. The next section provides more information on our approach of using satellite data on windthrow for tornado and squall analysis.

2.3. Determination of Event Type and Characteristics

We thoroughly analyzed all available information to determine the level of certainty of each event and its type, i.e., squall, tornado, or both of them. We assigned to each report the high or medium degree of certainty given the credibility of sources that should be determined to assess the viability of the data. It is of note, that the procedure of the credibility evaluation was firstly performed for tornado reports in Canada [64] and then used in Europe and Northern Eurasia [7,8,24,65]. In general, the certainty assessment addressed a question on what is our confidence that the severe convective storm event really happened.
Table 1 provides the general information on criteria to determine the certainty degree for storm events that were used in this paper. In particular, we used threshold values for observed wind gust (25 m·s−1) and for windthrow area (5 hectares for tornado-induced windthrow and 25 hectares for squall-induced windthrow), in line with the previously published database of windthrow events [10]. For damage reports, it is impossible to use a single threshold for the areas with different population density. So, we added to the database the events that caused substantial destruction of roofs (as reported), and/or fatalities and injuries. Convective origin of each event was confirmed with weather station reports (e.g., if storm event was accompanied by thunderstorm, hailstorm), with the images from meteorological satellites or weather radar data. Synoptic-scale environments were also estimated for being plausible for severe convective events formation.
In this study, we widely used satellite data on windthrow following the approach that was implemented previously [7,10,11,24]. Firstly, all windthrow areas from the database [10], associated with squall or tornado events in PR, were selected. Then, we analysed satellite images to find previously unknown windthrow areas, associated with storm events reported by other data sources (weather station or information on damage). Particularly, we compared cloud-free Landsat and Sentinel-2 images obtained immediately before and after the event, and delineated windthrow area [10]. Windthrow direction is taken into account to associate forest damage with a previously known storm event; particularly, it has to coincide with the direction of the storm movement.
The type of storm event causing forest damage was determined according to a reported method [10,11], based on geometrical features of windthrow and data from HRIs (Figure 2). Thus, on high-resolution images, the main signature of tornado-induced windthrow is the counterclockwise, or infrequently clockwise, rotation of the fallen trees. With the lack of HRIs, we considered additional signatures of a tornado-induced forest damage, namely a quasi-linear structure, a gradual turn of a storm track, and a predominant total removal of forest stands (see [10,11] for more details). The date and time for most of windthrow events in PR was assigned according to the database [10] or based on weather station and damage reports. For newly added events, where satellite data on windthrow were the primary source, we firstly determined the range of dates when each windthrow occurred, based on time series of Landsat and Sentinel-2 satellite images. Then, weather station reports and the information from the above-described storm event databases for these periods were analysed. Thus, we found the exact dates for most of windthrow events (except for two squall-induced and 16 tornado-induced windthrow events in PR). Also, we determined storm event’s timing, based on the same data sources and also Meteosat-8 and Terra/Aqua MODIS satellite images, and weather radar data (if available).

2.4. Data and Methods for Synoptic- and Meso-Scale Analysis

We used ERA5 reanalysis data to investigate the formation environments of squalls and tornadoes. To avoid data redundancy, storm reports that occurred simultaneously (within ±1 h time interval) and at a short distance from one another (less than 50 km) were combined. We assumed that such events were likely associated with one mesoscale convective system (MCS). The events with unknown dates, or those having time precision exceeding 3 h were excluded from environment analysis. The resulting dataset consists of 114 such combined events (storm group events, SGE) with known times and dates.
We analysed and compared the formation environments for SGE with or without tornadoes (SGEWT and SGENT, respectively) and storm events that have or have not resulted in forest damage (SGEWD and SGEND, respectively).
ERA5 is the latest climate reanalysis produced by the European Centre for Medium-Range Weather Forecasts (ECMWF). It bears substantial improvements regarding its vertical and temporal resolutions compared to prior reanalyses [64]. In particular, the ERA5 reanalysis has a 0.25° spatial resolution, 1 h time step, and 137 terrain-following hybrid-sigma model levels [66], which substantially improve the calculation of diagnostic variables, especially parcel parameters [41]. We used these data (but only 38 standard levels) to calculate the dynamic and thermodynamic diagnostic variables characterising convective instability, including the 3D index [67], total precipitable water, convective available potential energy (CAPE, Surface-based (SB) and Most Unstable (MU)), SB CIN, wind shear (namely 0–1 km shear (LLS), 0–3 km shear (LLS) and 0–6 km shear (DLS)), 0–3 km and 0–1 km storm-relative helicity (SRH) [68]. Also, we calculated three composite indices namely, the Energy-Helicity Index (EHI) [68], Supercell Composite Parameter (SCP) [69], and WMAXSHEAR [37]. The choice of calculated convective indices is based on previous studies devoted to the analysis of severe thunderstorm environments over Europe, U.S., and Russia [34,35,36,37,38,39,40,41,42,43]. It is of note, that the SB CAPE and SB CIN values were obtained directly from reanalysis data, and MU CAPE was calculated according to a formula [70].
The convective indices derived from ERA5 data were assigned to corresponding storm reports as maximum values within a 100-km radius. We calculated the indices one hour before a storm event, if its time was known with one-hour precision. For the events with time precision of 3 h, we calculated the indices for the first hour of 3-h interval. It is of note, that our calculations of convective variables differ in several aspect from those performed previously for Europe and the U.S. [35,36,37,38,39,40,41,42,43]. In particular, we calculated SB CAPE and MU CAPE instead of mixed-layer (ML) CAPE, and SB CIN was obtained directly from the ERA5 data.
We analysed the synoptic-scale characteristics of storm formation such as the type of a frontal system, the origin and development stage of a corresponding low-pressure system. Also, the characteristics of air masses and frontal systems such as temperature at 850 hPa isobaric surface ahead of the atmospheric front, temperature gradients at 850 hPa (°C/500 km), and 2 m dewpoint temperature according to weather station data were analysed. All of these parameters are widely used in Russian weather forecasting of severe storms [71].
We analysed the differences in synoptic-scale environments and convective indices depending on storm type (SEWT and SENT) and damage characteristics (SEWD and SEND). The statistical significance of the differences between groups of storm events was estimated with the Kolmogorov–Smirnov (K–S) test. A 0.05 significance level was determined.
The NOAA Hybrid Single-Particle Lagrangian Integrated Trajectory (HYSPLIT) air parcel trajectory model [72] was also used to simulate the backward advection paths of air parcels to define low-level moisture sources for storm events formation. The HYSPLIT model was run using data from the NCEP/NCAR reanalysis (for the period 1984–2005) and the GDAS 1 degree (for the period 2006–present). We calculated 72-h backward trajectories at 1500 m above sea level (ASL) for each storm event. For instance, Molina and Allen [73] used 120-h backward trajectories to identify near-surface moisture sources for tornadic thunderstorms in the U.S. Finch and Bikos [74] used 96 h backward trajectories to identify moisture sources for the 1984 Ivanovo tornado outbreak. However, we supposed that the main patterns on near-surface advection may be identified based on 72 h trajectories. The density of starting points of these trajectories was calculated using the kernel density method [75] implemented in the ArcGIS 10 software (ESRI Inc., USA).
The storm type (type of mesoscale convective system) was determined for the events covered by satellite images and/or weather radar data. Following the National Severe Storms Laboratory [76], we classified five storm types such as supercell, mesoscale convective complex, quasi-linear convective system (meso-α or meso-β scale), and low-organised single-cell or multi-cell thunderstorms. This information, as well as the data source used for storm type definition, is available in our database.

3. Results

3.1. General Information on the Storm Events Database in PR

The compiled database includes 165 storm reports, i.e., 100 squalls, 59 tornadoes, and six cases with both tornadoes and squalls (Figure 3). All events occurred in PR between 1984 and 2020. Among them, only 59 events had a medium certainty (including 27 tornadoes, 31 squalls and one combined event). The other 106 events had a high degree of certainty. The database consists of three shapefiles namely storm reports (i.e., points), windthrow areas associated with them (i.e., polygons), and the border of PR (polygon). The database is available in Supplementary Materials as a .zip archive. It also contains the QGIS 3 project file for data viewing. Table 2 presents the structure of the attributive table for the storm reports. The structure of the windthrow database is similar to the database from [10].
For 38 events, weather stations reported wind gusts ≥ 25 m·s−1, which is highlighted in the database. In addition, for 28 squalls and three tornado events, the reports of the damage survey performed by PCHEM were obtained. Among these events, 16 were also reported by weather stations with wind gusts ranged from 13 m·s−1 to 30 m·s−1. Damage reports published in the external databases, media, and social networks are available for 47% of squalls and tornadoes. The availability of damage reports and eye-witness observations has increased over time. Thus, only 10% of the windstorms and tornadoes which occurred in 1984–1990 have damage descriptions, while their percentage increased to 55% in 2011–2020. It is of note, that 11 squall events reported by weather stations (with wind gusts ≥25 m·s−1) induced only slight damage in settlements, e.g., only trees were damaged.
The updated database of windthrow for PR includes 86 stand-replacing (e.g., characterised by total or sub-total canopy removal and well-detected on Landsat images) windthrow events. They are associated with squalls (37) and tornadoes (49). The total damaged area within PR is 332.5 km2, i.e., 0.27% of the total forest-covered area. The area of tornado-induced windthrow is 44.12 km2, i.e., 13% of the total windthrow area.
We matched 82 of 165 storm reports with windthrow events, including 55 reports with tornadoes (86%) and 27 reports of convective windstorms (28%). Therein, several successive windthrow areas (e.g., squalls which occurred on 4 July 1992, 30 June 1993 and 18 July 2012) were merged to be associated with one storm event. Figure 3 shows the spatial distribution of storm reports and related windthrow areas. We determined a storm type for 75 storm events (45.4%), including 58 squalls, 14 tornadoes and three combined events. Weather radar data and satellite images were the main data sources for storm type definition (44% and 55% respectively), also we used the eye-witness photos of storms. Most of the events are associated with quasi-linear convective systems (61%). Other storm events were associated with supercells (15%), mesoscale convective complexes (13%), and low-organised multi-cell thunderstorms (10%).

3.2. Climatology of Severe Convective Windstorms and Tornadoes in Perm Region

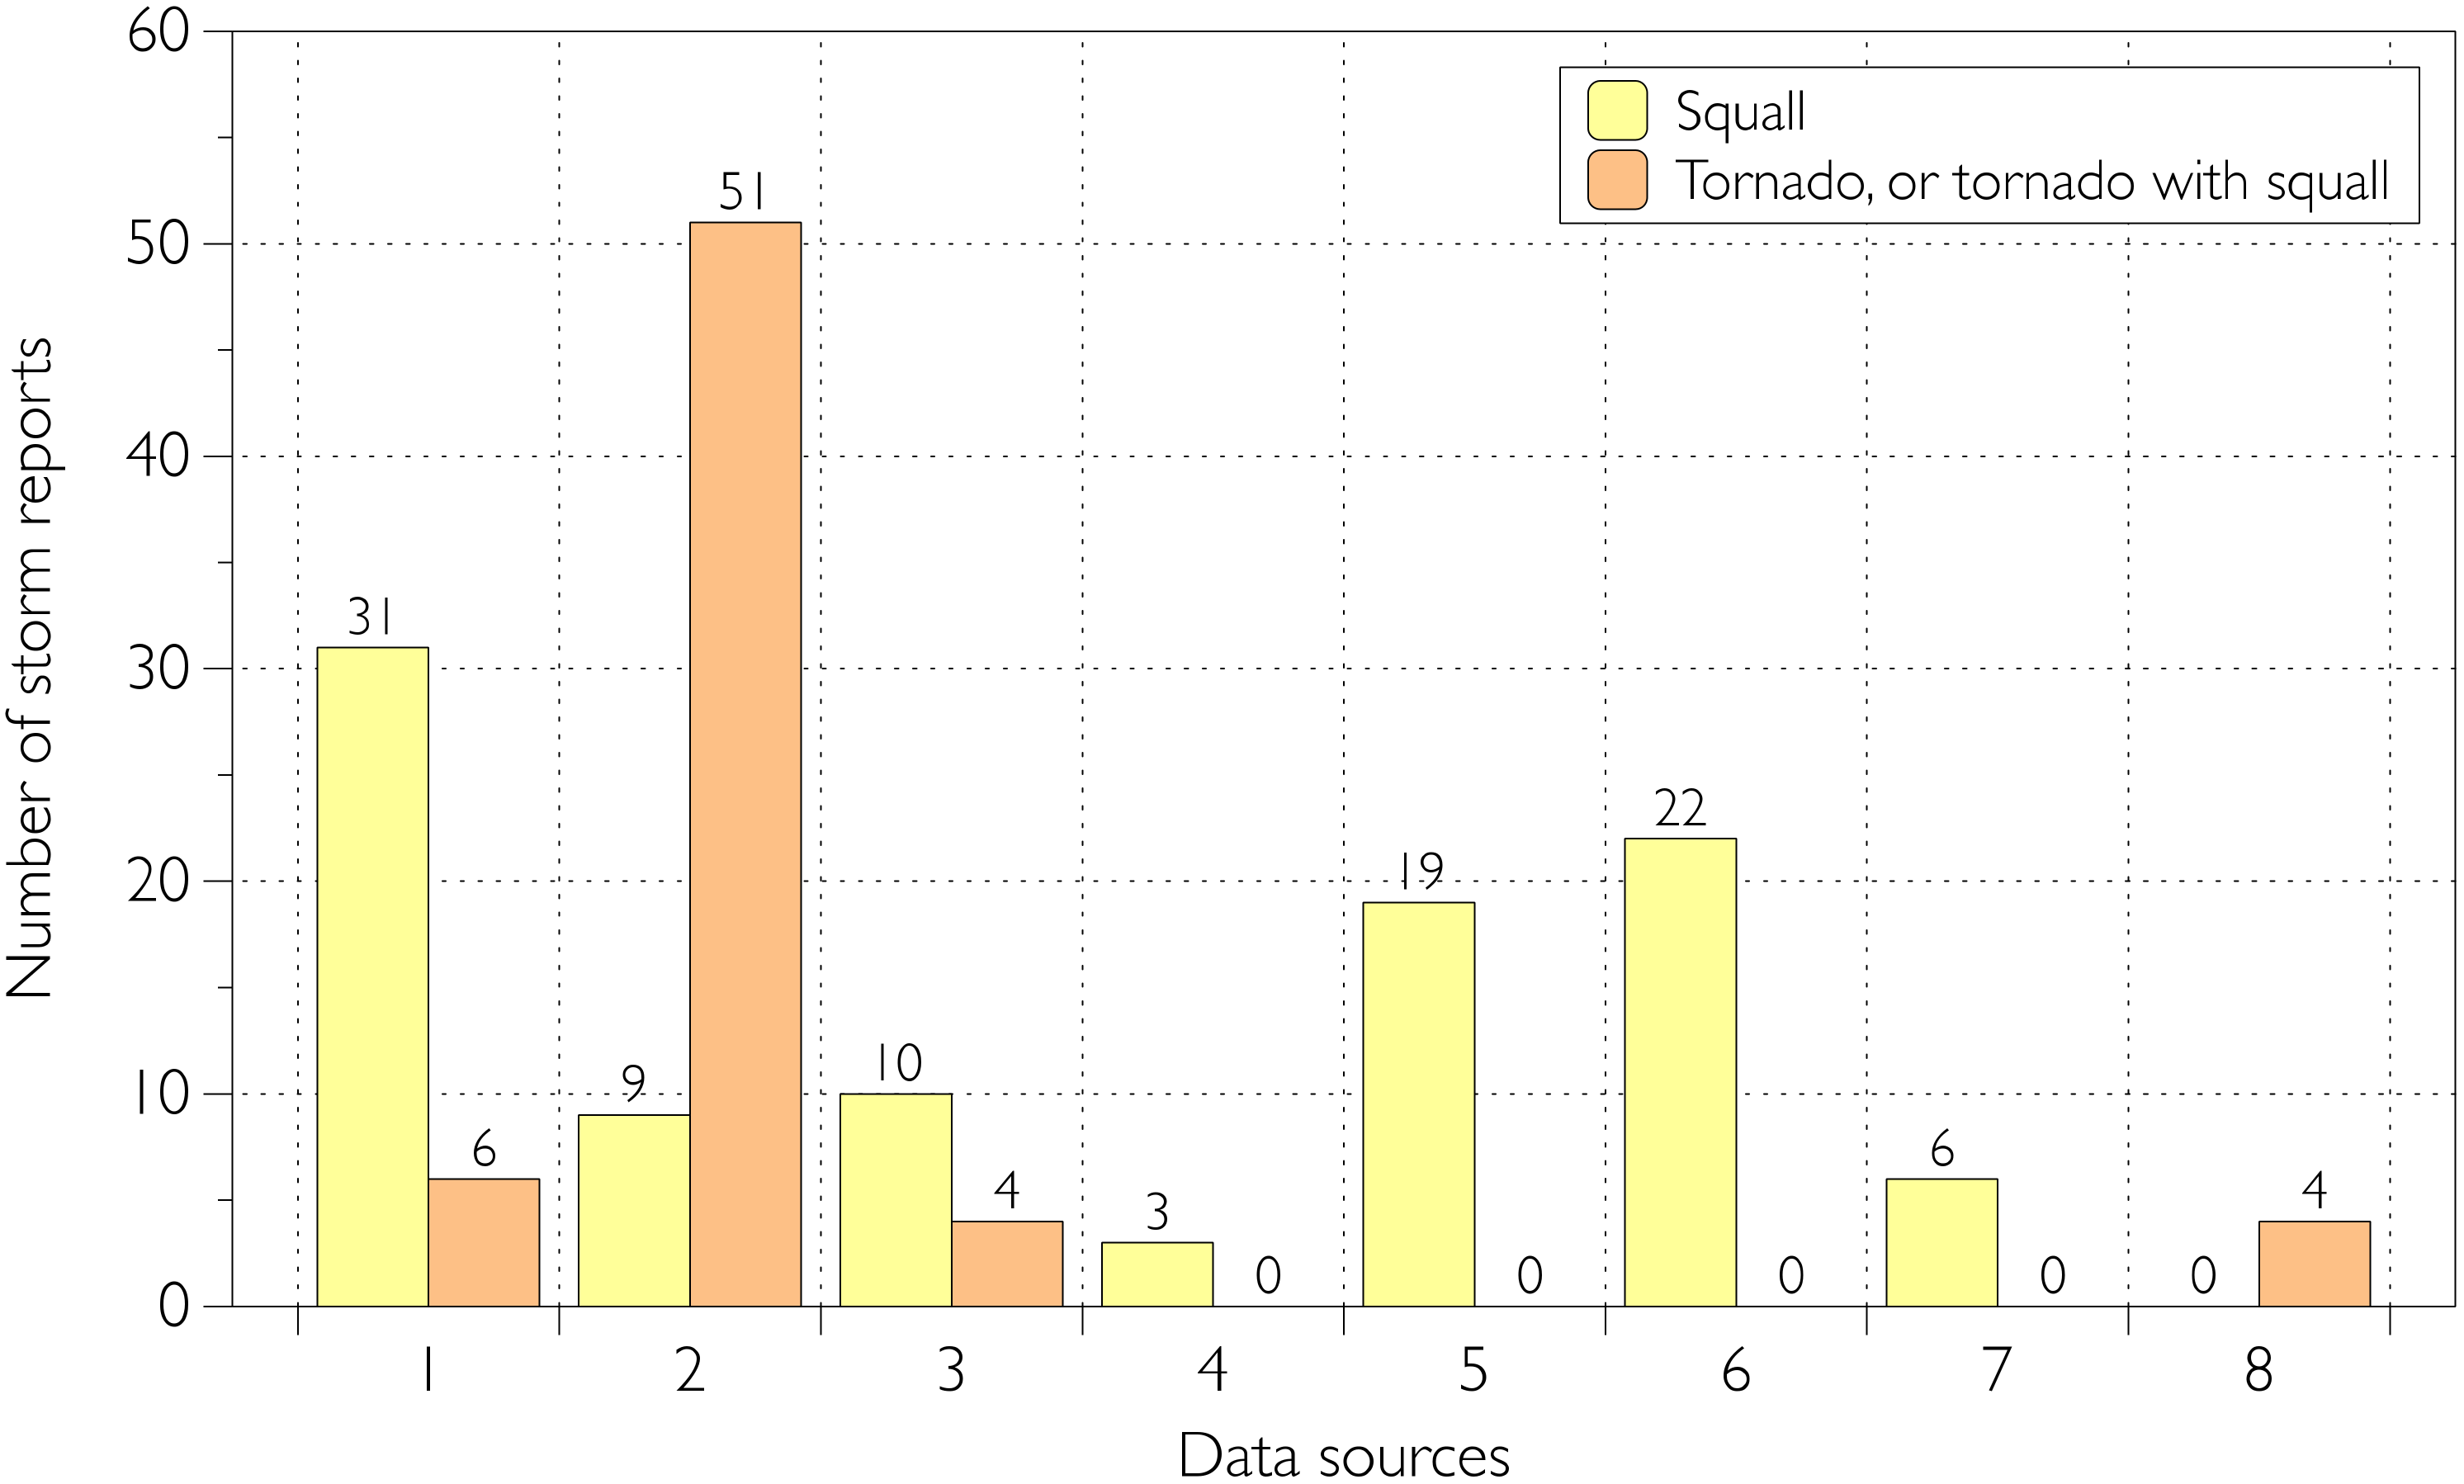
3.2.1. Distribution of Storm Events Depending on Their Data Sources

The main data sources substantially differ for the squalls and tornadoes (Figure 4).
Thus, 51 of 65 events with tornadoes were found based on satellite images of windthrow, which confirms previously obtained estimates [7,11,13,24] on crucial importance of this source for a tornado climatology in forested regions.
Only 11 tornadoes or combined storms (squalls and tornadoes) passed through settlements, and eight of them caused substantial damage. In four cases, the same events caused forest damage, i.e., they have two data sources. Not a single tornado was observed at a weather station.
The role of the satellite images as a single source for obtaining information on squalls is substantially lower than on tornadoes. Thus, 27 of 100 squall reports are associated with forest damage, and only nine among them were identified by satellite images solely. Weather station and damage reports are two main sources for squall data collection. Indeed, 19 squalls with wind gusts ≥ 25 m·s−1 were reported only by weather stations (without information on damage), and another 31 cases were confirmed by these data along with other data sources. The percentage of squalls, causing damage to settlements, is almost five times higher than the same for tornadoes because of larger impacted areas.

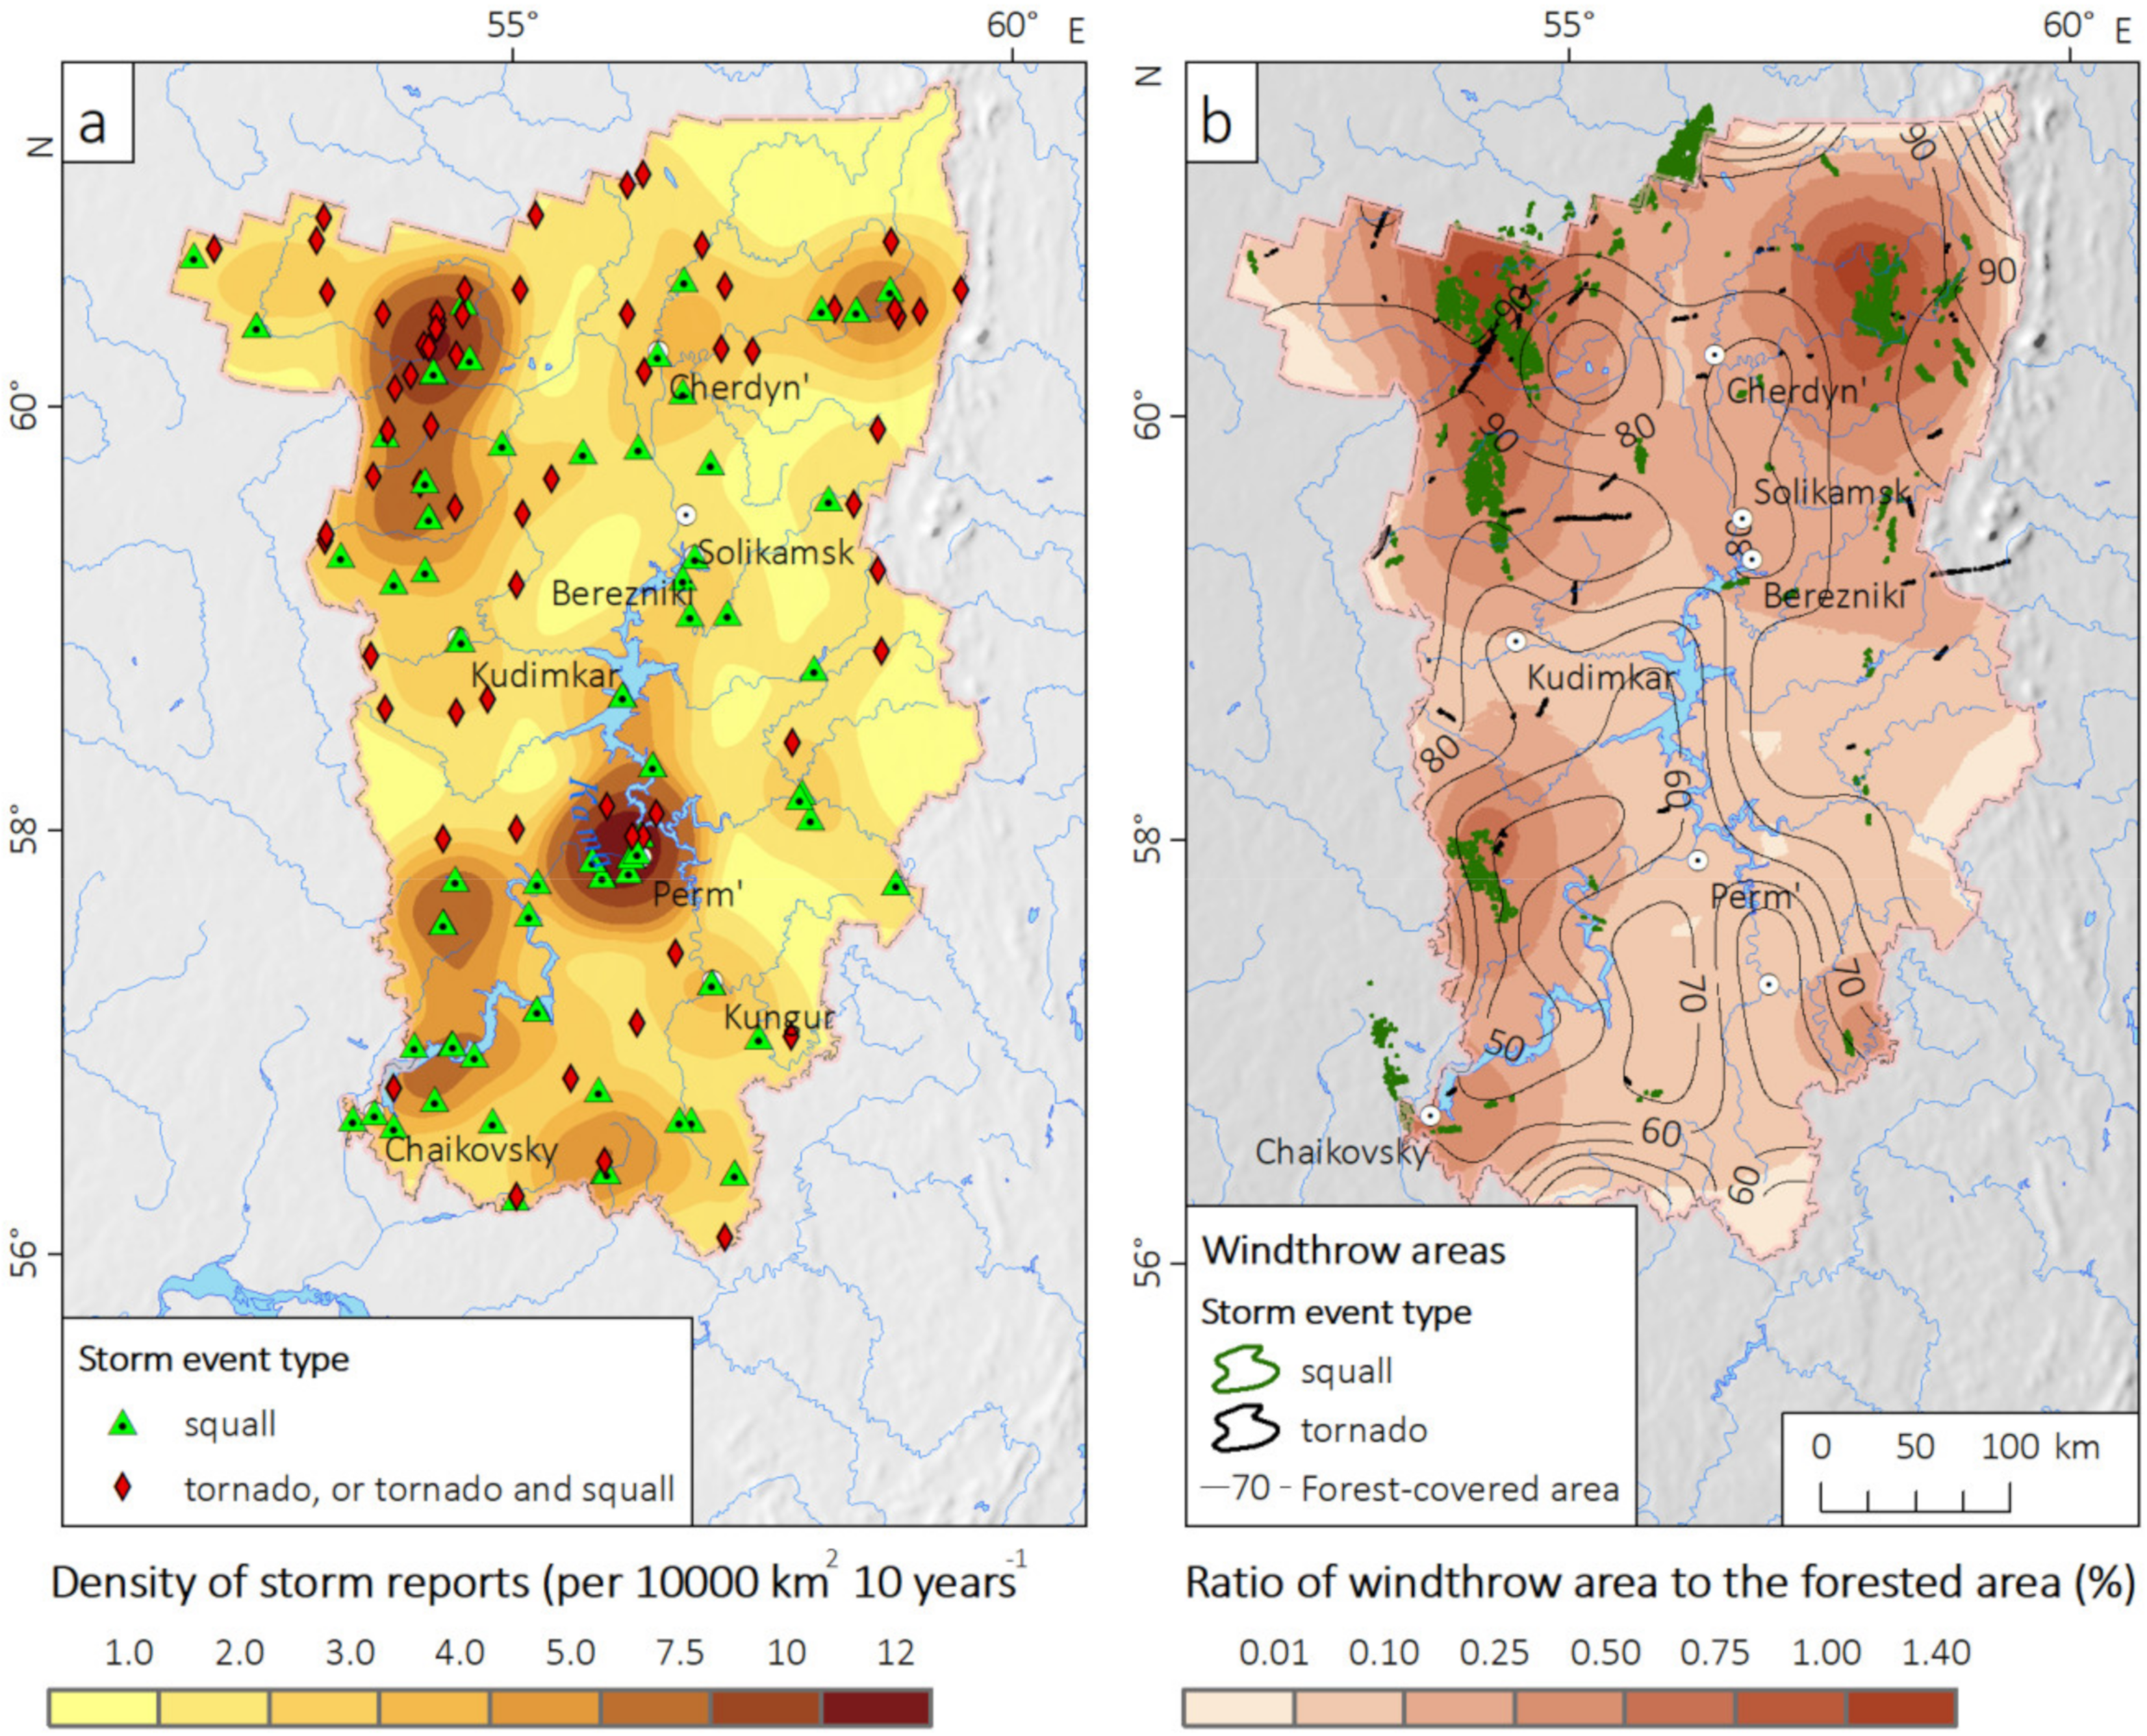
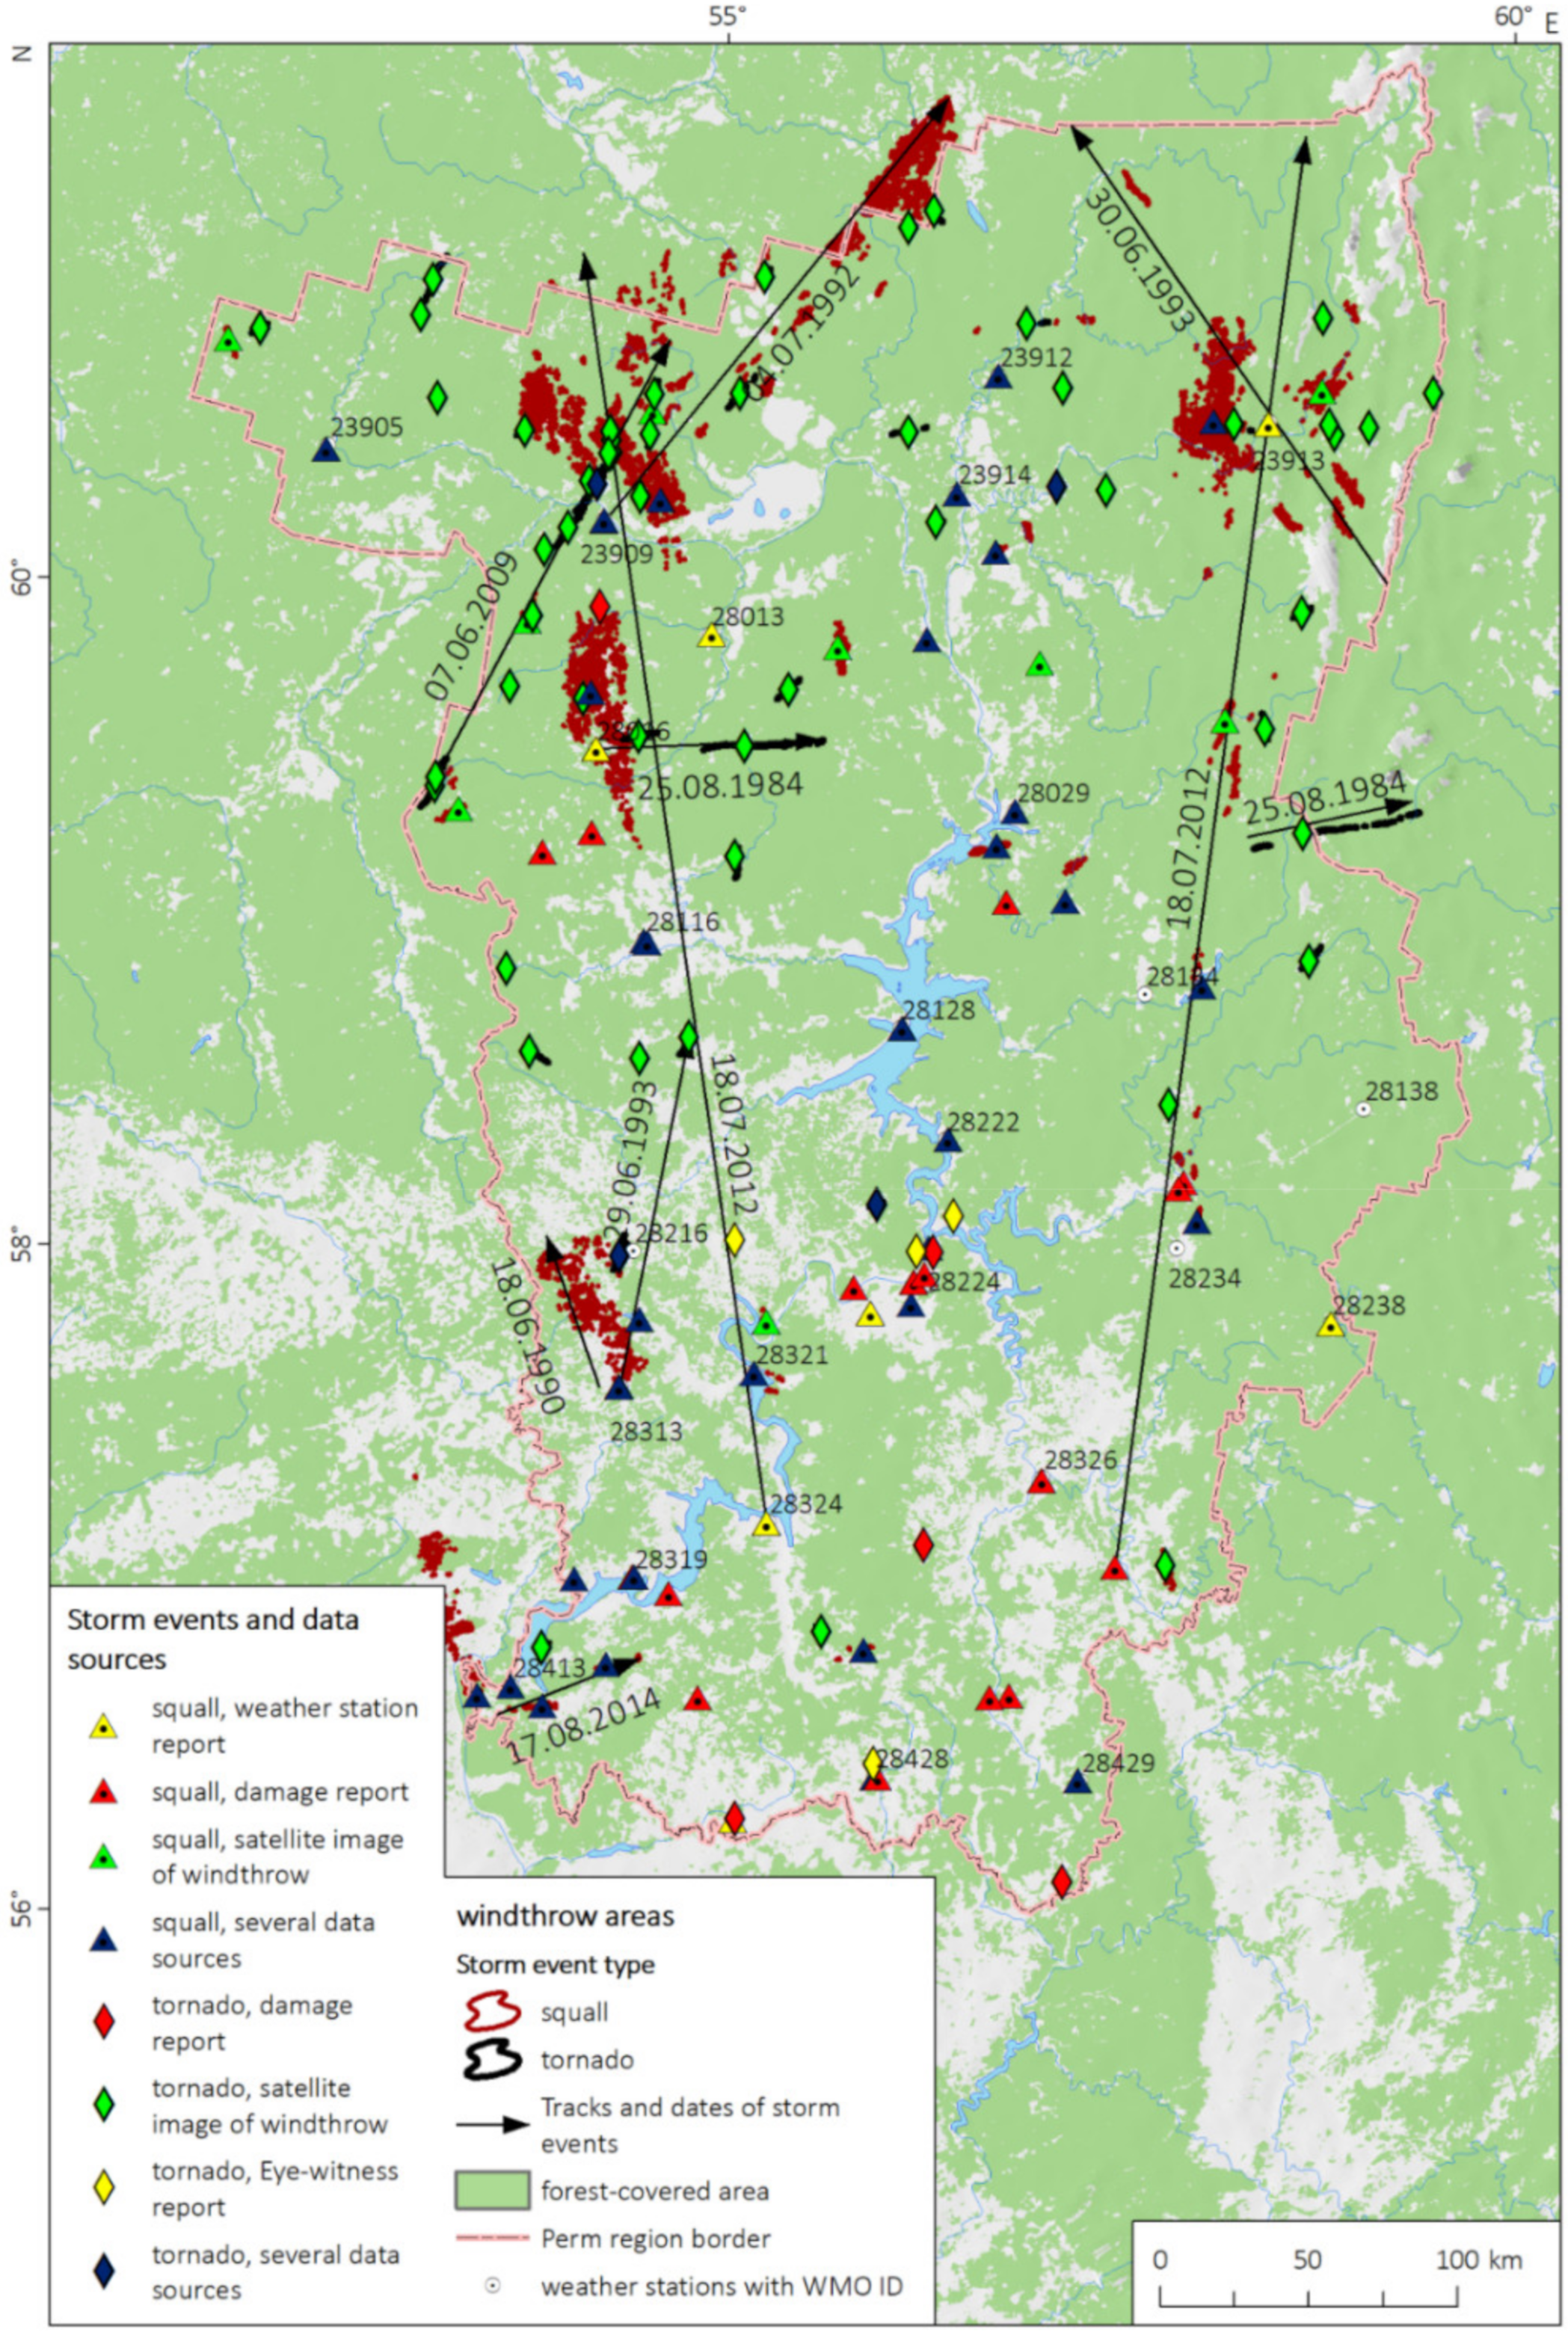
3.2.2. Spatial Distribution

Figure 5 presents spatial distribution of storm reports and windthrow areas in PR.
Several maxima in density of storm reports can be highlighted. The first one coincides with the most densely populated area in PR near the city of Perm, where 12 squalls and two tornadoes were reported. Other maxima were rather a result of a relatively small sample. The second maximum is located in the northwest of PR and associated with severe weather outbreaks of 2006, 2009, and 2012, which have been identified based on satellite images on windthrow. The third maximum in the southwestern part of PR is associated with squalls and tornadoes occurred in 1989, 1990, 1993, and 2014. It is of note, that this maximum somewhat coincides with the maximum in thunderstorm frequency according to the global lightning map [77].

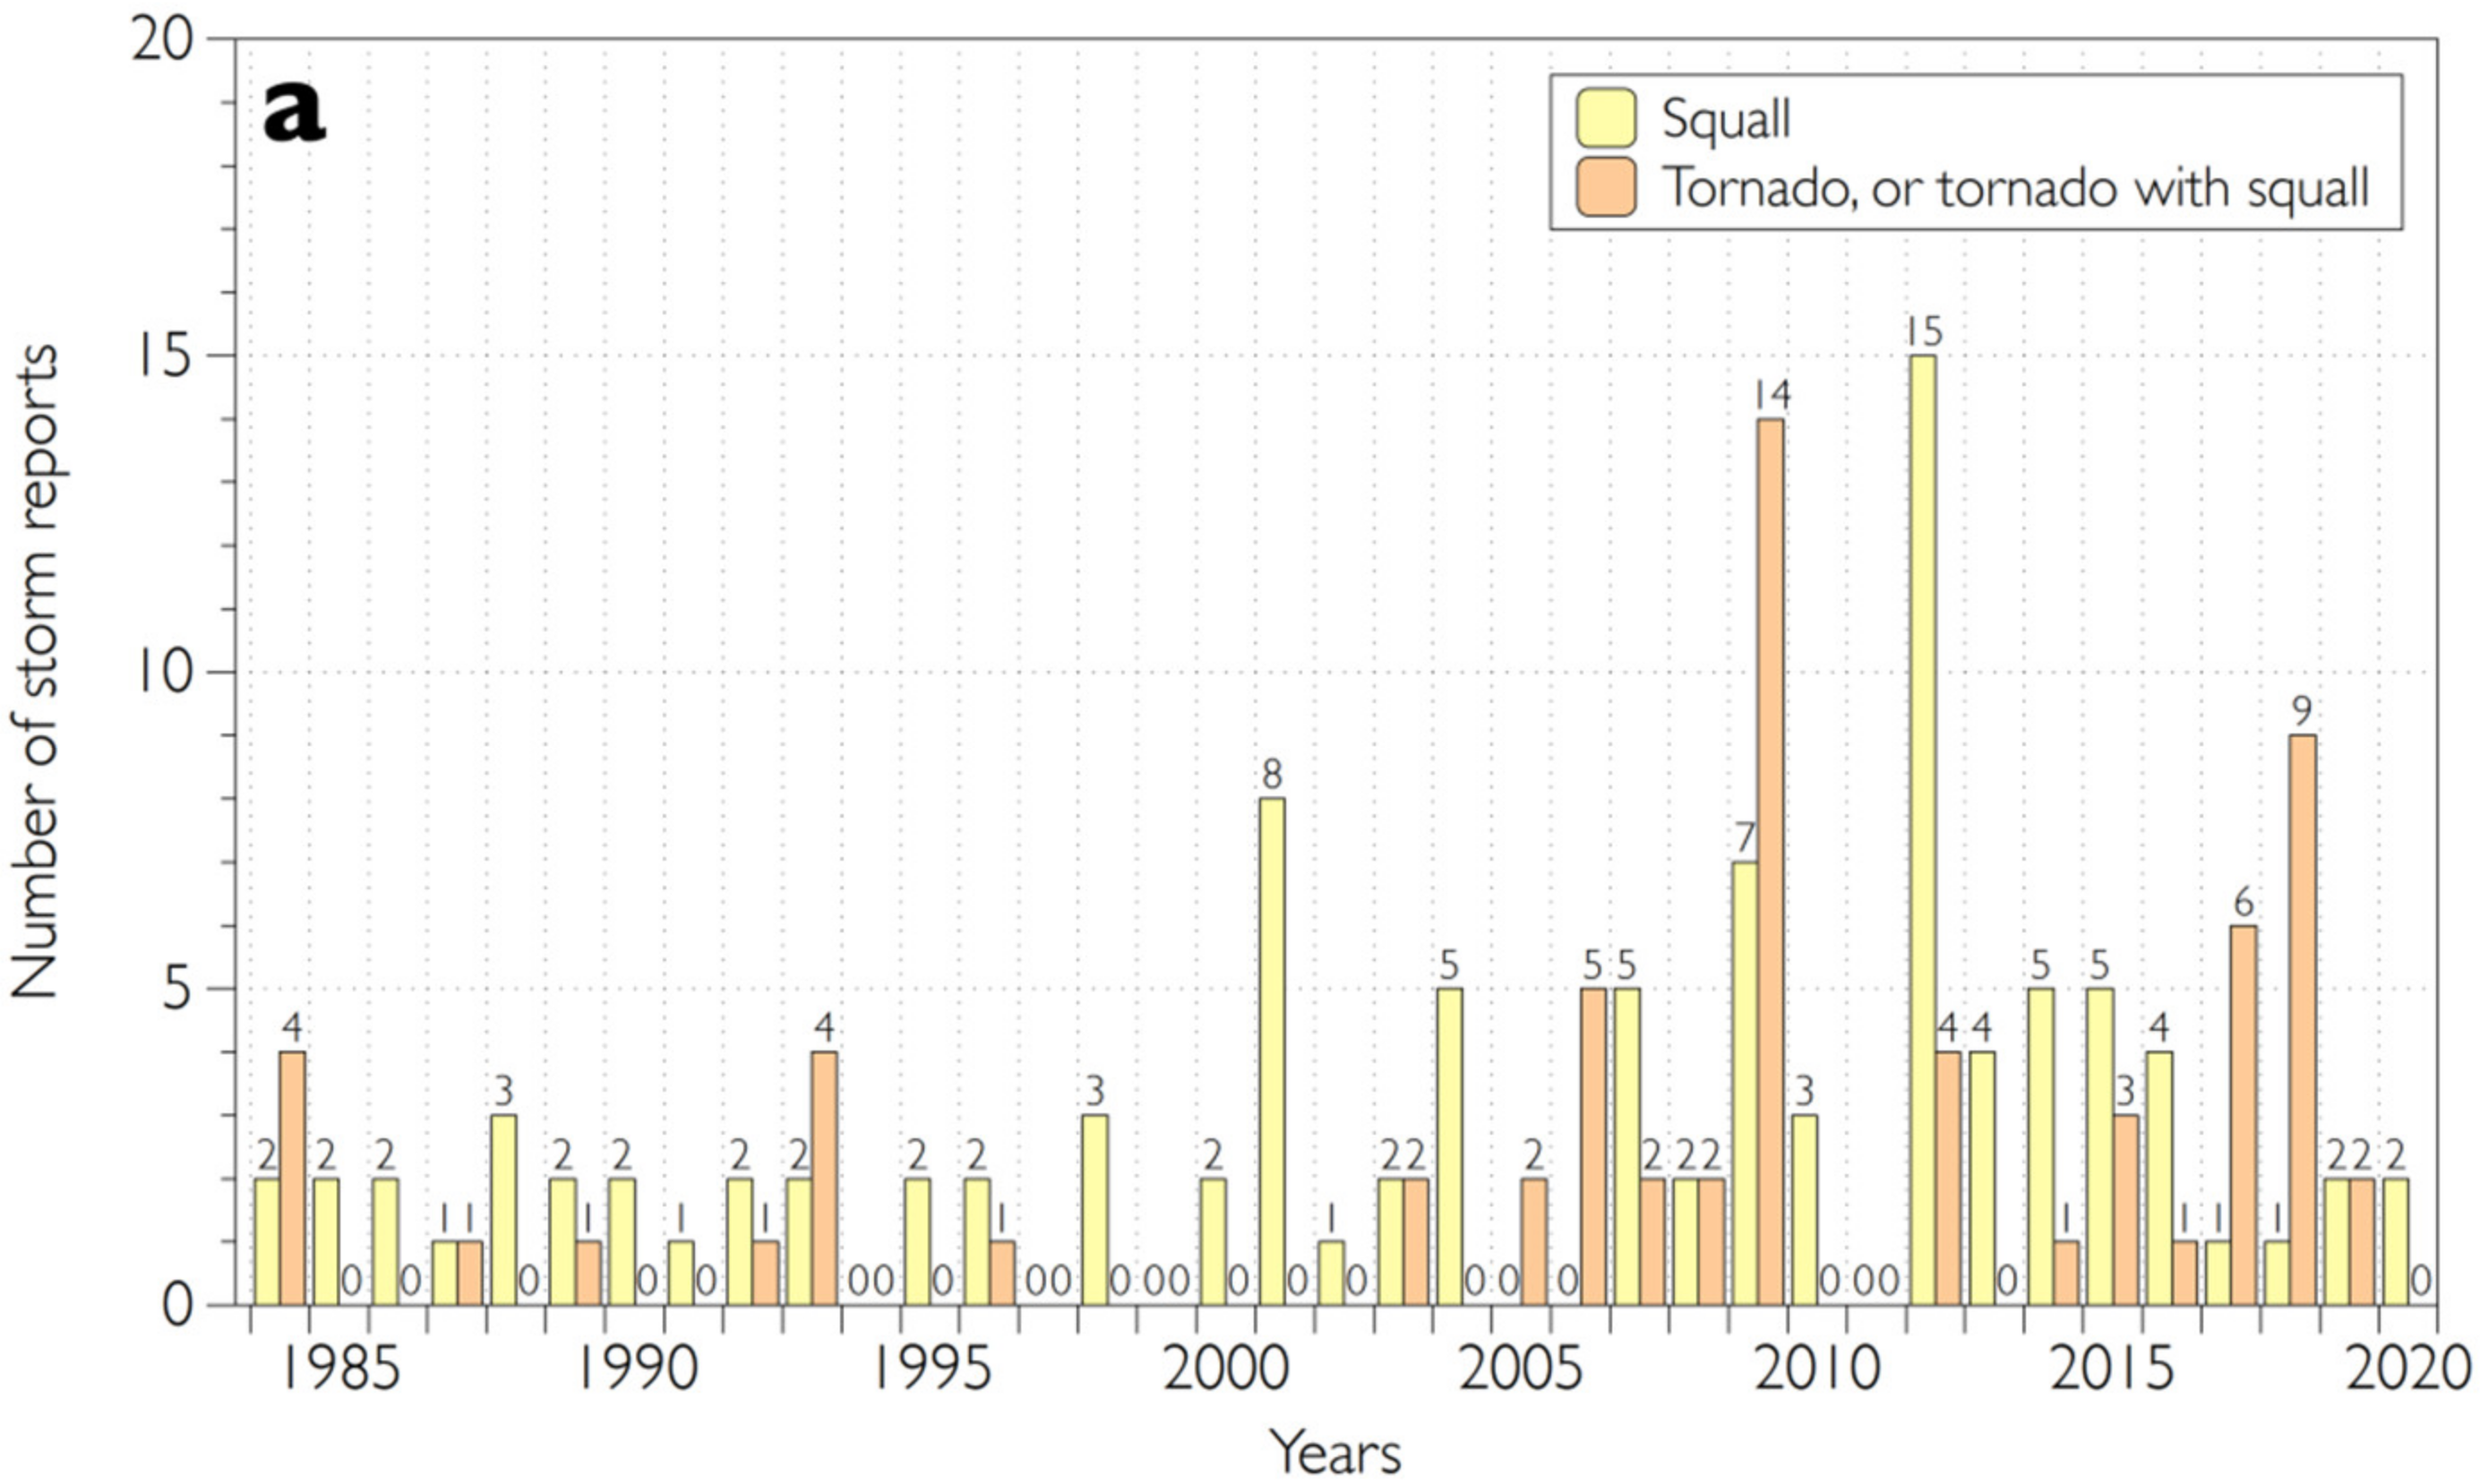
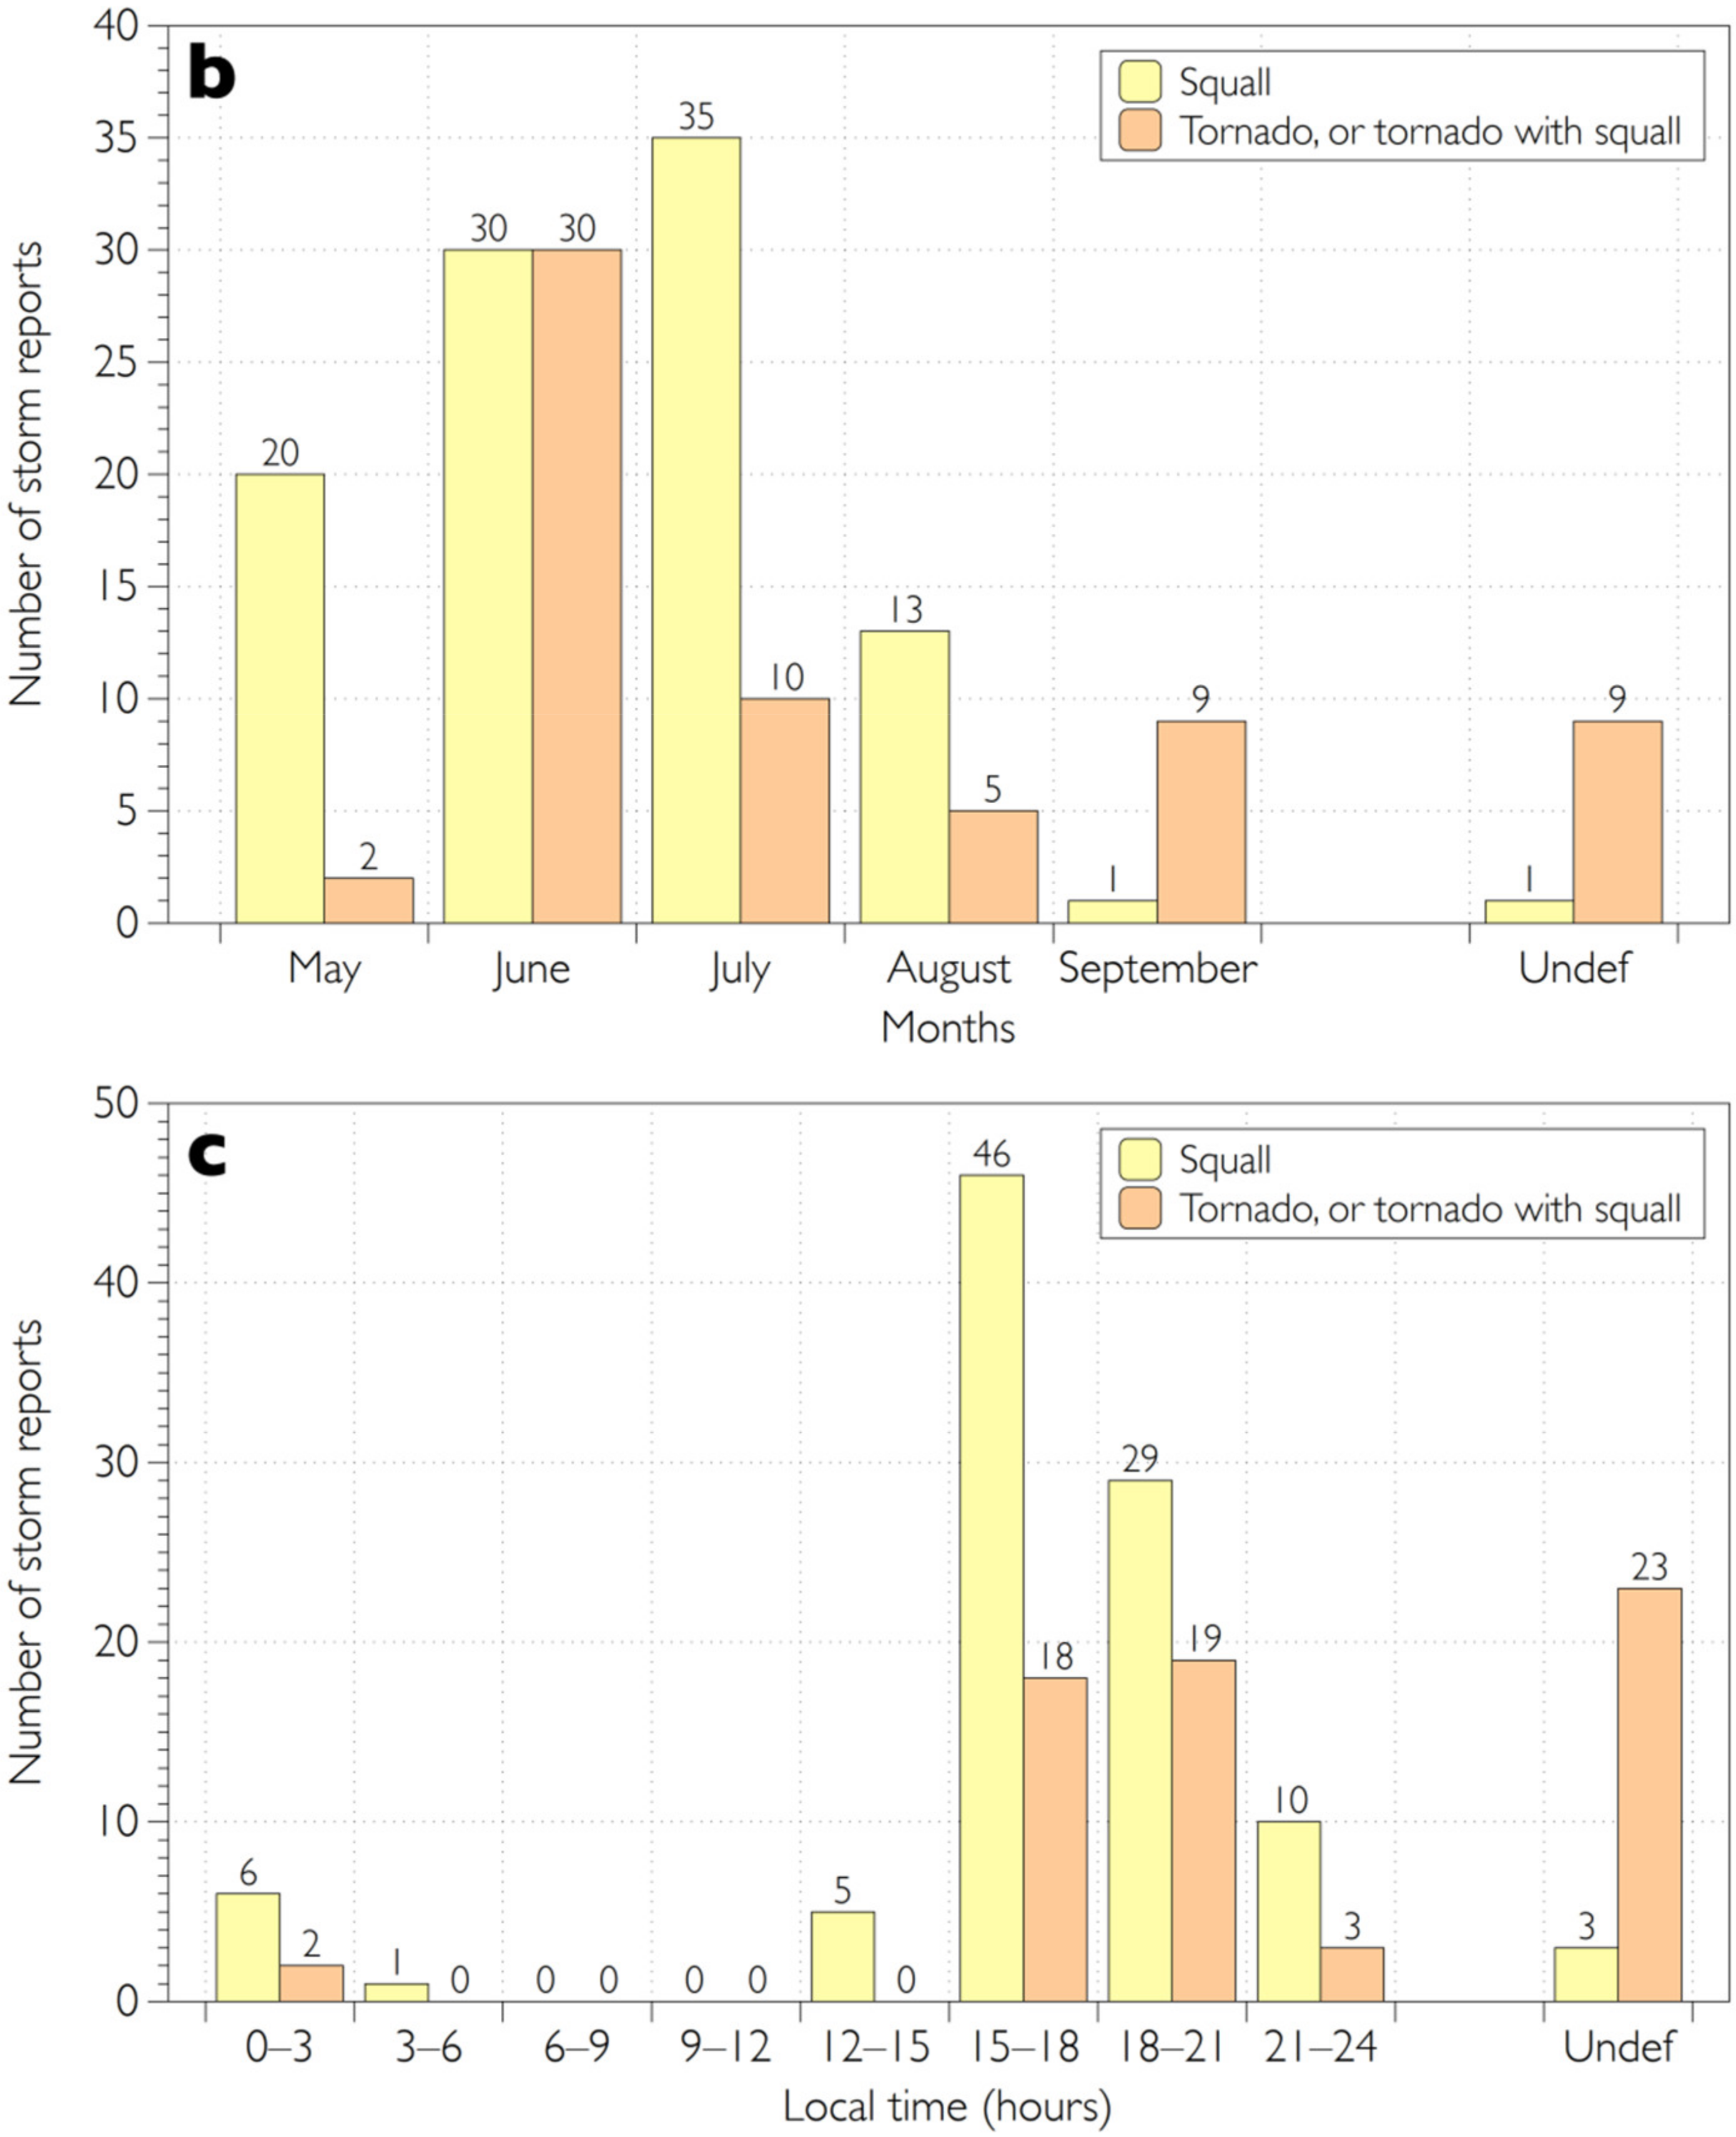
3.2.3. Temporal Distribution

We successfully determined the exact dates for 98 of 100 squall events and 49 of 65 tornadic events. Other 18 events, i.e., two squalls and 16 tornadoes, were identified based solely on satellite images, and therefore have only broad ranges of their possible dates. For nine events, only the years of event were determined. Time of occurrence was determined for 97% of squall events and 65% of tornadic events with a precision of ≤3 h.
The inter-annual distribution of convective windstorms and tornadoes is sampling-driven and determined mainly by several outbreaks (Figure 6a). Two maxima that belong to 2009 (for tornadoes) and 2012 (for squalls) are associated with the most severe and well-documented outbreaks of 7 June 2009 [28] and 18 July 2012 [33]. It is of note, that the highest numbers of windthrow events associated with squalls and tornadoes for the entire European Russia were also reported in 2009 and 2012 [10]. A relatively high number of squall events were also found in 2001 and 2014 and related to the outbreaks of 22 May 2001 and 16–17 August 2014. In 2018, the outbreak of 13 September 2018 determined the peak of tornadoes.
Monthly distribution of squalls and tornado events in PR is rather similar to those for tornadoes in Northern Eurasia [7] and windthrow events in European Russia [10]. The highest number of tornadoes and squalls has been observed in June and July, respectively (Figure 6b). The earliest squall event was reported on 2 May 2013, and the latest case occurred on 22 September 2020. For tornadoes, the dates range from 19 May to 13 September.
Both squalls and tornadoes are most frequent between 14 h and 17 h local time, which coincides with the afternoon maximum of deep convection. In general, squalls form a little bit earlier than tornadoes. The earliest cases were reported at noon, and the latest at 4 AM (Figure 6c).

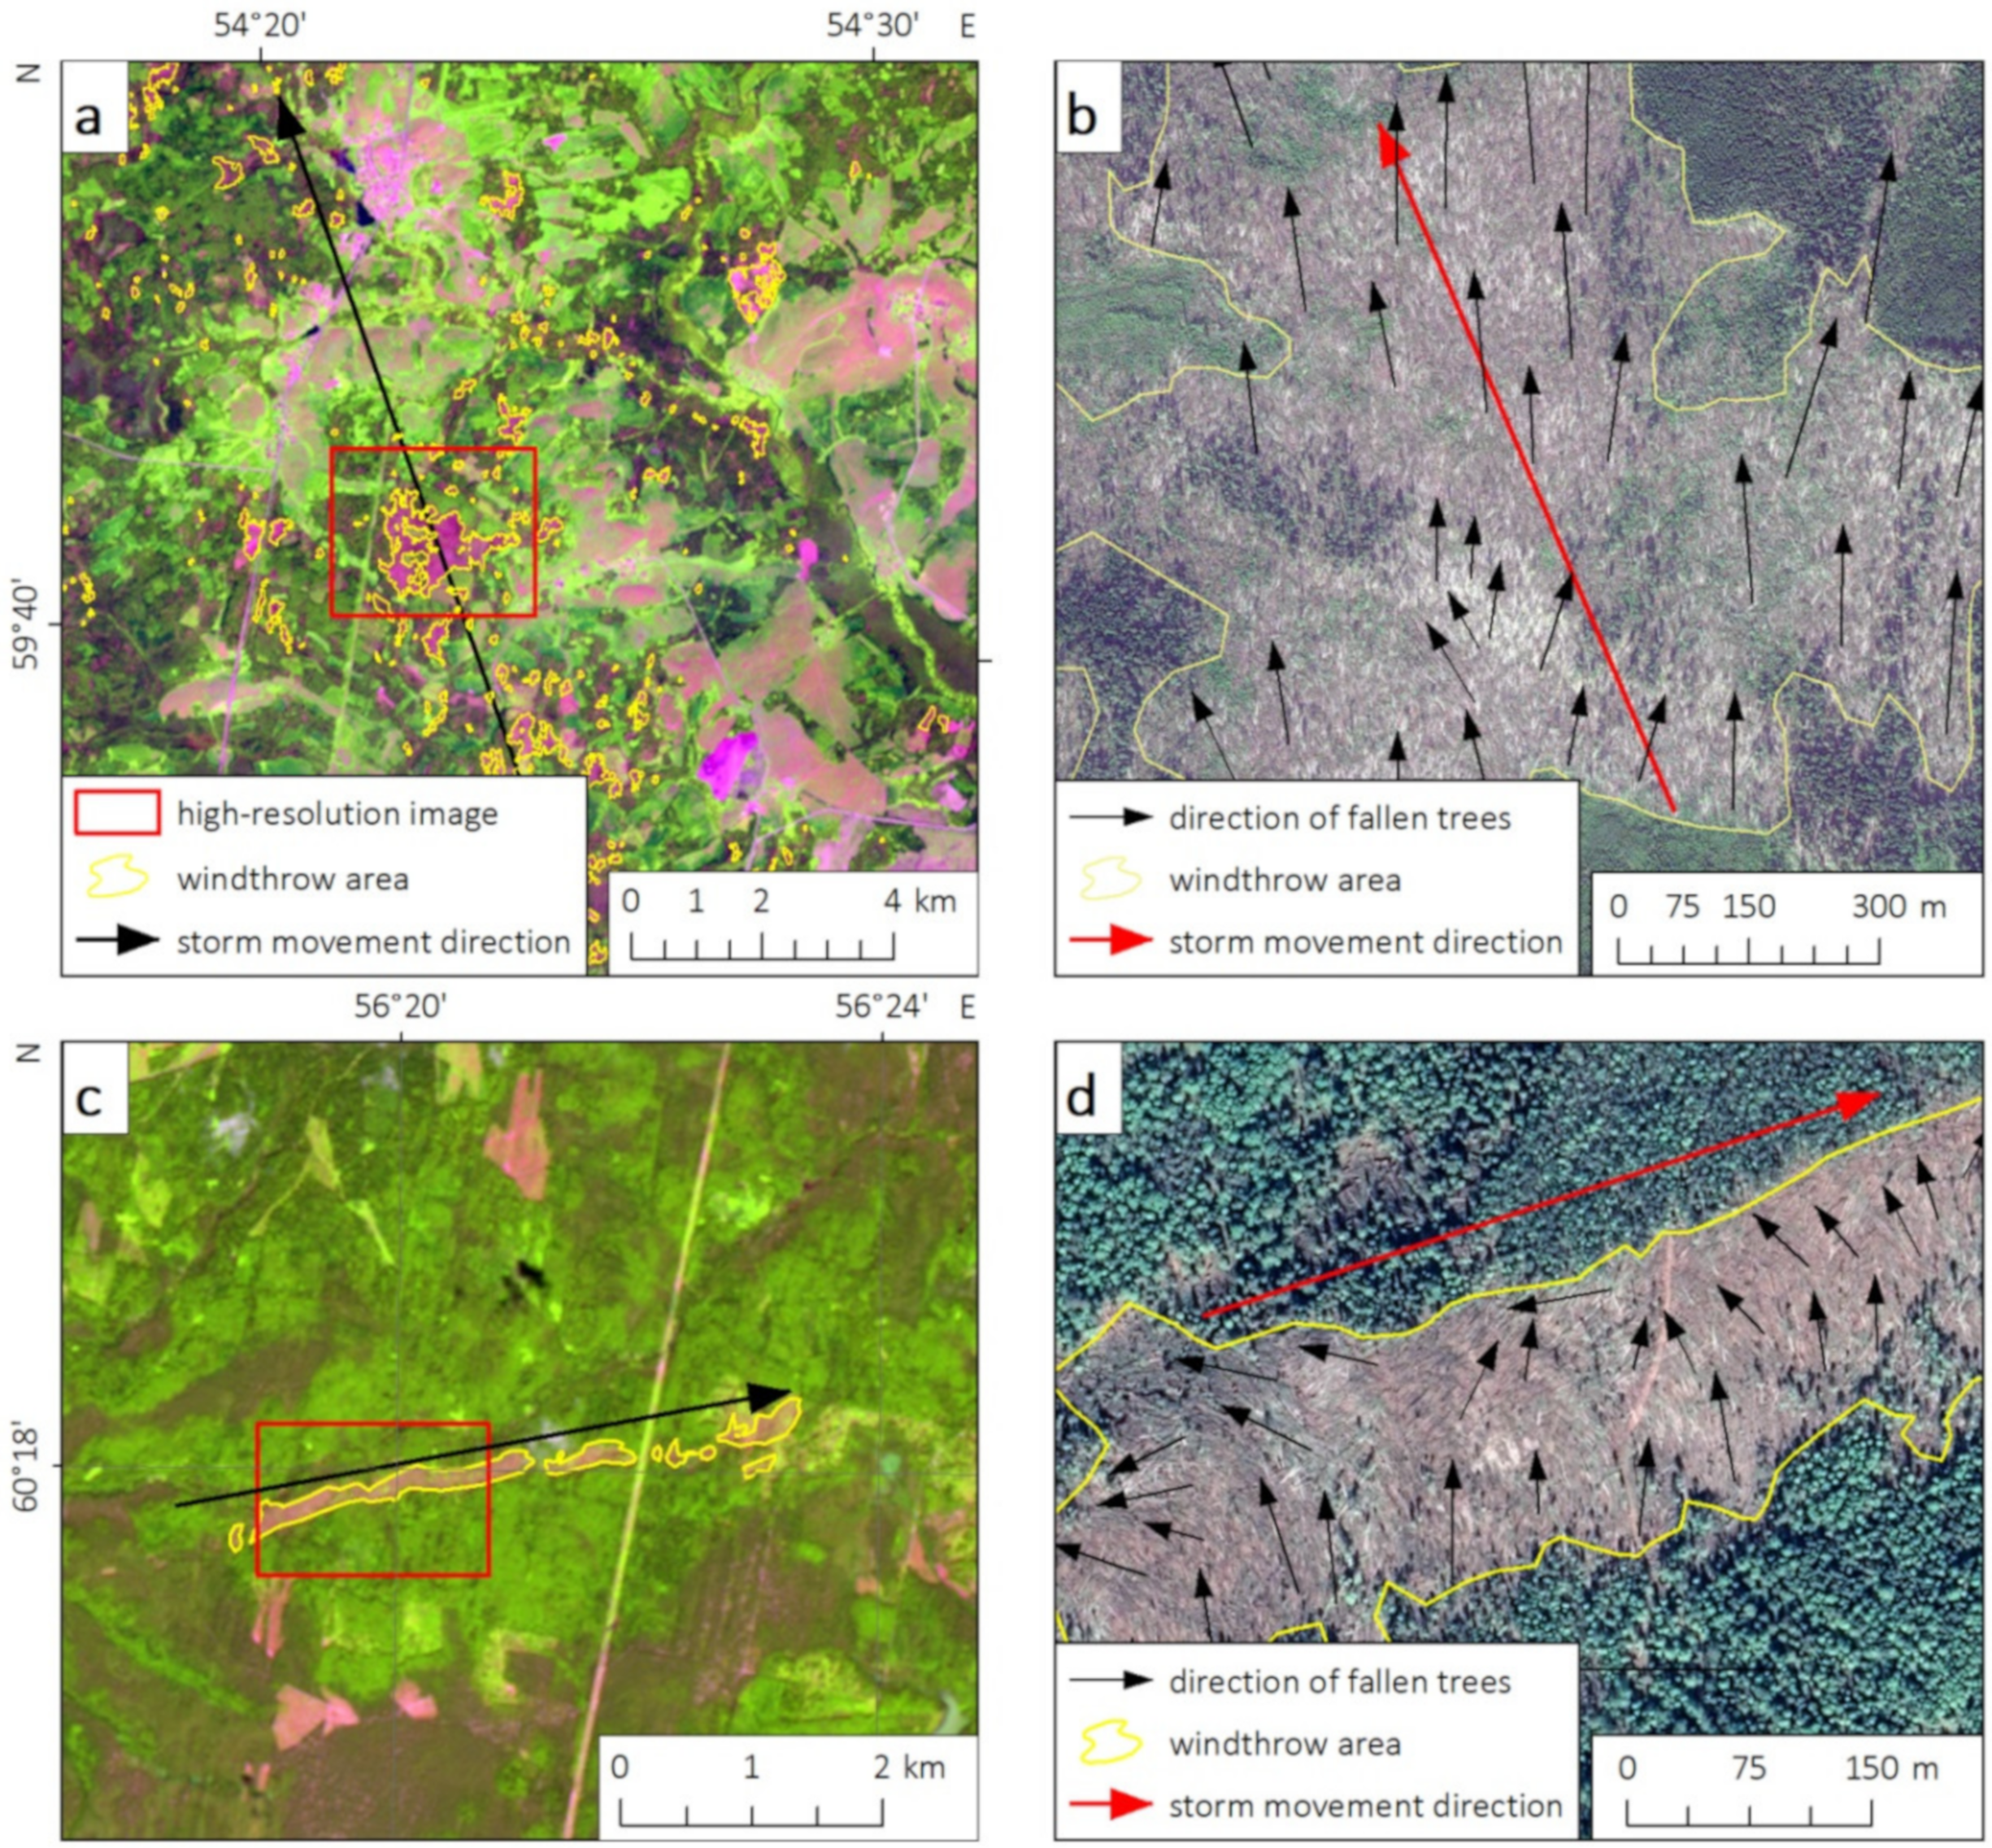
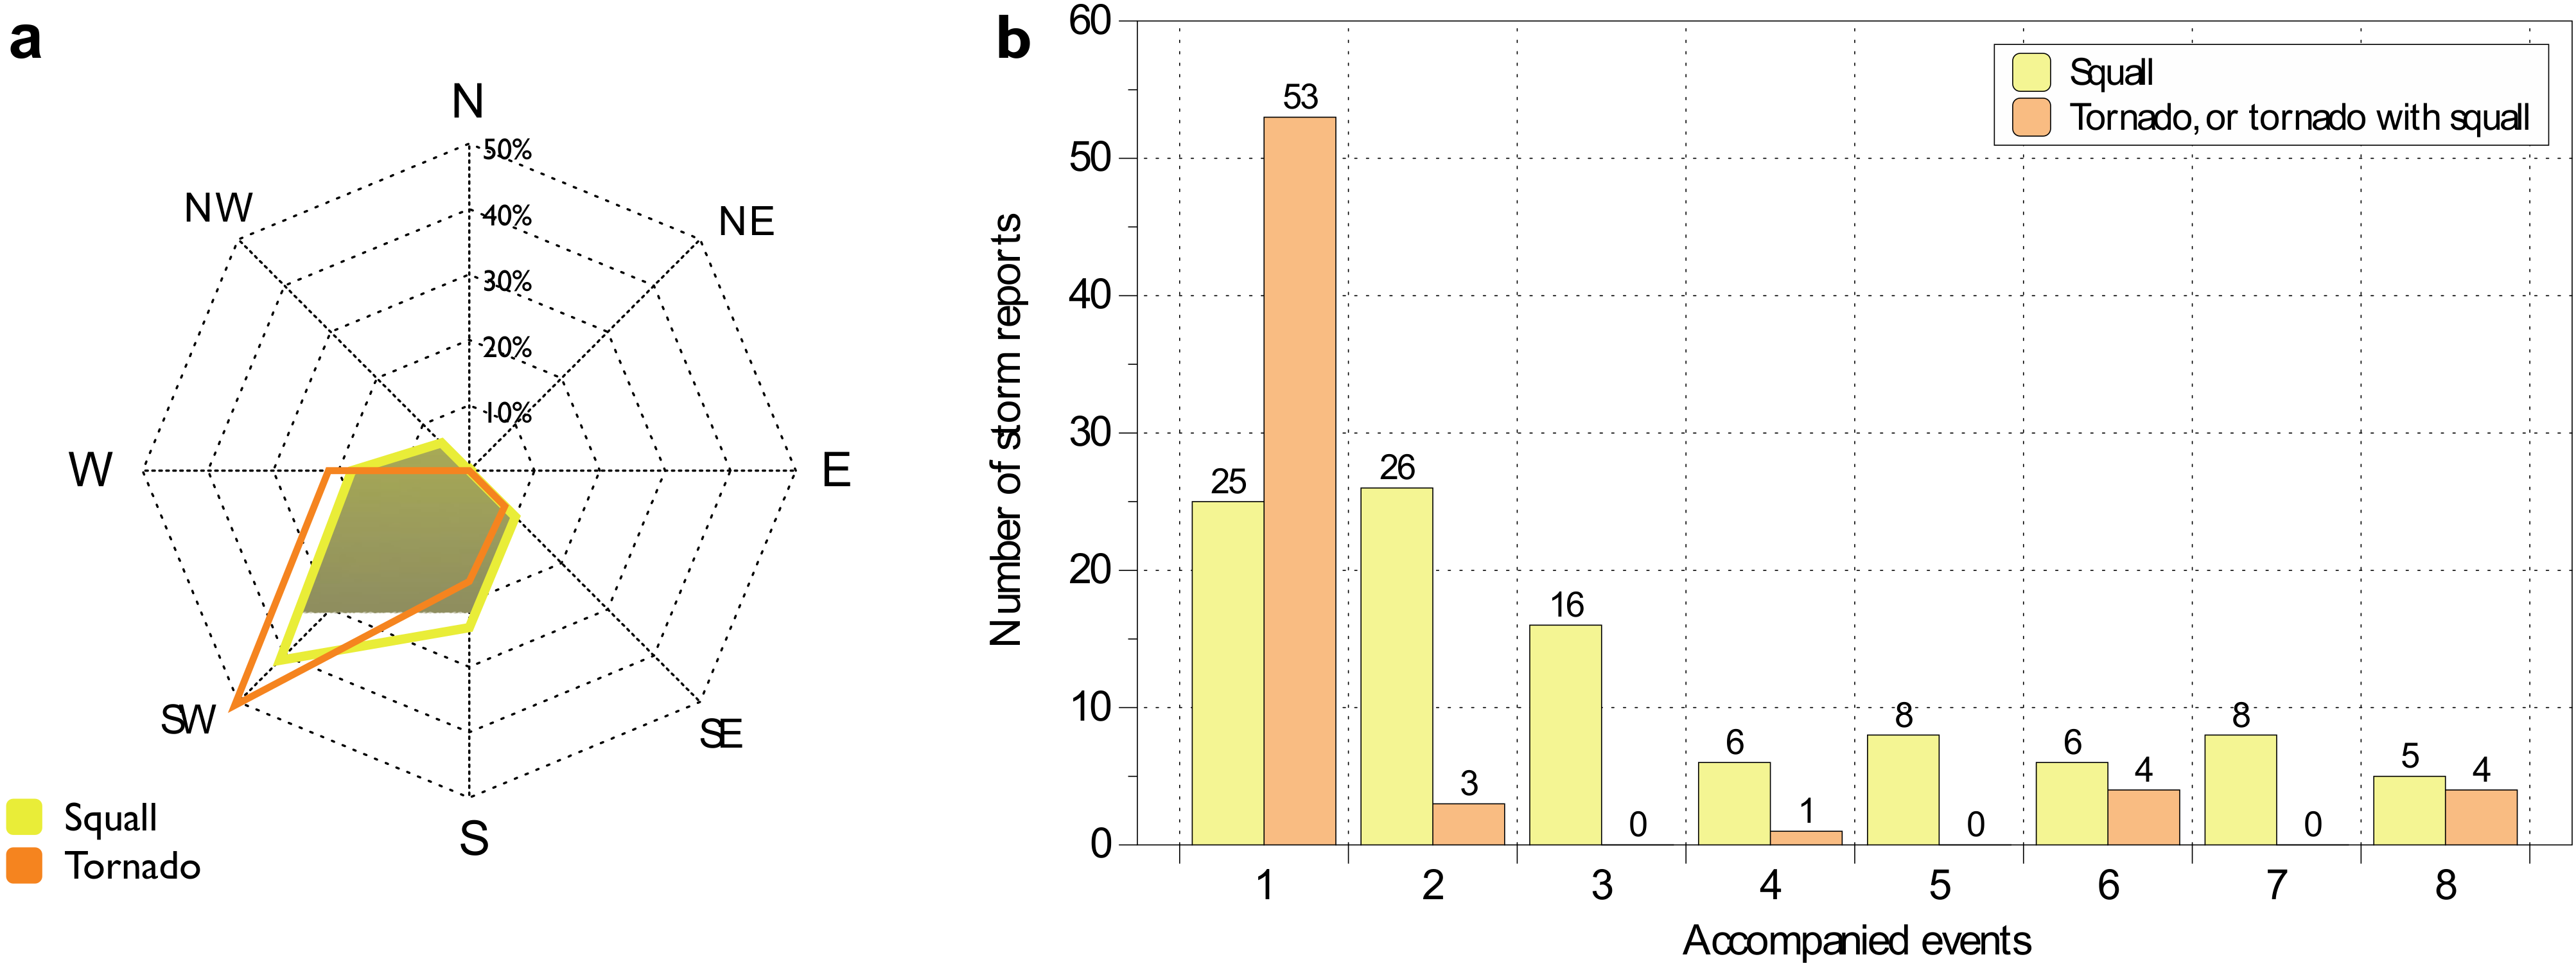
3.2.4. Intensity Characteristics and Movement Direction

We obtained information on wind speed of squalls from direct measurements or damage surveys. Wind speeds were directly measured for 76 squall events, and these ranged from 13 m·s−1 to 35 m·s−1. However, in 25 cases, squalls were observed at a distance from a weather station, ranging from 2 to 61 km. In 38 cases, wind gusts reached the criteria of hazardous weather event (25 m·s−1). In three cases, the observed wind gusts exceeded 33 m·s−1, for example on 10 June 1984 (35 m·s−1), 31 May 1988 (33 m·s−1), and 8 August 2003 (34 m·s−1). However, we found accompaniyng data on any damage only for the 1988 event among these three squalls. The wind speed estimates based on damage survey were obtained for 32 events; they range from 21 m·s−1 to 33 m·s−1. It is of note that 13 squall events had no intensity estimation, but they nevertheless caused substantial damage to forests and/or settlements.
The data on tornado intensity was mainly obtained from the novel climatology [7,24]. For tornadoes, which induced only forest damage, or the information on damage in settlements was fragmentary, we estimated the intensity in probabilistic terms, using the information on tornado track length and maximum width. We used the Weibull distribution parameters that link tornado intensity with path length and maximum width [78]. In particular, we determined a minimal intensity given a particular probability level, e.g., 90% (see [11] for more details on this approach). We found that 20 out of these 53 tornadoes were significant with the ≥F2 intensity (with 90% probability). The intensity of the other 12 tornadoes was estimated according to the Fujita scale [79] based on information from damage and eyewitness reports.
In addition to the intensity characteristics, we compiled the data on weather phenomena that accompanied storm events, since the combined effects of heavy rainfall or hailstorms with strong winds contribute to greater damage [80]. We lack this information for 78 storm events, since these events passed too far from weather stations. For other events, mostly squalls, we found 25 events with heavy rainfall (≥15 mm) and 24 with hail, including five events with large hail. Note that seven events had both hail and heavy rainfall. (Figure 7b).
The direction of movement of squalls and tornadoes is determined by eight rhumbs. Almost 2/3 of events moved from the southwest or from the south, while only one storm moved from the northeast quadrant. This is in line with our previous results for larger regions [7,10,11].

3.2.5. Damage Characteristics

Information on damage associated with the analysed storm events is fragmented and incomplete, especially for the period before 2000. In particular, we obtained specific damage description for seven tornadoes, 67 squalls and three cases with both tornadoes and squalls. Larger economic loss is associated with large-scale squalls, specifically those affecting highly-populated areas. The most damaging squalls occurred on 22 May 2001 and 18 July 2012 (Table 3). Damage associated with tornadoes is local and usually limited to 1–2 settlements, but also substantial in several cases (Table 3). In the northern part of PR, storm events often induce forest damage; however, in the southern part, damage to settlements and infrastructure is more common. Thus, a squall which hit the city of Perm and the adjacent districts on 22 May 2001 resulted in severe damage, death and injury of people, but no windthrow.
During 1984–2020, at least eight fatalities associated with five different squalls have been reported with five fatalities in the city of Perm. It is of note, that four out of eight reported deaths linked to fatal electric shocks because of wind damage to power lines in settlements, while other deaths can be linked to the wind-induced destruction of roofs or bus stops. Also 12 squall events and three tornadoes led to 42 injuries. However, it is likely that the real number of injuries (and less likely fatalities) is underestimated, since casualties for a part of cases may be not reported, especially before 2000 [7]. In addition, the information on injured peoples was published without specifying their number in several cases.

3.3. Synoptic-Scale Environments and Convective Parameters Associated with Storm Events

We analysed synoptic-scale environments and convective parameters for SGE (114), SGEWT (28) SGENT (86), SGEWD (39), and SGEND (75).

3.3.1. Synoptic-Scale Characteristics

Storm events in PR are usually associated with rapidly moving cold fronts (56 SGE), or with waving quasi-stationary/slowly moving fronts (30 SGE) (Table 4), which is in line with results for the entire European Russia [34,81]. The most destructive squalls formed on rapidly moving cold fronts or ahead of it, as well as on quasi-stationary waving fronts. Significant tornadoes are associated with occlusion points, rapidly moving cold fronts, or secondary cold fronts.
In the entire European Russia, most storm events are associated with lows moving from the south, southwest, or from west [34,81]. In PR, they account for 26%, 12%, and 24% of SGE, respectively. Other events are associated with lows moving from northwest (12%) or that formed locally (21%) (Table 4). In a half of all cases, lows deepened when storms occurred. Destructive outbreaks occurred both in well-developed lows moving from the south, southwest, or west and were associated with rapidly moving waves on quasi-stationary or cold fronts.
A third of SGE is associated with heat waves in PR and adjacent areas, when near-surface temperature exceeds long-term mean values by more than 7 °C before an event. These heat waves are associated with blocking highs settled over the South Ural, the southeast of European Russia, or with intense advection of tropical air masses in warm sectors of lows. Among the most destructive windstorms and tornado outbreaks in PR (Table 3), three cases (18 June 1990, 7 June 2009, and 18 July 2012) were associated with heat waves.
Most of squall and tornado events are associated with tropospheric frontal zones and substantial temperature gradients. The mean temperature gradient at the 850 hPa isobaric surface is 8.8 °C/500 km. The temperature gradient at 850 hPa is significantly higher for SGEWD compared to SGEND (10.1 °C/500 and 8.0 °C/500 km respectively) (based on the K-S test) (Figure 8a). Squall and tornado events are mainly associated with high near-surface humidity. The median values of 2 m dewpoint temperature and 3D index [67] are 15 °C and 13.1 °C, respectively (Figure 8b,c).
Analysis of 72-h air parcel backward trajectories shows that most storm events are associated with low-level advection from the south, southwest, or west (Figure 9a). The highest density of starting points is observed over the Caspian and Aral Seas, which indicates the importance of these water bodies as near-surface moisture sources for windstorm and tornado formation (see also [11,74,81]). However, most of starting points of backward trajectories are located over land, which indicate local evapotranspiration and moisture convergence being the main sources of low-level moisture for the formation of squalls and tornadoes in PR. In general, a substantial part of SGEND formed under low-gradient environments and have the starting points of their trajectories closer to PR than SGEWD (Figure 9b,c).

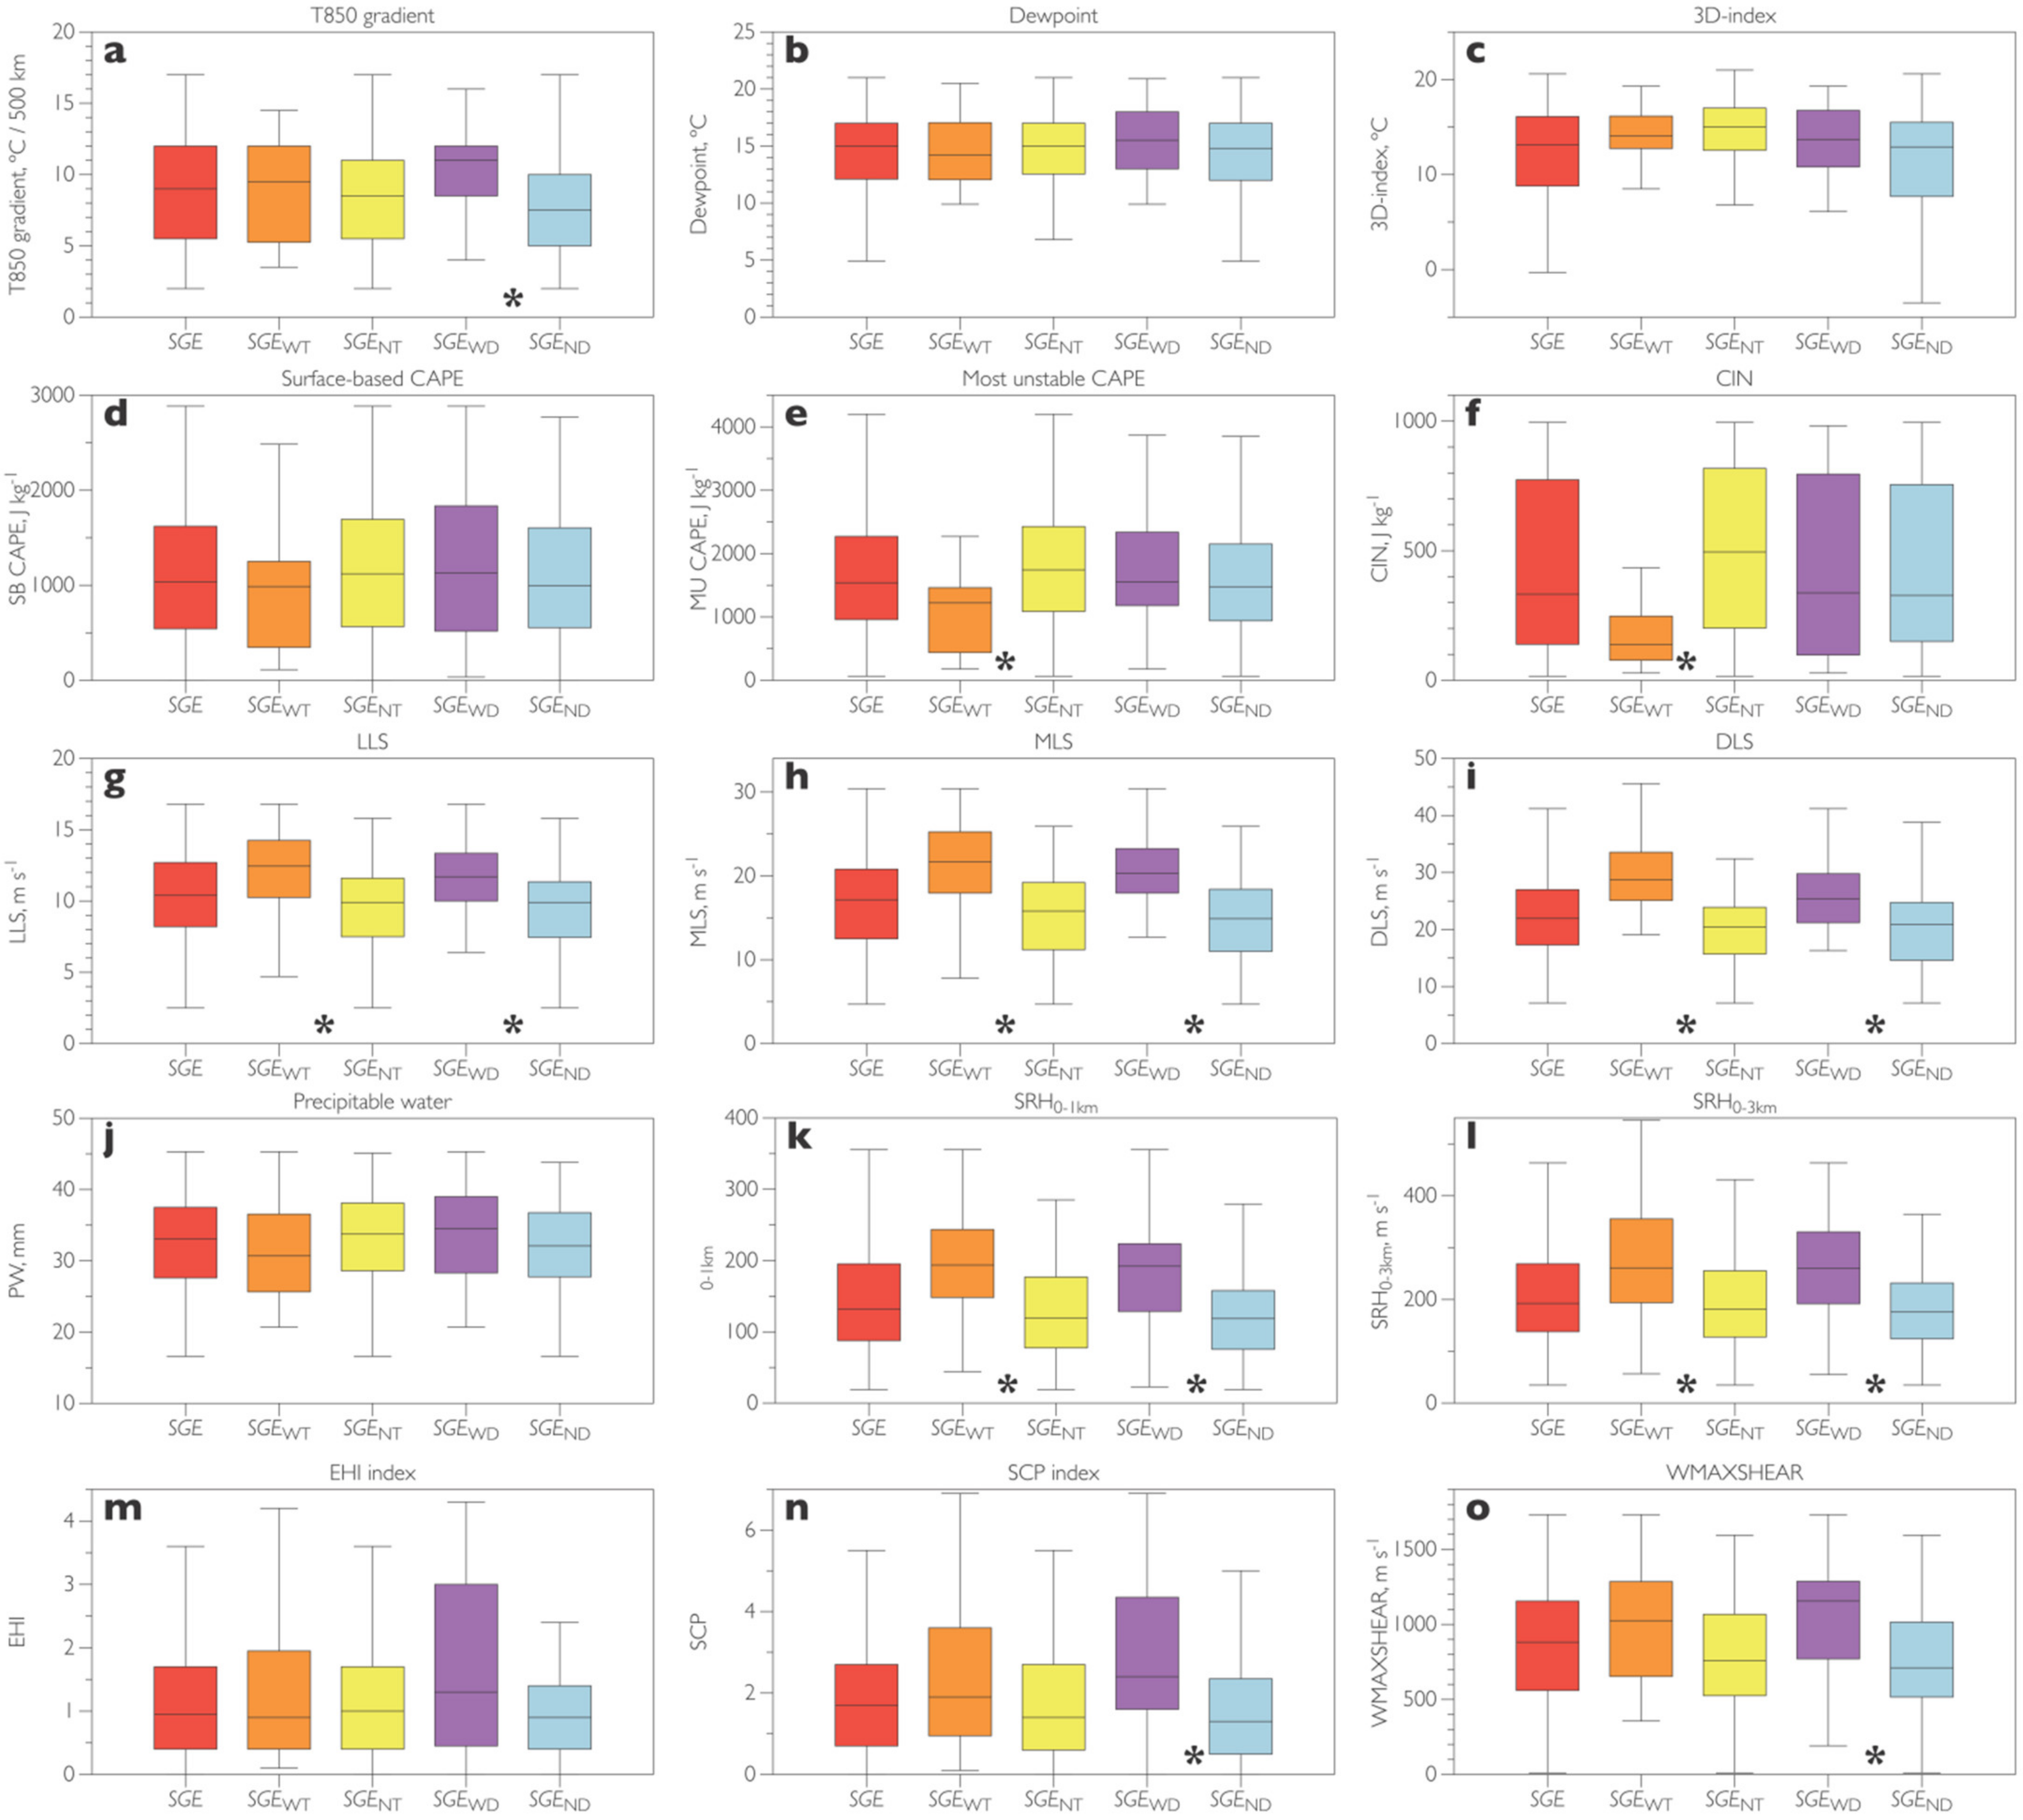
3.3.2. Convective and Kinematic Parameters

We found that 76% of SGE are formed under strong thermodynamic instability (MU CAPE > 1000 J kg−1). The highest values of SB CAPE exceeded 2500 J kg−1, and MU CAPE reached 3500–4200 J kg−1, when tropical air masses with high precipitable water content (≥40 mm) spread to PR. The difference in MU CAPE values between SGEWT and SGENT is statistically significant; non-tornadic events have higher CAPE, which is in line with previous findings for European Russia [34] and Europe [37,41]. Convective inhibition is also a good discriminator for SGEWT and SGENT, particularly, the CIN median is three times lower for tornadoes (138 J kg−1) compared to those for squalls (495 J kg−1). This difference is partly associated with seasonal distribution of the events. Particularly, several tornadic events occurred in September, when CAPE substantially reduced comparing with summer months. On the other hand, the environments with high CAPE and weak wind shear (typical for mid-summer) contribute to the formation of local microbursts rather than tornadoes [41].
In turn, no significant difference in CAPE values between SGEWD and SGEND were found (Figure 8d,e, Tables S1 and S2). The median values of both SB CAPE and MU CAPE are substantially higher than the median CAPE for convective windstorms and tornadoes in Europe, according to sounding data [6,37] and ERA5 reanalysis [41], and close to the same values in the U.S [41].
Median precipitable water content (PW) for all storm events is 32.6 mm. The highest values of PW (45 mm) are associated with SGE in mid-summer, particularly with the outbreak of 18 July 2012. The differences in PW values between SGEWT and SGENT, as well as SGEWD and SGEND are not significant (Figure 8f). This is in contrast to our previous findings for the entire European Russia [34], where we found that PW for tornadoes is significantly lower than for squall events. This discrepancy is probably sampling-driven, since our sample for PR includes several squall events that occurred under low PW. For instance, squalls that occurred on 2–3 May 2013 before the start of the vegetation growing season, had rather low PW (<15 mm). Median PW for tornadic events is substantially higher than in Europe, but lower, than in the U.S, while for non-tornadic storms, median PW is close to the same in Europe and 6–7 mm lower, that in the U.S. [41].
The median value of 0-6 km wind shear (DLS) for all storm events is 22 m·s−1, and 65% of them formed under DLS ≥ 20 m·s−1. Storm events that occurred in September of 2018 and 2019 were associated with the highest values of DLS (≥40 m·s−1), but rather low CAPE (MU CAPE < 500 J kg−1). In total, only 14 storm events, including five tornadic storms and two significant tornadoes, were associated with the so called ‘high-shear, low CAPE’ (HSLC) environments [82], and 11 of them (79%) occurred in May or September. The most severe outbreak in HSLC environments occurred on 13 September 2018 in the northern part of PR (Table 3) (see [29] for details). In turn, 46% of squalls and tornadoes in PR occurred under high-shear and high CAPE environments (MU CAPE > 500 J kg−1 and DLS > 20 m·s−1), which is favourable for occurrence of both quasi-linear convective systems [41,83] and tornadoes [34,35,39,40,41]. In particular, seven out of the 11 most severe squall and tornado outbreaks in PR (Table 3) happened under high MU CAPE and DLS. In synoptic-scale context, such environments are mainly associated with advection of warm and moist air masses from south or southwest, while HSLC environments are associated with western or northwestern mid-level flows.
Only 11 squalls, and not a single tornado in PR happened under high-CAPE and low shear environments (MU CAPE > 1000 J kg−1 and DLS < 12 m·s−1), which are associated with low-gradient baric fields and/or a flank of high-pressure systems. Such environments are favourable mainly for microbursts [41,84], affecting local areas (reported in only one settlement), and none of them caused windthrow. Substantial damage was reported only when microbursts hit the city of Perm (16 June 1998 and 24 June 2015), but it was associated with coupled effect of wind gusts, hailstorm, and heavy rainfall.
High values of 0–3 km and 0–1 km wind shear (MLS and LLS respectively) are crucial for tornadoes, including strong ones [36,37,38,40,41]. The median value of LLS for all storm events is 10.4 m·s−1. All shear parameters are significantly higher for SGEWT compare to SGENT (Figure 8g–i), which is in line with estimates for European Russia [34], Europe and the United States [36,37,38,40,41], despite the relatively small sample size in our study. A significant difference was also found between SGEWD and SGEND.
It is noteworthy that the median DLS and MLS for tornadic events in PR are substantially higher than in Europe, and close to the same for F2-F3 tornadoes in the U.S. [41]. For non-tornadic events, median DLS, MLS and LLS in PR are higher than both in Europe and the U.S. [41]. This difference may be associated with different approaches to the storm reports collection, specifically, with stronger filtering of reports associated with non-severe events in PR comparing with Europe and U.S.
Helicity parameters, especially 0–1 km SRH, are also important to identify the environments favorable for tornadogenesis [85]. We found 0–3 km SRH and 0–1 km SRH are significantly higher for SGEWT compared to SGENT, and for SGEWD compare to SFEND (Figure 8k,l). In general, storm events that occurred in the central part of rapidly deepening lows are characterised by the highest values of 0–1 km SRH (>400 m2·s−2). Like wind shear, the median 0–3 km SRH for non-tornadic events in PR is substantially higher than in Europe and the U.S. For tornadic events, median 0–3 km SRH is slightly lower than the same values for F2-F3 tornadoes in the U.S. and much higher than in Europe [41].
All composite parameters discriminate SGEWD and SGEND well, especially SCP and WMAXSHEAR (Figure 8l–o). Thus, squalls and tornadoes causing windthrow are formed in environments with higher values of these indices. For SGEWT and SGENT, we did not find a statistically significant difference in the values of all composite parameters. The highest values of composite indices are associated with high-shear and high CAPE environments, favourable both for tornadoes and squalls. Thus, the highest values of WMAXSHEAR (up to 1700 m·s−1) were observed on 29 June 1993, when three tornadoes hit the western part of PR, including two nocturnal tornadoes (Table 3). The median SCP for both tornadic and non-tornadic events in PR is lower than in the U.S. and close to being the same as in Europe. In the same time, the median WMAXSHEAR is higher than in Europe and the U.S., which is associated with higher values of CAPE and DLS for both tornadic and non-tornadic events.

4. Discussion and Concluding Remarks

In this study, we have analysed squall and tornado events that occurred in the Perm region (PR, in the northeast of European Russia) between 1984 and 2020. We compiled a database on squalls and tornadoes using multiple data sources such as weather station reports, damage reports, media and eye-witness reports, and forest damage that was analysed based on Landsat and Sentinel-2 satellite images. The data from previously presented databases of tornadoes [7,24] and windthrow events [10] were updated and included in the new database. In total, we compiled information on 100 convective windstorms (squalls) with wind gusts ≥ 25 m·s−1, and/or causing substantial damage to property, infrastructure, or forests stands, on 59 tornadoes and six cases with both tornadoes and squalls. We provide the database in the Supplementary Materials.
We found that satellite-derived information on windthrow has crucial importance for estimating the actual number of tornadoes in PR. Thus, 51 of 65 events with tornadoes were identified with satellite data only, which is in line with recent studies in Russia [7,11,24] and Canada [13]. In turn, information on squalls was mainly obtained from weather station or damage reports. Since damage survey reports and media reports are fragmentary for the period before 2000, the compiled database is likely incomplete and temporally inhomogeneous. These shortcomings of our estimates of climatic characteristics of storm events, especially features of spatial distribution, diurnal cycle, and months of peak frequency, should be kept in mind and the results should be treated with caution.
The spatial distribution of events depends on a relatively small sample and population density. Many local maxima of convective storm report density are mostly associated with several outbreaks, particularly, over northwest and southwest of PR. However, the absolute maximum of storm report density is located in the most populated area of PR near the city of Perm. This dependence on population density indicates overall database incompleteness and is generally in concordance with the findings entirety of Russia [24], Europe [8,86], and North America [87,88].
Several major outbreaks also determine the inter-annual variability of squalls and tornado events in PR. Particularly, they result in two peaks in 2009 and 2012. These two years are characterised by the highest frequency of windthrow events in the forest zone of the entirety of European Russia [10]. The monthly distribution and diurnal cycle of squall and tornado events in PR mainly coincides with tornadoes in Russia [7,24] and for severe convective storms in most European countries [4,6]. In particular, the maximum for squalls is found in July and from 15 to 18 h local time, while for tornadoes, the maximum is in June and from 18 to 21 h local time.
Many events in our database were rather intense. Among 76 squall events reported by a weather station (out of all 100 events), we found that 38 events had measured wind gusts ≥25 m·s−1, and three events were with hurricane-force wind gusts (≥33 m·s−1). Among 65 tornadoes, we found 20 significant tornadoes (F-scale intensity ≥ F2), according to probabilistic estimate based on tornado track length and width. Combining weather station reports, damage reports and forest damage assessment, we highlighted the 11 most impactful storm events in PR. We confirmed seven multiple tornado events (two or more tornadoes per day) and found that 39 of 65 known tornadoes were associated with such events.
Intense convective squalls and tornadoes resulted in damage to forested areas and settlements in PR. As for European countries [6,20], for PR we found the greatest damage being associated with widespread convective windstorms (squalls), while tornado-induced damage is rather local. We matched 82 of 165 storm reports with windthrow events, including 55 tornado reports and 27 squall reports. The total area of squall- and tornado-induced windthrow within PR is 332.5 km2 (0.27% of forest-covered area), which is slightly higher than for the entire forest zone of European Russia (0.19%), and 13% of the damaged area is associated with tornadoes. During 1984–2020, convective windstorms led to eight fatalities and 42 injuries in PR. However, these numbers are likely underestimated, especially for the period before 2000.
We analysed synoptic- and meso-scale formation environments for the events from our database. Both squalls and tornadoes most often occurred on rapidly moving cold fronts or on waving quasi-stationary fronts, associated with lows moving from the southwest quadrant. Almost half (46%) of squall and tornado events in PR are formed in high CAPE and high shear environments. Only 14 events (8.5%) are associated with high shear and low CAPE (HSLC) environments, and 11 of them occurred in May and in September, when air masses have relatively low moisture content and instability. Therefore, the share of the HSLC events in PR is substantially lower than in Europe [6,41], where up to 50% significant tornadoes formed under the HSLC environments [41].
In general, non-tornadic storms in PR are characterised by higher CAPE and higher CIN than the events with tornadoes, which is consistent with the recent studies for European Russia [43] and European countries [36,37,38,41]. In turn, shear and helisity parameters are significantly higher for events with tornadoes.
Storm events causing windthrow mainly occur under conditions more favourable for deep well-organised convection. Shear and helicity parameters, as well as SCP and WMAXSHEAR indices are significantly higher for the events that resulted in windthrow compare to the events that resulted in no windthrow. The advantages of WMAXSHEAR to identify severe thunderstorm environments were previously shown by [37,41]. Therefore, we may conclude that forest damage can be considered as an indicator of the storm severity in PR and in the adjacent Russian regions with forest-covered area > 50%.
The median values of most convective and kinematic indices (CAPE, PW, shear parameters, 0–3 km SRH, WMAXSHEAR) for storm events in PR are substantially higher than in Europe and close to the same as in the U.S. [41]. This difference can be sample-driven, i.e., associated with the features of seasonal distribution (all events in PR occurred in warm season, which increases CAPE and PW), or be a result of different approaches to the storm reports collection, specifically, with stronger filtering of the reports associated with non-severe storms in PR compared to Europe. But the difference can be also associated with features of synoptic-scale processes. The comparative analysis of contribution of various causes to the discovered difference deserves further analysis.
The estimated values of convective parameters associated with squalls and tornadoes may be successfully used for short-term forecasting of these events in PR and in adjacent areas. Peculiarities in mesoscale aspects of squall and tornado formation that were found can be taken into account in future studies of these phenomena over European Russia. The presented database can be used for risk assessment, particularly, under climate change adaptation actions.

Supplementary Materials

The following are available online at https://www.mdpi.com/article/10.3390/atmos12111407/s1. Table S1: Median, minimum and maximum values, 25th and 75th percentiles of major indicators and convective indices for SGEWT/SGENT. Table S2: The same as in Table S1 but for SGEWD/SGEND. Database of storm events in Perm region (.zip archive with .shp files and QGIS project).

Author Contributions

Conceptualization, A.C., A.S., N.K.; Methodology: A.S., A.C.; Data Collection and Compilation, A.S., E.P.; Data Processing, A.C., A.B.; Validation: A.S., A.C.; Writing—original draft preparation, A.S.; Writing—review and editing, A.C., N.K.; Visualization: A.S., A.C.; Supervision: A.C., N.K.; Funding Acquisition: A.C. All authors have read and agreed to the published version of the manuscript.

Funding

The study was funded by the Ministry of Science and Higher Education of the Russian Federation under the agreement No 075-15-2020-776.

Institutional Review Board Statement

Not applicable.

Informed Consent Statement

Not applicable.

Data Availability Statement

The data that support the findings of this study are available in the Supplementary Materials. Any additional data are available from the corresponding author upon reasonable request.

Acknowledgments

We thank three anonymous reviewers for their valuable and constructive comments that helped to improve our manuscript.

Conflicts of Interest

The authors declare no conflict of interest.

References

  1. Goliger, A.M.; Milford, R.V. A review of worldwide occurrence of tornadoes. J. Wind Eng. Ind. Aerodyn. 1998, 74–76, 111–121. [Google Scholar] [CrossRef]
  2. Groenemeijer, P.; Púčik, T.; Holzer, A.M.; Antonescu, B.; Riemann-Campe, K.; Schultz, D.M.; Kühne, T.; Feuerstein, B.; Brooks, H.E.; Doswell, C.A.; et al. Severe convective storms in Europe: Ten years of research and education at the European Severe Storms Laboratory. Bull. Am. Meteorol. Soc. 2017, 98, 2641–2651. [Google Scholar] [CrossRef]
  3. Brooks, H.E.; Doswell, C.A., III; Zhang, X.; Chernokulsky, A.; Tochimoto, E.; Hanstrum, B.; Nascimento, E.; Sills, D.; Antonescu, B.; Barrett, B. A century of progress in severe convective storm research and forecasting. Meteor. Monogr. 2018, 59, 18.1–18.41. [Google Scholar] [CrossRef]
  4. Taszarek, M.; Groenemeijer, P.; Allen, J.T.; Edwards, R.; Brooks, H.E.; Chmielewski, V.; Enno, S.E. Severe convective storms across Europe and the United States. Part I: Climatology of lightning, large hail, severe wind, and tornadoes. J. Clim. 2020, 33, 10239–10261. [Google Scholar] [CrossRef]
  5. Antonescu, B.; Schultz, D.M.; Holzer, A.; Groenemeijer, P. Tornadoes in Europe: An Underestimated Threat. Bull. Amer. Meteor. Soc. 2017, 98, 713–728. [Google Scholar] [CrossRef]
  6. Pacey, G.P.; Schultz, D.M.; Garcia-Carreras, L. Severe convective windstorms in Europe: Climatology, preconvective environments, and convective mode. Weather Forecast. 2021, 36, 237–252. [Google Scholar] [CrossRef]
  7. Chernokulsky, A.; Kurgansky, M.; Mokhov, I.; Shikhov, A.; Azhigov, I.; Selezneva, E.; Zakharchenko, D.; Antonescu, B.; Kühne, T. Tornadoes in Northern Eurasia: From the Middle Age to the Information Era. Mon. Weather Rev. 2020, 148, 3081–3111. [Google Scholar] [CrossRef] [Green Version]
  8. Groenemeijer, P.; Kuhne, T. A climatology of tornadoes in Europe: Results from the European severe weather database. Mon. Weather Rev. 2014, 142, 4775–4790. [Google Scholar] [CrossRef]
  9. Wulder, M.A.; Masek, J.G.; Cohen, W.B.; Loveland, T.R.; Woodcock, C.E. Opening the archive: How free data has enabled the science and monitoring promise of Landsat. Remote Sens. Environ. 2012, 122, 2–10. [Google Scholar] [CrossRef]
  10. Shikhov, A.N.; Chernokulsky, A.V.; Azhigov, I.O.; Semakina, A.V. A satellite-derived database for stand-replacing windthrow events in boreal forests of European Russia in 1986–2017. Earth Syst. Sci. Data 2020, 12, 3489–3513. [Google Scholar] [CrossRef]
  11. Shikhov, A.N.; Chernokulsky, A.V. A satellite-derived climatology of unreported tornadoes in forested regions of northeast Europe. Remote Sens. Environ. 2018, 204, 553–567. [Google Scholar] [CrossRef]
  12. Burow, D.; Herrero, H.V.; Ellis, K.N. Damage analysis of three long-track tornadoes using high-resolution satellite imagery. Atmosphere 2020, 11, 613. [Google Scholar] [CrossRef]
  13. Sills, D.M.L.; Kopp, G.A.; Elliott, L.; Jaffe, A.L.; Sutherland, L.; Miller, C.S.; Kunkel, J.M.; Hong, E.; Stevenson, S.A.; Wang, W. The northern tornadoes project: Uncovering Canada’s true tornado climatology. Bull. Amer. Meteorol. Soc. 2020, 101, E2113–E2132. [Google Scholar] [CrossRef]
  14. Rodríguez, O.; Bech, J.; Arús, J.; Castán, S.; Figuerola, F.; Rigo, T. An overview of tornado and waterspout events in Catalonia (2000–2019). Atmos. Res. 2021, 250, 105415. [Google Scholar] [CrossRef]
  15. Taszarek, M.; Brooks, H.E. Tornado climatology of Poland. Mon. Wea. Rev. 2015, 143, 702–717. [Google Scholar] [CrossRef]
  16. Miglietta, M.M.; Matsangouras, I.T. An updated “climatology” of tornadoes and waterspouts in Italy. Int. J. Climatol. 2018, 38, 3667–3683. [Google Scholar] [CrossRef] [Green Version]
  17. Matsangouras, I.T.; Nastos, P.T.; Bluestein, H.B.; Sioutas, M.V. A climatology of tornadic activity over Greece based on historical records. Int. J. Climatol. 2014, 34, 2538–2555. [Google Scholar] [CrossRef]
  18. Kahraman, A.; Markowski, P.M. Tornado climatology of Turkey. Mon. Weather Rev. 2014, 142, 2345–2352. [Google Scholar] [CrossRef] [Green Version]
  19. Chen, J.; Cai, X.; Wang, H.; Kang, L.; Zhang, H.; Song, Y.; Zhu, H.; Zheng, W.; Li, F. Tornado climatology of China. Int. J. Climatol. 2017, 38, 2478–2489. [Google Scholar] [CrossRef]
  20. Gatzen, C.P.; Fink, A.H.; Schultz, D.M.; Pinto, J.G. An 18-year climatology of derechos in Germany. Nat. Hazards Earth Syst. Sci. 2020, 20, 1335–1351. [Google Scholar] [CrossRef]
  21. Bedritskii, A.I.; Korshunov, A.A.; Korshunova, N.N.; Lamanov, V.I.; Shaimardanov, M.Z. Hazardous hydrometeorological phenomena and their impact on Russia’s economy: Destructive-force winds. Russ. Meteorol. Hydrol. 2001, 9, 1–9. (In Russian) [Google Scholar]
  22. Chernokulsky, A.V.; Shikhov, A.N. 1984 Ivanovo tornado outbreak: Determination of actual tornado tracks with satellite data. Atmos. Res. 2018, 207, 111–121. [Google Scholar] [CrossRef]
  23. Moscow Storm Kills 16, Injures Nearly 170. Available online: https://edition.cnn.com/2017/05/30/europe/moscow-storm/index.html (accessed on 7 July 2021).
  24. Chernokulsky, A.V.; Kurgansky, M.V.; Mokhov, I.I.; Shikhov, A.N.; Azhigov, I.O.; Selezneva, E.V.; Zakharchenko, D.I.; Antonescu, B.; Kuhne, T. Tornadoes in the Russian Regions. Russ. Meteorol. Hydrol. 2021, 46, 69–82. [Google Scholar] [CrossRef]
  25. Chernokulsky, A.; Shikhov, A.; Bykov, A.; Azhigov, I. Satellite-Based Study and Numerical Forecasting of Two Tornado Outbreaks in the Ural Region in June 2017. Atmosphere 2020, 11, 1146. [Google Scholar] [CrossRef]
  26. Chernokulsky, A.V.; Kurgansky, M.V.; Zakharchenko, D.I.; Mokhov, I.I. Genesis Environments and Characteristics of the Severe Tornado in the South Ural on August 29, 2014. Russ. Meteorol. Hydrol. 2015, 40, 794–799. [Google Scholar] [CrossRef]
  27. Dmitrieva, T.G.; Peskov, B.E. Synoptic conditions, nowcasting, and numerical prediction of severe squalls and tornados in Bashkortostan on June 1, 2007 and August 29, 2014. Russ. Meteorol. Hydrol. 2016, 41, 673–682. [Google Scholar] [CrossRef]
  28. Shikhov, A.N.; Bykov, A.V. Study of two cases of severe tornadoes in the Predural’e region. Sovrem. Probl. Distantsionnogo Zondirovaniya Zemli iz Kosm. 2015, 12, 124–133. (In Russian) [Google Scholar]
  29. Shikhov, A.N.; Kalinin, N.A.; Bykov, A.V.; Azhigov, I.O.; Humikhina, A.V. Tornadoes in the environments of weak convective instability: Analysis of two cases in the eastern part of the European Russia. Sovrem. Probl. Distantsionnogo Zondirovaniya Zemli iz Kosm. 2020, 17, 255–268. (In Russian) [Google Scholar] [CrossRef]
  30. Dmitrieva, T.G.; Peskov, B.E. Numerical forecast with the mesosynoptic specification of extremely severe squalls in the European part of Russia (Case study for June 13 and July 29, 2010). Russ. Meteorol. Hydrol. 2013, 38, 71–79. [Google Scholar] [CrossRef]
  31. Novitskii, M.A.; Pavlyukov, Y.B.; Shmerlin, B.Y.; Makhnorylova, S.V.; Serebryannik, N.I.; Petrichenko, S.A.; Tereb, L.A.; Kalmykova, O.V. The tornado in Bashkortostan: The potential of analyzing and forecasting tornado-risk conditions. Russ. Meteorol. Hydrol. 2016, 41, 683–690. [Google Scholar] [CrossRef]
  32. Romanskii, S.O.; Verbitskaya, E.M.; Ageeva, S.V.; Istomin, D.P. Tornado in the City of Blagoveshchensk on July 31, 2011. Russ. Meteorol. Hydrol. 2018, 43, 574–580. [Google Scholar] [CrossRef]
  33. Kalinin, N.A.; Shikhov, A.N.; Bykov, A.V. Forecasting mesoscale convective systems in the Urals using the WRF model and remote sensing data. Russ. Meteorol. Hydrol. 2017, 42, 9–18. [Google Scholar] [CrossRef]
  34. Kalinin, N.A.; Shikhov, A.N.; Chernokulsky, A.V.; Kostarev, S.V.; Bykov, A.V. Environments of Formation of Severe Squalls and Tornadoes Causing Large-scale Windthrows in the Forest Zone of European Russia and the Ural. Russ. Meteorol. Hydrol. 2021, 46, 83–93. [Google Scholar] [CrossRef]
  35. Rasmussen, E.N.; Blanchard, D.O. A baseline climatology of sounding-derived supercell and tornado forecast parameters. Weather Forecast. 1998, 13, 1148–1164. [Google Scholar] [CrossRef] [Green Version]
  36. Púčik, T.P.; Groenemeijer, P.; Rýva, D.; Kolář, M. Proximity soundings of severe and nonsevere thunderstorms in central Europe. Mon. Weather Rev. 2015, 143, 4805–4821. [Google Scholar] [CrossRef]
  37. Taszarek, M.; Brooks, H.E.; Czernecki, B. Sounding-derived parameters associated with convective hazards in Europe. Mon. Weather Rev. 2017, 145, 1511–1528. [Google Scholar] [CrossRef]
  38. Brooks, H.E.; Lee, J.W.; Craven, J.P. The spatial distribution of severe thunderstorm and tornado environments from global reanalysis data. Atmos. Res. 2003, 67–68, 73–94. [Google Scholar] [CrossRef]
  39. Brooks, H.E. Proximity soundings for severe convection for Europe and the United States from reanalysis data. Atmos. Res. 2009, 93, 546–553. [Google Scholar] [CrossRef]
  40. Grams, J.S.; Thompson, R.L.; Snively, D.V.; Prentice, J.A.; Hodges, G.M.; Reames, L.J. A climatology and comparison of parameters for significant tornado events in the United States. Weather Forecast. 2012, 27, 106–123. [Google Scholar] [CrossRef]
  41. Taszarek, M.; Allen, J.T.; Púcik, T.; Hoogewind, K.A.; Brooks, H.E. Severe convective storms across Europe and the United States. Part II: ERA5 environments associated with lightning, large hail, severe wind, and tornadoes. J. Clim. 2020, 33, 10263–10286. [Google Scholar] [CrossRef]
  42. Gensini, V.A.; Mote, T.L.; Brooks, H.E. Severe-thunderstorm reanalysis environments and collocated radiosonde observations. J. Appl. Meteor. Climatol. 2014, 53, 742–751. [Google Scholar] [CrossRef]
  43. Taszarek, M.; Brooks, H.E.; Czernecki, B.; Szuster, P.; Fortuniak, K. Climatological aspects of convective parameters over Europe: A comparison of ERA-interim and sounding data. J. Clim. 2018, 31, 4281–4308. [Google Scholar] [CrossRef]
  44. Shikhov, A.N.; Perminova, E.S.; Perminov, S.I. Satellite-based analysis of the spatial patterns of fire and storm-related forest disturbances in the Ural region, Russia. Nat. Hazards 2019, 97, 283–308. [Google Scholar] [CrossRef]
  45. Territorial Department of the Federal State Statistics Service for the Perm Region. Available online: https://permstat.gks.ru/folder/33429 (accessed on 7 July 2021).
  46. Bartalev, S.A.; Egorov, V.A.; Zharko, V.O.; Lupyan, E.A.; Plotnikov, D.E.; Khvostikov, S.A.; Shabanov, N.V. Satellite-Based Mapping of the Vegetation Cover of Russia; Space Research Institute of RAS: Moscow, Russia, 2016; p. 208. (In Russian) [Google Scholar]
  47. Ellison, D.; Morris, C.E.; Locatelli, B.; Sheil, D.; Cohen, J.; Murdiyarso, D.; Gutierrez, V.; Noordwijk, M.V.; Creed, I.F.; Pokorny, J.; et al. Trees, forests and water: Cool insights for a hot world. Glob. Environ. Chang. 2017, 43, 51–61. [Google Scholar] [CrossRef]
  48. Sitnov, S.A.; Mokhov, I.I. Water-Vapor Content in the Atmosphere over European Russia during the Summer 2010 Fires. Izv. Atmos. Ocean. Phys. 2013, 49, 380–394. [Google Scholar] [CrossRef]
  49. Shklyaev, V.A. Features of the distribution of convective events in the Urals. In Voprosy Prognoza Pogody, Klimata i Tsirkulyatsii Atmosfery; Perm State University: Perm, Russia, 1990; pp. 76–86. (In Russian) [Google Scholar]
  50. Gibson, H.M.; Vonder Haar, T.H. Cloud and Convection Frequencies over the Southeast United States as Related to Small-Scale Geographic Features. Mon. Weather Rev. 1990, 118, 2215–2227. [Google Scholar] [CrossRef] [Green Version]
  51. Hazardous Weather Events in the Territory of Siberia and Ural; Handbook for Specialists; Gidrometeoizdat: Leningrad, Russia, 1987; p. 200. (In Russian)
  52. Lassig, R.; Mochalov, S.A. Frequency and characteristics of severe storms in the Urals and their influence on the development, structure and management of the boreal forests. Forest Ecol. Man. 2000, 135, 179–194. [Google Scholar] [CrossRef]
  53. Rozhkow, A.A.; Kozak, B.T. Forest Sustainability; Agropromizdat: Moscow, Russia, 1989; p. 239. (In Russian) [Google Scholar]
  54. Bulygina, O.N.; Veselov, V.M.; Razuvaev, V.N.; Aleksandrova, T.M. Description of the Dataset of Observational Data on Major Meteorological Parameters from Russian Weather Stations. 2014. Available online: http://meteo.ru/data/163-basicparameters (accessed on 7 July 2021). (In Russian).
  55. List and Criteria of Hazardous Weather Phenomena. Available online: https://meteoinfo.ru/hazards-definitions (accessed on 7 July 2021). (In Russian).
  56. Acts of Inspection of the Consequences of the Hazardous Weather Events; Unpublished work; Perm Center for Hydrometeorology and Environmental Monitoring (Permskii TsGMS): Perm, Russia, 2020. (In Russian)
  57. Beaufort Wind Force Scale. Available online: https://www.weather.gov/jetstream/beaufort_max (accessed on 7 July 2021).
  58. Wind Science and Engineering Center. A Recommendation for an Enhanced Fujita Scale (EFscale). 2006. Available online: https://www.spc.noaa.gov/faq/tornado/EFScale.pdf (accessed on 6 September 2021).
  59. Shamin, S.I.; Buhonova, L.K.; Sanina, A.T. Database of Hazardous and Unfavourable Hydrometeorological Events That Did Damage to the Economy and Population of the Russian Federation. 2019. Available online: http://meteo.ru/english/climate/weather_and_hazards.php (accessed on 7 July 2021). (In Russian).
  60. Monthly Reviews of Hazardous Weather Events. Russian Meteorology and Hydrology. Available online: http://mig-journal.ru/en/archive-eng (accessed on 7 July 2021). (In Russian).
  61. European Severe Weather Database. Available online: http://www.eswd.eu (accessed on 7 July 2021).
  62. Klaes, K.D. A status update on EUMETSAT programmes and plans. Proc. SPIE Int. Soc. Optical Eng. 2017, 10402, 1040202. [Google Scholar]
  63. Kalinin, N.A.; Smirnova, A.A. Determination of liquid water content and reserve of cumulonimbus cloudiness from meteorological radar information. Russ. Meteorol. Hydrol. 2011, 36, 91–101. [Google Scholar] [CrossRef]
  64. Newark, M.J. Canadian tornadoes, 1950–1979. Atmos.-Ocean 1984, 22, 343–353. [Google Scholar] [CrossRef]
  65. Rauhala, J.; Brooks, H.E.; Schultz, D.M. Tornado climatology of Finland. Mon. Weather Rev. 2012, 140, 1446–1456. [Google Scholar] [CrossRef] [Green Version]
  66. Hersbach, H.; Bell, B.; Berrisford, P.; Hirahara, S.; Horányi, A.; Muñoz-Sabater, J.; Nicolas, J.; Peubey, C.; Radu, R.; Schepers, D.; et al. The ERA5 global reanalysis. Q. J. Royal Meteorol. Soc. 2020, 146, 1999–2049. [Google Scholar] [CrossRef]
  67. Livingston, R. The Subsynoptic Pre-Tornado Environment. Ph.D. Thesis, University of Missouri, Columbia, MO, USA, 1983; p. 250. [Google Scholar]
  68. Doswell, C.A., III; Schultz, D.M. On the use of indices and parameters in forecasting severe storms. Electron. J. Sev. Storms Meteor. 2006, 1, 1–22. [Google Scholar]
  69. Thompson, R.L.; Edwards, R.; Hart, J.A.; Elmore, K.L.; Markowski, P. Close proximity soundings within supercell environments obtained from the Rapid Update Cycle. Weather Forecast. 2003, 18, 1243–1261. [Google Scholar] [CrossRef] [Green Version]
  70. Moncrieff, M.W.; Miller, M.J. The dynamics and simulation of tropical cumulonimbus and squall lines. Q. J. Royal Meteorol. Soc. 1976, 102, 373–394. [Google Scholar] [CrossRef]
  71. Manual on Short-Range Weather Forecasting; Gidrometeoizdat: Leningrad, Russia, 1986; Volume 1. (In Russian)
  72. Stein, A.F.; Draxler, R.R.; Rolph, G.D.; Stunder, B.J.B.; Cohen, M.D.; Ngan, F. NOAA’s HYSPLIT atmospheric transport and dispersion modeling system. Bull. Amer. Meteor. Soc. 2015, 96, 2059–2077. [Google Scholar] [CrossRef]
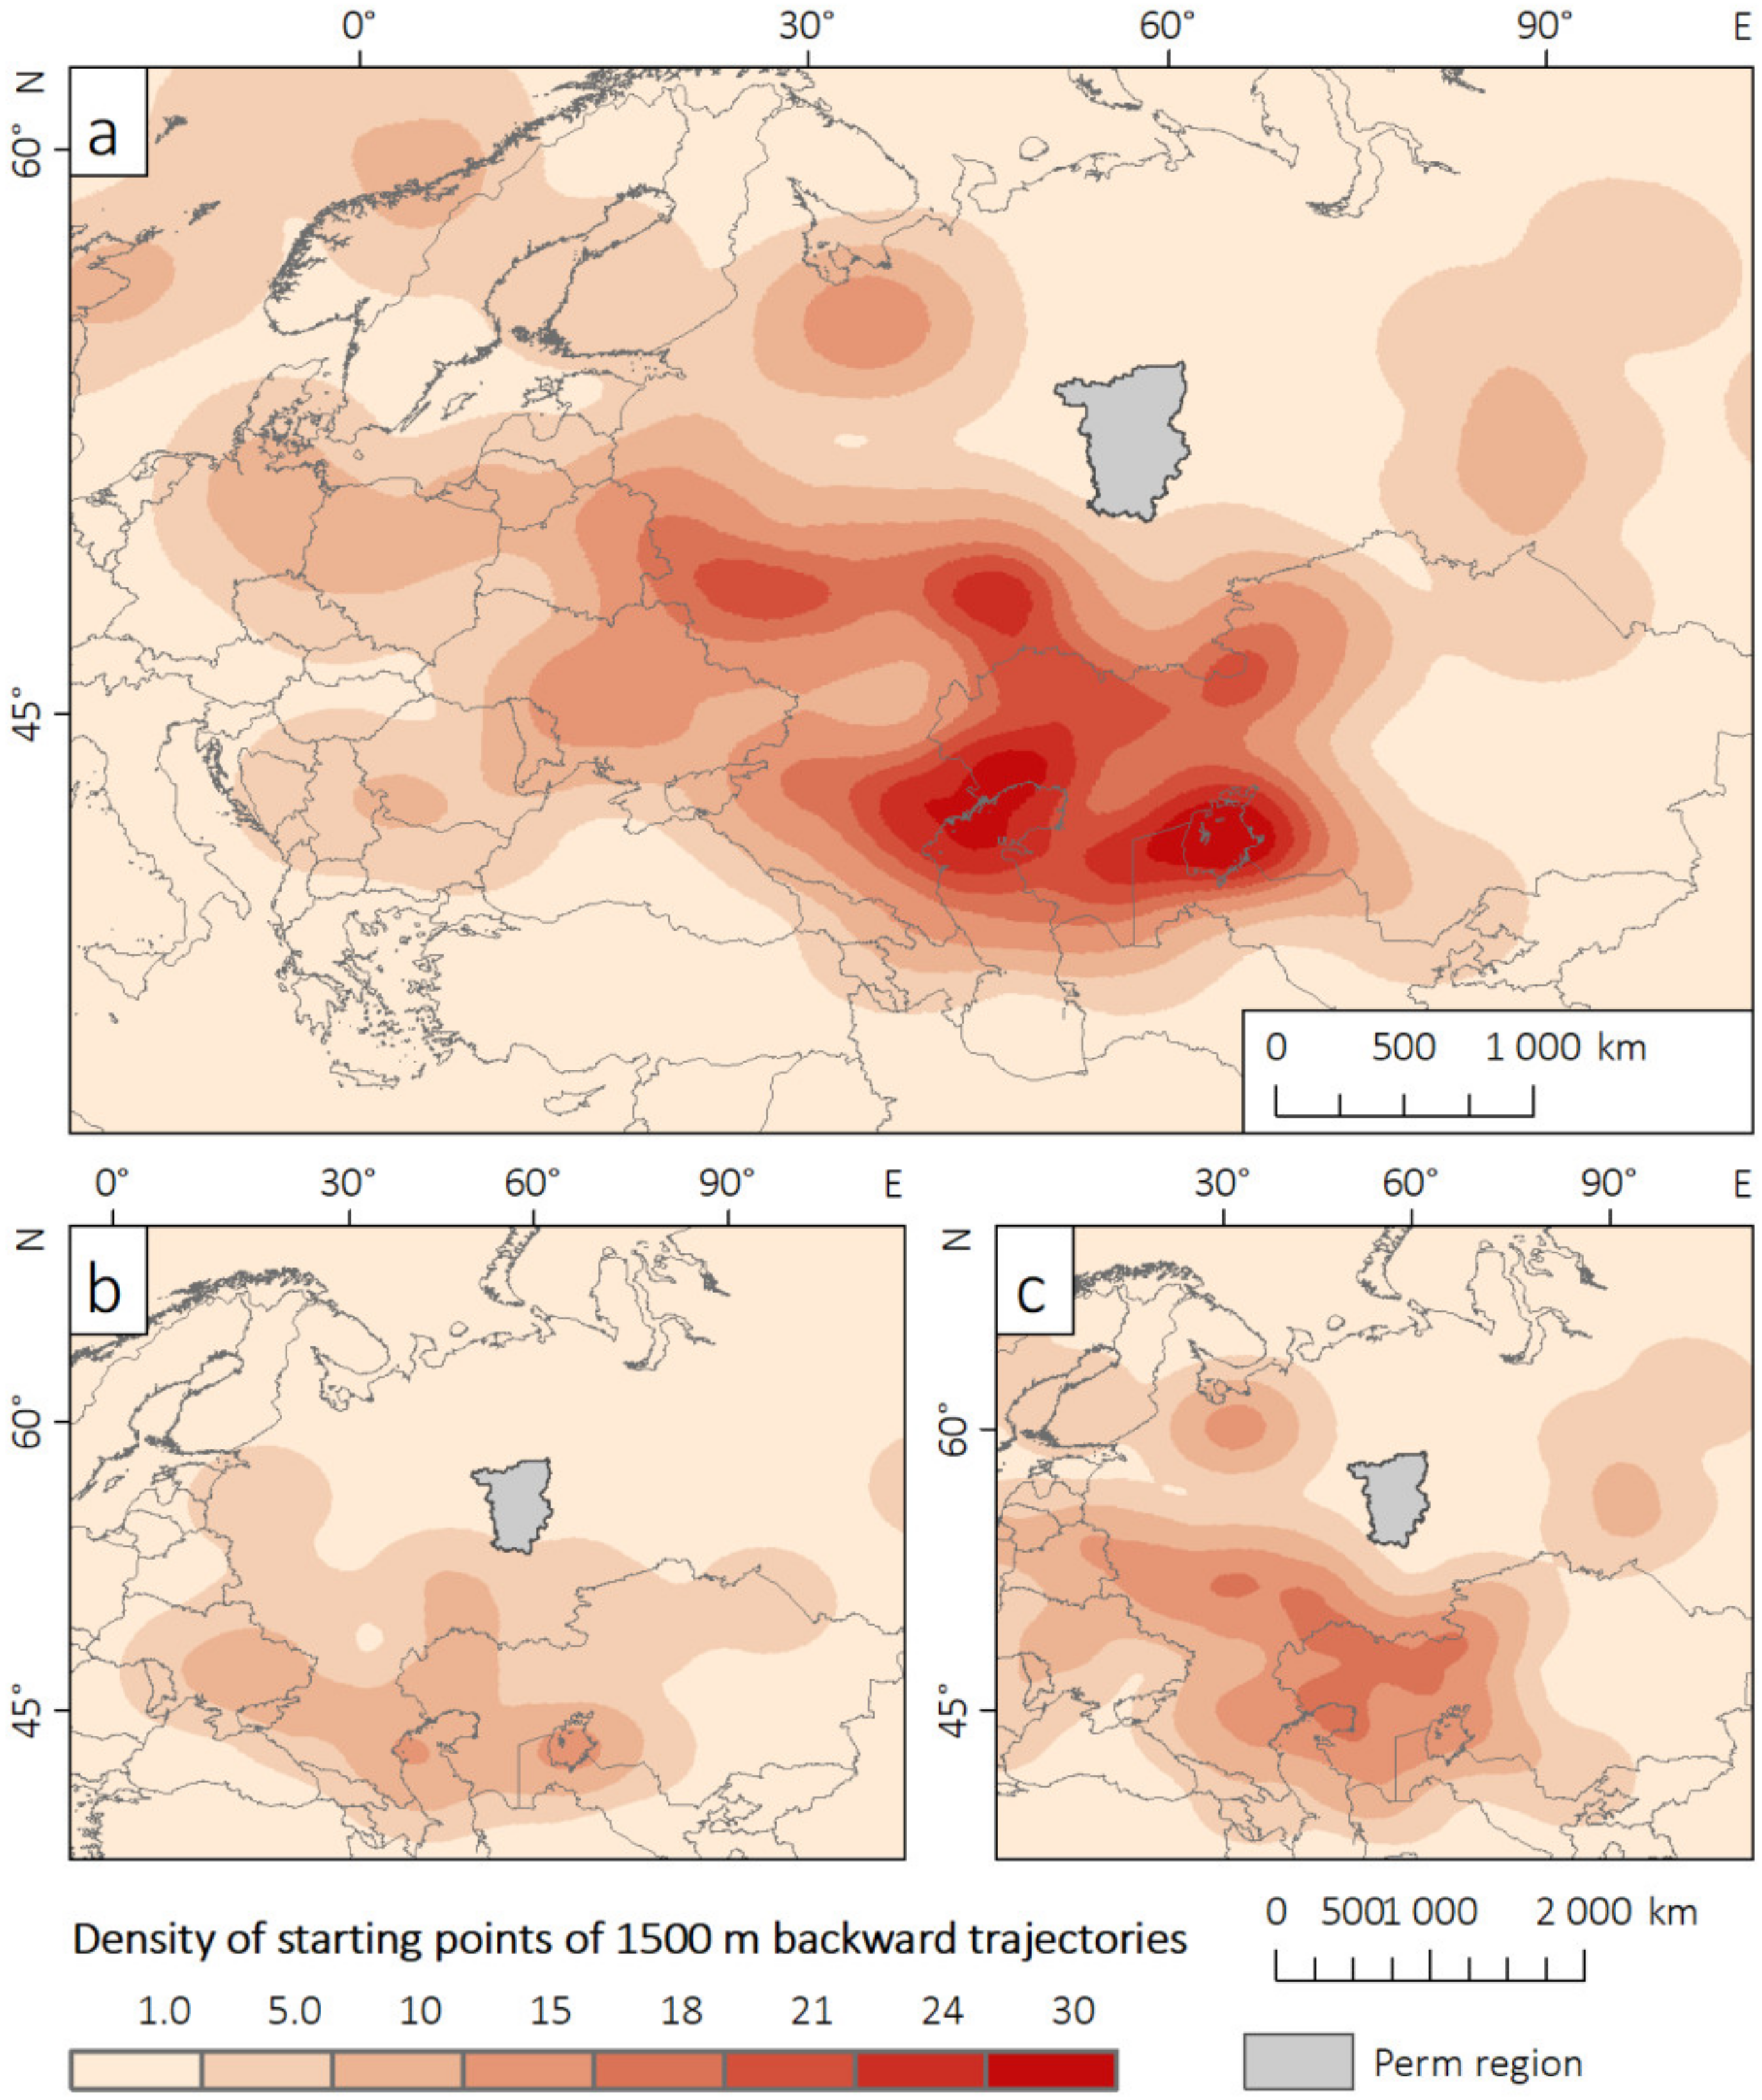
  73. Molina, M.J.; Allen, J.T. On the moisture origins of tornadic thunderstorms. J. Clim. 2019, 32, 4321–4346. [Google Scholar] [CrossRef]
  74. Finch, J.; Bikos, D. Russian tornado outbreak of 9 June 1984. Electron. J. Sev. Storms Meteorol. 2012, 7, 1–28. [Google Scholar]
  75. Silverman, B.W. Density Estimation for Statistics and Data Analysis; Chapman and Hall: New York, NY, USA, 1986; p. 22. [Google Scholar]
  76. National Severe Storms Laboratory. Thunderstorm Types. Available online: https://www.nssl.noaa.gov/education/svrwx101/thunderstorms/types/ (accessed on 7 July 2021).
  77. Virts, K.S.; Wallace, J.M.; Hutchins, M.L.; Holzworth, R.H. Highlights of a new ground-based, hourly global lightning climatology. Bull. Amer. Meteorol. Soc. 2013, 94, 1381–1391. [Google Scholar] [CrossRef] [Green Version]
  78. Brooks, H.E. On the relationship of tornado path length and width to intensity. Weather Forecast. 2004, 19, 310–319. [Google Scholar] [CrossRef] [Green Version]
  79. Fujita, T.T. Tornadoes and downbursts in the context of generalized planetary scales. J. Atmos. Sci. 1981, 38, 1511–1534. [Google Scholar] [CrossRef] [Green Version]
  80. Solari, G. Thunderstorm Downbursts and Wind Loading of Structures: Progress and Prospect. Front. Built Environ. 2020, 6, 63. [Google Scholar] [CrossRef]
  81. Snitkovskii, A. Tornadoes in the USSR. Sov. Meteorol. Gidrol. 1987, 9, 12–25. (In Russian) [Google Scholar]
  82. Sherburn, K.D.; Parker, M.D. Climatology and ingredients of significant severe convection in high-shear, low-CAPE environments. Weather Forecast. 2014, 29, 854–877. [Google Scholar] [CrossRef]
  83. Coniglio, M.C.; Brooks, H.E.; Weiss, S.J.; Corfidi, S.F. Forecasting the maintenance of quasi-linear mesoscale convective systems. Weather Forecast. 2007, 22, 556–570. [Google Scholar] [CrossRef] [Green Version]
  84. Atkins, N.T.; Wakimoto, R.M. Wet microburst activity over the southeastern United States: Implications for forecasting. Weather Forecast. 1991, 6, 470–482. [Google Scholar] [CrossRef] [Green Version]
  85. Rasmussen, E.N. Refined Supercell and Tornado Forecast Parameters. Weather Forecast. 2003, 18, 530–535. [Google Scholar] [CrossRef] [Green Version]
  86. Grieser, J.; Haines, P. Tornado Risk Climatology in Europe. Atmosphere 2020, 11, 768. [Google Scholar] [CrossRef]
  87. Anderson, C.J.; Wikle, C.K.; Zhou, Q.; Royle, J.A. Population influences on tornado reports in the United States. Weather Forecast. 2007, 22, 571–579. [Google Scholar] [CrossRef] [Green Version]
  88. Potvin, C.K.; Broyles, C.; Skinner, P.S.; Brooks, H.E.; Rasmussen, E. A Bayesian hierarchical modeling framework for correcting reporting bias in the U.S. tornado database. Weather Forecast. 2019, 34, 15–30. [Google Scholar] [CrossRef]
Figure 1. Main characteristics of the Perm region: (a) geolocation, (b) topography, and (c) population density calculated for municipal districts.
Atmosphere 12 01407 g001
Figure 2. Identification of a windthrow areas in PR induced by a squall occurred on 18 July 2012 (line 1) and a tornado occurred on 13 September 2018 (line 2), based on satellite images: (a,c) the post-event satellite images from (a) Landsat (1 July 2013) and (c) Sentinel-2 (8 June 2019); (b,d) corresponding high-resolution images for the parts of windthrow areas highlighted with the red boxes.
Atmosphere 12 01407 g002
Figure 3. Spatial distribution of the storm reports and windthrow areas in PR (1984–2020). Note, that one point may correspond to several storm events observed at a weather station.
Atmosphere 12 01407 g003
Figure 4. Number of storm events depending on the data sources: 1—damage reports only, 2—satellite images of windthrow only, 3—satellite images of windthrow and damage reports, 4—satellite images of windthrow and weather station reports, 5—weather station reports only, 6—weather station and damage reports, 7—satellite images of windthrow, weather station and damage report, 8—eyewitness reports only.
Atmosphere 12 01407 g004
Figure 5. (a) Density of squall and tornado reports (number of reports per 10,000 km2 year−1), one point may indicate several nearly located storm reports with distance <50 km, and (b) ratio of the storm-damaged forested area to the total forested area. The density was calculated using the kernel density method implemented in the ArcGIS 10 software.
Atmosphere 12 01407 g005
Figure 6. Number of (a) squall and tornado reports per year, (b) in each month of the year, and (c) in 3-h interval of a day (c).
Atmosphere 12 01407 g006aAtmosphere 12 01407 g006b
Figure 7. (a) Movement direction of squalls and tornadoes, and (b) weather events accompanied by squalls and tornadoes: no data (1); no events (2); heavy rainfall and hailstorm (3); no heavy rainfall, no data on hailstorm (4); heavy rainfall without hailstorm (5); heavy rainfall, no data on hailstorm (6); hailstorm without heavy rain (7); hailstorm, no data on rainfall (8).
Atmosphere 12 01407 g007
Figure 8. Box and whisker plots for major indicators and parameters of convective instability for SGE (red), SGEWT (orange), SGENT (yellow), SGEWD (purple), and SGEND (blue): (a) T850 gradient, (b) dewpoint, (c) 3D index, (d) SB CAPE, (e) MU CAPE, (f) SB CIN, (g) LLS, (h) MLS, (i) DLS, (j) PW, (k) 0–1 km SRH, (l) 0–3 km SRH, (m) EHI, (n) SCP, (o) WMAXSHEAR. Asterisks show statistically significant differences in the mean of the distributions (at 0.05 level) between SGEWT and SGENT, or between SGEWD and SGEND based on the K-S test.
Atmosphere 12 01407 g008
Figure 9. (a) Density of starting points of 72-h backward trajectories (at 1500 m ASL), for (a) SGE, (b) SGEWD, and (c) SGEND.
Atmosphere 12 01407 g009
Table 1. Criteria for determining the certainty degree of storm events.
The Main Data SourceStorm Event Type
SquallTornadoCombined (Squall and Tornado)
Event Certainty Degree
HighMediumHighMediumHighMedium
Weather station reportWeather station reported convective wind gust ≥25 m·s−1; damage report is also available or forest damage induced by squall is found on satellite images; and/or the report is mentioned in the databases of severe weather events in Russia, and/or the event was accompanied by heavy rainfall, hailstorm.
28 reports
Weather station =-reported convective wind gust ≥25 m·s−1; but no damage information (including forest damage)
is available, the report is not mentioned in the databases of severe weather events in Russia and not accompanied by heavy rainfall, hailstorm.
10 reports
Cases of tornado from official report of the state weather service, observed at the weather stations.
No reports
Observations of “tornado” or ‘‘land spouts’’ at the weather stations, under tornado-plausible conditions.
No reports
The same as for tornado with high certainty degree, but squall-induced damage to property and infrastructure, or windthrow associated with both squall and tornado is found.
No reports
The same as for tornado with medium certainty degree, but squall-induced damage to property and infrastructure, or windthrow associated with both squall and tornado is found.
No reports
Damage reportDamage to property and infrastructure indicates a wind gust of ≥25 m·s−1 (e.g., roofs of buildings are destroyed, power transmission towers are broken), or people died or injured. The event is confirmed by damage inspection or squall-induced forest damage is found on satellite images, or nearest weather station reported wind gust ≥ 20 m·s−1
31 reports
Damage to property and infrastructure indicates a wind gust of ≥25 m·s−1, but no damage inspection is carried out, or detailed damage description is not available, forest damage is not found on satellite images, nearest weather station does not report the event
15 reports
Tornado caused damage to property and infrastructure, confirmed by the official report of the state weather service, scientific literature or existing climatology. In addition, news with detailed information on tornado-related impact accompanied with witness reports are available or tornado-induced forest damage is found on satellite images
3 reports
Tornado caused damage to property and infrastructure, confirmed by the official report of the state weather service, scientific literature or existing climatology, tornado-related impact was reported, but witness report is not available; tornado- induced forest damage is not found on satellite images
3 reports
The same as for tornado with high certainty degree, but squall-induced damage to property and infrastructure, or windthrow associated with both squall and tornado is found.
2 reports
The same as for tornado with medium certainty degree, but squall-induced damage to property and infra-structure or windthrow associated with both squall and tornado is found.
No reports
Forest damage (area ≥5 ha for tornado, ≥25 ha for squall)Squall-induced windthrow is found on satellite images; storm event is also confirmed by weather station, damage or eye-witness report, or windthrow is verified with HRIs
14 reports
Squall-induced windthrow is found on satellite images; other data sources are not available, and HRIs are also unavailable
2 reports
Tornado-induced windthrow is found on satellite images and verified with HRIs
24 reports
Tornado-induced windthrow is found on satellite images, but not verified with HRIs
25 reports
Forest damage induced by both squall and tornado, verified with HRIs
3 reports
Forest damage induced by both squall and tornado, not verified with HRIs
1 report
Eye-witness reportEyewitness reports, photos and videos of squall events are used only as additional data sources, and not as the main sources. Eyewitness reports, photos and videos of squall events are used only as additional data sources, and not as the main sources.The presence of photos/videos of a vortex itself; photos/videos of tornado-related impact accompanied with witness detailed verbal reports, or the report is confirmed by the existing climatology
1 report
Verbal reports by witnesses without impact description and photo/video evidences; photo/video materials for tornado-related impact without witness reports, or the report is confirmed by the existing climatology
3 reports
The same as for tornado with high certainty degree, but squall-induced damage to property and infrastructure, or windthrow associated with both squall and tornado is found.
No reports
The same as for tornado with medium certainty degree, but squall-induced damage to property and infra-structure or windthrow associated with both squall and tornado is found.
No reports
Table 2. Attribute table of the GIS layer of storm reports.
Field NameField AliasDescription
IDStorm event IDStorm event ID
Main_SrcMain data sourceMain data source on storm event (weather station report, damage report, satellite data on windthrow or several sources)
Add_SrcAdditional data sourceAdditional data sources on storm event)
CertaintyEvent certainty degreeEvent certainty degree (high or medium)
WMOIDWMOIDWMO ID of the nearest weather station
WS_distDistance to weather stationDistance to the nearest weather station (km)
Event_typeStorm event typeStorm event type (squall, tornado, or both of them)
DateStorm event dateStorm event date
Date_rangeRange of datesRange of dates (for events with unknown date)
YearYearThe year of the event
MonthMonthThe month of the event
TimeTimeTime of event (UTC)
Time_accTime precisionprecision of time determination
DirectionDirectionMovement direction (by direction segments)
Intensity1Measured wind speedMeasured intensity (only for events reported at weather stations), m·s−1
Intensity2Estimated intensityEstimated intensity according to damage survey data (m·s−1), or the F-scale intensity for tornadoes
WeatherAccompanied weather eventsAccompanied weather events such as thunderstorms, heavy rainfall (≥15 mm), hailstorms, according to weather stations or eyewitness observations
DamageDamage descriptionDescription of related damage (except windthrow), according to damage survey, media reports or eye-witness data
InjuredInjuredNumber of injured peoples
DeadDeadNumber of dead peoples
Storm_typeStorm typeStorm type (mesoscale convective complex, QLCS, supercell or low-organised storm)
Storm_SrcSource for storm typeData source for storm type determination
WindthrowID of windthrowID of windthrow related to the storm event.
Start_latWindthrow start (lat)Latitude of the windthrow start point
Start_longWindthrow start (long)Longitude of the windthrow start point
End_latWindthrow end (lat)Latitude of the windthrow end point
End_longWindthrow end (long)Longitude of the windthrow end point
LengthWindthrow lengthLength of the windthrow (km)
Max_widthWindthrow max widthMaximum width of the windthrow, including gaps (m)
Area_fullWindthrow areaTotal area of the windthrow (km2)
Area_PermWindthrow area (Perm)Area of the windthrow within PR only (km2)
Table 3. List of most severe squall and tornado events (including outbreaks) in Perm region during 1984-2020.
Date and Time (UTC)Number of Squall and Tornado Events and Their IntensityDamage ReportsInjured and DeadWindthrow Area, km2 (in Perm Region Only)
25 August 1984
(09.00–15.00)
Three tornadoes, two of them significant (≥F2), path length up to 54 km; squall 27 m·s−1 (weather station 28016)No damage reportsNo data11.92
31 May 1988
(12.00)
Squall 33 m·s−1
(weather station 28321)
Roofs of 140 houses were destroyed in Okhansk townNo data0.52
18 June 1990
(15.00)
Squall 30 m·s−1
(weather station 28313); damage survey reported wind speed up to 32 m·s−1
Many buildings were damaged in two municipalities, power supply was interruptedNo data24.04
4 July 1992
(12.00–15.00)
Squall 28 m·s−1
(weather station 23909)
No damage reports0/010.14
29 June 1993
(18.00–21.00)
Three tornadoes, two of them significant (≥F2); damage survey reported wind speed up to 33 m·s−1Roofs of 70 houses were destroyed, agricultural machines were damaged4/04.61
30 June 1993
(15.00)
Squall 24 m·s−1 (weather station 23913)No damage reports0/022.58
22 May 2001
(10.00–13.00)
Squall 27–31 m·s−1 (weather stations 28216, 28313, 28222, 28226, 28228)Power and water supply was disrupted; the roofs of many buildings were damaged, the damage in the city of Perm was estimated as ≈
2 M.
14/20
7 June 2009
(09.30–13.00)
Fourteen tornadoes, six of them significant (≥F2), squalls up to 25 m·s−1Roofs of 61 houses in three settlements were damaged by tornadoes2/019.40
18 July 2012
(08.00–14.00)
Squalls affected most of PR (observed wind gust up to 28 m·s−1); three tornadoes (F1 intensity) were reportedHundreds of houses were heavily damaged; power and water supply of 200 k people was disrupted11/1196.76
17 August 2014
(12.00–14.00)
Squall (estimated wind speed 28 m·s−1)80 houses and 10 social facilities were heavily damaged; 4 reinforced concrete power transmission towers were broken0/17.97
13 September 2018
(13.00–15.00)
Seven tornadoes, including one significant tornado (≥F2); squalls also were observed14 buildings were damaged in Krasnovishersk town0/02.55
Table 4. Synoptic-scale peculiarities of storm events formation (for SGEWT/SGENT).
Synoptic-Scale Situation/Frontal SystemsRapidly Moving Cold FrontWaving Quasi-Stationary or Slowly Moving FrontSecondary Cold FrontOcclusion PointWarm SectorFlanc of High-Pressure System
Number of cases13/434/266/55/30/50/4
Origin of low-pressure systemWesternSouthwesternSouthernNorth-westernLocally formedNo low-pressure system
Number of cases13/143/117/230/145/190/5
Development stage of low-pressure systemWaveDeepenedMaximum developmentDissipatedNo low-pressure system
Number of cases3/811/4619/308/110/5
Publisher’s Note: MDPI stays neutral with regard to jurisdictional claims in published maps and institutional affiliations.

