Article

Spatial and Temporal Distributions of Air Pollutants in Nanchang, Southeast China during 2017–2020

1
School of Water Resources and Environmental Engineering, East China University of Technology, Nanchang 330013, China
2
Jiangxi Provincial Eco-Environment Monitoring Center, Nanchang 330039, China
3
State Key Laboratory of Marine Resource Utilization in South China Sea, Hainan University, Haikou 570228, China
4
Key Laboratory of Watershed Geographic Sciences, Nanjing Institute of Geography and Limnology, Chinese Academy Sciences, Nanjing 210008, China
5
School of Geographical Sciences, Changchun Normal University, Changchun 130032, China
6
School of Atmospheric Sciences, Sun Yat-sen University, Zhuhai 519082, China
*
Author to whom correspondence should be addressed.
Atmosphere 2021, 12(10), 1298; https://doi.org/10.3390/atmos12101298
Submission received: 14 September 2021 / Accepted: 30 September 2021 / Published: 5 October 2021
(This article belongs to the Section Air Quality)

Abstract

:
In response to COVID-19 in December 2019, China imposed a strict lockdown for the following two months, which led to an unprecedented reduction in industrial activities and transportation. However, haze pollution was still recorded in many Chinese cities during the lockdown period. To explore temporal and spatial variations in urban haze pollution, concentrations of air pollutants (PM2.5, PM10, SO2, CO, NO, NO2, and O3) from April 2017 to March 2020 were observed at 23 monitoring stations throughout Nanchang City (including one industrial site, sixteen urban central sites, two mountain sites, and four suburban sites). Overall, the highest concentrations of PM2.5, PM10, and SO2 were observed at industrial sites and the highest CO and NOx (NO and NO2) concentrations were recorded at urban sites. The air pollutants at mountain sites all showed the lowest concentrations, which indicated that anthropogenic activities are largely responsible for air pollutants. Concentrations of PM2.5, PM10, CO, NO, and NO2 showed similar season trends, that is, the highest levels in winter and lowest concentrations in summer, but an opposite season pattern for O3. Except for a sharply dropping pattern from January to May 2018, there were no seasonal patterns for SO2 concentration in all the observed sites. Daily PM2.5, PM10, CO, NOx, and SO2 concentrations showed a peak during the morning commute, which indicated the influences of anthropogenic activities on PM2.5, PM10, CO, NOx, and SO2. PM2.5, PM10, NOx, and CO concentrations at industrial, urban, and suburban sites were higher during nighttime than during daytime, but they showed the opposite pattern at mountain sites. In addition, PM2.5, PM10, CO, and NOx concentrations were lower during the lockdown period (D2) than those before the lockdown (B1). After the lockdown was lifted (A3), PM2.5, PM10, CO, and NOx concentrations showed a slowly increasing trend. However, O3 concentrations continuously increased from B1 to A3.

1. Introduction

Atmospheric pollutants, including particulate matter (PM) and gaseous pollutants (such as NOx and O3), can have adverse effects on human health. Even short-term exposure to high concentrations of PM2.5, PM10, SO2, NO2, CO, and O3 can increase the risk of myocardial infarction [1]. Severe air pollution poses serious threats to human health as it can lead to various health issues, such as respiratory diseases, cardiovascular diseases, mental health problems, lung cancer, and even premature death [2]. Statistical datasets have revealed that 12% of global deaths in 2019 were related to air pollution, making air pollution a major risk factor for human deaths worldwide [3].
In December 2019, with the Chinese New Year approaching, a cluster of pneumonia cases caused by an unknown pathogen broke out in Wuhan, China [4,5]. This novel coronavirus was identified as a pathogen and a human-to-human transmitted virus (SARS-CoV-2) [6,7,8]. To control the rapid spread of COVID-19, the Chinese government implemented a regional lockdown to reduce human activities and shut down non-essential factories. The lockdown provided an opportunity to study the influences of human activities on air pollution. Previous studies have shown that COVID-19 related lockdowns in China and other countries facilitated improvements in air quality. For example, reanalysis concentrations of PM2.5, PM10, SO2, NO2, and CO over 366 cities in China showed that the levels of these air pollutants decreased by 14%, 15%, 12%, 16%, and 12%, respectively, in 2020, from their levels during January–April 2019 [9]. In São Paulo state, the concentrations of NO, NO2, and CO in urban areas were significantly reduced by 77.3%, 54.3%, and 64.8%, respectively, during the partial lockdown in 2020, as compared with their levels during January–April from 2015 to 2019 [10]. In Barcelona, Spain, NO2 concentration decreased by approximately 51% during the lockdown period (14–30 March 2020) with references to the pre-lockdown period (16 February to 13 March 2020) [11]. Similar observations of atmospheric pollutants have also been reported in London [12], in Rio de Janeiro [13], and India [14].
With the rapid growth of the economy and population, accompanied by an increase in the emission of air pollutants, China has experienced severe air pollution in the past decades, and thus air pollution has become a serious environmental problem [15]. In an effort to mitigate air pollution, the Clean Air Action was implemented, which facilitated a significant improvement in air quality. In particular, the efforts of Jiangxi Province considerably contributed to the national target of air pollutant reduction. For example, the total emissions of SO2 and NOx in Jiangxi Province were decreased by 10.47% and 15.38%, respectively, exceeding the scheduled targets and tasks of energy saving and emission reduction [16]. In 2017, the Jiangxi Provincial Government issued the “Comprehensive Work Plan for Energy Conservation and Emission Reduction in Jiangxi Province during the 13th Five-Year Plan”, aiming to upgrade traditional industries and optimize the energy structure through transformation, such as promoting coal to gas and coal to electricity, encouraging the use of renewable energy and high-quality energy such as natural gas and electricity to replace coal, and promoting the substitution of natural gas and electricity in industrial and agricultural production areas and ports to reduce the consumption of loose coal and fuel oil; the overall goal was to reduce the proportion of coal in total energy consumption to less than 65% by 2020 [16]. As the capital of Jiangxi Province, Nanchang City has a large population and is undergoing rapid economic and industrial development. Therefore, the assessment and research of air quality in Nanchang will guide Jiangxi Province to a certain extent.
In this study, the spatial and temporal distributions of air pollutants in a typical developing Chinese city were investigated. To this end, concentrations of air pollutants (PM2.5, PM10, SO2, CO, NO, NO2, and O3) were monitored at 23 sites covering Nanchang City (including urban, industrial, county, and mountainous sites) over three consecutive years (2017–2020). We analyzed the seasonal and diurnal variations in the concentration of each air pollutant, and also compared differences in air pollutants before, during, and after the COVID-19 lockdown.

2. Materials and Methods
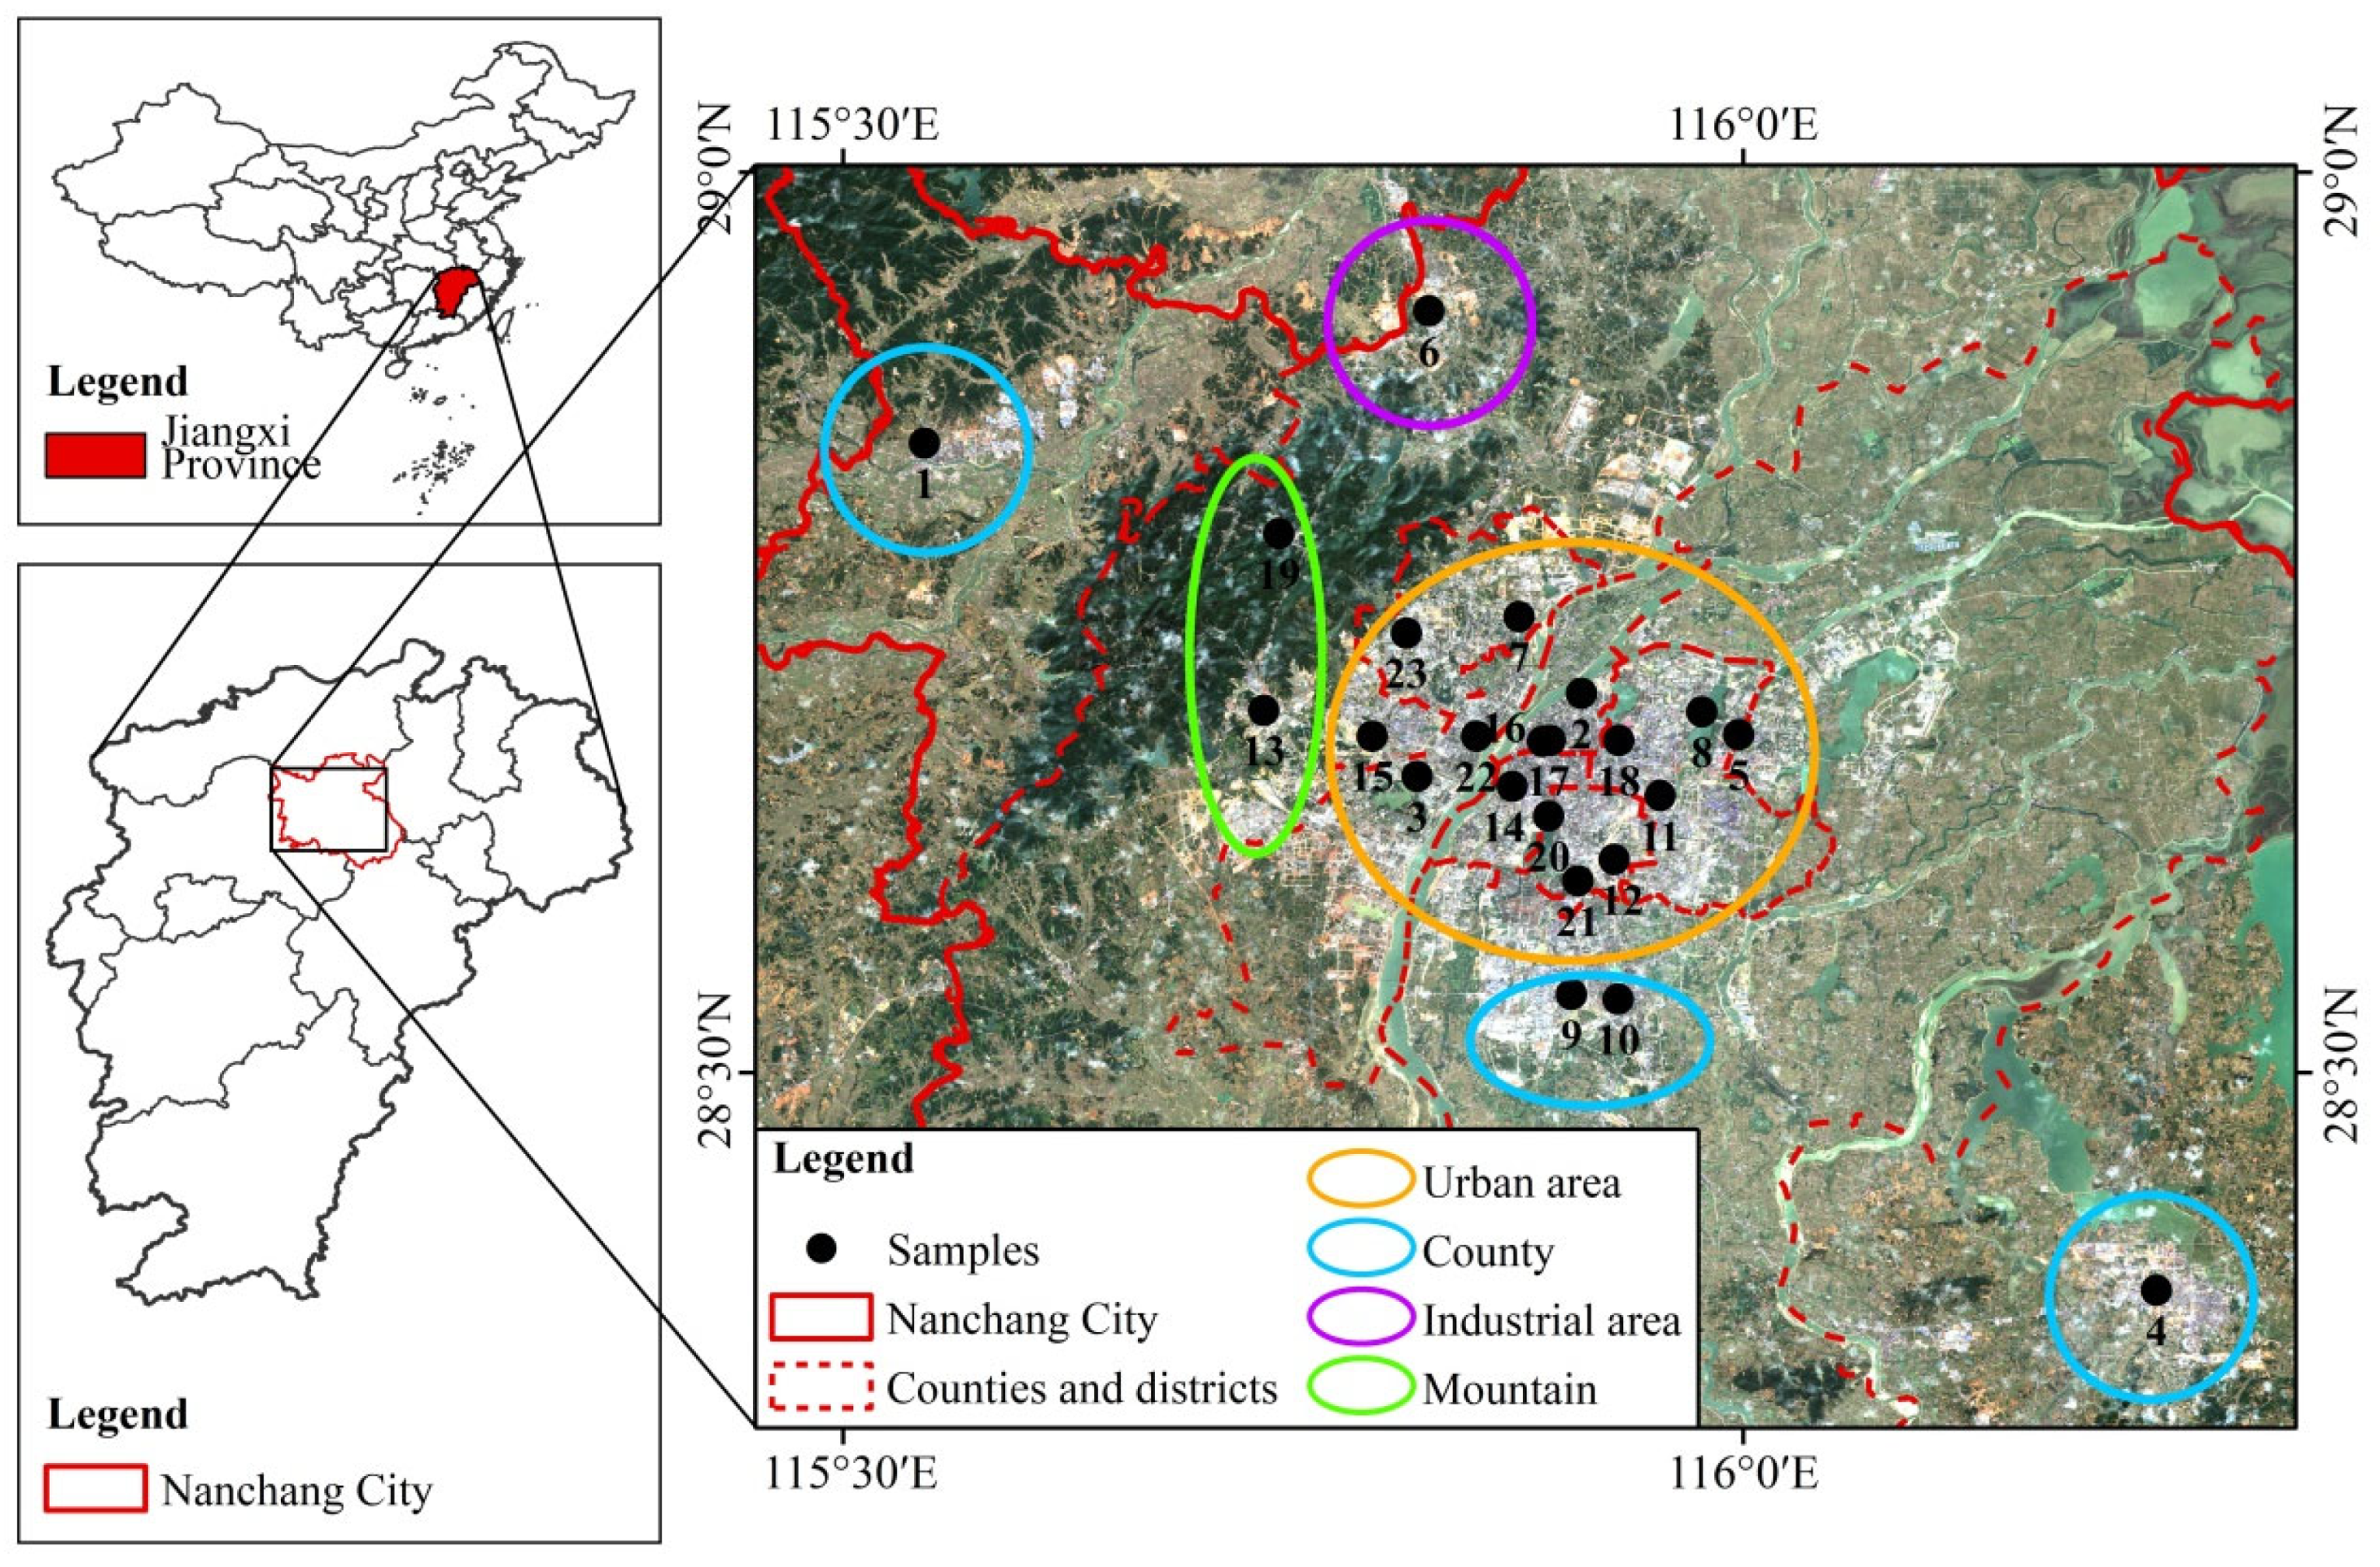
2.1. Sampling Site

Nanchang (115°27′–116°11′ E, 28°09′–29°11′ N) is located in the southeast of China, north of central Jiangxi Province (Figure 1). It lies in a subtropical monsoon climate zone with short springs and autumns but long winters and summers. Rainfall mainly occurs in spring and summer; northerly winds prevail in winter, and southerly winds prevail in summer. The monthly meteorological parameters including rainfall, wind speed, temperature, and relative humidity (RH) are shown in Figure 2. From 2017 to 2020, RH varied from 55% to 90%, with relative low values in winter and high values in summer. The average annual populations of Nanchang in 2017, 2018, and 2019 were 5,277,300, 5,282,700, and 5,339,400, respectively. The consumption of coal (including raw coal, washed coal, coke, and other washed coal) and oil (including gasoline, kerosene, diesel, and fuel oil) for energy production in 2017, 2018, and 2019 were 6751.593 and 47.399 kt, 7014.955 and 40 kt, and 6917.662 and 35.967 kt, respectively [17,18,19]. The number of vehicles in Nanchang were 965,591, 1,071,207, and 1,171,029 in 2017, 2018, and 2019, respectively.

2.2. Dataset

Datasets of PM2.5, PM10, SO2, CO, O3, NO, and NO2 were obtained from 23 atmospheric monitoring stations covering various administrative districts and counties in Nanchang from April 2017 to March 2020. According to the geographical location, administrative division, and concentrations of air pollutants, we divided the 23 monitoring stations into 4 types: urban (16 sites, yellow circle in Figure 1), industrial (1 site, purple circle in Figure 1), county (4 sites, sky blue circle in Figure 1) and mountainous sites (2 sites, green circle in Figure 1).
To better understand the spatial and temporal distributions of air pollutants and to explore the influences of anthropogenic activities on the levels of air pollutants, we divided the observation period into two parts: (1) April 2017 to December 2019, representing the general trends of the spatial and temporal variations of air pollutants and (2) January 2020 to March 2020, representing variations before (B1 period,1 January–23 January 2020), during (D2 period, 24 January–9 February 2020), and after (A3 period, 10 February–12 March 2020) the COVID-19 lockdown. Meteorological data covering the analysis period were obtained from http://www.weatherandclimate.cn/ (accessed on 10 March 2021). Spatial difference maps of pollutants during the COVID-19 lockdown were obtained through kriging interpolation with a spatial resolution of 500 m.

3. Results and Discussions

3.1. Spatial Differences of Air Pollutants

As shown in Figure 3 and Figure 4, the highest concentrations of PM2.5 and PM10 were recorded at industrial sites and the lowest levels were recorded at mountainous sites, which indicated high pollution of particulate matter at industrial sites. A previous five-year study in São Paulo state, Brazil, also found that PM10 concentrations were higher in industrial areas than in urban areas [10]. SO2 concentrations showed a clear gradient at four different observed regions (Figure 3c), suggesting that industrial manufacturing processes are an important source of atmospheric SO2 in Nanchang. In addition, SO2 concentrations rapidly decreased from 27.04 μg/m3 in December 2017 to 19.17 μg/m3 in February 2018, and the same pattern was observed for all air pollutants (Figure 3). This phenomenon can be attributed to the culmination of ten air pollution prevention and control measures during the winter of 2017–2018. NOx (NO + NO2) concentrations were higher at urban sites than at counties, industrial, and mountainous sites (Figure 3d–f), suggesting that vehicle exhaust is the dominant source of NOx. A large number of studies have also reported that vehicle exhaust is an important source of urban NOx [20,21,22,23]. CO concentrations were higher at urban and industrial sites than at county and mountainous sites (Figure 3g,h), which may be related to the residential population and traffic emissions [23]. No apparent regional patterns were observed for O3 concentrations at all sites (Figure 3h). Unlike primary gas-phase air pollutants, O3 is produced by photochemical reactions, which are mainly affected by sunlight intensity and ratios of VOCs to NOx [24]. The wide differences in primary air pollutants at different regional sites in Nanchang indicated that, on the one hand, our zoning is reasonable, and on the other hand, measures for reducing air pollution should be specified according to districts.

3.2. Seasonal Variations of Air Pollutants

Overall, all the air pollutants showed distinct seasonal patterns (Figure 4). From April 2017 to December 2019, PM2.5, PM10, CO, and NOx exhibited the lowest and highest concentrations in summer (June, July, and August) and winter (December, January, and February), respectively, at urban, industrial, county, and mountainous sites. The seasonal variations of PM2.5, PM10, CO, and NOx concentrations were mainly affected by the atmospheric boundary layer height, meteorological parameters, and emission intensity. Studies in Shanghai [25], Beijing [26], and the north China Plain [27] have found that high levels of fine particulate matter were always accompanied by low atmospheric boundary layer height and wind speed. With the lowest atmospheric boundary layer height and wind speed (Figure 2b), the winter season promotes the accumulation of PM2.5 and PM10 in Nanchang, leading to their highest levels. In addition, precipitation is significantly higher in summer than in winter (Figure 2a); the abundant rainfall during summer can remove more particulate matter as compared with that in winter [28,29]. Regarding CO and NOx, in addition to the influences of atmospheric boundary layer height and meteorological parameters, emission intensity also needs to be considered because heating requirements are higher in winter, which implies higher CO and NOx emissions [28,30]. No consistent seasonal pattern was observed for SO2 (Figure 4c) at urban, industrial, county, and mountainous sites, which may be attributable to the significant reduction of emissions in Nanchang during the 12th and 13th Five-Year Plans, which deserve further exploration. In contrast to PM2.5, PM10, CO, NOx, and SO2, O3 exhibited the lowest concentrations in winter at all observation sites. Specifically, the highest O3 concentrations at industrial and mountain sites were recorded in spring, those at urban sites were recorded in summer and autumn, and those at county sites were recorded in autumn (Figure 4h). The lowest O3 concentration in winter can be largely attributed to the weak surface solar irradiation in winter. High O3 concentrations were observed in spring, summer, and autumn, alternately, at different observation sites, which may be explained by the different ratios of VOCs to NOx at various sites because O3 is a result of photochemical reactions of VOCs and NOx [31,32].

3.3. Daily Variations of Air Pollutants

Figure 5 shows daytime and nighttime variations of the average concentrations of PM2.5, PM10, CO, SO2, O3, and NOx at urban, industrial, county, and mountainous sites. PM2.5 and PM10 exhibited bimodal distributions at all observation sites. Individually, peaks were observed at 10:00 and 23:00–0:00 at urban, industrial, and county sites, but double peaks were observed at 12:00 and 21:00 at mountainous sites. For the urban, industrial, and county sites, the peaks in the morning may be related to the morning peak activity, the lowest peaks in the afternoon (around 16:00) may be related to the higher solar radiation, and the high values in the evening are attributable to the accumulation of pollutants during the day [33]. In addition, at urban, industrial, and county sites, nighttime PM2.5 and PM10 concentrations were higher than daytime concentrations, but the opposite trend was observed at mountainous sites (Figure 5a,b). The differences in daytime and nighttime PM2.5 and PM10 concentrations are consistent with the findings of Rimetz-Planchon et al. [34], who reported that sites adjacent to industries exhibited higher PM2.5 and PM10 concentrations at night, whereas sites away from industries have higher PM10 levels during the daytime. Moreover, a positive relationship was found between PM10 and PM2.5 (Pearson’s r2 = 0.96), which was consistent with previous observations at other urban/transportation sites [34,35,36].
The SO2 concentrations gradually increased from 06:00 and reached a peak at 10:00, after which they continuously decreased until midnight (Figure 5c). A similar daily pattern of SO2 was also observed in Wuhan City, China [37]. The peak concentrations of CO in urban and industrial regions were observed at 08:00 (Figure 5d). Previous studies in Chinese cities, such as Fuzhou, Hangzhou, and Tianjin, have also found peak CO concentrations in the morning [38,39,40]. Similarly, NO, NO2, and NOx concentrations also showed peaks at 08:00 at urban and industrial sites (Figure 5e–g). The simultaneous patterns of CO and NOx at 08:00 at urban and industrial sites indicated that vehicle exhaust during the morning rush hour is responsible for their peak concentrations [33]. At county and mountainous sites, the peak concentrations of CO appeared at 09:00 (Figure 5d), and there were no uniform trends between CO and NOx, indicating that the sources of CO and NOx are different at county and mountainous sites. The lowest concentration of CO appeared at 15:00–17:00 at all observation sites (Figure 5d). Previous observations in Wuhan City [37] and Fuzhou City [38] have also reported the lowest CO in the afternoon. This phenomenon can be explained by the enhancement of atmospheric turbulences by high temperature, which further increases vertical mixing intensity at the atmospheric boundary layer; moreover, the photochemical reaction of HO radicals can oxidize CO into CO2 [33,39]. During 0:00–05:00, CO concentration remained at the midstream level with little variation at all sites. This is mainly due to the lower height of the atmospheric mixing layer at night as compared with the daytime, which hinders atmospheric dispersion [40].
The NOx concentrations exhibited a bimodal distribution. Peaks appeared at 08:00 and 0:00–02:00, and the valley appeared at 14:00 at almost all sites (Figure 5e–g). The O3 concentrations had a unimodal pattern, with a peak at 14:00 (Figure 5h). The opposite patterns between NOx and O3 may be related to chemical reactions between O3 and NOx. Previous studies have reported that the daily variations of O3 can be divided into four phases: accumulation phase (0:00–06:00), inhibition phase (06:00–08:00), photochemical production phase (08:00–15:00), and depletion phase (15:00–00:00) [41]. A similar trend of O3 over Beijing was reported by Lei et al. [42]. As shown in Figure 5, the O3 concentration remains at a low level from 0:00 to 6:00, when the trends of NO and NO2 concentrations are also relatively flat; between 06:00 and 08:00, NO and NO2 concentrations increase rapidly (mainly NO at this time) with the onset of the morning traffic peak, but the photochemical reaction is less intense because of the weak solar radiation. This stage is mainly the process of NO consuming O3 to generate NO2, and the concentration of NO2 continues to decrease. From 08:00 to 15:00, with the gradual increase of solar radiation, NO2 starts to decompose to generate O3, rapidly increasing the O3 concentration, which reaches the daily maximum at 15:00. This corresponds to the photochemical generation stage of O3. Finally, between 15:00 and 0:00, under the combined effects of turbulence near the ground, weakening of solar radiation, and evening peak of traffic, the diffusion and consumption rate of O3 increases, resulting in a continuous decrease in O3 concentration. The O3 concentrations were lower in urban areas and higher in county sites, which is similar to the studies on the spatial distribution of O3 in Beijing [43], Shanghai [44], and Guiyang [45]. This is mainly because urban and industrial areas have higher NO concentrations due to motor vehicle emissions and other factors, and higher NO concentrations not only hinder the generation of O3, but also consume the O3 that has been generated [46].
Overall, the morning peaks of PM2.5, PM10, NO, and NO2 are mainly caused by the increase in human activity, which leads to an increase in emissions and a decrease in boundary layer height [33]. The lower afternoon concentrations are attributable to the enhanced solar radiation causing the mixed layer to rise, resulting in strong diffusion of pollutants [47]. Other peaks of NO, NO2, NOx, PM2.5, and PM10 concentrations were observed at night (Figure 5), which could be explained by the accumulation of anthropogenic emissions generated by the lower boundary layer height and weaker convective diffusion [48].

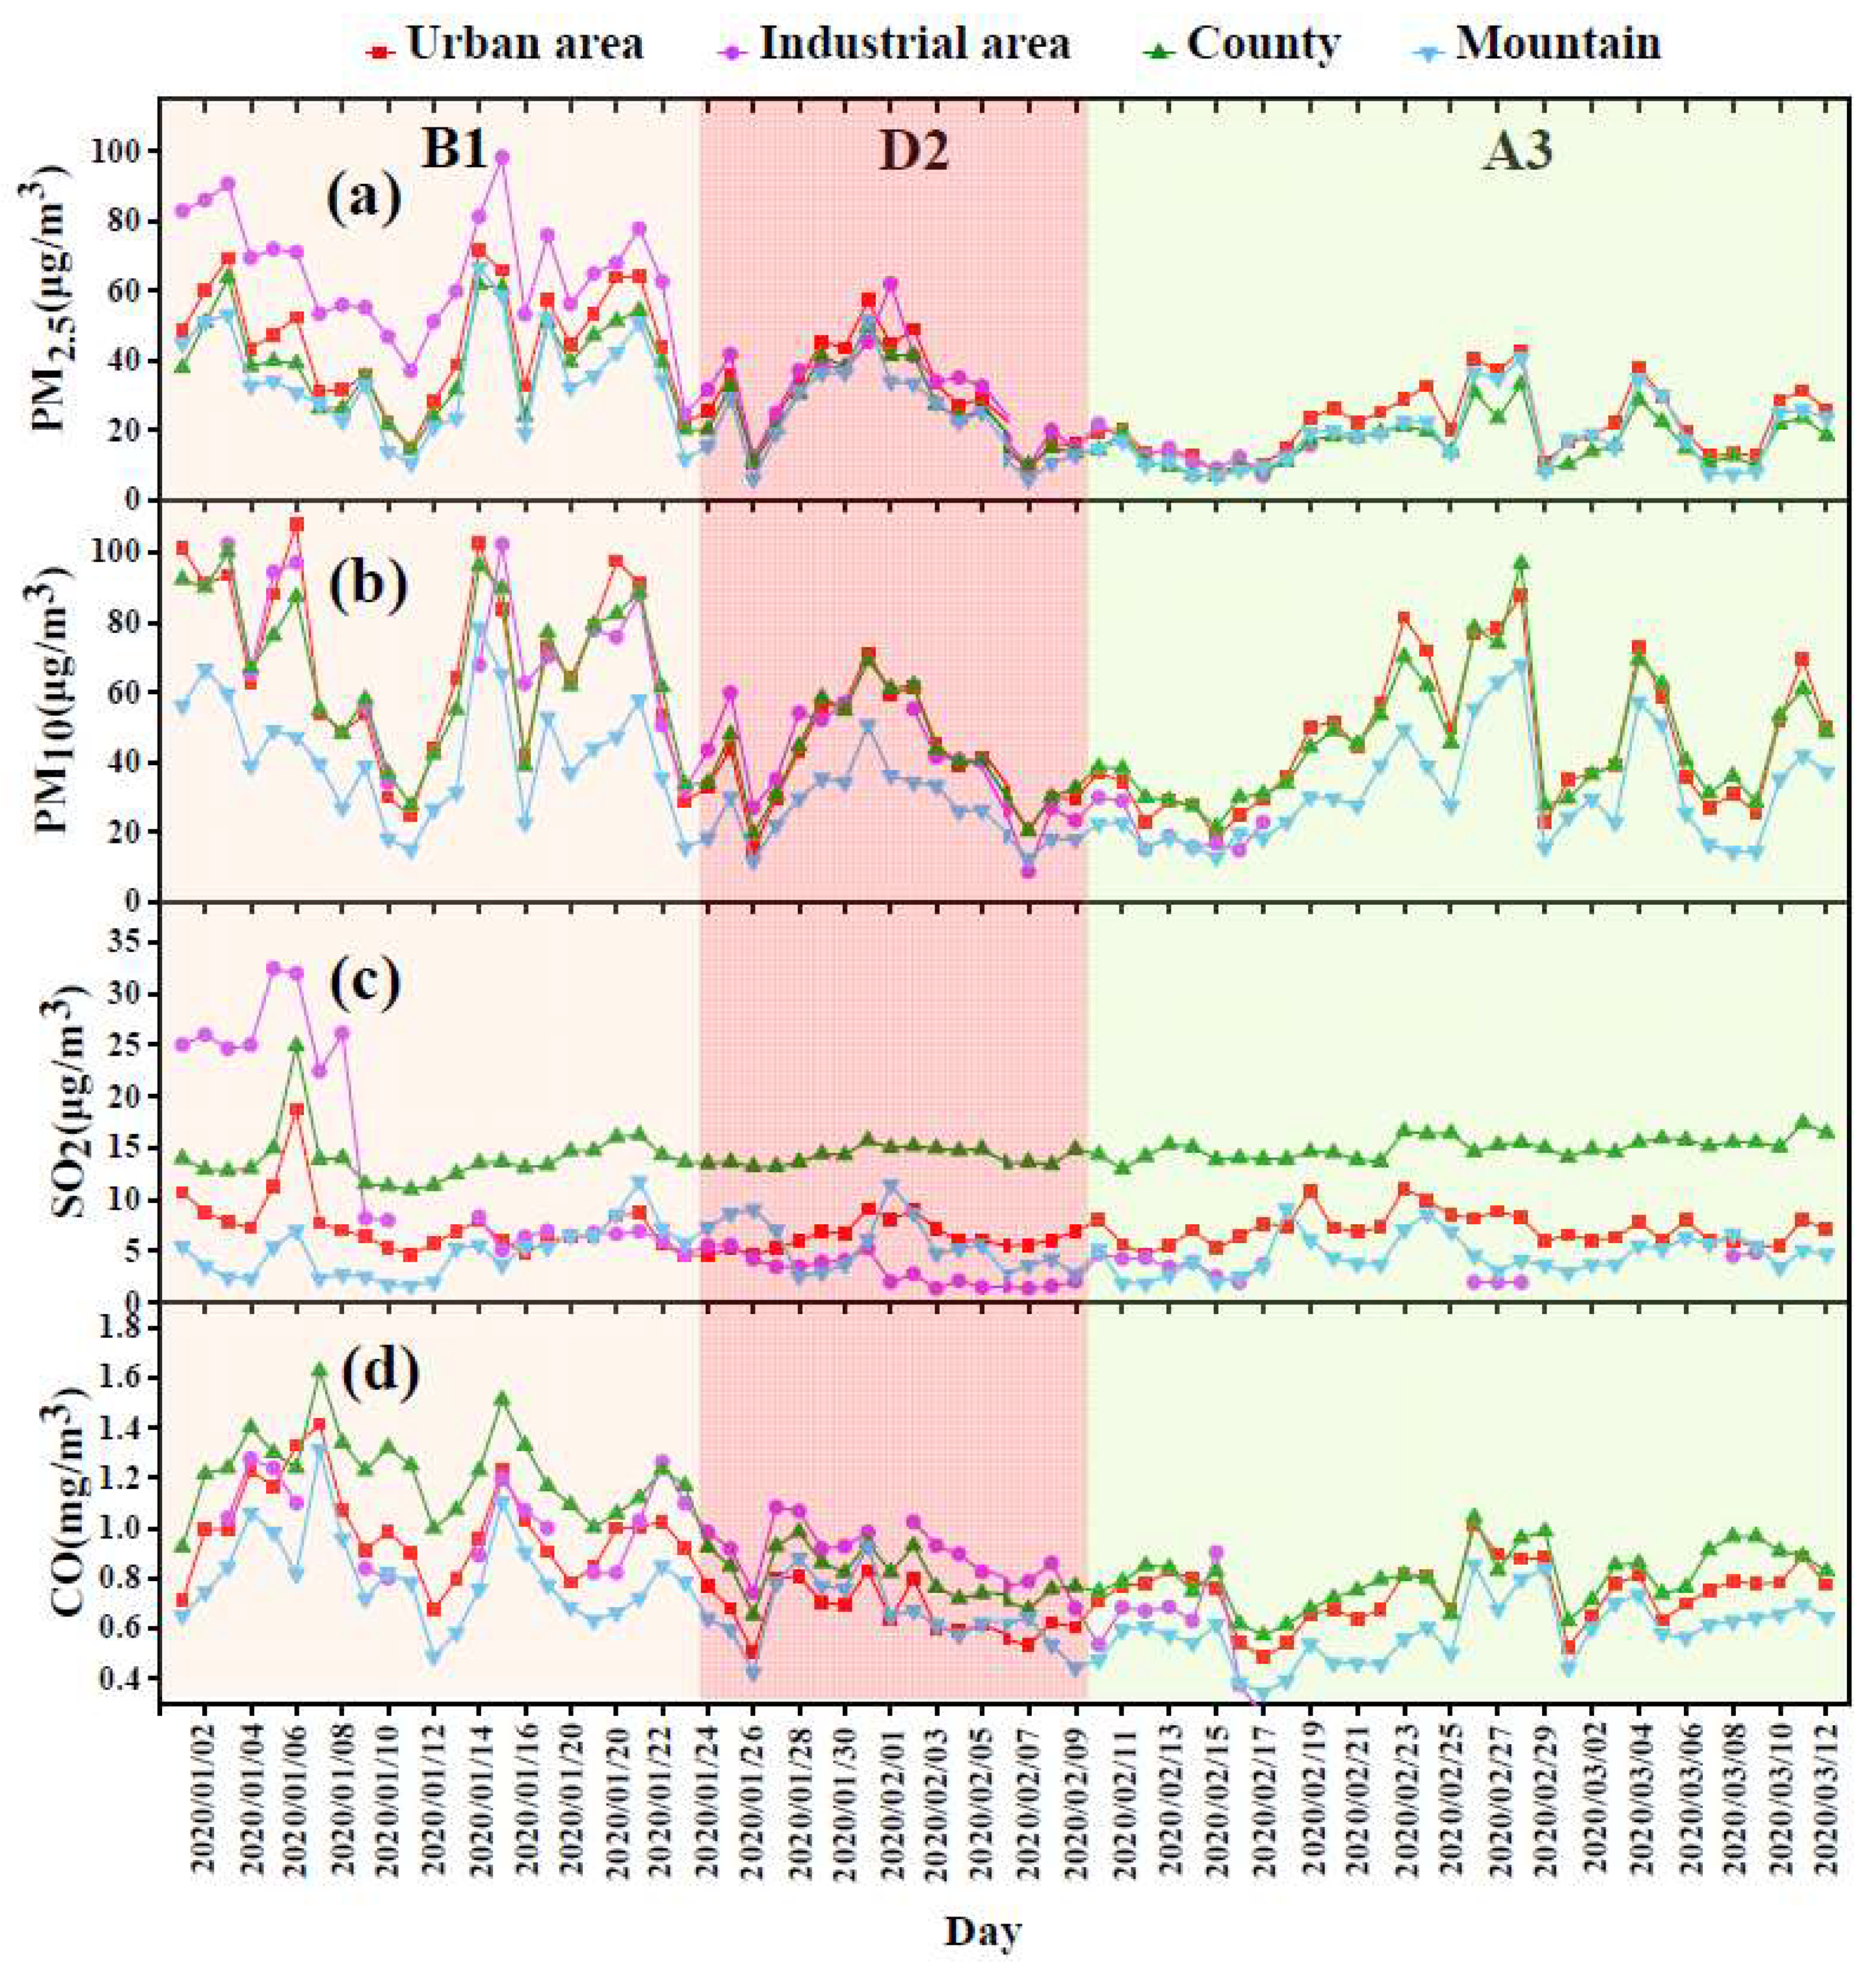
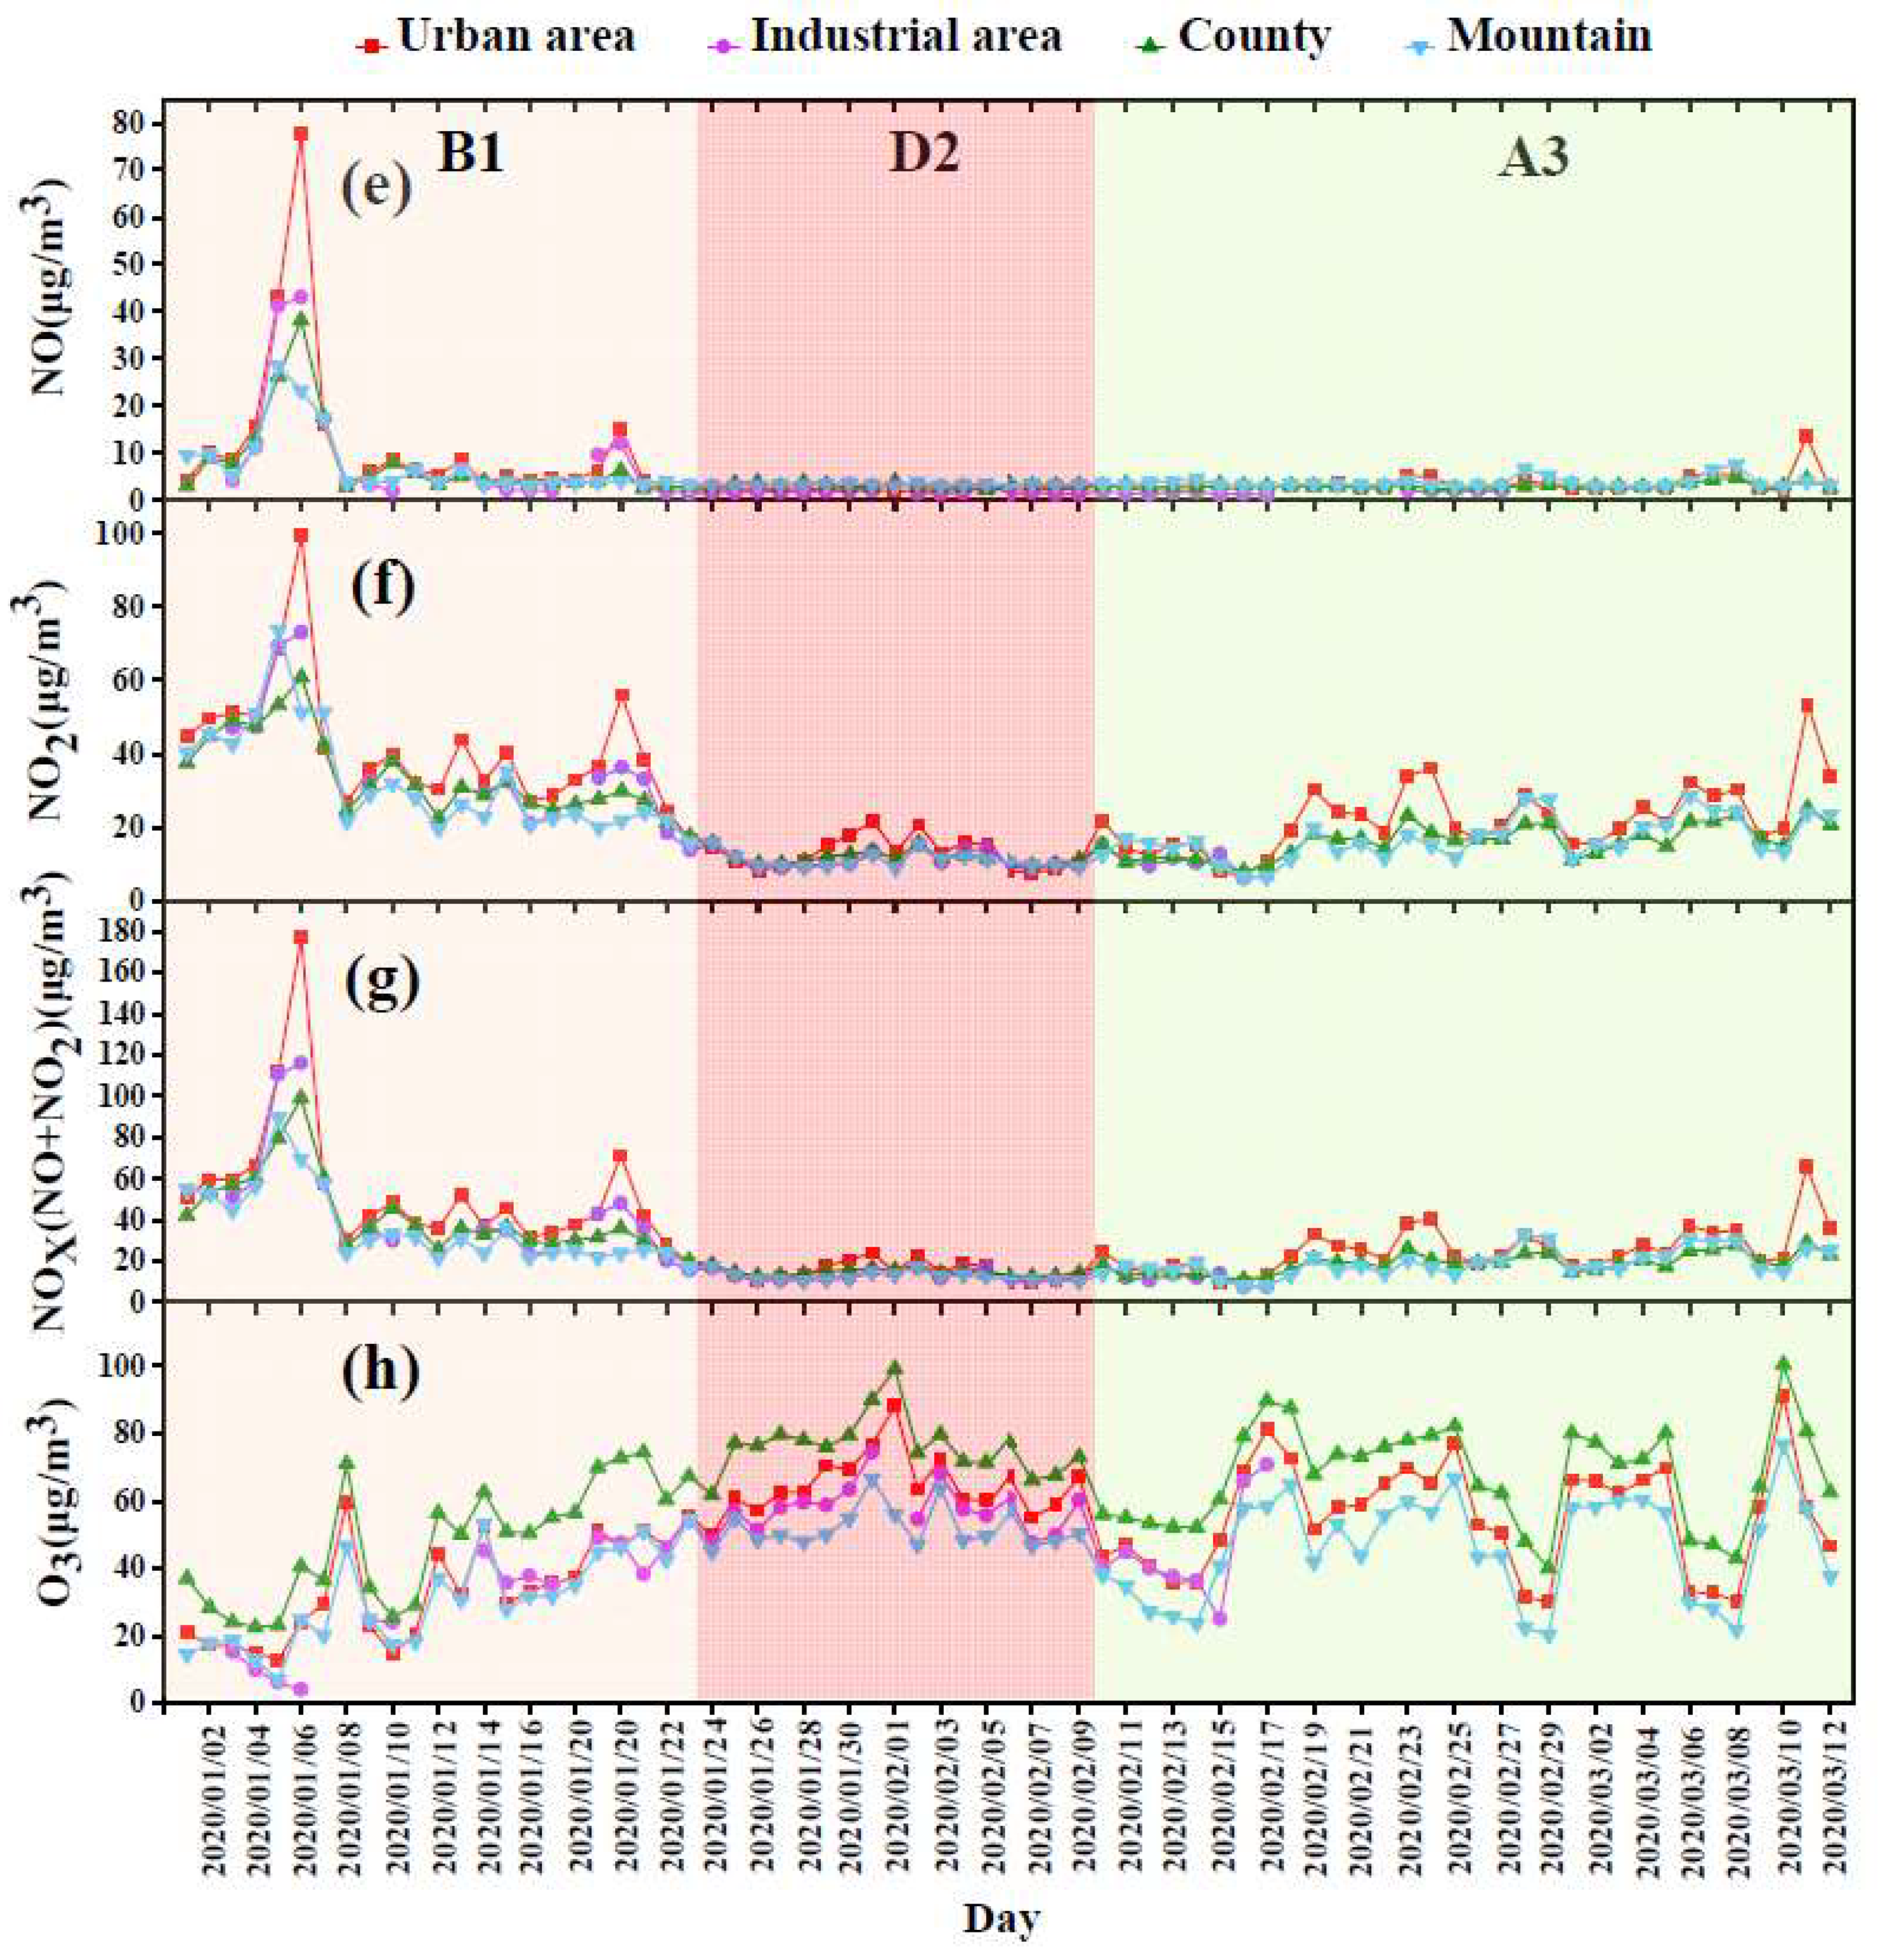
3.4. Temporal Variations of Pollutants during the COVID-19 Pandemic

The characteristics of changes in the concentrations of different air pollutants in each region at different stages during the COVID-19 lockdown are shown in Figure 6 and Figure 7. A significant reduction in most air pollutant emissions was observed in Nanchang after the implementation of lockdown measures between 24 January 2020 and 9 February 2020, especially in PM2.5, PM10, CO, NO, NO2, and NOx concentrations (Figure 6a,b,d and Figure 7e–g). During the A3 period after 10 February 2020 (lifting of the lockdown), the concentrations of various atmospheric pollutants began to recover slightly, such as PM10, NO, NO2, and NOx (Figure 6b and Figure 7e–g). However, the increased concentrations of all analyzed pollutants in the A3 period remained much lower than those in the B1 period (1 January–9 February 2020). Zhang et al. [49] reported the same trend for atmospheric NOx emissions in P1 (before Wuhan lockdown), P2 (lockdown and restrictions on activities), and P3 (after the official back-to-work day) in East China.
The outbreak of COVID-19 leading to the implementation of lockdown measures may have resulted in the lower pollutant concentrations in D2. To investigate whether this phenomenon occurred as a result of the embargo measures, we conducted a comparative analysis of B1, D2, and A3 for the 3 years from 2018 to 2020 (Table 1). According to Table 1, the comparison between D2 and B1 (D2 versus B1) in 2018 and 2019 shows that the reduction in PM2.5 concentration in four regions ranged from −12.24% to −1.33%, while it ranged from −49.16% to −28% in 2020. As compared with the B1 period, the largest reduction in PM2.5 concentration (49.16%) was recorded at industrial sites during the D2 period in 2020. In the four regions, the change in PM10 concentration during D2 versus B1 in 2018 and 2019 ranged from −5.31% to +15.96%, while it decreased by −30% in 2020, with the largest decrease in urban areas at −39.21%. NO, NO2, and NOx in each region also showed a greater decrease during D2 vs B1 in 2020 as compared with those in 2018 and 2019. In each region, O3 showed a greater increase during D2 versus B1 in 2020 as compared with those in 2018 and 2019. The concentrations of particulate matter and gaseous pollutants (excluding O3) were significantly reduced during the COVID-19 lockdown. Watts and Kommenda [50] reported a temporary reduction of air pollutants due to industrial shutdowns during the lockdown period. Cadotte [51] also reported decreases in air pollutants over major global cities where the COVID-19 outbreak was very severe. In China, NO2 and carbon emissions were reduced by approximately 30% and 25%, respectively, during the lockdown [52,53]. In addition, the reduction of primary emissions (e.g., NOx) during the lockdown period could compensate for the increasing secondary pollution (e.g., O3) [54]. The phenomenon in this study is consistent with that reported in previous studies.
The spring festival could also contribute to a reduction in the concentrations of pollutants. We performed a comparative analysis of pollutant levels between the Chinese New Year (CNY) and Non-Chinese New Year (NCNY) periods for the three years (2018–2020), considering the time from 1 January to 12 March. The official CNY holidays were 15–21 February 2018, 4–10 February 2019, and 24 January–2 February 2020. Excluding the New Year holidays, the period between 1 January and 12 March was taken as the NCNY period. Most of the pollutants in the four regions were found to have generally higher concentrations during NCNY than during CNY in the three years, whereas O3 concentrations exhibited the opposite trend in certain years (Table 2). Before the onset of the official holidays, people went home on vacation for family reunions and various commercial activities were reduced, which would decrease pollutant concentrations to some extent. Tan et al. [23] also reported that NOx, CO, SO2, and PM10 concentrations were lower during CNY holidays than those during NCNY holidays, while O3 concentrations were higher during the CNY period than during the NCNY period.
The combined effect of the lockdown and the spring festival will exacerbate the reduction in pollutant concentrations. Considering the severe impact of the COVID-19 outbreak, the government extended the Chinese New Year holiday until 9 February. Analyzing the pollutant concentrations in each region for the 2020 holiday as compared with the D2 period (the extended CNY holiday), the concentrations of most pollutants in the four regions appeared to be lower in the D2 period than in the CNY period in 2020 (Table 3). We found the concentrations of pollutants began to increase in the A3 period but they remained significantly lower than those during the B1 period. The lower rate of increase in pollutants could be largely attributed to the COVID-19 lockdown. During the A3 period, human activities slowly recovered, and thus pollutant concentrations started to increase. The aftershocks of COVID-19 may partially explain the slow recovery during A3 [49].

3.5. Spatial Variations of Pollutants during the COVID-19 Pandemic

During the COVID-19 pandemic, strict lockdown measures were taken in China. Specifically, in order to minimize people’s activities and socialization, a large number of factories, outdoor activity facilities, and administrative centers were closed. This strict lockdown in China significantly reduced emissions from various sectors, such as vehicle movement and industrial production, further resulting in substantial improvements to air quality, especially with regard to major air pollutants such as PM2.5, PM10, CO, and NOx (Figure 8 and Figure 9). For PM2.5 and PM10, a very distinct reduction was observed in their spatial patterns across four regions (Figure 8). As shown in Figure 8, SO2 concentrations generally showed a slight decrease during D2 as compared with B1. Nevertheless, the SO2 concentrations in industrial areas exhibited large changes and a sharp decline as compared with those in urban areas, counties, and mountainous areas. This is principally because SO2 concentrations are mainly related to industrial emissions. Urban areas, counties, and mountainous areas have fewer factories as compared with industrial areas.
The spatial distribution maps of CO, NO, NO2, and NOx concentrations all showed a decreasing trend (Figure 8 and Figure 9), but the changes were not as significant as those of PM2.5 and PM10 (Figure 8). Among the four regions, CO, NO, NO2, and NOx concentrations in industrial areas decreased significantly during D2 as compared with A1, but their concentrations in urban areas, counties, and mountainous areas exhibited a slight increase trend during A3. This indicated that although the lockdown was lifted, industrial operations did not resume immediately in industrial areas. The spatial plot of SO2 concentrations could be consistent with this interpretation (Figure 8). However, human activities and motor vehicle exhausts gradually picked up pace in urban areas, counties, and mountainous areas. According to the Annual Report on Environmental Statistics of Jiangxi Province, motor vehicle emissions account for about 75% of the NOx emissions in Nanchang [55].
For O3 concentrations, the lockdown period might have resulted in a spike in O3, especially in the industrial and transportation-dominated areas. In the industrial areas and urban areas, O3 concentrations increased by 94.6% and 83.2%, respectively, during D2 as compared with A1 (see Figure 9 and Table 1). Tobías et al. [11] reported a similar significant increase in O3 daily average concentration in Barcelona, Spain (+29% in an industrial area and +58% in an urban area), with increases of +33% (industrial area) and +57% (urban area) in the 8 h daily average maximum concentration. The increase in O3 concentration can be explained by the low utilization of O3 (titration, NO + O3 = NO2 + O2) due to the reduction of nitrogen oxides (NO) [56,57]. In county and mountainous areas, O3 concentrations also increased by 69.16% and 60.25%, respectively, during D2 as compared with B1. The O3 concentration in the mountainous area was higher than that in the county area, which may be explained by the mountainous area having more vegetation. The higher vegetation coverage implies a larger biogenic source of VOCs, which are O3 precursors, and the abundance of VOCs would promote O3 production through photochemical reactions with NOx [32].

4. Summary

This study investigated the spatial and temporal distributions of air pollutants (PM2.5, PM10, SO2, CO, NO, NO2, and O3) at 23 monitoring stations (including one industrial site, sixteen urban sites, two mountain sites, and four suburban sites) over Nanchang City from April 2017 to March 2020. The distinct spatial distribution of air pollutants indicated that anthropogenic activities have strong influences on regional air pollutants. The lower PM2.5, PM10, CO, and NOx concentrations during the lockdown period further verified the contribution of anthropogenic emissions to air pollutants. However, the O3 showed the opposite pattern, suggesting that O3 is mainly controlled by photochemical processes.

Author Contributions

Conceptualization, methodology, X.W., X.C. and L.L.; validation, X.W., Y.Z. and L.L.; formal analysis, X.W.; investigation, M.L.; resources, M.L.; data curation, X.W.; writing—original draft preparation, X.W.; writing—review and editing, L.L.; visualization, X.W. and X.C.; supervision, H.Z., Y.L. and S.Y.; project administration, L.L.; funding acquisition, L.L. All authors have read and agreed to the published version of the manuscript.

Funding

This research was funded by the National Natural Science Foundation of China, grant number 41763001.

Institutional Review Board Statement

Not applicable.

Informed Consent Statement

Not applicable.

Data Availability Statement

Data of the concentrations of air pollutants (PM2.5, PM10, SO2, CO, NO, NO2, and O3) are available from the corresponding author on request. Meteorological data covering the analysis period were obtained from http://www.weatherandclimate.cn/ (accessed on 10 March 2021).

Acknowledgments

Thanks to Xiao Hao for his kind help on the statistical techniques of this paper. Authors would also like to acknowledge the Editors and anonymous reviewers, who contributed immensely in improving the quality of this publication.

Conflicts of Interest

The authors declare no conflict of interest.

References

  1. Nuvolone, D.; Balzi, D.; Chini, M.; Scala, D.; Giovannini, F.; Barchielli, A. Short-term association between ambient air pollution and risk of hospitalization for acute myocardial infarction: Results of the cardiovascular risk and air pollution in Tuscany (RISCAT) study. Am. J. Epidemiol. 2011, 174, 63–71. [Google Scholar] [CrossRef] [PubMed]
  2. Gao, J.; Woodward, A.; Vardoulakis, S.; Kovats, S.; Wilkinson, P.; Li, L.; Xu, L.; Li, J.; Yang, J.; Cao, L.; et al. Haze, public health and mitigation measures in China: A review of the current evidence for further policy response. Sci. Total Environ. 2017, 578, 148–157. [Google Scholar] [CrossRef]
  3. Murray, C.J.; Aravkin, A.Y.; Zheng, P.; Abbafati, C.; Abbas, K.M.; Abbasi-Kangevari, M.; Abbastabar, H.; Abd-Allah, F.; Abdelalim, A.; Abdollahi, M.; et al. Global burden of 87 risk factors in 204 countries and territories, 1990–2019: A systematic analysis for the Global Burden of Disease Study 2019. Lancet 2020, 396, 1223–1249. [Google Scholar] [CrossRef]
  4. Tian, H.; Liu, Y.; Li, Y.; Wu, C.H.; Chen, B.; Kraemer, M.U.; Li, B.; Cai, J.; Xu, B.; Yang, Q.; et al. An investigation of transmission control measures during the first 50 days of the COVID-19 epidemic in China. Science 2020, 368, 638–642. [Google Scholar] [CrossRef] [PubMed] [Green Version]
  5. Zhu, N.; Zhang, D.; Wang, W.; Li, X.; Yang, B.; Song, J.; Zhao, X.; Huang, B.; Shi, W.; Lu, R.; et al. A novel coronavirus from patients with pneumonia in China, 2019. N. Engl. J. Med. 2020, 382, 727–733. [Google Scholar] [CrossRef]
  6. Wang, C.; Horby, P.W.; Hayden, F.G.; Gao, G.F. A novel coronavirus outbreak of global health concern. Lancet 2020, 395, 470–473. [Google Scholar] [CrossRef] [Green Version]
  7. Zhou, P.; Yang, X.L.; Wang, X.G.; Hu, B.; Zhang, L.; Zhang, W.; Si, H.-R.; Zhu, Y.; Li, B.; Huang, C.-L.; et al. A pneumonia outbreak associated with a new coronavirus of probable bat origin. Nature. 2020, 579, 270–273. [Google Scholar] [CrossRef] [PubMed] [Green Version]
  8. Castaldi, S.; Maffeo, M.; Rivieccio, B.A.; Zignani, M.; Manzi, G.; Nicolussi, F.; Salini, S.; Micheletti, A.; Gaito, S.; Biganzoli, E. Monitoring emergency calls and social networks for COVID-19 surveillance. To learn for the future: The outbreak experience of the Lombardia region in Italy. Acta Biomed. 2020, 91, 29–33. [Google Scholar] [CrossRef] [PubMed]
  9. Chen, Q.X.; Huang, C.L.; Yuan, Y.; Tan, H.P. Influence of COVID-19 event on air quality and their association in Mainland China. Aerosol Air Qual. Res. 2020, 20, 1541–1551. [Google Scholar] [CrossRef]
  10. Nakada, L.; Urban, R.C. COVID-19 pandemic: Impacts on the air quality during the partial lockdown in São Paulo state, Brazil. Sci. Total Environ. 2020, 730, 139087. [Google Scholar] [CrossRef]
  11. Tobías, A.; Carnerero, C.; Reche, C.; Massagué, J.; Querol, X. Changes in air quality during the lockdown in Barcelona (Spain) one month into the SARS-CoV-2 epidemic. Sci. Total Environ. 2020, 726, 138540. [Google Scholar] [CrossRef] [PubMed]
  12. London, G. Estimation of Changes in Air Pollution in London during the COVID19 Outbreak. 2020. Available online: https://www.london.gov.uk/WHAT-WE-DO/environment/environment-publications/estimation-changes-air-pollution-during-covid-19-outbreak-0 (accessed on 1 October 2021).
  13. Dantas, G.; Siciliano, B.; França, B.B.; da Silva, C.M.; Arbilla, G. The impact of COVID-19 partial lockdown on the air quality of the city of Rio de Janeiro, Brazil. Sci. Total Environ. 2020, 729, 139085. [Google Scholar] [CrossRef] [PubMed]
  14. Sharma, S.; Zhang, M.; Gao, J.; Zhang, H.; Kota, S.H. Effect of restricted emissions during COVID-19 on air quality in India. Sci. Total Environ. 2020, 728, 138878. [Google Scholar] [CrossRef] [PubMed]
  15. Cai, S.; Wang, Y.; Zhao, B.; Wang, S.; Chang, X.; Hao, J. The impact of the “Air Pollution Prevention and Control Action Plan” on PM2.5 concentrations in Jing-Jin-Ji region during 2012–2020. Sci. Total Environ. 2017, 580, 197–209. [Google Scholar] [CrossRef] [PubMed]
  16. Notice of the People’s Government of Jiangxi Province on Printing and Distributing the Comprehensive Work Plan for Energy Conservation and Emission Reduction in Jiangxi Province during the 13th Five-Year Plan 2017 (in Chinese). Available online: http://www.jiangxi.gov.cn/art/2017/7/12/art_4968_212681.html (accessed on 2 October 2021).
  17. National Bureau of Statistics of China (NBS). Nanchang Statistical Yearbook; China Statistics Press: Beijing, China, 2018. (In Chinese) [Google Scholar]
  18. National Bureau of Statistics of China (NBS). Nanchang Statistical Yearbook; China Statistics Press: Beijing, China, 2019. (In Chinese) [Google Scholar]
  19. National Bureau of Statistics of China (NBS). Nanchang Statistical Yearbook; China Statistics Press: Beijing, China, 2020. (In Chinese) [Google Scholar]
  20. Morawska, L.; Jayaratne, E.R.; Mengersen, K.; Jamriska, M.; Thomas, S. Difference in airborne particle and gaseous concentrations in urban air between weekdays and weekends. Atmos. Environ. 2002, 36, 4375–4383. [Google Scholar] [CrossRef] [Green Version]
  21. Elbir, T.; Muezzinoglu, A. Estimation of emission strengths of primary air pollutants in the city of Izmir, Turkey. Atmos. Environ. 2004, 38, 1851–1857. [Google Scholar] [CrossRef]
  22. Yang, K.L.; Ting, C.C.; Wang, J.L.; Wingenter, O.W.; Chan, C.C. Diurnal and seasonal cycles of ozone precursors observed from continuous measurement at an urban site in Taiwan. Atmos. Environ. 2005, 39, 3221–3230. [Google Scholar] [CrossRef]
  23. Tan, P.H.; Chou, C.; Liang, J.Y.; Chou, C.K.; Shiu, C.J. Air pollution “holiday effect” resulting from the Chinese New Year. Atmos. Environ. 2009, 43, 2114–2124. [Google Scholar] [CrossRef]
  24. Seinfeld, J.H.; Pandis, S.N. Atmospheric Chemistry and Physics: From Air Pollution to Climate Change, 3rd ed.; John Wiley&Sons, Inc.: Hoboken, NJ, USA, 2016. [Google Scholar] [CrossRef]
  25. Pan, L.; Xu, J.M.; Tie, X.X.; Mao, X.Q.; Gao, W.; Chang, L.Y. Long-term measurements of planetary boundary layer height and interactions with PM2.5 in Shanghai, China. Atmos. Pollut. Res. 2019, 10, 989–996. [Google Scholar] [CrossRef]
  26. Tang, G.; Zhang, J.; Zhu, X.; Song, T.; Wang, Y. Mixing layer height and its implications for air pollution over beijing, china. Atmos. Chem. Physics Discuss. 2016, 15, 2459–2475. [Google Scholar] [CrossRef] [Green Version]
  27. Li, Q.H.; Wu, B.G.; Liu, J.L.; Zhang, H.S.; Cai, X.H.; Song, Y. Characteristics of the atmospheric boundary layer and its relation with PM2.5 during haze episodes in winter in the North China Plain. Atmos. Environ. 2020, 223, 117265. [Google Scholar] [CrossRef]
  28. Guinot, B.; Cachier, H.; Sciare, J.; Tong, Y.; Xin, W.; Jianhua, Y. Beijing aerosol: Atmospheric interactions and new trends. J. Geophys. Res. Space Phys. 2007, 112, D14314. [Google Scholar] [CrossRef] [Green Version]
  29. Zhao, X.; Zhang, X.; Xu, X.; Xu, J.; Meng, W.; Pu, W. Seasonal and diurnal variations of ambient PM2.5 concentration in urban and rural environments in Beijing. Atmos. Environ. 2009, 43, 2893–2900. [Google Scholar] [CrossRef]
  30. Sun, Y.; Zhuang, G.; Yuan, H.; Zhang, X.; Guo, J. Characteristics and sources of 2002 super dust storm in Beijing. Chin. Sci. Bull. 2004, 49, 698–705. [Google Scholar] [CrossRef]
  31. Yan, S.; Cao, H.; Chen, Y.; Wu, C.; Hong, T.; Fan, H. Spatial and temporal characteristics of air quality and air pollutants in 2013 in Beijing. Environ. Sci. Pollut. Res. 2016, 23, 13996–14007. [Google Scholar] [CrossRef] [PubMed]
  32. Zhang, Z.; Zhang, X.; Gong, D.; Quan, W.; Zhao, X.; Ma, Z.; Kim, S.-J. Evolution of surface O3 and PM2.5 concentrations and their relationships with meteorological conditions over the last decade in Beijing. Atmos. Environ. 2015, 108, 67–75. [Google Scholar] [CrossRef]
  33. Zhao, S.; Hu, B.; Gao, W.; Li, L.; Huang, W.; Wang, L.; Yang, Y.; Liu, J.; Li, J.; Ji, D.; et al. Effect of the “coal to gas” project on atmospheric NOX during the heating period at a suburban site between Beijing and Tianjin. Atmos. Res. 2020, 241, 104977. [Google Scholar] [CrossRef]
  34. Rimetz-Planchon, J.; Perdrix, E.; Sobanska, S.; Bremard, C. PM10 air quality variations in an urbanized and industrialized harbor. Atmos. Environ. 2008, 42, 7274–7283. [Google Scholar] [CrossRef]
  35. Querol, X.; Alastuey, A.; Ruiz, C.; Artiñano, B.; Hansson, H.; Harrison, R.; Buringh, E.; Brink, H.T.; Lutz, M.; Bruckmann, P.; et al. Speciation and origin of PM10 and PM2.5 in selected European cities. Atmos. Environ. 2004, 38, 6547–6555. [Google Scholar] [CrossRef]
  36. Yin, J.; Allen, A.G.; Harrision, R.M.; Jennings, S.G.; Wright, E.; Fitzpatrick, M.; Healy, T.; Barry, E.; Ceburnis, D.; McCusker, D. Major component composition of urban PM10 and PM2.5 in Ireland. Atmospheric Res. 2005, 78, 149–165. [Google Scholar] [CrossRef]
  37. Gao, Z.X.; Wang, X.L.; Xiang, H.; Gou, A.N. Variation characteristics and potential sources of air pollutants during 2014–2017 in Wuhan. Acta Sci. Circumstantiae. 2018, 11, 4440–4453. (In Chinese) [Google Scholar] [CrossRef]
  38. Hong, W.; Qiuping, Z.; Hua, Y.; Binbin, C.; Dongsheng, J. Temporal and Spatial Variation Characteristics and the Impact Factors of CO in Fuzhou. Ecol. Environ. Sci. 2015, 7, 1191–1196. (In Chinese) [Google Scholar] [CrossRef]
  39. Yu, Z.; Liu, S.D.; Wang, Y.W.; Hu, N. Observation of Atmospheric Pollutants in the Urban Area of Hangzhou. Sci. Technol. Eng. 2016, 16, 95–104. (In Chinese) [Google Scholar] [CrossRef]
  40. Yang, J.D. Analysis on Pollution Characteristics and Variation Trend of CO in Tianjin. Environ. Sci. Manag. 2012, 37, 89–90. (In Chinese) [Google Scholar] [CrossRef]
  41. Fujita, E.M.; Stockwell, W.R.; Keislar, R.E.; Chinkin, L.R. Weekend/Weekday Ozone Observations in the South Coast Air Basin: Retrospective Analysis of Ambient and Emissions Data and Refinement of Hypotheses, Volume I-Executive Summary; The National Renewable Energy Laboratory: Golden, CO, USA; The Desert Research Institute: Reno, NV, USA; Sonoma Technology: Petaluma, CA, USA, 2000.
  42. Lei, Y.; Zhang, X.L.; Tang, Y.X.; Fan, G.Z.; Zhou, D.W. Holiday effects on PM2.5 and other major pollutants in Beijing. Acta Sci. Circumstantiae 2015, 35, 1520–1528. (In Chinese) [Google Scholar] [CrossRef]
  43. Wang, Z.-S.; Li, Y.-T.; Chen, T.; Zhang, D.-W.; Sun, F.; Sun, R.-W.; Dong, X.; Sun, N.-D.; Pan, L.-B. Temporal and Spatial Distribution Characteristics of Ozone in Beijing. Environ. Sci. 2014, 12, 4446–4453. (In Chinese) [Google Scholar] [CrossRef]
  44. Yanfen, L.; Qian, W.; Qingyan, F.; Jianming, X.; Qinzhen, L.; Fang, L.; Kan, H. Temporal-Spatial Characteristics and Impact Factors of Ozone Pollution in Shanghai. Environ. Monit. China 2017, 4, 60–67. (In Chinese) [Google Scholar] [CrossRef]
  45. Su, Z.H.; Han, H.Q.; Chen, B. Spatial and temporal variation and combined pollution characteristics of atmospheric pollutants in urban Guiyang. Carsologica Sin. 2020, 3, 442–452. (In Chinese) [Google Scholar]
  46. Wang, Z.; Li, Y.; Chen, T.; Zhang, D.; Sun, F.; Wei, Q.; Dong, X.; Sun, R.; Huan, N.; Pan, L. Ground-level ozone in urban Beijing over a 1-year period: Temporal variations and relationship to atmospheric oxidation. Atmos. Res. 2015, 164–165, 110–117. [Google Scholar] [CrossRef]
  47. Han, S.; Bian, H.; Feng, Y.; Liu, A.; Li, X.; Zeng, F.; Zhang, X. Analysis of the Relationship between O3, NO and NO2 in Tianjin, China. Aerosol Air Qual. Res. 2011, 11, 128–139. [Google Scholar] [CrossRef] [Green Version]
  48. Liu, Z.; Hu, B.; Wang, L.; Wu, F.; Gao, W.; Wang, Y. Seasonal and diurnal variation in particulate matter (PM10 and PM2.5) at an urban site of Beijing: Analyses from a 9-year study. Environ. Sci. Pollut. Res. 2015, 22, 627–642. [Google Scholar] [CrossRef]
  49. Zhang, R.; Zhang, Y.; Lin, H.; Feng, X.; Fu, T.M.; Wang, Y. NOx emission reduction and recovery during COVID-19 in East China. Atmosphere 2020, 11, 433. [Google Scholar] [CrossRef] [Green Version]
  50. Watts, J.; Kommenda, N. Coronavirus pandemic leading to huge drop in air pollution. Available online: https://www.theguardian.com/environment/2020/mar/23/coronavirus-pandemic-leading-to-huge-drop-in-air-pollution (accessed on 1 October 2021).
  51. Cadotte, M. Early evidence that COVID-19 government policies reduce urban air pollution. Available online: https://eartharxiv.org/repository/view/345/ (accessed on 1 October 2021).
  52. He, G.; Pan, Y.; Tanaka, T. COVID-19, city lockdowns, and air pollution: Evidence from China. HKUST IEMS Work. Paper 2020, 2019-72. [Google Scholar] [CrossRef] [Green Version]
  53. Liu, F.; Page, A.; Strode, S.A.; Yoshida, Y.; Choi, S.; Zheng, B.; Lamsal, L.N.; Li, C.; Krotkov, N.A.; Eskes, H.; et al. Abrupt decline in tropospheric nitrogen dioxide over China after the outbreak of COVID-19. Sci. Adv. 2020, 6, eabc2992. [Google Scholar] [CrossRef]
  54. Huang, X.; Ding, A.; Gao, J.; Zheng, B.; Zhou, D.; Qi, X.; Tang, R.; Wang, J.; Ren, C.; Nie, W.; et al. Enhanced secondary pollution offset reduction of primary emissions during COVID-19 lockdown in China. Natl. Sci. Rev. 2021, 8, nwaa137. [Google Scholar] [CrossRef]
  55. Jiangxi Provincial Department of Ecology and Environment. Jiangxi Province Environmental Statistics Annual Report; China Statistics Press: Beijing, China, 2016; pp. 21–32. [Google Scholar]
  56. De Fatima Andrade, M.; Kumar, P.; de Freitas, E.D.; Ynoue, R.Y.; Martins, J.; Martins, L.D.; Nogueira, T.; Perez-Martinez, P.J.; de Miranda, R.M.; Albuquerque, T.T.D.A.; et al. Air quality in the megacity of São Paulo: Evolution over the last 30 years and future perspectives. Atmos. Environ. 2017, 159, 66–82. [Google Scholar] [CrossRef] [Green Version]
  57. Mahato, S.; Pal, S.; Ghosh, K.G. Effect of lockdown amid COVID-19 pandemic on air quality of the megacity Delhi, India. Sci. Total Environ. 2020, 730, 139086. [Google Scholar] [CrossRef]
Figure 1. Locations of the monitoring stations of the Air Quality Monitoring Network in Nanchang. Notes: 1, Environmental Protection Agency of Anyi County; 2, Environmental Protection Agency of Donghu District; 3, Nanchang Hangkong University Qianhu Campus (Honggutan New District); 4, Environmental Protection Agency of Jinxian County; 5, Nanchang High-tech Zone Court; 6, Nanchang Sanghai Industrial Park (Jingkai District); 7, East China Jiaotong University (Jingkai District); 8, Nanchang Foreign Language School; 9, Environmental Protection Monitoring Center of Nanchang County; 10, Environmental Protection Agency of Nanchang County; 11, Qinsheng Village (Qingshanhu District); 12, Environmental Protection Agency of Qingyunpu District; 13, Environmental Protection Agency of Wanli District; 14, Government of Xihu District; 15, Environmental Protection Agency of Xinjian District; 16, Provincial Forestry Company; 17, Province foreign affairs office; 18, Provincial station; 19, Wushu school; 20, The Elephant Lake; 21, Electrical and Mechanical School; 22, Construction Engineering School; 23, Forestry Institute.
Atmosphere 12 01298 g001
Figure 2. Time series of meteorological parameters: (a) Rainfall; (b) wind speed (WS); (c) temperature (T); (d) relative humidity (RH). The summer and winter periods are marked as shaded pink areas, and gray areas, respectively.
Atmosphere 12 01298 g002
Figure 3. Monthly mean concentrations of air pollutants: (a) PM2.5; (b) PM10; (c) SO2; (d) CO; (e) NO; (f) NO2; (g) NOx (NO + NO2); (h) O3.
Atmosphere 12 01298 g003
Figure 4. Seasonal mean concentrations of air pollutants: (a) PM2.5; (b) PM10; (c) SO2; (d) CO; (e) NO; (f) NO2; (g) NOx (NO + NO2); (h)O3.
Atmosphere 12 01298 g004
Figure 5. Time mean concentrations of air pollutants: (a) PM2.5; (b) PM10; (c) SO2; (d) CO; (e) NO; (f) NO2; (g) NOx (NO + NO2); (h) O3.
Atmosphere 12 01298 g005
Figure 6. Daily mean concentrations of air pollutants of four regions in Nanchang from 1 January to 12 March 2020: (a) PM2.5; (b) PM10; (c) SO2; (d) CO.
Atmosphere 12 01298 g006
Figure 7. Daily mean concentrations of air pollutants of four regions in Nanchang from 1 January to 12 March 2020: (e) NO; (f) NO2; (g) NOx; (h) O3.
Atmosphere 12 01298 g007
Figure 8. Spatial distribution of PM2.5, PM10, SO2, and CO concentrations in (A,D,G,J) (before COVID-19), (B,E,H,K) (during COVID-19), and (C,F,I,L) (after COVID-19) periods over Nanchang.
Atmosphere 12 01298 g008
Figure 9. Spatial distribution of NO, NO2, NOX, and O3 concentrations in (A,D,G,J) (before COVID-19), (B,E,H,K) (during COVID-19), and (C,F,I,L) (after COVID-19) periods over Nanchang.
Atmosphere 12 01298 g009
Table 1. Mean concentration of PM2.5, PM10, SO2, CO, NO, NO2, NOx, and O3 during the three periods and the relative changes between the three periods in 2018, 2019, and 2020.
B1D2A3D2vB1A3vD2
201820192020201820192020201820192020201820192020201820192020
PM2.5
(μg/m3)
Urban area58.9660.2745.553.4554.2331.749.2339.6430.6−9.34% *−10.03% *−30.33% *−7.89% *−26.89% *−3.47%
Industrial area62.2860.9265.155.0760.1033.158.0444.3418.8−11.58%−1.33%−49.16% *5.40%−26.23% *−43.2% *
County53.8160.1039.247.2254.8128.144.6939.5522.9−12.24%−8.80%−28.32% *−5.36%−27.85% *−18.51% *
Mountain46.8250.973543.9047.7125.235.6836.3625.5−6.23%−6.40%−28.00% *−18.72%−23.79%1.19%
PM10
(μg/m3)
Urban area97.2194.9268.685.1690.6141.784.2564.0447.6−12.4%*−4.54%−39.21% *−1.06%−29.32% *14.15% *
Industrial area109.54104.1371.799.80120.7647.698.2094.2621−8.89%15.96%−33.61%−1.60%−21.94%−55.88%
County99.8296.9767.186.1592.6942.580.8766.6347.6−13.69%−4.41%−36.66% *−6.14%−28.12% *12.00%
Mountain59.2353.174256.0856.7626.856.5136.0831.8−5.31%6.75%−36.19% *0.77%−36.43% *18.66%
SO2
(μg/m3)
Urban area15.3710.357.5412.9810.896.459.269.407.38−15.53% *5.24%−14.46% *−28.68% *−13.64%14.42% *
Industrial area47.3220.3815.244.3722.493.0632.0724.013.49−6.23%10.35%−79.87% *−27.71% *6.74%14.05%
County27.1320.551421.6316.6314.322.5415.3615.4−20.28% *−19.07% *2.14%4.19%−7.62%7.69%
Mountain6.694.154.825.684.805.694.862.904.71−15.02%15.55%18.05%−14.53%−39.43%−17.22%
CO
(mg/m3)
Urban area1.141.400.990.931.040.671.041.060.77−18.54% *−25.43% *−32.32% *12.73% *1.59%14.93% *
Industrial area0.871.221.030.540.860.910.680.860.61−38.53% *−29.91% *−11.65%27.36%0.49%−32.97%
County0.971.291.220.670.970.820.931.020.83−30.51% *−24.75% *−32.79% *38.63% *5.11%1.22%
Mountain0.911.010.810.800.920.660.810.910.6−11.73%−9.29%−18.52% *1.40%−0.65%−9.09%
NO
(μg/m3)
Urban area18.2713.6811.69.467.462.2312.877.473.26−48.25% *−45.46% *−80.78% *36.05% *0.15%46.19%
Industrial area10.482.799.513.474.481.700.767.071.59−66.85%60.43%−82.12%−78.10%57.85%−6.47%
County3.447.787.912.283.712.762.434.132.82−33.83%−52.29% *−65.11% *6.79%11.27%2.17%
Mountain3.462.557.361.050.813.251.170.613.57−69.78% *−68.20% *−55.84% *11.44%−24.26%9.85%
NO2
(μg/m3)
Urban area55.0655.0035.642.8137.8812.739.1341.2320.7−22.25% *−31.12% *−64.33% *−8.60% *8.84% *62.99% *
Industrial area23.8921.0531.212.9522.8510.46.3212.549.38−45.79% *8.53%−66.67% *−51.19% *−45.12% *−9.81%
County23.3137.8629.714.6426.0510.418.9127.0814.1−37.20% *−31.21% *−64.98% *29.18%3.95%35.58% *
Mountain25.7922.8125.416.5218.587.5114.3115.2613.6−35.96% *−18.54% *−70.43% *−13.35%−17.87% *81.09% *
NOx
(μg/m3)
Urban area73.3768.675352.2645.1915.251.9948.7024.9−28.77% *−34.20% *−71.32% *−0.52%7.78%63.82% *
Industrial area34.3623.8445.616.4227.3212.97.0819.6011.5−52.21% *14.61%−71.71% *−56.88% *−28.25%−10.85%
County26.7545.6441.818.4529.7614.621.3431.2018.5−31.02%−34.80% *−65.07% *15.67%4.86%26.71%
Mountain29.2525.3636.617.5619.4012.415.4816.2118.6−39.96% *−23.51% *−66.12% *−11.87%−16.45% *50.00%
O3
(μg/m3)
Urban area28.7533.0033.548.1151.156545.2851.455967.32% *55.00% *94.03% *−5.88% *0.58%−9.23% *
Industrial area30.2536.3931.645.5053.5357.951.3069.9053.950.42%47.09% *83.23% *12.75% *30.57% *−6.91%
County33.9451.8747.869.5656.8776.651.7458.7971.1104.94% *9.64%60.25% *−25.62% *3.37%−7.18% *
Mountain29.1331.3830.845.9241.6852.152.5045.2548.557.65% *32.83% *69.16% *14.33% *8.57%−6.91%
Notes: D2vB1 means the relative changes of mean concentration (PM2.5, PM10, SO2, CO, NO, NO2, NOx, and O3) during D2 versus those during B1, i.e., 100% × (D2 − B1)/B1 [48]. The same logic applies to A3vD2. * The difference between periods is significant using ANOVA test with p-values < 0.05.
Table 2. Mean concentration of PM2.5 (μg/m3), PM10 (μg/m3), SO2 (μg/m3), CO (mg/m3), NO (μg/m3), NO2 (μg/m3), NOx (μg/m3) and O3 (μg/m3) in Chinese New Year (CNY) and Non-Chinese New Year (NCNY) for the three periods 2018, 2019, and 2020.
RegionYearPeriodPM2.5PM10SO2CONONO2NOxO3
Urban area2018NCNY52.7089.6612.681.0415.0547.8362.8940.63
CNY59.7579.847.141.082.4220.7423.1740.38
2019NCNY51.1783.4310.261.1910.2847.9258.2044.75
CNY37.1052.658.210.952.0116.5318.4151.07
2020NCNY35.5253.977.330.836.2527.6934.1148.07
CNY37.0146.786.480.722.2114.3116.5266.00
Industrial area2018NCNY57.42102.5941.280.704.9614.5619.5242.91
CNY70.4599.1527.830.820.914.775.6842.14
2019NCNY54.38105.2822.030.995.0618.3523.4155.74
CNY45.3090.2926.520.830.356.026.3849.57
2020NCNY45.7448.498.510.875.0022.2528.7641.27
CNY37.3649.694.040.961.8011.5713.3858.33
County2018NCNY47.4388.4024.380.862.9119.9923.0950.51
CNY55.7687.1020.341.100.7414.4915.2442.78
2019NCNY51.3285.2417.711.125.5231.9837.5056.53
CNY36.4959.4214.050.912.3815.1517.5352.06
2020NCNY28.7953.3614.790.974.7021.8126.5861.10
CNY32.8048.1114.190.872.8112.4115.3579.34
Mountain2018NCNY40.6056.985.830.831.9819.0020.9843.59
CNY46.8360.433.990.951.0214.6915.7141.08
2019NCNY45.1147.873.920.951.4019.4621.0240.13
CNY31.9034.712.280.860.509.9710.4737.77
2020NCNY28.2734.514.690.684.9321.5424.4941.31
CNY29.4030.046.760.713.2911.3013.0152.03
Table 3. Mean concentration of PM2.5 (μg/m3), PM10 (μg/m3), SO2 (μg/m3), CO (mg/m3), NO (μg/m3), NO2 (μg/m3), NOx (μg/m3) and O3 (μg/m3) in 2020 for CNY and the D2 period.
RegionPeriodPM2.5PM10SO2CONONO2NOxO3
Urban areaCNY37.0146.786.480.722.2114.3116.5266.00
D231.7041.706.450.672.2312.7015.2065.00
Industrial areaCNY37.3649.694.040.961.8011.5713.3858.33
D233.1047.603.060.911.7010.4012.9057.90
CountyCNY32.8048.1114.190.872.8112.4115.3579.34
D228.1042.5014.300.822.7610.4014.6076.60
MountainCNY29.4030.046.760.713.2911.3013.0152.03
D225.2026.805.690.663.257.5112.4052.10
Publisher’s Note: MDPI stays neutral with regard to jurisdictional claims in published maps and institutional affiliations.

